selection of overburden surface mining method in west ... · selection of overburden surface mining...
TRANSCRIPT
Selection of overburden surface mining method in West Virginiaby analytical hierarchy process
Timothy A. Nolan • Vladislav Kecojevic
Received: 14 March 2013 / Revised: 5 May 2013 / Accepted: 5 May 2013 / Published online: 20 September 2014
� The Author(s) 2014. This article is published with open access at Springerlink.com
Abstract The broad objective of this research was to improve current surface mining practices and reduce negative
environmental impact of overburden removal in West Virginia (WV). The specific objectives were to (i) compare con-
ventional surface mining method (drilling, blasting, digging, and loading) to a surface miner (SM) method, and (ii) apply
the analytical hierarchy process (AHP) to help select the optimal mining method based on production, cost and envi-
ronmental criteria. The design and the procedures used in this research involve five interrelated modules: (i) rock properties
of overburden in WV, (ii) drilling and blasting, (iii) digging and loading, (iv) SM method, and (v) comparative analysis and
selection of the optimal mining method by AHP. Results of this research indicate that application of SM method would
yield higher cost of overburden removal than conventional mining methods in rocks with a high unconfined compressive
strength and abrasivity. A significant advantage of SM method, where applicable, is the elimination of the negative
environmental impacts associated with blasting.
Keywords Surface mining � West Virginia � Overburden � Production rate � Cost � Environmental impact � AHP model
1 Introduction
The current surface mining practices in West Virginia
(WV) consist of conventional mining unit operations
including: drilling, blasting, digging, loading, haulage, and
dumping. Draglines are used in some mines for stripping
and direct dumping of overburden material into excavated
area.
The WV ranks second in the nation for explosives
consumption (Apodaca 2010). Almost 350,000 tonnes were
used in WV surface coal mining in 2009. Considering an
average price of blasting agents (bulk emulsions, slurry and
ANFO) of $1.14 per kg, the surface coal mines in WV
spent almost $400 million for explosives alone. This does
not include additional blasting accessories such as deto-
nators, boosters, detonating cords, lead lines, additional
costs for labor, explosives truck-delivery, and shot ser-
vices. The addition of the drilling, digging and loading
costs for the blasted material amounts to a significant
overall cost to mine operators.
Surface coal mining in WV faces many challenges.
These challenges include more restrictive regulations, a
negative public perception, and difficult geological for-
mations. Current blasting methods, if not properly designed
and conducted, can create hazards like flyrock, toxic fumes,
dust, ground vibration, and surface vibration created by air-
blast. Blasting methods have been refined and are per-
formed in a safer manner but the hazards still remain.
Additionally, acid mine drainage may be generated if the
rock is not properly identified and segregated. Although
these hazards do not occur with every blast, it may only
take a few incidents to tarnish the reputation of the entire
industry. Exploring and applying alternative safe and
environmentally friendly technology provides the potential
to minimize if not eliminate these hazards.
The geologic formations in WV consist of overburden
and multiple layers of interburden with bituminous coal
T. A. Nolan � V. Kecojevic (&)
Department of Mining Engineering, West Virginia University,
Morgantown, WV, USA
e-mail: [email protected]
123
Int J Coal Sci Technol (2014) 1(3):306–314
DOI 10.1007/s40789-014-0019-0

seams of varying thicknesses interspersed between these
layers. Overburden and interburden must be removed
before the coal is extracted. In most WV surface coal mines
several machines are used to dig and load overburden
material. This equipment includes hydraulic and electric
(rope) shovels, front-end wheel loaders, and draglines
(which are used for stripping and dumping into the exca-
vated area). Depending on the thickness of the interburden
layers, various methods are used for its removal. Layers
with a thickness of generally less than 1.5 meter are ripped
by a bulldozer. If the rock is ripped, additional equipment
is required to load the material. If the interburden is too
thick or too hard to rip, drilling and blasting is required to
loosen the rock. The process of ripping or blasting con-
tinues with each interburden layer that is encountered in the
mine.
More stringent governmental regulations and public
pressure are forcing the mining industry to evolve and
minimize its environmental impact. Future coal mining
operations will need to incorporate new design features and
practices that can substantially reduce this impact to
achieve ‘‘low impact’’ mining. These design features and
practices will be necessary to ensure that the coal industry
can design, permit, build, operate, reclaim, and monitor
future mines in full compliance with the increasingly
stringent environmental performance standards. New min-
ing technologies and systems may minimize environmental
disturbances during overburden removal. One of the
machines with a potential application in surface mining in
WV is the surface miner (SM). It is a multi-purpose pro-
duction machine that integrates cutting, crushing, and
loading (Fig. 1). It is applied in numerous coal and quarry
mining operations around the world.
The broad objective of this research was to improve
current surface mining practices and reduce negative
environmental impact of overburden removal in WV. The
specific objectives were to (i) compare conventional sur-
face mining method (drilling, blasting, digging, and load-
ing) to a SM method, and (ii) apply the analytical hierarchy
process (AHP) to help select the optimal mining method
based on production, cost and environmental criteria. The
text that follows provides a description of the methodology
used in this research, results and analysis, and concluding
remarks.
2 Methodology
The design and the procedures used for achieving the
objectives of this research involve five interrelated mod-
ules. Module I includes rock properties of sandstone and
shale, which are the predominant overburden materials in
WV. Module II considers drilling and blasting operations.
Module III covers digging and loading of overburden
Fig. 1 Surface miner (Wirtgen 2010)
Selection of overburden surface mining method 307
123
material and it specifically addresses mining equipment
such as electric and hydraulic shovels, and front-end wheel
loaders. Module IV focuses on the SM, while Module V is
developed to conduct comparative analyses among all
mining unit operations. The entire production and cost
model is developed in MS Excel. The AHP is used to help
select the optimal mining method based on production, cost
and environmental criteria.
The cost and production model for both the conventional
and SM mining methods consider a medium-size surface
coal mine in WV. For this study, the medium-size mine is
defined with a production rate of 7.6 million bank m3 of
overburden to be excavated annually.
Module I contains the descriptions of rock types and
properties within the state of WV. The typical rock units
found in the surface coal mines of WV (generally the
majority of the state excluding the eastern panhandle) are
sandstone and shale (WVGES 2011). Properties such as
bank and loose densities, unconfined compressive strength
(UCS), abrasivity expressed through Cerchar Abrasive
Index (CAI), seismic wave velocity, and swell factor are
compiled from Caterpillar (2010), Hartman (1992); Hart-
man and Mutmansky (2002), Plinninger (2010), and Ru-
snak and Mark (2000)
In Module II, equations developed by Atlas Copco
(2009), Drake (1990), Austin Powder (2002) and Dyno
Nobel (2009) are used to calculate drilling and blasting
parameters. These parameters include hole diameter, pen-
etration rate, overall drilling rate, burden, spacing, sub-
drilling, hole depth, hole length, stemming, particle size for
stemming, hole charge length, hole charge concentration,
total charge per hole, total amount of explosives, volume of
rock per hole, number of required holes, specific drilling,
total required drilling, powder factor, and delay times.
ANFO and emulsions are the most common explosives
agents used in WV surface coal mines, and they are con-
sidered in this study. The total drilling and blasting cost is
determined.
In module III, production rates for hydraulic shovels,
electric (rope) shovels, and front-end wheel loaders are
calculated and ownership and operating cost is determined.
Various sources such as Caterpillar (2010), Komatsu
(2009), Hartman (1992), Kennedy (1990), InfoMine
(2010), Runge (1998) and P&H Mine Pro (2003) are used
to determine the production rates and cost. The total cost
for each machine is expressed in $/m3.
Module IV includes overburden extraction by the SM
method. Production rate is given in t/h, while the total cost
is expressed in $/m3. References given by Wirtgen (2010),
Origliasso (2011) and InfoMine (2010) are used to deter-
mine production rate and cost associated with SM method.
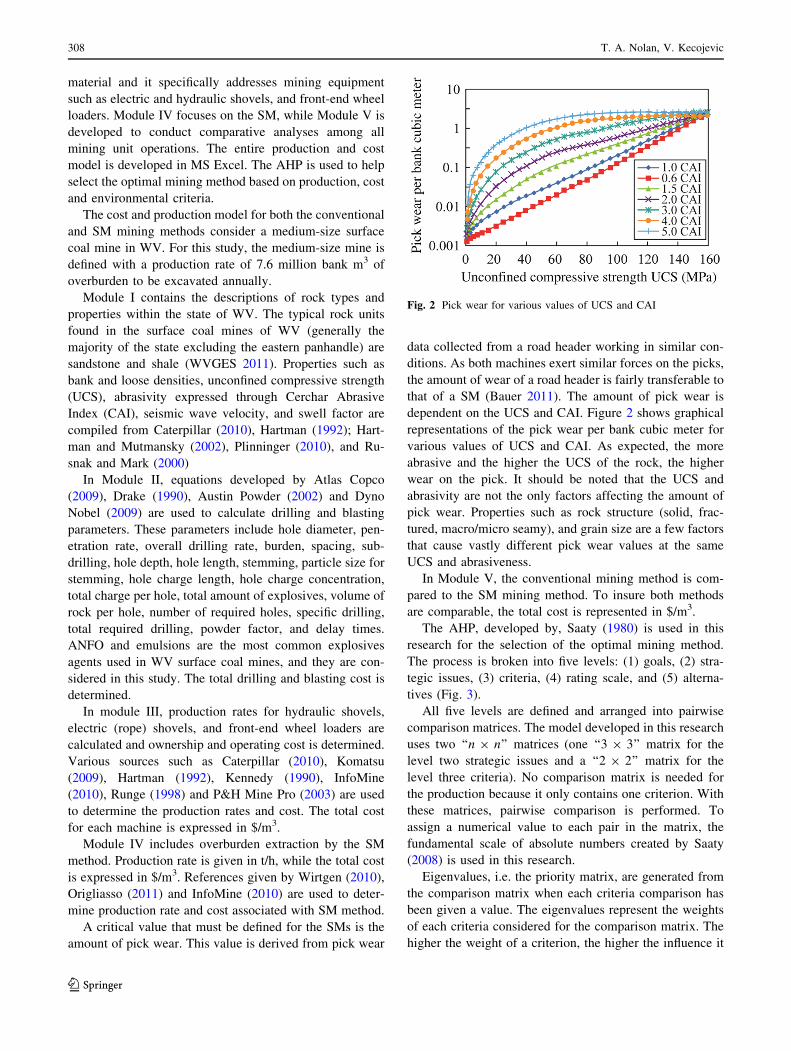
A critical value that must be defined for the SMs is the
amount of pick wear. This value is derived from pick wear
data collected from a road header working in similar con-
ditions. As both machines exert similar forces on the picks,
the amount of wear of a road header is fairly transferable to
that of a SM (Bauer 2011). The amount of pick wear is
dependent on the UCS and CAI. Figure 2 shows graphical
representations of the pick wear per bank cubic meter for
various values of UCS and CAI. As expected, the more
abrasive and the higher the UCS of the rock, the higher
wear on the pick. It should be noted that the UCS and
abrasivity are not the only factors affecting the amount of
pick wear. Properties such as rock structure (solid, frac-
tured, macro/micro seamy), and grain size are a few factors
that cause vastly different pick wear values at the same
UCS and abrasiveness.
In Module V, the conventional mining method is com-
pared to the SM mining method. To insure both methods
are comparable, the total cost is represented in $/m3.
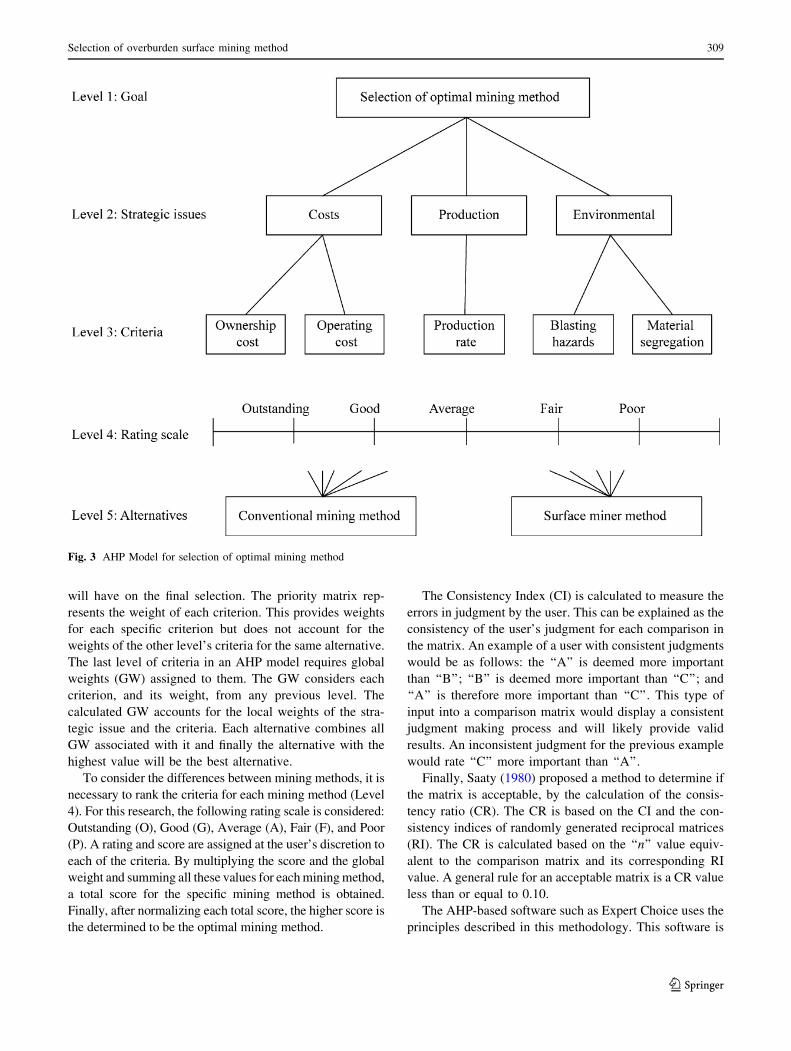
The AHP, developed by, Saaty (1980) is used in this
research for the selection of the optimal mining method.
The process is broken into five levels: (1) goals, (2) stra-
tegic issues, (3) criteria, (4) rating scale, and (5) alterna-
tives (Fig. 3).
All five levels are defined and arranged into pairwise
comparison matrices. The model developed in this research
uses two ‘‘n 9 n’’ matrices (one ‘‘3 9 3’’ matrix for the
level two strategic issues and a ‘‘2 9 2’’ matrix for the
level three criteria). No comparison matrix is needed for
the production because it only contains one criterion. With
these matrices, pairwise comparison is performed. To
assign a numerical value to each pair in the matrix, the
fundamental scale of absolute numbers created by Saaty
(2008) is used in this research.
Eigenvalues, i.e. the priority matrix, are generated from
the comparison matrix when each criteria comparison has
been given a value. The eigenvalues represent the weights
of each criteria considered for the comparison matrix. The
higher the weight of a criterion, the higher the influence it
Fig. 2 Pick wear for various values of UCS and CAI
308 T. A. Nolan, V. Kecojevic
123
will have on the final selection. The priority matrix rep-
resents the weight of each criterion. This provides weights
for each specific criterion but does not account for the
weights of the other level’s criteria for the same alternative.
The last level of criteria in an AHP model requires global
weights (GW) assigned to them. The GW considers each
criterion, and its weight, from any previous level. The
calculated GW accounts for the local weights of the stra-
tegic issue and the criteria. Each alternative combines all
GW associated with it and finally the alternative with the
highest value will be the best alternative.
To consider the differences between mining methods, it is
necessary to rank the criteria for each mining method (Level
4). For this research, the following rating scale is considered:
Outstanding (O), Good (G), Average (A), Fair (F), and Poor
(P). A rating and score are assigned at the user’s discretion to
each of the criteria. By multiplying the score and the global
weight and summing all these values for each mining method,
a total score for the specific mining method is obtained.
Finally, after normalizing each total score, the higher score is
the determined to be the optimal mining method.
The Consistency Index (CI) is calculated to measure the
errors in judgment by the user. This can be explained as the
consistency of the user’s judgment for each comparison in
the matrix. An example of a user with consistent judgments
would be as follows: the ‘‘A’’ is deemed more important
than ‘‘B’’; ‘‘B’’ is deemed more important than ‘‘C’’; and
‘‘A’’ is therefore more important than ‘‘C’’. This type of
input into a comparison matrix would display a consistent
judgment making process and will likely provide valid
results. An inconsistent judgment for the previous example
would rate ‘‘C’’ more important than ‘‘A’’.
Finally, Saaty (1980) proposed a method to determine if
the matrix is acceptable, by the calculation of the consis-
tency ratio (CR). The CR is based on the CI and the con-
sistency indices of randomly generated reciprocal matrices
(RI). The CR is calculated based on the ‘‘n’’ value equiv-
alent to the comparison matrix and its corresponding RI
value. A general rule for an acceptable matrix is a CR value
less than or equal to 0.10.
The AHP-based software such as Expert Choice uses the
principles described in this methodology. This software is
Fig. 3 AHP Model for selection of optimal mining method
Selection of overburden surface mining method 309
123
used in this research in order to select optimal mining
method. As the AHP results are obtained based on user-
defined input values; this approach requires sensitivity
analyses to be performed. For this purpose, the same
software is also used to adjust the criteria priority, while
simultaneously adjusting the remaining criteria relative to
each other.
3 Results and analysis
For this particular study, bank density of sandstone and
shale is considered to be 2,507 and 1,652 kg/m3, respec-
tively, while loose density is 1,760 and 1,240 kg/m3,
respectively. Specific gravity for sandstone and shale is 2.5
and 1.66, respectively, and swell factor is 1.6 and 1.45,
respectively. For the comparison purposes between con-
ventional mining and SM methods, the UCS for sandstone
and shale are selected to be 100 and 75 MPa, respectively.
The CAI for sandstone and shale is determined to be 2 and
1.5, respectively. Values of UCS between 60 and 120 MPa
for sandstone, and 60 and 100 MPa for shale, are used for
various scenarios in determining production rate and cost
for SM method. Values of CAI between 0.6 and 5 for
sandstone and between 0.6 and 4 for shale are used for
various scenarios in determining production rate and cost
for SM method. Seismic wave velocity of sandstone and
shale is considered to be 2,804 and 1,798 m/s, respectively.
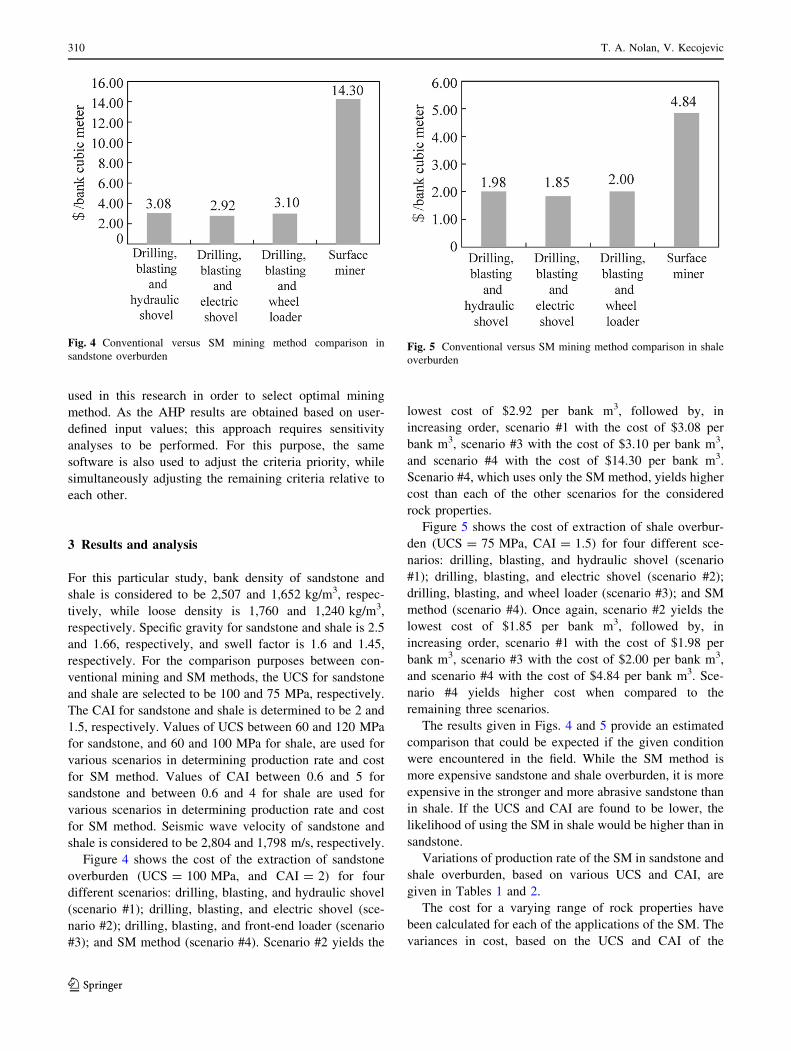
Figure 4 shows the cost of the extraction of sandstone
overburden (UCS = 100 MPa, and CAI = 2) for four
different scenarios: drilling, blasting, and hydraulic shovel
(scenario #1); drilling, blasting, and electric shovel (sce-
nario #2); drilling, blasting, and front-end loader (scenario
#3); and SM method (scenario #4). Scenario #2 yields the
lowest cost of $2.92 per bank m3, followed by, in
increasing order, scenario #1 with the cost of $3.08 per
bank m3, scenario #3 with the cost of $3.10 per bank m3,
and scenario #4 with the cost of $14.30 per bank m3.
Scenario #4, which uses only the SM method, yields higher
cost than each of the other scenarios for the considered
rock properties.
Figure 5 shows the cost of extraction of shale overbur-
den (UCS = 75 MPa, CAI = 1.5) for four different sce-
narios: drilling, blasting, and hydraulic shovel (scenario
#1); drilling, blasting, and electric shovel (scenario #2);
drilling, blasting, and wheel loader (scenario #3); and SM
method (scenario #4). Once again, scenario #2 yields the
lowest cost of $1.85 per bank m3, followed by, in
increasing order, scenario #1 with the cost of $1.98 per
bank m3, scenario #3 with the cost of $2.00 per bank m3,
and scenario #4 with the cost of $4.84 per bank m3. Sce-
nario #4 yields higher cost when compared to the
remaining three scenarios.
The results given in Figs. 4 and 5 provide an estimated
comparison that could be expected if the given condition
were encountered in the field. While the SM method is
more expensive sandstone and shale overburden, it is more
expensive in the stronger and more abrasive sandstone than
in shale. If the UCS and CAI are found to be lower, the
likelihood of using the SM in shale would be higher than in
sandstone.
Variations of production rate of the SM in sandstone and
shale overburden, based on various UCS and CAI, are
given in Tables 1 and 2.
The cost for a varying range of rock properties have
been calculated for each of the applications of the SM. The
variances in cost, based on the UCS and CAI of the
Fig. 4 Conventional versus SM mining method comparison in
sandstone overburdenFig. 5 Conventional versus SM mining method comparison in shale
overburden
310 T. A. Nolan, V. Kecojevic
123
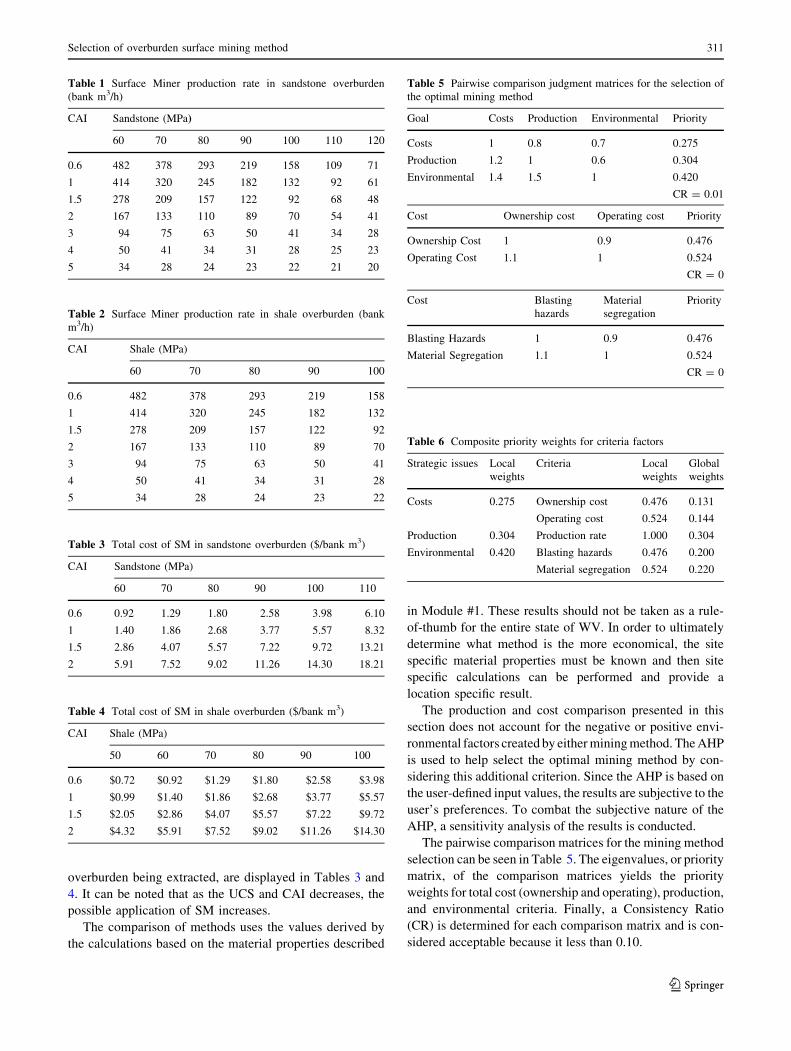
overburden being extracted, are displayed in Tables 3 and
4. It can be noted that as the UCS and CAI decreases, the
possible application of SM increases.
The comparison of methods uses the values derived by
the calculations based on the material properties described
in Module #1. These results should not be taken as a rule-
of-thumb for the entire state of WV. In order to ultimately
determine what method is the more economical, the site
specific material properties must be known and then site
specific calculations can be performed and provide a
location specific result.
The production and cost comparison presented in this
section does not account for the negative or positive envi-
ronmental factors created by either mining method. The AHP
is used to help select the optimal mining method by con-
sidering this additional criterion. Since the AHP is based on
the user-defined input values, the results are subjective to the
user’s preferences. To combat the subjective nature of the
AHP, a sensitivity analysis of the results is conducted.
The pairwise comparison matrices for the mining method
selection can be seen in Table 5. The eigenvalues, or priority
matrix, of the comparison matrices yields the priority
weights for total cost (ownership and operating), production,
and environmental criteria. Finally, a Consistency Ratio
(CR) is determined for each comparison matrix and is con-
sidered acceptable because it less than 0.10.
Table 1 Surface Miner production rate in sandstone overburden
(bank m3/h)
CAI Sandstone (MPa)
60 70 80 90 100 110 120
0.6 482 378 293 219 158 109 71
1 414 320 245 182 132 92 61
1.5 278 209 157 122 92 68 48
2 167 133 110 89 70 54 41
3 94 75 63 50 41 34 28
4 50 41 34 31 28 25 23
5 34 28 24 23 22 21 20
Table 2 Surface Miner production rate in shale overburden (bank
m3/h)
CAI Shale (MPa)
60 70 80 90 100
0.6 482 378 293 219 158
1 414 320 245 182 132
1.5 278 209 157 122 92
2 167 133 110 89 70
3 94 75 63 50 41
4 50 41 34 31 28
5 34 28 24 23 22
Table 3 Total cost of SM in sandstone overburden ($/bank m3)
CAI Sandstone (MPa)
60 70 80 90 100 110
0.6 0.92 1.29 1.80 2.58 3.98 6.10
1 1.40 1.86 2.68 3.77 5.57 8.32
1.5 2.86 4.07 5.57 7.22 9.72 13.21
2 5.91 7.52 9.02 11.26 14.30 18.21
Table 4 Total cost of SM in shale overburden ($/bank m3)
CAI Shale (MPa)
50 60 70 80 90 100
0.6 $0.72 $0.92 $1.29 $1.80 $2.58 $3.98
1 $0.99 $1.40 $1.86 $2.68 $3.77 $5.57
1.5 $2.05 $2.86 $4.07 $5.57 $7.22 $9.72
2 $4.32 $5.91 $7.52 $9.02 $11.26 $14.30
Table 5 Pairwise comparison judgment matrices for the selection of
the optimal mining method
Goal Costs Production Environmental Priority
Costs 1 0.8 0.7 0.275
Production 1.2 1 0.6 0.304
Environmental 1.4 1.5 1 0.420
CR = 0.01
Cost Ownership cost Operating cost Priority
Ownership Cost 1 0.9 0.476
Operating Cost 1.1 1 0.524
CR = 0
Cost Blasting
hazards
Material
segregation
Priority
Blasting Hazards 1 0.9 0.476
Material Segregation 1.1 1 0.524
CR = 0
Table 6 Composite priority weights for criteria factors
Strategic issues Local
weights
Criteria Local
weights
Global
weights
Costs 0.275 Ownership cost 0.476 0.131
Operating cost 0.524 0.144
Production 0.304 Production rate 1.000 0.304
Environmental 0.420 Blasting hazards 0.476 0.200
Material segregation 0.524 0.220
Selection of overburden surface mining method 311
123
The local weights for each strategic issue and criteria are
displayed in Table 6. The environmental issues (Blasting
hazards and material segregation) have the highest weight
due to the level of importance placed on the environmental
issues in the comparison matrices.
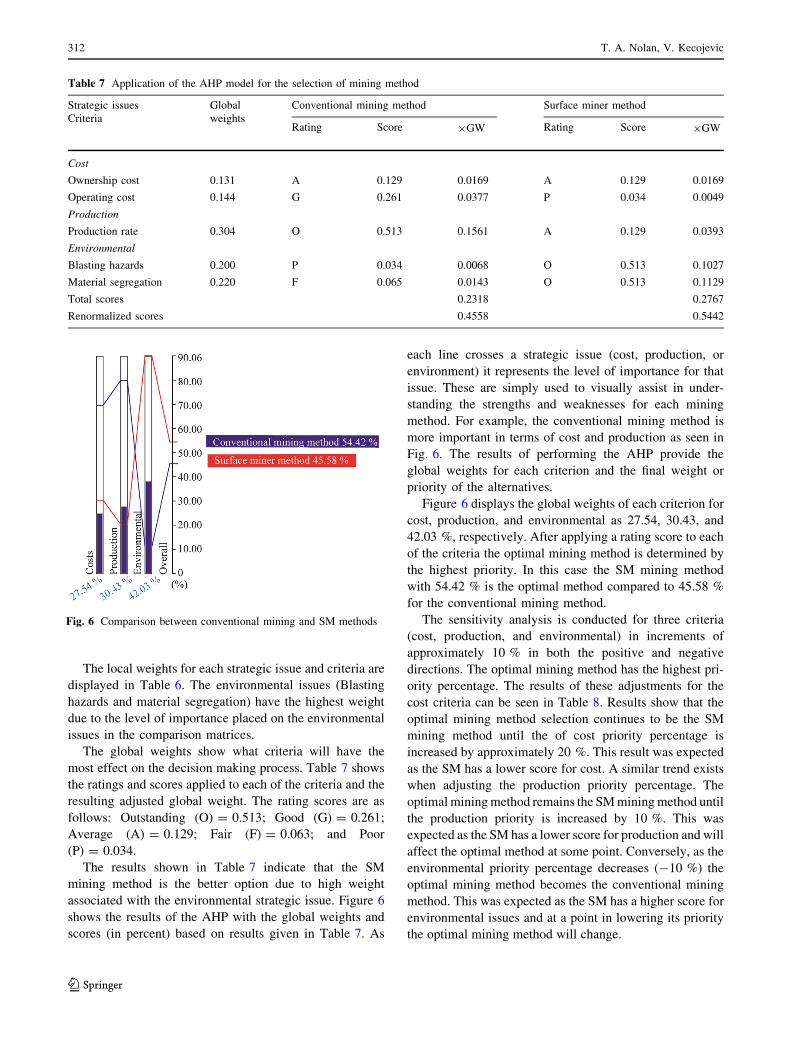
The global weights show what criteria will have the
most effect on the decision making process. Table 7 shows
the ratings and scores applied to each of the criteria and the
resulting adjusted global weight. The rating scores are as
follows: Outstanding (O) = 0.513; Good (G) = 0.261;
Average (A) = 0.129; Fair (F) = 0.063; and Poor
(P) = 0.034.
The results shown in Table 7 indicate that the SM
mining method is the better option due to high weight
associated with the environmental strategic issue. Figure 6
shows the results of the AHP with the global weights and
scores (in percent) based on results given in Table 7. As
each line crosses a strategic issue (cost, production, or
environment) it represents the level of importance for that
issue. These are simply used to visually assist in under-
standing the strengths and weaknesses for each mining
method. For example, the conventional mining method is
more important in terms of cost and production as seen in
Fig. 6. The results of performing the AHP provide the
global weights for each criterion and the final weight or
priority of the alternatives.
Figure 6 displays the global weights of each criterion for
cost, production, and environmental as 27.54, 30.43, and
42.03 %, respectively. After applying a rating score to each
of the criteria the optimal mining method is determined by
the highest priority. In this case the SM mining method
with 54.42 % is the optimal method compared to 45.58 %
for the conventional mining method.
The sensitivity analysis is conducted for three criteria
(cost, production, and environmental) in increments of
approximately 10 % in both the positive and negative
directions. The optimal mining method has the highest pri-
ority percentage. The results of these adjustments for the
cost criteria can be seen in Table 8. Results show that the
optimal mining method selection continues to be the SM
mining method until the of cost priority percentage is
increased by approximately 20 %. This result was expected
as the SM has a lower score for cost. A similar trend exists
when adjusting the production priority percentage. The
optimal mining method remains the SM mining method until
the production priority is increased by 10 %. This was
expected as the SM has a lower score for production and will
affect the optimal method at some point. Conversely, as the
environmental priority percentage decreases (-10 %) the
optimal mining method becomes the conventional mining
method. This was expected as the SM has a higher score for
environmental issues and at a point in lowering its priority
the optimal mining method will change.
Fig. 6 Comparison between conventional mining and SM methods
Table 7 Application of the AHP model for the selection of mining method
Strategic issues
Criteria
Global
weights
Conventional mining method Surface miner method
Rating Score 9GW Rating Score 9GW
Cost
Ownership cost 0.131 A 0.129 0.0169 A 0.129 0.0169
Operating cost 0.144 G 0.261 0.0377 P 0.034 0.0049
Production
Production rate 0.304 O 0.513 0.1561 A 0.129 0.0393
Environmental
Blasting hazards 0.200 P 0.034 0.0068 O 0.513 0.1027
Material segregation 0.220 F 0.065 0.0143 O 0.513 0.1129
Total scores 0.2318 0.2767
Renormalized scores 0.4558 0.5442
312 T. A. Nolan, V. Kecojevic
123

Previous sensitivity analysis does not account for vari-
ations in rating score input values. Since blasting hazards
and material segregation are the highest weighted criteria, a
sensitivity analysis of the rating score was performed on
these criteria. In this sensitivity analysis, the global weights
of the three strategic issues will remain unchanged, while
the influence of the rating scores will vary and impact the
decision accordingly.
Figure 7 shows the SM mining method score for blast-
ing hazards dropping to ‘‘good’’ with all remaining scores
unchanged. Lowering the blasting hazards score for the SM
mining method to ‘‘good’’ will affect the selection enough
to change the optimal mining method to the conventional
mining method with a priority of 50.57 % compared to
49.43 % for the SM mining method.
Finally, Fig. 8 shows the conventional mining method
rising to ‘‘fair’’ and the SM mining method dropping to
‘‘good’’ with all remaining scores unchanged. Lowering the
blasting hazard and material segregation score for the SM
mining method to ‘‘good’’ and raising the conventional to
‘‘fair’’ will affect the selection to the conventional mining
method with a priority of 51.48 % compared to 48.52 %
for the SM mining method.
The results of the sensitivity analysis for the blasting
hazards and material segregation score are to be expected
as they are the only rating were the SM mining method is
superior. By performing these sensitivity analyses, it can be
seen how dependent the selection of the optimal mining
method is on environmental factors. The combination of
the results produced by the cost and production analysis
and the application of the AHP, allows for an informed
decision on the optimal mining method to be made.
A benefit of introducing SMs to surface coal mining in
WV would be an environmental one. If the conditions are
favorable and the SM can be applied, most of the blasting
processes that concern communities can potentially be
eliminated. Specifically, SM usage can eliminate the gen-
eration of flyrock, toxic fumes, dust, ground vibration, and
surface vibration created by air-blast. While these issues are
not so frequent in blasting, the possibility still exists and this
is an opportunity to address these environmental issues.
The application of SMs also enables clean cut edges and
benches and very stable benched highwalls as opposed to
blasted edges. The crushing process provided directly by
Fig. 7 Sensitivity analysis (SM blasting rating: Good) Fig. 8 Sensitivity analysis (conventional blasting and material seg-
regation rating: fair, SM blasting rating: Good)
Table 8 Sensitivity analysis on final criteria (%)
Sensitivity analysis Cost Production Environment
-10 % 0 ±10 % ±20 % -10 % 0 ±10 % -10 % 0 ±10 %
Cost 17.44 27.54 37.48 47.50 31.51 27.54 23.58 32.26 27.54 22.74
Production 34.67 30.43 26.26 22.05 20.41 30.43 40.45 35.64 30.43 25.13
Environment 47.88 42.03 36.26 30.45 48.08 42.03 35.98 32.10 42.03 52.13
Surface miner method 56.12 54.42 52.52 50.33 60.87 54.67 48.43 47.47 54.67 61.21
Conventional mining method 43.88 45.58 47.48 49.67 39.13 45.33 51.57 52.53 45.33 38.79
Selection of overburden surface mining method 313
123
the machine generates an even grade 96 % \15 cm of
small particle sizes that can either be sold as secondary
product (such as road base) or the material could also be
used without further treatment for the reclamation process.
The elevated grade control by SM eliminates the need of at
least the secondary crusher and possibly even (depending
on the material) the need for a primary crusher. The SM
creates a complete even and smooth surface, which leads to
reduced damage to vehicles and tires. The mine operator
has continuous control over drainage because the SM is
able to cut a slope.
Some of the limitations in this research include the lack
of data from a specific mine in WV, absence of the haulage
considerations (specifically haul trucks) in the model; and
the absence of dragline consideration as a digging and
disposal mining unit. These three limitations should be
included and addressed in future research.
4 Conclusions
Based on the results of the study it can be concluded that
the application of the SM would benefit overburden
removal from the environmental point of view. The
downside of using the SM in surface mining operations
begins with the limited quantity of the overburden material
being extracted and higher operating cost than conven-
tional mining methods. An application problem arises with
higher values of unconfined compressive strength and
abrasivity of overburden material. Picks on the cutting
drum will wear out faster and require more changes. At a
certain point this method becomes unfeasible due to the
slower advance rate and cost involved in a high amount of
pick changes. New pick changing tools have accelerated
this process, but it still remains one of the main factors of
the operating cost.
To confirm the results of this research, it is necessary to
test a SM in one of the existing surface coal mines in WV.
Data collected from the testing should be focused on the
engine load factor, the amount of pick wear, cutting depth,
and cutting velocity in sandstone and shale overburden and
interburden. This would greatly help determine the fuel
consumption and maintenance costs involved with the SM.
The formulas used for calculation of pick wear would be
confirmed or determined to need revision given the data
generated from an experimental trial in a material with the
known properties.
Acknowledgments The research work in this paper is financially
supported by the West Virginia Coal and Energy Research Bureau
(CERB). Their contribution is gratefully acknowledged.
Open Access This article is distributed under the terms of the
Creative Commons Attribution License which permits any use, dis-
tribution, and reproduction in any medium, provided the original
author(s) and the source are credited.
References
Apodaca L (2010) Explosives. In: 2009 Minerals yearbook, United
States Geological Survey. U.S. Department of the Interior,
Washington, DC
Atlas Copco (2009) Blasthole drilling in open pit mining, 1st edn.
Atlas Copco Drilling Solutions LLC, Garland
Austin Powder (2002) Blaster’s guide: a resource for the explosives
and blasting industry. Austin Powder Company, Inc., Cleveland
Bauer R (2011) Pick wear of a road header. Internal Documentation
by Wirtgen, Windhagen
Caterpillar (2010) Caterpillar performance handbook, 40th edn.
Caterpillar, Inc., Peoria
Drake R (1990) Bench drilling techniques and equipment selection
manual, 1st edn. Ingersoll-Rand, Roanoke, p 85
Hartman HL (ed) (1992) SME mining engineering handbook, 2nd
edn. Society for Mining, Metallurgy, and Explorations Inc.
Littleton, p 2260
Hartman HL, Mutmansky J (2002) Introductory mining engineering,
2nd edn. Wiley, Hoboken, p 570
InfoMine (2010) Mine and mill equipment costs. InfoMine USA Inc,
Spokane Valley, pp SU-2–SU-43
Kennedy BA (ed) (1990) Surface mining. Society for Mining,
Metallurgy, and Exploration, Littleton, p 1194
Komatsu (2009) Specifications and application handbook, 30th edn.
Komatsu America Corp., Peoria
Nobel Dyno (2009) Explosives engineers’ guide. Dyno Nobel, Salt
Lake City
Origliasso C (2011) Surface miners: design features and new
approaches for performance prediction and costs calculation.
Politechnico Di Torino, Tesi di laurea magistrale, Ingegneria per
I’Ambiente e il Territorio, p 87
Plinninger R (2010) Hardrock abrasivity investigation using the rock
abrasivity index (RAI). Taylor & Francis Group, London,
pp 3445–3452
P&H Mine Pro (2003) Peak performance practices: excavator
selection. Harnischfeger Corporation, Milwaukee
Runge I (1998) Mining economics and strategy. Society for Mining,
Metallurgy, and Exploration, Littleton
Rusnak J, Mark C (2000) Using the point load test to determine the
uniaxial compressive strength of coal measure rock, Peabody
Group, NOISH. In: Proceedings of the 19th international
conference on ground countrol in mining. West Virginia
University, Morgantown, pp 362–371
Saaty T (1980) The analytic hierarchy process: planning, priority
setting, resource allocation. McGraw-Hill International Book
Co, New York, p 287
Saaty T (2008) Decision Making with the analytical hierarchy
process. Katz Graduate School of Business, University of
Pittsburgh, PA. International Journal Services Science.
1(1):83–98
Wirtgen (2010) Wirtgen surface mining manual. Wirtgen Group,
Windhagen, p 172
WVGES (2011) Geologic map of West Virginia. Mont Chateau
Research Center, West Virginia Geological and Economical
Survey, Morgantown
314 T. A. Nolan, V. Kecojevic
123