self-esteem and academic performance of 4th graders in two
TRANSCRIPT

Asian Journal of Business Management 4(1): 36-57, 2012ISSN: 2041-8752© Maxwell Scientific Organization, 2012Submitted: July 22, 2011 Accepted: October 07, 2011 Published: February 20, 2012
Corresponding Author: P.A. Bourne, Socio-Medical Research Institute Formerly, Department of Community Health andPsychiatry, the University of the West Indies, Mona
36
Self-Esteem and Academic Performance of 4th Graders in two Elementary Schools in Kingston and St. Andrew, Jamaica
1L.K. Colquhoun and 2P.A. Bourne1Jamaica Constabulary Force (JCF)
2Socio-Medical Research Institute Formerly, Department of Community Health and Psychiatry,The University of the West Indies, Mona
Abstract: In 2005, 62% of pupils who sat the 4th grade literacy and numeracy examination attained mastery,which increased to 67% in 2009 from 50% in 2001. No study has examined the role of self-esteem on theacademic performance of Jamaican 4th graders. The main objectives were, 1) evaluate the influence of self-esteem on academic performance, 2) determine factors that account for changes in self-esteem, and 3) examinefactors of academic performance. The sample for this research was one hundred and twenty (120) respondents.Multiple repression techniques were conducted to identify variables explaining performance, with self-esteembeing among the variables. A p-value #0.10 was used to indicate statistical significance. There is a positivecorrelation between self-esteem and academic performance (rs = 0.611, P<0.0001). Four variables emerged asstatistical significant factors of self-esteem-academic performance, age of respondents, gender and parentalbehaviour, which explain 64.4% of the variability in self-esteem. Boys had a lower self-esteem (b = -3.911)than their female counterparts. Self-esteem is the most influential factor that account for academic performance.Of the nine variables used, four emerged as explaining academic performance, which explained 73.6% of thevariability in academic performance. The emerging findings and knowledge gleaned from this work presenta critical guide and a framework for policy practitioners to implement measure that can effectively address lowperformance among 4th graders.
Key words: Academic performance, Jamaica, parental involvement, preparatory school, primary school, self-esteem, teachers’ behavior
INTRODUCTION
For some time now, there is a public discourse thatsomething is fundamentally amiss with the educationalsystem in Jamaica. The justifications for such a discussionis based on the low performance of students on theCaribbean Examination Council’s examinations (CXC),Grade Six Achievement Test (G-SAT - formerly CommonEntrance Examination), Advanced Level Examinations,literacy and numeracy rate of the populace and thenumber of students who are literate on leaving secondaryschools. Statistics revealed that between 2000-2009, lessthan 40% of Jamaicans annually have failed CXCmathematics (Planning Institute of Jamaica, 2000-2011).On disaggregating the CXC mathematics results, there isa clear disparity between the passes of those students intraditional compared with those in non-traditional(currently upgraded high) schools. Pupils who attendednon-traditional high schools performed poorly comparedto their traditional high school counterparts (PlanningInstitute of Jamaica, 2000-2010). In 2007, a studyconducted by Powell and colleagues, using a probability
sample of one thousand, three hundred and thirty eight(1,338) Jamaicans, found that school and education waslisted among the top three national problems in thecountry (Powell et al., 2007). The problems in theeducational system, therefore, have surpassed corruption,poverty, cost of living, health care and governance,indicating people’s dissatisfactions with the performance(or lack) among students who attend schools.
(Abbot 1993 in Bourne, 2004) posited that Jamaicais one of the countries in the Third World and the WesternHemisphere with the highest failure rate in the Principlesof Accounts Examination at the General Certificate ofEducation Advanced Level. It may seem surprising thatthe performance of our students is that low; but the failurerate for mathematics and English language is even lowerthan for accounts (Cambridge University, 1991-2004;Statistical Institute of Jamaica, 1989-2000). In 1991,statistics revealed that 65.0% of Jamaicans have at mostprimary level education, with 94.5% having at mostsecondary level education (Statistical Institute of Jamaica,1999). In 2001, 70% of children in primary and all-ageschools were literate, (Statistical Institute of Jamaica,

Asian J. Bus. Manage., 4(1): 36-57, 2012
37
2002) and in 2007 at most primary level education was32.9% and 81.6% with at most secondary (Boxill et al.,2007).
Even before sitting CXC or CAPE examination orattending post-secondary education, the low performanceof Jamaicans pupils at the primary level warranted amodification of the curriculum. It was poor performanceof primary (including preparatory) schools students thatsaw the introduction of the grade four (4) literacyexamination and a modification of the Common EntranceExamination [currently Achievement Test (G-SAT)] thatwas used to place students in the academic orientedsecondary educational institutions (or traditional highschools). In 2005, 62% of pupils who sat the 4th gradeliteracy and numeracy examination attained mastery,which increased to 67% in 2009 from 50% in 2001(Roxborough-Wright, 2002; Ministry of Education, 2009).On disaggregating the results by typology of schools(primary and preparatory), it was revealed thatpreparatory schools’ students had a level degree ofmastery (71%) compared to primary schools’ pupils(67%) (Ministry of Education, 2009). The percent ofstudents receiving mastery at one public school (St.Michael Primary) was as low as 31% (Ministry ofEducation, 2009), indicating that the Jamaicaneducational system has failed the pupils.
The contemporary educational system in Jamaica wasframed from the British system. The grammar schools(traditional high schools) were established to train pupilsfor further studies as well as supply ‘high quality’ labourto the productive sectors. Statistics showed that less than15% of the population has had post-secondary leveleducation and the majority has had at most secondarylevel training (Statistical Institute of Jamaica, 1999),which means that the problems which emerged in theprimary level continued and reflected in the low post-secondary attainment.
According to Bourne (2004): In Western civilization,examinations have been used as the method of assessingpeoples’ aptitude and abilities. That social reality meansthat there is skewness towards examination results inquantifying academic performance. Within this construct,the yardstick for evaluating an individual’s knowledgereservoir, skills level and competence in performing aparticular task is normally an examination. As such, foran individual to be considered an authority within anyfield, s/he is expected to have successfully sat variousexamination(s). Consequently, the formal education is themetre used for assessing future social development, andthis plays a determining role in even success. Hence, thiscriterion, according to many stakeholders, in judgingcompetence is crucial evidence that is used to evaluate
learned skills, knowledge, expertise and standards towhich teachers are assessed and must apply within theclassroom. As such, this determines to a larger degree thataptitude, which would be a classroom phenomenon(Bourne, 2004).
Bourne’s perspective highlights the emphasis that isplaced on examination in evaluating the performance ofstudents (from basic or pre-school to university).Empirical evidence has established an associationbetween self-esteem and academic achievement (Auer,1992; Benham, 1993; Klein and Keller, 1990; Solley andStagner, 1956). It can be deduced from theaforementioned works that failure on examinations furtherdeteriorate the self-esteem of young children, particularlythose who had low esteem in the first place. Stipek (1984)posited that children enter school expecting to besuccessful and feeling good about themselves, and theyare not concerned about achievement outcomes. Thesocialization of children places emphasis on performance,which denotes that over time they will be cognizant oftheir social role and grades will be become a part of thefocus.
With the continuous measurement of performance,particular academic, pupils with low self-esteem could bedestroyed long before reaching secondary level education.The manner in which children are given feedback on theirperformance during the development, their cognitivedevelopment would be the difference between futurefailure and excellence, particularly of the socialbackground and transferred self-esteem. Importantly,children will come to accept the emphasis of externalvaluation for achievement that is common in the schoolsystem (Stipek, 1984). It can be deduced from Stipek’swork that both academic performance and interpersonalrelationship are influenced by self-esteem over the coverof daily interactions.
With studies establishing that self-esteem influencesacademic performance (Auer, 1992; Benham, 1993; Kleinand Keller, 1990; Solley and Stagner, 1956), does self-esteem offer an explanation for the low academicperformance of 4th graders in Jamaica? Self-esteem isfocused on feelings of personal worth and the level ofsatisfaction regarding one’s self, suggesting that self-esteem is shaped by self-concept. Self-concept is thetotality of a complex, organized and dynamic system oflearned beliefs, attitudes and opinions that each personholds to be true about his/her personal existence (Purkey,1988). This concept of self impacts the academicperformance of students (Purkey, 1970). Self-concept andself-esteem of children are framed by parental upbringing,which offers some explanation for academic performance.
There exists great deal of research that concluded thatfamily support is a major influence of self-esteem. One

Asian J. Bus. Manage., 4(1): 36-57, 2012
38
study analysed group data of the family structure, functionand support of nine hundred and thirteen (913) mothersand their one (1) year old children (Yabiku et al., 1999).Parenting (including guardianship) plays an integral partin the development of self-esteem in children, latersuccess on examinations, life and general well being. Onescholar provided a particularly compelling view of self-esteem that offers justification for quality of life,performance on examination and life satisfaction(including happiness). According to Brandon (1994) self-esteem has two interrelated aspects, self-efficacy and self-respect. Self-efficacy relates to the sense of personalefficacy or confidence in one’s ability to think and act.Self-respect speaks to an affirmative attitude towardsone’s right to live and to be happy. In a succinct manner,self-esteem is the disposition to experience oneself ascomponent to cope with challenges of life and to bedeserving of happiness. Most people’s feelings andthoughts about themselves fluctuate based of their dailyexperiences. This encapsulates examination scores, socialinteraction (including romantic relationship) and generalquality of life. Brandon opined that people with poorbasic self-esteem that the “ups and downs” in life maymake all the difference in the world (Brandon, 1994).
An extensive search of the literature found noresearch that has examined self-esteem and academicperformance of 4th graders in Jamaica. The current workwill fill the gap in the literature. The objectives of thepresent work are:
C Academic performance is determined by particulardemographic characteristics and self-esteem amongsome 4th graders in two Corporate Area primary andpreparatory schools in Jamaica
C Self-esteem is influenced by social and psychologicalfactors as well as academic performance among some4th graders in two Corporate Area primary andpreparatory schools in Jamaica.
CONCEPTUAL FRAMEWORK
Self esteem has long been considered an essentialcomponent of good health. It is a widely used conceptboth in popular language and psychology. Self esteem isa set of attitudes and beliefs that a person brings withhimself/herself to the world. It includes beliefs as towhether he or she can expect success or failure. Howmuch effort should be put forth into activities, whetherfailure at a task will “hurt” or “benefit” the individual andwhether he or she will become more capable as a result ofdifficult experiences to cope in life is embedded in one’sself-esteem (Brandon, 1994; Coppersmith, 1981). One ofthe areas in self-esteem research is the relationshipbetween self esteem and academic achievement (Purkey,
1970). Simply put, the low (or high) can be attributed tothe role of self-esteem. A group of academic researchersexamining self-esteem found that it interfaces withmortality salience. They opined that:
Self-esteem confers resilience against thepsychological threat of death, and therefore thefindings provided direct support for a fundamentaltenet of terror management theory regarding theanxiety-buffering role of self-esteem (Schmeichelet al., 2009; 1077)
Schmeichel and colleagues’ work emphasized therole of self-esteem in life, life survival and holds the keyin understanding how cognitive development can beenhanced or harmed by self-esteem, which is ajustification for the performance. According toBaumeister et al. (2003), self-esteem is stronglyassociated with happiness, confidence, and a moderaterelationship with academic performance. They also found,that individuals with high self-esteem are likely to dobetter on the jobs and with particular tasks (workperformance) than those with low self-esteem (Baumeisteret al., 2003, 36; Campbell and Fehr, 1990; Brockner,1983; Tharenou, 1979). Other studies have disagreed withthe correlation between self-esteem and performance(Wallace and Baumeister, 2002). In fact, Wallace andBaumeister (2002), using arithmetic problem with varyingdegree of challenges, found that the students’ self-esteemdid not affect their performance which had already beenestablished on a test of nonverbal intelligence (Baumeisteret al., 1993). However, other empirical studies haveestablished a statistical correlation between self-esteemand academic performance (Wylie, 1979; Hansford andHattie, 1982; Simon and Simon, 1975). Other studies havefound statistical correlation between self-esteem andacademic performance; but, they noted that this was weak(Davies and Brember, 1999; Kugle et al., 1983).Howerton et al. (1994), when further as they found thatself-esteem can predict grades and school achievement.Clearly there are different sides to the discourse on self-esteem and performance (including academicachievement). Self-esteem seems to hold someexplanation for academic performance, which means thatit is worth exploring in details.
Theories on self esteem: The most broad and frequentcited definition of self esteem within psychology isRosenberg’s (1965), who described it as a favourable orunfavourable attitude towards the self. Self esteem isgenerally considered the evaluative component of selfconcept, a broader representation of the self that includescognitive behavioural aspects as well as evaluative oreffective ones (Blascovich and Tomaka, 1991). Wilson(2002) suggested that basic self esteem is a standard bywhich a person judges her/himself, an estimate, a feeling,and an emotion. This self evaluation is the single most

Asian J. Bus. Manage., 4(1): 36-57, 2012
39
significant key to behaviour, which affects the thinkingprocesses, emotions, desires, values, and goals. Brandon(1994) stated that to understand a person psychologically,it is vital to understand the nature a degree of self esteem.His definition is a synthesis of earlier interpretations.Brandon (1994) noted that there are two strands of selfesteem that is competence and worthiness, butemphasized that the relationship between the two strandsas another factor in understanding self esteem. Hereiterated that self esteem “is the conviction that one iscompetent to live and worthy of living” (Brandon, 1994).He further posited that to understand a personpsychologically, it is vital to understand the nature anddegree of self-esteem as his definition is a synthesis ofearlier interpretations. Brandon (1994) suggested that TheSix Pillars of Self Esteem, which formed the foundation ofself esteem are: 1) the practice of living consciously; 2)the practice of self acceptance; 3) the practice of selfresponsibility; 4) the practice of self assertiveness; 5) thepractice of living purposefully, and 6) the practice ofpersonal integrity.
The literature on self esteem promotes the outlook ofself esteem as a construct that explains a person’s abilityto adapt to the environment. The inner balance andstability which each person achieve is directly related totheir emotions, social relationships, and behaviours(Blascovich & Tomaka, 1991; Brandon, 1969; Rosenberg,1979).
James (1983) in his Principle of Psychology definedself esteem as being the sum of an individual’s successesdivided by what they think they ought to achieve. Selfesteem can be increased by achieving greater successesand maintained by avoiding failures. Raised self esteemcan be argued, also be achieved and maintained byadopting less ambitious goals. Self esteem was thereforedefined as being competence- oriented but also opens tochange. Alexander (2001), the founder of the Self EsteemNetwork in Britain, viewed self esteem as a syndrome,and as a set of indictors for well-being. The core of selfesteem is an “unconditional appreciation of oneself”meaning an appreciation of both an individual’s positiveand negative potential in its fullest sense. Alexander alsodistinguished between ‘trait’ self esteem which reflectsconfidence or ability in a particular area, such as work orport, and ‘global’ self esteem which is intrinsic worthinessregardless of what particular abilities or qualities anindividual may possess.
Coppersmith (1981) in his study on the antecedent ofself-esteem, suggested four major factors which areimportant in the development of self esteem:
C The treatment and acceptance received fromsignificant others in life
C A person past successC The value and aspiration which modifies and
interpret a person’s experiencesC How a person responds to devaluation
Self esteem is described by Coppersmith (1981) as aprocess of integration, where the individual becomes amember of the group and internalizes ideas and attitudesas a mirror image, via key figures and by observingactions and attitudes. Self esteem is a form of selfprotection since any loss of self esteem brings a feeling ofdistress. Since the presence of anxiety can minimize ourself esteem, defenses allows the maintenance of anidealized image. This philosophy is supported by Diaz(1984) who posited that the events and the people whichsurrounds the individual have a direct relationship withthe development of self esteem.
Additionally, recent research has examined theconcept of protective factors in a wide range of adolescentrisk behaviour and, increasingly, to understandadolescent’s behaviour. One such protective factor is selfesteem which refers to the positive or negative regard inwhich an individual holds him or herself. There iswidespread recognition of self esteem’s importance forresilience and personal well being in a variety of diversecontexts (Gecas and Seff, 1990; Rosenberg, 1979). Selfesteem is important for personal well being because itmotivates behaviour. Rosenberg (1979) suggested that themotivation to achieve and maintain self esteem is the mostpowerful in the entire human repertoire and motives. Evenindividuals with low self esteem are motivated tomaintain that level of self worth and not feel any lessworthy.
Although many scholars who study self esteememphasized that low self esteem impairs effectivedecision-making (Tice, 1993), recent reviews andcommentaries (Baumeister, 1996; Gecas and Seff, 1990)stressed that self esteem cannot be considered a panaceathat protects youth from all manner of risk. (Baumeister,1996) proposed that high self esteem is more a result thana cause of success behaviour. Similarly, Gecas and Seff(1990) suggested that self esteem must be combined withother positive characteristics for it to have salutary effects.Notwithstanding, Pearlin et al. (1981) postulated thatdimension of self concept, such as self esteem arepsychological resources upon which a person can draw todeal with problems.
Self Esteem and academic achievement: Therelationship between self-esteem and academicperformance has been well documented in the literature.Different studies have reached the conclusion that selfesteem and academics are positively correlated (Bankstonand Zhou, 2002; Lockett and Harrell, 2003). Similarly,Wylie (1979) found a positive correlation between selfesteem and academic performance (rs = 0.30) as studentswith greater self-esteem had higher grade point average.Another study, conducted by Carr et al. (1991) found self-esteem to be a significant predictor of reading awarenessas pupils with higher self-esteem were more able to readand reading ready compared to those with lower self-esteem. They had used pre-and-post test, and found

Asian J. Bus. Manage., 4(1): 36-57, 2012
40
greater score among those with higher self-esteem. LikeCar and colleagues, Kugle et al. (1983) had found earlier,that direct relationship between reading achievement andself-esteem (rs = 0.18). However, when they controlled forethnicity, the association between self-esteem and readingachievement disappeared.
From a standard achievement test, using 3,001 Britishpupils, Davies and Brember (1999) found a weak positivecorrelation between self-esteem and better academicperformance, indicating that positive self-esteem is goodfor academic performance. Even before Davies andBrember’s work, Simon and Simon (1975) had found apositive correlation on IQ test and self-esteem (rs = 0.33),which means that feeling good about one’s self will meana greater score on an IQ test. Purkey (1970) found thatself esteem is positively related to some components ofsuccess, academic or verbal performance. Like otherstudies, Purkey work showed that a positive concept ofself is highly likely to directly influence better scores onparticular test. He concluded that there is a continuousinteraction between self esteem and academicachievement, as the pupil thinking better ofhimself/herself transfer this positive self-image intochallenging issues and difficult things can be tackled withmore ease. Hence, the desire to succeed is greater and thewillingness to confront challenges is transferred toproblem-solving and reading. Covington (1989) reportedthat as the level of self esteem increases, so does the levelof academic achievement scores but as the level of selfesteem decreases, achievement declines. He concludedthat self esteem can be modified through directinstructions which can lead to achievement gains.
However, there has been conflicting reports showingpositive and negative relationship between self esteemand academic performance. Van Tuinen and Ramanaiah(1979) researched the prediction of academic performanceof specific and global self esteem in undergraduatestudents. He reported that specific self esteem was asignificant predictor of actual performance on conceptattainment tasks, whereas global self esteem was not anadequate predictor. Yogev and Ilan (1987) produced aconflicting report that self esteem was generally notrelated to educational aspirations, but the relationship wasimportant to some student’s feeling competence. Thedifferences in the reports can be attributed to differencesin the conceptions and definitions of: general and specificself concept, self concept and self esteem. However, otherstudies supported the relationship between high selfesteem and academic achievement in school age children(Purkey, 1970).
There are many critiques to the “self esteemperspective” in the academic field. Some argued thatwhen self esteem is pursued in the context of makingstudents feel good about themselves, this misconceptioncan lead to indiscriminate praise and the assumption thatone should protect his or her student from failure(Baumeister, 1996; Learner, 1996). These theoristssuggested that students who feel good and are satisfied
with their work do not necessarily achieve or develophabits that lead to success. These criticisms are justified.There is little evidence that students who areindiscriminately praised and protected from failure do infact develop genuine self esteem
In fact, others argued that there is a distinctionbetween genuine self esteem versus narcissism or self –aggrandizement. Katz (1993) suggested that there is aclear difference between the two as genuine self esteemhas little to do with the feelings reported by students. Infact, feelings have unconscious self beliefs, formed overa life time, reflecting our perceptions of our abilities, ourlovability, and how we attribute causality for the events inour lives. These unconscious self –perception have beenmolded, often deeply, into our being and therefore canonly be altered by significant and repeated newexperiences that reconditions our hearts and minds.
Self esteem development in children: Cooley (1902)contributed the theory of the "looking glass self," whichstates that people see themselves through the eyes ofothers. Interestingly, Rosenberg (1965) posited that asearly as age five (5) or six (6) years old children roleplaying abilities are sufficiently developed to enable themto consider the perceived judgments and reaction ofothers. However, they are unable to make sophisticatedsocial comparisons or reflected appraisals at least untilage seven (7) or eight (8). What matters most to childrenis that they feel they matter to their parent, that is they feelthat they are of value to their parents, and that they thinktheir parents care about what happens to them. Rosenberg(1965) also found that students who believed that theirparents lacked interest in them had much lower levels ofself esteem. He stated further that when children enterschool, the self portrait consists of a social exterior andtheir judgment of themselves in seven dimensions:Physical appearance, physical abilities, peer relation,parent’s relation, reading, math, and school subjects.There is also some evidence that by 4th grade that theyhave a perception of their character, their personalresponsibilities, as well as the other dimensions.
Low self-esteem youngsters are three times as likelyas those with high self-esteem to report average or belowaverage expectations of being successful at their adultwork. They are more apt to express negative attitudestowards school and their classmates. Adolescents tend tobe highly introspective and self-conscious. Their thoughtsoften center on their fears, desires, beliefs, attitudes, andexpectations. Their feelings about self vary considerably.Rosenberg (1965) further stated that in one extensivestudy 60% percent of adolescents had feelings that wereunpredictable; 29% had stable self-feelings, and 11%were unstable or oscillating. Most had positive feelings insome situations and negative feelings in others. By theend of 8th grade more that one-third had consistently highglobal self-esteem. Thirty-one percent experiencedreasonably high self-esteem and a modest gain in feelingsof self-worth over the past two (2) years. One-fifth (12%)

Asian J. Bus. Manage., 4(1): 36-57, 2012
41
reported a decline in self-esteem after entering JuniorHigh School and 13% had low self-esteem throughoutMiddle School. Those with declining self-esteem hadmore psychological symptoms, fluctuating academicrecords, diminished peer support and increaseddepression. Findings showed that young people gainedgreater stability in self-feeling, fewer disruptions, andmilder fluctuations as they leave adolescence.
Scarr and Thompson (1994) proposed that children’sacademic and social competence can be predicted mainlyby their family background, it may be anticipated thatparents’ psychological support in children’s educationalexpectancy would be the most influential among all othersources of support. However, early adolescents’ relationwith peers provides them with experiences unique inshaping their personalities and beliefs. The timeadolescents spend with peers is only rivaled by theirparents (Hartup, 1983). Moreover, some researchers havesuggested that the teacher is unlikely to be moreinfluential than other facilitators of change (Hattie, 1992)because in the school setting, the teacher is the mostsalient source of feedback for a student’s academicproficiency. In fact, it contends further, that the teacher isthe most powerful source of reinforcement in theformation of academic self esteem and development ofacademic behaviour. Therefore from the literature of selfconcept and person-environment, both personalexpectancy in educational achievement and perceivedsupport from significant others would have significantpositive impact on self esteem, interest in schoolwork andoverall academic performance.
Teacher’s impact on students’ via self esteem onacademic achievement: In study done by Simon andSimon (1975), they discovered that children’s self esteemexperienced a self- fulfilling prophecy related to poorperformance. This they said occurred when a child’sparents and/ or teacher developed a negative view of thechild over time. This view was supported by Berk (2003)who concluded that the child will personally adopt thatview for him or herself and perform accordingly.Similarly, Rosenthal and Jacobson (1966) demonstratedthat the teacher’s expectancies significantly affectstudents’ performance and gains in IQ scores. Moreover,a large scale study composed of one thousand, fivehundred and thirty- nine (1,539) children demonstratedthat teacher’s underestimation of students’ academicachievement potential significantly predicted futureachievements. (Madon et al., 1997)
Similarly, Marchesi and Martin (2002) postulated thatthe key element for the pupil’s personal and academicdevelopment is the value given from teacher to pupil andvice versa are usually reciprocal, highlighting additionallythe personal relationship. These same authors found thatthe teacher’s expectations have significantly influencedstudent’s results. For them, the teachers’ assessment ismediated by two variables: 1) the student’s intelligence,that is, the greater the intelligence, the better the academic
results and the better the reciprocal appreciation betweenteacher and student, and 2) family support for study alsomakes the student value his teacher highly (Castejon andPerez, 1998). Other studies found positive relationshipsbetween the teacher’s motivation and that of the student(Atkinson, 2000). Teacher- pupil relations are alsomediated by the teacher’s attribution of poor performanceto the student (Georgiou et al., 2002). Therefore, childrenwhose potential is underestimated by either parents orteachers may experience low self esteem and performcognitively at a level lower than they are capable of. Thismight occur as a result of the manner in which teacherscommunicate and encourage students, as teachers providemore attention and positive feedback to those students forwhich high expectations are held.
Parents income impact on self esteem via academicperformance: It is argued that social class is mediated ina cultural level, which in turn determines familyexpectation, values and attitudes regarding education. Inother words, motivation to succeed depends more on theparents’ level of learning than on their level of income(Llorente, 1990). Other studies indicated that the mostinfluential family components on performance are notsocio-cultural or economic, but rather those pertaining tothe affective or psychological dimensions: that is,although good academic preparation is provided by theparent, and a positive cultural environment, favourscholastic performance, it is the affective and rationalvariables which stands out the most as factors thatcontributes to better performance.
The influence of the family’s educationalenvironment is defined by the parenting style or help thatthe child receives from the family; this is determined byelements of the family context, like the dynamics ofcommunication and psychological relationships, attitudestowards values and expectations (Marchesi and Martin,2002). They postulated further that parents’ expectationshave a notable influence on academic results, even whencontrolling for initial knowledge and socio economiccontext.
Castejon and Perez (1998) found indirectrelationships with performance and students’ perceptionof how much importance his or her parents assigned tostudying at home. Other studies showed that the level offamily cohesion (Caplan et al., 2002) and familyrelationships (Buote, 2001) proved themselves capable ofpredicting performance. The parenting style is alsoinfluential both in students’ educational process as well asin family- school relations; research such as that by Moosand Moos (1976) demonstrated that positive familyenvironment favors the development of well-shaped,mature, stable and integrated subjects, and anunfavourable family climate promotes non- adaptive,immaturity, and lack of balance and insecurity.
Peers impact on student’s self esteem and academicperformance: Peers’ influence on the child’s

Asian J. Bus. Manage., 4(1): 36-57, 2012
42
development occurs by similar mechanisms as those usedby adults: reinforcement, modeling and direct teachingand skills. Interaction with peers also promotesacquisition of social competencies such as controllingaggressive impulses and the expression of prosocialbehaviours. In relation to academic performance, thesociometric status of the student’s influences performanceboth directly and indirectly, since it is influenced byintelligence (Castejon and Perez, 1998). Other researchalso shows that positive correlation exist betweenperformance and peer relationships (Buote, 2001), whileMontero (1990) demonstrated in another study thatstudents failing in school are those most rejected by theirgroup class.
In summary, the literature provided a platform uponwhich a study on academic performance of 4th graders intwo primary level schools (including all-age andpreparatory) can be examined. Unlike the literature thisresearch is different as it examines more variables and ina single work evaluates students, parents and teachers inorder to frame a comprehensive understanding of thephenomenon. The literature has shown two sides to thediscourse on the influence of self-esteem, teachers andparents on academic performance.
METHODOLOGY
Historically, scientific inquiry was based on logic,precision, general principles, principles of verification, thestandard of rigor, gradual development, “search for truth”and proofs (Balashow and Rosenberg, 2002). The proofswere critical to the pure sciences before the establishmentof laws, principles, theories and apparatuses.Traditionally, science therefore, was guided by positivism(Polgar and Thomas, 2008; Crotty, 2005). Positivismholds itself to:
C The collection of quantitative dataC Separation of the researcher from the research
processC ObjectivityC MeasurabilityC GeneralizabilityC Repetition
Thus, when the social science was born, theresearchers embodied inquiries using the same approachesas the pure sciences. It follows that what was knownabout human behaviour had to be discovered throughpositivism and/or logical positivism. Social sciences likethe natural sciences, was guided by logic (the study ofvalid forms of reasoning), metaphysics, the fundamentalfinds of things that really exist and the justification ofknowledge (epistemology) which saw experimentativeresearch been widely used to conduct inquiries. Sciencetherefore was about the study of truth and not meanings(Balashow and Rosenberg, 2002). Why people do things,(i.e., meaning) was not important in research it was rather
about the discovery of truth and not merely empiricalresearch.
While empiricism is responsible for plethora ofgermane and critical discoveries that have aided humans’existence, it fails to explore potent things about people.Peoples’ behaviours are not predictable, stationary, andwhile some generalizability exist therein, the ‘whys’(meanings) are still unasked with the use of empiricalinquiry (or objectivity and measurability). Qualitativeinquiry mitigates against some of the inadequacies ofobjectivity, provides rich data on humans’ experiences,and aids in a total understanding of people (Balashow andRosenberg, 2002; Silverman, 2005; Neuman, 2003; Kuhn,1996; Berg, 2001; Burnham et al., 2004; Goel, 1988)Thus, qualitative inquiry should not therefore be seen asan alternate paradigm to quantitative inquiry, but as amember of the understanding apparatus. This supportsSchlick (1979) argument that we cannot know the truthwithout knowing the meaning.
Max Weber (1949, 1974, 1981) was the first to arguethat an ‘Interpretivism’ approach can be employed in theexamination of social phenomenon, read also(Haralambus and Holborn, 2002). Weber opined that whyhuman behave the way they do is lost in quantitativemethodologies (or positivism). He therefore, forwardedthe use of subjectivity (feels, beliefs or meanings) insocial inquiry (Rabinow and Sullivan, 1979).
One scholar (Kuhn, 1996) argued that science notonly embodies objectivity, logic, precision and generalprinciples as humans are social beings (Kuhn, 1996). Assuch, we must understand the meaning behind theirbehaviour which cannot be found by the use of objectivemethodologies. This gives rise to the use of subjectivemethodologies. One such subjective methodology whichis long established in the literature is phenomenology(Crotty, 2005; Silverman, 2005; Neuman, 2003; Berg,2001; Burnham et al., 2004; Goel, 1988; Hakim, 1987;Booth et al., 2008; Babbie, 2007). Phenomenology is oneof the methodologies in qualitative research that evolvedfrom revolution of science. It focuses on a particularissue. The current work examines a phenomenon(Performance of Grade 4 children in two selected primaryand preparatory schools in the Corporate Area) and withinthe context of meanings, the researcher believes that thisis best fitted for the work. This will be accommodatedwith particular methods:
C Case studyC Document analysisC Statistical analysisC InterviewsC Narrative (Babbie, 2007; Neuman, 2003; Burnham
et al., 2004; Booth et al., 2008; Silverman, 2005).
The current work is a descriptive study (Davis, 2005;Polgar and Thomas, 2008) which examined a singlephenomenon, using a mixed methodology approach(Neuman, 2003; Babbie, 2007). Based on the type of

Asian J. Bus. Manage., 4(1): 36-57, 2012
43
research, the researcher reviewed documents, interviewedteachers, used a survey approach as well as narrative inorder to comprehensively understand the phenomenon.This research is a case study. According to a scholar,“Case Studies involve in-depth contextual analyses ofsimilar situations in organizations, where the nature anddefinition of the problem happens to be the same asexperienced in the current situation” (Sekaran, 2006).This Case Study which focuses on a single phenomenonhas three tenets-the students, parents and teachers. Clearlya problem exists in Jamaica where policy makers havebeen restructuring curriculum in order to address the lowliteracy and numeracy in the primary (includingpreparatory) school system. The examination of thisphenomenon will provide pertinent information that willguide future policy and research. Babbie (2007) assertsthat this type of research is generally done for three mainpurposes firstly, to satisfy interest and the need for moreinformation on the topic. Secondly, to determine theviability of embarking on different types of research andthis might be more costly.
Instrumentation: Questionnaires were the choice ofreaching the targeted population as a result of the relativeease of distribution and return. According to Babbie(2007) a questionnaire is a collection of questions or itemsincluded on a document which is designed to solicitfeedback that is suitable for an investigation or study. It isalso believed that this method is more efficient and lesstime consuming which also allows for greater control overthe administering and data collection process. Thequestionnaires sought to cover areas such as thedemographics of sample, self-esteem, performance, andinformation on parents as well teachers. Three differentquestionnaires were administered to selected sub-sample-students, teachers, and parents.
The student’s questionnaire comprised of thirty-four(34) close-ended questions. The average completion timewas 10- 20 min. The open-ended questions are those inwhich the respondents were asked to provide their ownanswer to the questions and the space was provided towrite in the answer. The close- ended questions are thosewhere the respondents were asked to select an answerfrom among a list provided by the researcher (ie tick orcircle). These type of questions were more frequentlyused as they provided greater consistency of responsesand are more easily processed. These questions weretyped and administered to respondents for completion. Atrial testing of the questionnaires was done with somevolunteers to identify likely ambiguity, grammaticalerrors, sentence structuring and ease of reading forrespondents. From the trial testing, necessary correctionswere made, and then the questionnaires were administeredto the actual sample (Babbie, 2007).
Teacher questionnaire: The instrument (questionnaires)comprised of seventeen (17) open-ended and close-endedquestions. The average completion time was 10-15
minutes . The open-ended questions are those in whichthe respondents are asked to provide their own answer tothe questions and the space is provided to write in theanswer (Items 4; 7-to-9). These will provide valuablenarrative for the work, and pertinent insights to meanings,actions and behaviour. On the other hand, the closedended questions are those where the respondents areasked to select an answer from among a list provided bythe researcher. These types of questions are morefrequently used as they provided greater consistency ofresponses and are more easily processed. These questionswere typed and administered to respondents forcompletion. A trial testing of the questionnaires was donewith some volunteers to identify likely ambiguity,grammatical errors, sentence structuring and ease ofreading for respondents. From the trial testing, necessarycorrections were made, and then the questionnaires wereadministered to the actual sample (Babbie, 2007).
Sample and sampling method: The sample for thisresearch was one hundred and twenty (120) respondents,with a non-response rate of less than 5%. The eligibilityand inclusion criteria were 1) being teachers of the 4th
grade (from primary and preparatory schools-n = 30), 2)parents of 4th graders (n = 30) and 3) 4th grade students (n= 60). The targeted population excluded Ministry ofEducation personnel (Education officer), Bursars,Principals and Vice Principal (except they teaching agrade four class), pupils of grades 1-3, 5 and 6,administrative staffers, ancillary staffers and onlyincluded the aforementioned categories of people. Thesample was parents, teachers and pupils who attend twoprimary and/or preparatory schools in the parishes ofKingston and St. Andrew (Rosa Mount Preparatory andEva-Dean Primary schools-pseudo names) and were fromvarying economic backgrounds.
Non probability sample was used to find therespondents for the current study. Purposive samplingtechnique was used to select the sample. The researcherselected the two schools based on the purpose of thestudy, and being familiar with at least a teacher and aparent at each location. The sample size was selected dueto the time constraints and the difficulty of not having apopulation of all students during this time. Withouthaving an access to a population of 4th graders in July, itwas difficult to use any probability sampling technique todraw a sample. Hence, purposive sample technique wasused by the researcher. A purposive (or judgmental)sampling technique was adopted in the study. Accordingto Babbie (2007) sampling methods are referred to aseither probability or non-probability. Non-probabilitymethod is based on personal judgment about someappropriate characteristics of the sample members. Theresearcher, knowing a few people who were teachers andparents, contacted and informed them of the interest,which resulted in seeking approval from the principals ofthe two named schools. Such an approach is purposiveand non-probability in nature.

Asian J. Bus. Manage., 4(1): 36-57, 2012
44
Effective use of purposive sampling techniquesrequires that the researcher utilizes his/her specialknowledge or expertise of the subject that is largelyrepresentative of the population (Babbie, 2007). Theresearchers are cognizant of the structure and populationof primary, all age and preparatory schools in theCorporate area, particularly Eva-Dean Primary and RosaMount Preparatory Schools-pseudo names. This structureis of such that each is headed by a principal, with vice-principal senior and junior teachers, administrative andancillary staffers (including security guards).
DOCUMENT REVIEWS
The researcher reviewed written documents such asMinistry of Education Report, articles on self-esteem,performance, class report, statistical reports on theperformance of grade four students in Jamaica. Both theMinistry of Education Report and the statistical reportsoutlined the performance of grade four students acrossJamaica, and these were classified by parish and schooltype-primary, all age and preparatory schools. The reviewwas to determine the performance of students, policiesimplemented by the Ministry of Education, and plans ofthe Ministry of Education, the extent to which the planswere working, issues of inequality in academicperformance among 4th grade students and identify somecauses. A major reason for the document review was toassist in triangulating and validating information obtainedin the interview and surveys. Once scholars opined thatinterviews “rarely constitute the sole source of data inresearch” (Bryman, 2001), which was the rationale formultiple methods and approaches.
Statistical analysis: The close-ended questions from theitems from the questionnaire were stored and retrieved inthe Statistical Package for the Social Sciences forWidows, version 17.0 (SPSS Inc; Chicago, IL, USA).Multiple repression techniques were conducted to identifyvariables explaining performance, with self-esteem beingamong the variables. A p value #0.10 was used to indicatestatistical significance. Where collinearity existed(r2>0.75), the variables were placed independently inorder to determine whether to retain it in the final modelconstruction (Polit, 1996). Outside of the OLS, descriptivestatistics were done to provide pertinent information aswell as bivariate analyses (including Chi-square,Pearson’s Product Moment Correlation). The open-endedquestions were analyzed using a narrative and thematicapproach (Silverman, 2005).
The results (data) were presented in tables and figuressuch as pie charts.
Operationalization of variables: Self-esteem ismeasured using Rosenberg Self-Esteem Scale (Appendix).Questions 2, 5, 6, 8 and 9 were reversed coded, and thesewere summed with questions 1, 3, 4, 7, and 10.
Gender is a dummied variable, where 1 = boys (male) and0 = girls (female).
Distance from school which was a Likert scalequestion (Question 3) was coded into a dummy variable-1 = close to school (less than 1 ½ miles), 0 = far fromschool (1 ½+ miles). Self-esteem is coded based on theRosenberg’s Foundation stipulations. Scoring: SA = 3, A= 2, D = 1, SD = 0. Items with an asterisk are reversescored, that is, SA = 0, A = 1, D = 2, SD = 3. Sum thescores for the 10 items. The higher the score, the higherthe self esteem. The scores range from 0 to 30.
School type was re-coded as a dummy variable -1 =Preparatory and 0 = otherwise.With whom do you live was re-coded as a dummyvariable -1 = guardian and other, 0 = otherwise.
Age cohort was re-coded as 1= younger ages (8-to-9years) and 0 = otherwise (10-to-11 years old).
Occupation (questions 5 and 6) was re-coded as adummy variable -1 = professional and 0 = otherwise.
The question, ‘Do your parents shout at you?’ was re-coded as 1= all the time and most times, 0 = otherwise.
The question, ‘Does your teacher shout at you?’ wasre-coded as a dummy variable -1 = always and mosttimes, 0 = otherwise.
Academic performance is the average scores for thefinal term of 2011 (June).
Ethical concerns: This study dealt with human subjects(teachers, parents and students), which is the justificationfor ethical issues. Among the ethical issues in socialresearch (or natural) is the protection of the subjects(participants or respondents) as well as ensuring that theparticipants are never harmed, socially, psychologically orpolitically because of the study (Babbie, 2007; Neuman,2003). The considerations of these ethical issues werenecessary for the purpose of ensuring the privacy as wellas the safety of the studied individuals. Among the ethicalissues that were considered in the research process wasconsent before engagement in the study, relating thepurpose of the work, ensuring confidentially and secrecy.The respondents were advised that they could withdraw from the study at any point during the process. They wereasked not to place their names on the instrument or anyother personal identifier.
Limitations to the study: This study utilizes non-probability sampling technique which means that theresults are:
C Non-generalizableC Non-predictableC Specialized to the respondents C Non-repeatable.
However, these methods still provide insightful, richand critical information about the studied phenomenon.

Asian J. Bus. Manage., 4(1): 36-57, 2012
45
80
70
60
50
40
30
20
10
0
Perc
ent
Gift Money Toys/games
Praise Good grades in school
Motivation
Preparatory
Primary
Yes No Some time Most time
Compliment from parents[s] for doing some thing good
70
60
50
40
30
20
10
0
Per
cent
Preparatory
Primary
Table 1: Socio-demographic characteristics of respondents by primaryand preparatory schools
Preparatory (n = 17) Primary (n = 15)------------------------ -----------------------
Characteristic gender n % n %Boy 11 64.7 4 26.7Girl 6 35.3 11 73.3Age cohort8 - 9 Years old 4 23.5 5 33.310 – 11 Years old 13 76.5 10 66.7Distance from school½ Mile 5 29.4 4 26.71 Mile 2 11.8 2 13.31½ Miles 3 17.6 2 13.32 Miles - - 2 13.32+ Miles 7 41.2 5 33.3Resides withMother, only 5 29.4 6 40.0Father, only 1 5.9 1 6.7Aunt 1 5.9 2 13.3Guardian 1 5.9 5 33.3Both mother and father 9 52.9 1 6.7Occupation - MotherTrades’ woman 2 11.8 -Home maker 2 11.8 -Farmer 1 5.9 -Professional 6 35.3 9 60.0Service attendant 2 11.8 - -Business woman 3 17.6 1 6.7Unemployed 1 5.9 - -Other - - 5 33.3Occupation – FatherTrades’ man 1 5.9 4 26.7Business man 9 52.9 8 53.3Service attendant 2 11.8 - -Professional 2 11.8 2 13.3Unemployed 2 11.8 - -Other 1 5.9 1 6.7Perceived academic ability-brightYes 16 94.1 13 86.7No 1 5.9 2 13.3
Like Kuhn (1996) and Max Weber (in Haralambus andHolborn, 2002) have indicated, research is equallyinformative even when it is qualitative and non-probability sampling technique is utilised to collect thedata.
FINDINGS
Table 1 displays information on the socio-demographic characteristics of the student participants. Ofthe 32 pupils in this study, 53.1% were from preparatoryschools and the others are from the primary schools. Mostof the pupils who attended preparatory schools residedwith both biological parents (52.9%) compared with thosewho attended primary schools (6.7%). The majority of thestudents who attended primary schools, mothers wereprofessionals (60%) compared with 35.3% of those inpreparatory schools. Most of the students in both preparatory and primary schools indicated that theirfathers were businessmen, 52.9 and 53.3% respectively.Seven per cent more students who attended preparatoryschools indicated that they were bright (academicperformance) compared with those in primary schools(86.7%).
Fig. 1: Student response to big motivated
Fig. 2: Complement from parents to student for doing good deed
When the students were asked to explain “Whatmakes you think that way [are you bright]”, the responsesranged from:
C High scoresC EffortC Reasoning abilityC PotentialC Parental encouragementC People’s perspective.
One pupil who responded no to the question perspective.One pupil who responded no to the question “Do youthink you are a bright girl or boy? Gave the reason that“Because people tell me I am [a] dunce.”
When the pupils were asked ‘What motivates you asa person?’ the responses are represented in Fig. 1. Themajority of pupils in both school types were motivated bythe grades they received in schools.
Ninety-four per cent of the pupils indicated that theyare compliment by their parent(s) for doing somethinggood. Only 25% mentioned that they are complimentmost times. Figure 2 presents the disaggregates of theresponses of the pupils on “When you do something good;are you complimented by yours parent(s)? Marginally

Asian J. Bus. Manage., 4(1): 36-57, 2012
46
Yes No Some time Most time
70
60
50
40
30
20
10
0
Per
cent
Preparatory
Primary
Admiration of peers
60
50
40
30
20
10
0
Perc
ent
Preparatory
Primary
Prof
essi
onal
Bus
ines
s per
son
Trad
e pe
rson
Se
rvic
e pe
rson
Oth
er
Aspired occupation
Yes No Some times Most times
60
50
40
30
20
10
0
Per
cent
Preparatory
Primary
Compliment from teachers
Fig. 3: Admiration of participants by peer
Fig. 4: Aspired occupation of students
Fig. 5: Compliments to student from teachers
more of the students in primary schools indicated sometimes compared with their preparatory counterparts, withthe reverse being the case for most time (Fig. 2).
Figure 3 displays pupils’ responses on the admirationof their peers. Clearly, substantially more pupils who attended primary schools indicated that they areadmired by their peer compared with those in preparatoryschools.
Table 2: Selected variables on participantsC Preparatory (n = 17) Primary (n = 15)
------------------------- -----------------------Characteristic n % n %Feeling after low performanceDown 5 29.4 7 46.7Self-pity 0 0 1 6.7Depressed 1 5.9 2 13.3Work harder 6 35.3 2 13.3Motivated to do better 5 29.4 3 20.0Feeling after doing something wrongLike crying 0 0 3 20.0Do not care 2 11.8 2 13.3Feel guilty 12 70.6 6 40.0Feel sad 3 17.6 4 26.7Feel good 0 0 0 0Does you teacher shout at you?Always 0 0 1 6.7Most times 4 23.5 1 6.7Sometimes 11 64.7 10 66.7Occasionally 0 0 0 0Never 2 11.8 3 20.0Feeling after doing something goodVery happy 6 35.3 7 46.7Somewhat happy 1 5.9 1 6.7Happy 3 17.6 5 33.3Great 7 41.2 2 13.3Don’t feel anyway 0 0 0 0Frequency of class participationAlways 7 41.2 3 20.0Most times 7 41.2 3 26.7Sometimes 3 17.7 8 53.3Occasionally 0 0 0 0Never 0 0 0 0Confidence in class performanceVery confident 7 41.2 5 33.3Somewhat confident 5 29.4 2 13.3Confident 4 23.5 7 46.7Doubtful 1 5.9 0 0Not confident 0 0 1 6.7
Fifty percent of the pupils indicated wanting to be aprofessional, with 28.1% indicated Other. Substantiallymore students in primary schools indicated wanting to beservice providers and trades’ person compared with thosein preparatory schools. Six per cent more pupils ofpreparatory school want to be professionals compared tothose in primary schools (46.7%) (Fig. 4).
Of the sample of students (n = 32), 9.4% indicatedthat they were not complimented by their teachers. Fig. 5presents a disaggregation of the pupils’ responses.Marginally more pupils who attended preparatory schoolsindicated being complimented most times by theirteachers (3.1%) compared with their primary schoolcounterparts (8.7%).
Table 2 presents information on selected variables ofpupils. Substantially more students who attended primaryschools indicated feeling down after a low testperformance (46.7%) compared with those in preparatoryschools (29.4%). The majority of pupils in both types ofschools indicated that they have been shouted at(sometimes) by teachers. Almost 65% of those inpreparatory schools mentioned sometimes compared

Asian J. Bus. Manage., 4(1): 36-57, 2012
47
60
5040
30
20
0
Per
cent
Preparatory
Primary
Always Most times Some times Never
Parents shout at pupil
70
80
90
*25
30.00
25.00
20.00
15.00
10.00
5.00
Sel
f es
teem
inde
x
Preparatory Primary
School type
1611
30.00
25.00
20.00
15.00
10.00
5.00
Self
est
eem
inde
x
12
11
Always Some timeMost time None at all
Consistently gets good grades
Preparatory Primary
School type
21
90.00
80.00
70.00
60.00
50.00
40.00
Ave
rage
sco
res
Fig. 6: Frequency of parents shouting at their children
Fig. 7: Self-esteem index by school type
Fig. 8: Self-esteem index by consistently getting good grades(pupils)
Fig. 9: Academic performance (average score) by school type
Table 3: Pearson’s correlation of self-esteem index and average scores(academic performance)
Self-esteem Averageindex scores
Self-esteem index Pearson correlation 1 0.611**
Sig. (2-tailed) 0.000N 32 32
Average scores Pearson correlation 0.611** 1Sig. (2-tailed) 0.000N 32 32
**: Correlation is significant at the 0.01 level (2-tailed)
with 67% of those in primary schools. A preponderanceof pupils in preparatory schools said they were frequentlyshouted at their teachers (23.5%) compared to theirprimary school counterparts (6.7%). Pupils in preparatoryschools were more confident in their class performance(41.2%), unlike their primary school counterparts(33.3%). Two times more pupils in preparatory schoolsmentioned that they frequently participated in class(always) compared to those in primary schools (20%).
Seventy-five percent of pupils indicated that theirparents shout at them sometimes, with 9.4% said always.Fig. 6 presents the disaggregation of the pupils’ responseson the frequency of their parents shouting at them.Substantially more children in primary schools have neverbeen shouted at (14/1%) compared to those in preparatoryschools.
Figure 7 shows the self-esteem of pupils by schooltypology. The mean score for self-esteem of pupils inpreparatory schools (20) is greater than that of those inprimary schools (18). The lower self-esteem quartiles forboth groups are the same. However, the upper self-esteemquartile is greater for those in preparatory schools (22 outof 30) compared with those in primary schools (20 out of30).
Pupils who consistently get good grades had thegreatest self-esteem compared with those who had nevergot good grades (Fig. 8).
The median score for the sample was 74%, with 25%received a score of 64%. Students in preparatory schoolon average received higher scores (78%) than theirprimary school counterparts (67%) (Fig. 9).
A moderate positive correlation exists between self-esteem index and academic performance of students, rs =0.611, p<0.0001 (Table 3). This means that as self-esteem increases, academic performance improves andvice versa.
Table 4 presents variables that explain (or not) self-esteem of pupils in sample. Four variables emerged asstatistical significant factors of self-esteem-academicperformance, age of respondents, gender and parentalbehaviour, which explain 64.4% of the variability in self-esteem. Using beta weights, academic performance hasthe most influence on self-esteem followed by age, genderand parental behaviour. Boys had a lower self-esteem (b= -3.911) than their female counterparts (Table 4).
Self-esteem is the most influential factor that accountfor academic performance (using beta weights). Of thenine variables, four emerged as explaining academic

Asian J. Bus. Manage., 4(1): 36-57, 2012
48
Table 4: Ordinary least square (OLS) regression of variables that explain self-esteem of pupilsUnstandardized Collinearitycoefficients CI (95%) Statistics------------- ------------------------------------- ----------------------------
Characteristic B S.E B p- value Lower bound Upper bound Tolerance VIFConstant 6.925 6.684 0.310 - 6.869 20.719Academic performance 0.199 0.098 0.490 0.000 - 0.003 0.402 0.506 1.978Younger ages - 4.359 2.095 - 0.395 0.048 - 8.683 -0.034 0.818 1.222Boys (1 = Yes) - 3.911 1.967 - 0.393 0.012 -7.970 0.148 0.754 1.326Preparatory school (1 = Yes) - 1.396 2.136 - 0.140 0.520 - 5.805 3.012 0.639 1.564Distance from school (1 = Close) - 0.043 2.277 - 0.004 0.985 - 4.742 4.657 0.693 1.443Shouting parent (1 = Yes) 3.075 2.896 0.205 0.030 - 2.902 9.053 0.792 1.263Shouting teacher (1 = Yes) 0.659 2.472 0.052 0.792 - 4.443 5.761 0.780 1.282R = 0.803; R2 = 0.644; F-statistic [7, 24] = 4.423, p<0.002; N = 31Dependent variable: Self-Esteem index
Table 5: Ordinary least square (OLS) regression of variables that explain academic performance of pupilsUnstandardized Collinearitycoefficients CI (95%) statistics-------------- ----------------------------------- -------------------------------
Characteristic B S.E $ Sig. Lower Bound upper Bound tolerance VIFConstant 37.070 8.219 0.000 20.024 54.115Preparatory school 5.435 3.428 0.198 0.127 - 1.674 12.543 0.769 1.300Distance from school 4.515 3.881 0.148 0.257 - 3.533 12.563 0.739 1.353Mother professional - 0.860 3.346 - 0.031 0.800 - 7.799 6.080 0.807 1.240Father professional - 7.356 5.149 - 0.178 0.167 - 18.034 3.322 0.776 1.289Shouting parent - 13.583 4.847 - 0.328 0.010 - 23.635 -3.531 0.875 1.142Shouting teacher - 10.227 4.177 - 0.292 0.023 - 18.890 -1.564 0.846 1.182Boys 7.980 3.561 0.291 0.035 0.594 15.365 0.712 1.404Younger ages 0.870 4.166 0.029 0.837 - 7.769 9.509 0.641 1.559Self-esteem index 1.723 0.349 0.624 0.000 0.998 2.447 0.749 1.334R = 0.858; R2 = 0.736; F-statistic [9, 22] = 6.815, p<0.000; N = 31Dependent variable: Academic performance
performance (p<0.001), which explain 73.6% of thevariability in academic performance (Table 5). Thefindings show that boys were performing better than girls.
Table 6 presents information on the profile of theteachers. Almost 52% of the teachers were frompreparatory schools. Thirty-three per cent of the sampleindicated that they always teach self-esteem in class.Substantially more teachers in the primary schools do thiscompared to those in preparatory schools.
Less than 7% of teachers indicated below 15% of theclass are at or above the class level (Table 7). Eight-eightper cent of the teachers said that less than 15% of theclass is below the grade level; and 87.9% of teachersmentioned that after praising the children, it results inbehavioural changes at least most of the times.
When the teachers were asked to give their views onperformance and self-esteem among students within theirclass, many responded as follows:
C Generally, students have a high self-esteemC Those with low self-esteem are normally withdrawnC Children perform better when they are not plagued by
self-esteem problems C Those who exhibit higher self-esteem are usually the
better performers C Self-esteem is important for high academic
performance
C Social and financial hardship is a barrier to academicperformance and high self-esteem
C Self-esteem influences academic performance andassertiveness
C Motivated students will give greater academicperformance
Varying reasons were given for the identification ofthose with low self-esteem. These were:
C Low academic performanceC Less self-expressionC Low level of confidenceC WithdrawalC ShynessC Interpersonal behavioural problems
When asked ‘How do you respond to your students whenthey do something good?’ the teachers wrote thefollowing:
C Verbal commendationC Applause from peersC Certificate for good behaviourC Positive reinforcement-books, goodies, stickers,
smiling facesC Hugs C Kisses

Asian J. Bus. Manage., 4(1): 36-57, 2012
49
Table 6: Profile of teacher based on sampled respondentsPreparatory (n = 17) Primary (n = 16)------------------------- ------------------------
Characteristic Gender n % n %Male 6 35.3 3 18.8Female 11 64.7 13 81.2Age cohort16-25 years 2 11.8 1 6.326-35 years 5 29.4 7 43.836-45 years 6 35.3 7 43.846-50 years 4 23.5 1 6.350-59 years 0 0.0 0 0.0Teaching self-esteem in classAlways 3 21.4 8 50.0Most times 7 50.0 6 37.5Sometimes 3 21.4 21 2.5Seldom 1 7.2 0 0.0Never 0 0.0 0 0.0Identification of low self-esteemOutward appearance 5 29.5 6 40.0Work output 4 23.5 2 13.3Academic performance 4 23.5 2 40.0Otherwise 4 2.5 1 6.7Teachers should be trained to deal with low self-esteemed pupilsStrongly agree 10 58.8 13 81.3Somewhat agree 4 23.5 1 6.3Agree 3 17.6 2 12.4Strongly disagree 0 0.0 0 0.0Disagree 0 0.0 0 0.0Students’ perception of selfWinners 5 29.4 8 53.3High achievers 8 47.1 2 13.3Role model for their 1 5.9 1 6.7 PeersLeaders 2 11.8 4 26.7Failure 1 5.9 0 0.0
The responses on ‘How do you respond to your studentswhen they do something wrong/bad?’ included:
C ReprimandC ScoldingC Retract rewardC Encourage better behaviourC Punishment by sending pupil to naught cornerC Encourage improvementC Pray with themC Writing linesC Let the child evaluate his/her behaviour and
recommend changes.
Table 8 presents information on selectedcharacteristics of parents, perception of self-esteem andintended occupation of child. It was revealed that no ofthe parents want their children to be police personnel.However, marginally more of the parents of children inprimary schools want their children to be medical doctorscompared with those of preparatory pupils. Six per centmore parents of children in primary school hadtertiarylevel education compared with those ofpreparatory school pupils.
Eighteen per cent more parents of primary schoolpupils indicated that they always aid in the development
Table 7: Teachers’ perception of students in regard performance andself-esteem
Characteristic Preparatory (n = 17) Primary (n = 16)----------------------- -----------------------n % n %
% of class at or above class level5 1 5.9 0 0.010 0 0.0 1 6.315 1 5.9 0 0.020 5 29.4 8 50.020+ 10 58.8 7 43.7% of class below class level5 8 47.1 8 50.010 6 35.3 7 43.715 1 5.9 0 0.020 0 0.0 1 6.320+ 2 11.8 0 0.0% of class with positive self-esteem5 1 5.9 0 0.010 2 11.8 1 6.315 0 0.0 8 50.020 5 29.4 1 6.320+ 9 52.9 6 37.4Does socio-economic background affect self-esteem?Strongly agree 4 23.5 3 18.8Somewhat agree 8 47.1 10 62.5Agree 5 29.4 3 18.8Disagree 0 0.0 0 0.0Strongly disagree 0 0.0 0 0.0Does behaviour change after praising a child?Always 5 29.4 7 46.7Most times 10 58.8 7 46.7Sometimes 2 11.8 1 6.7Seldom 0 0.0 0 0.0Never 0 0.0 0 0.0
Table 8: Particular characteristics parents, perception of self-esteemand intended occupation of child
Preparatory (n = 17) Pr imary (n =17)
--------------------- -------------------Characteristic gender n % n %Male 4 23.5 4 23.5Female 13 76.5 13 76.5Age cohort16-25 years 2 11.8 3 17.626-35 years 8 47.1 5 29.436-45 years 5 29.4 3 47.146-50 years 2 11.8 4 5.050+ years 0 0.0 0 0.0Educational achievementTertiary-BSc, MSc, PhD 9 52.9 7 41.2Diploma 1 5.9 2 11.8Secondary 6 35.3 7 41.2All-age 0 0.0 1 5.9Primary 0 0.0 0 0.0Vocational 1 5.9 0 0.0Self-Esteem isFeeling good about oneself 11 68.8 13 76.5Aware of oneself 2 12.5 0 0.0Personal gratification 2 12.5 3 17.6Success 1 6.3 1 5.9Happiness 0 0.0 0 0.0Intended occupation of childDoctor 3 18.8 2 12.6Nurse 0 0.0 1 6.3Teacher 0 0.0 1 6.3Police 0 0.0 0 0.0Information technologist 3 18.8 2 12.6Lawyer 1 6.3 4 25.0Other 9 56.3 6 37.5
Asian J. Bus. Manage., 4(1): 36-57, 2012
50
60
5040
30
20
0
Per
cent
Preparatory
Primary
Always Most times Some times
70
80
90
Assist in development of self-esteem
6050
40
3020
0
Per
cent
Preparatory
Primary
Always Most times
7080
100
Never Important of having a good self-esteem
90
Perc
ent
Preparatory
Primary
Always Most times Never
40.0%
30.0%
20.0%
10.0%
0.0%
Do you praise your children ?
Some times
30.00
25.00
20.00
15.00
10.00
5.00
Self
est
eem
inde
x
Prof
essi
onal
Bus
ines
s p
erso
n
Trad
e pe
rson
Serv
ice
pers
on
Oth
er
Intended professional (future desired occupational type)
25
60.0%
50.0%
Beat Shout at Embarrass them
Sit and talk to them
All of the above
Response to cheildren doing some thing wrong
Perc
ent
Preparatory
Primary
40.0%
30.0%
20.0%
10.0%
0.0%
90.00
80.00
70.00
60.00
50.00
40.00
Prof
essi
onal
Bus
ines
s p
erso
n
Trad
e pe
rson
Serv
ice
pers
on
Oth
er
Future desired occupation type
Fig. 10: Assist in the development of self-esteem of child byschool type
Fig.11: Parental perception: Importance of having a goodself-esteem by school type
Fig. 12: Comparative praises of children by parents ofpreparatory and primary schools
of their child’s self-esteem compared with parentsof children in preparatory schools (Fig. 10).
Figure 11 depicts the perception of parents on theimportance of having a good self-esteem by school type.Marginally more parents of pupils in primary schools(12%) indicated that they always see the importance ofhaving a good self-esteem compared with those ofchildren in preparatory schools.
Fig. 13: Parental response to children doing something wrongby school type
Fig. 14: Future desired occupational type and self-esteemindex of pupils
Fig. 15: Future desired occupational type and average scoresof pupils
Figure 12 displays the parents responses to “Do youpraise your children?’ by type of school. More parent ofchildren in primary school indicated that they dopraise their children at least most of the times comparedwith those parents of children in preparatory schools.

Asian J. Bus. Manage., 4(1): 36-57, 2012
51
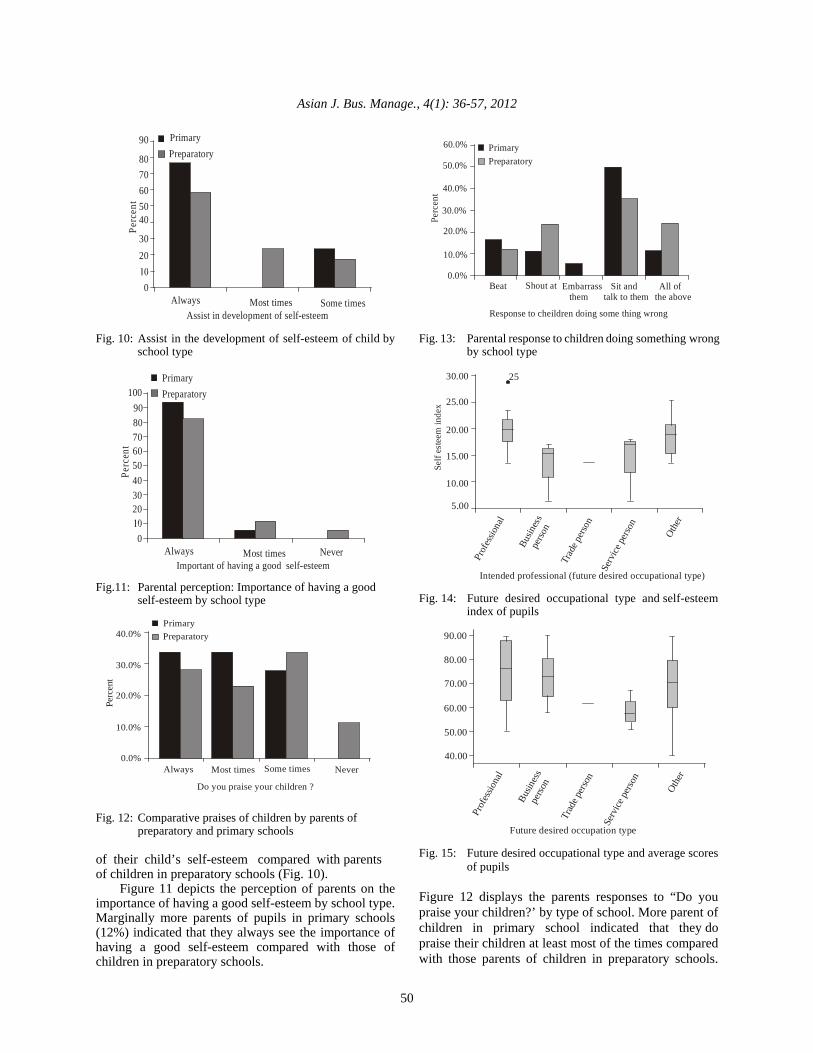
More parents of children in primary school beat, lessshout, more embarrassed, and sit and talk to pupilscompared to parents of children in preparatory schools(Fig. 13).
Figure 14 depicts the self-esteem for pupils whodesire a particular occupational type. Children who desireto be professional (doctors, nurse, teachers, et cetera) hadthe highest self-esteem compared to those who want to bebusiness person, trade persona and service attendants.
Pupils with the highest scores are more likely want tobe professionals compared to the other occupational types(Fig. 15). Those who indicated a desire to be trade and/orservice persons received low grades.
DISCUSSION
Statistics revealed that academic performance of 4th
graders in primary schools (including all age) have alwaysbeen lower than those in preparatory schools (MoE). Eventhough the national average on the grade 4 literacy testwas 67% in 2009, one school’s average was 14%(Hillside Primary in St. Thomas), another 0% (Old PeraPrimary) and some schools scored below 50% (MoE).The high prevalence of Jamaicans who had not surpassedprimary level education is an indictment of theeducational system. The Common Entrance Examinationhas been replaced with the G-SAT examination and signsare still evident that something needs to be done toimmediately rectify the low literacy and numeracy amongpupils of primary schools (including all age andpreparatory).
Research provides an avenue for policy changes byequipping policy makers with evidence, understanding ofthe issues and a scope of the problem. A Caribbeancriminologist, Professor Harriott (2004), opined that crimeproblem in the region has resulted in extensive publicpolicy concerns as well as quest for solutions. He statedthat “While policy should be informed by an appreciationof the problem involving at least an analytic descriptionof it, policy elaboration need not await a definitiveanalysis of its sources or the causes” (2004, p.238).Embedded in criminologist’s perspective is the valueof research in the policy process. Research is not onlyabout policy formulation and intervention programmes; itprovides a platform in understanding issues and insightsinto cause.
Within the context of the general problem of lowacademic performance in the grade four (4) Literacy Test(Douglas, 2010; Davis, 2004), the recognition thateducation is the third national problem in Jamaica, lowliteracy and numeracy among students, the percentage ofstudents performing below the grade level (Ministry ofEducation and Youth and Culture, 2004) and thecorrelation between low literacy at the primary level and
future academic performance into the post-secondarylevel, and the importance of the human capital in theproductive process, the researcher believes that the mattermust be studied to provide insight into the problem androle of self-esteem in explaining academic performance.The researcher is of the view that self-esteem plays apivotal role in the life of children, and offers ajustification for the disparity between the performance ofpupils in preparatory and primary schools. The lowperformance on the grade four (4) Literacy Test coupledwith the high percentage of Jamaicans who have notattained education beyond the primary level, were theprimary motivation that stimulated my interest in the topicas well as the inequality between pupils’ performancebased on typology of schools, which has implications forsocio-economic background.
Academic performance of Jamaican students on thegrade 4 literacy test has been steadily increasing since2001. Statistics revealed that in 2005, 62% of pupils whosat the 4th grade literacy and numeracy examinationattained mastery, which increased to 67% in 2009 from50% in 2001 (Roxborough-Wright, 2002; Ministry ofEducation, 2009). On disaggregating the results bytypology of schools (primary and preparatory), it wasrevealed that preparatory schools’ students had a leveldegree of mastery (71%) compared to primary schools’pupils (67%) (Ministry of Education, 2009). The percentof students receiving mastery at one public school (St.Michael Primary) was as low as 31% (Ministry ofEducation, 2009). Using the grade 3 diagnostic tests as aprecursor to the 4th grade literacy test the results showedthat there are fundamental weakness in literacy of 4th
graders. In 2004, on the Grade Three Diagnostic Test,53.1% of pupils mastered phonics, 27.5% masteredstructure and mechanic, 39.6% vocabulary, 28.8% studykills and 30.6% reading and listening comprehension(Planning Institute of Jamaica, 2000-2011). There is asomething fundamental amiss with the performance ofJamaican students, particularly those less than 12 yearsold. This problem was identified by the Ministry ofEducation (2009), which resulted in the testing of studentsbefore they say the G-SAT. The problem has not abated,which speaks to a justification for having a research onthe phenomenon.
The current study found that there is a directcorrelation between academic performance and self-esteem, and that self-esteem was the most influentialfactor explaining academic performance of 4th graders attwo Corporate Area primary and preparatory schools inJamaica. The association between academic performanceand self-esteem was equally identified by almost all theteachers, and one teacher said that majority of the timeswhen a child is motivated, he/she will perform better inclass. One teacher summarized this aptly saying that “If

Asian J. Bus. Manage., 4(1): 36-57, 2012
52
you don’t believe in yourself, how can you believe thatyour answers are correct?” suggesting the positivecorrelation between self-esteem and academicperformance. The present study concurs with empiricalevidence that there is direct correlation between self-esteem and academic performance (Purkey, 1970;Baumeister et al., 2003; Bankston and Zhou, 2002;Lockett and Harrell, 2003). It should not be surprising thata teacher in the current work said that “Those who exhibit[higher] self-esteem are usually [the] better performers,which concurs with the average grades and self-esteemindex. One of the participants in this research mentionedthat self-esteem is important for good performance, whichhas already been forwarded by other scholars andconcretized by the correlation from using the Rosenberg’sSelf-esteem Index and the average performance of grade4 students.
Based on plethora of students studied on self-esteemand academic performance, there is no denial self-esteemis good for academic performance. From a standardachievement test, using 3,001 British pupils, Davies andBrember (1999) found a weak positive correlationbetween self-esteem and better academic performance,and even prior to that study Davies and Brember’s, Simonand Simon (1975) had found a positive correlation on IQtest and self-esteem (rs = 0.33), which means that feelinggood about one’s self will mean a greater score on an IQtest. Purkey (1970) opined that self esteem is positivelyrelated to some components of success, academic orverbal performance. Unlike the aforementioned research,this one found a higher correlation between generalacademic performance and self-esteem (rs = 0.611,p<0.0001). This work goes further, using ordinary leastsquare regression, to show that of nine variables enteredinto a single regression model, four emerged as explainingacademic performance (p<0.001), with self-esteem beingthe most influential factor (using beta weights). Like theteachers who participated in of this research said, self-esteem is important for good academic performance.
One academic researcher reported that as the level ofself esteem increases, so does the level of academicachievement scores, but as the level of self esteemdecreases, achievement declines (Covington, 1989),highlighting the direct (positive) correlation between self-esteem and academic performance. The present findingsconcur with the aforementioned a direction, andproposition of Covington (1989) that self esteem can bemodified through direct instructions which can lead toachievement gains was identified by teachers in thisresearch. The teachers who participated in this researchidentified self-esteem issues with:
C Low performanceC Social isolationC Social interaction problem with pupil and peerC Self-expression C Shyness
From the ordinary least square regression model, fourvariables emerged as statistical significant factors of self-esteem-academic performance, age of respondents, genderand parental behaviour, with academic performancehaving the most influence on self-esteem. Not only is self-esteem influence academic performance, the reverse isalso true which would support motivation and increasedperformance.
Although this work disagrees with previous empiricalfindings on the negative correlation or no correlationbetween self-esteem and academic performance, andconcurs with those that have a positive association, itdisagrees with works that offered self-esteem as apredictor. Again, Van Tuinen and Ramanaiah (1979)reported that specific self esteem was a significantpredictor of actual performance on concept attainmenttasks, whereas global self esteem was not an adequatepredictor. Using Rosenberg’s Self-Esteem Index andaverage scores for the last term for some 4th graders, thiswork found that only 37.4% of the explained variability inacademic performance could be explained by self-esteem.Self-esteem could not be said to be a predictor ofacademic performance for 4th grades, neither is another ofthe other factors that account for academic performance.Although collectively, the factors that explain academicperformance are predictors, singly they cannot beassumed to have predictive explanations. Hence, for thisresearch, self-esteem is a stronger factor than identified inthe literature; but with a square r of 37.4%, the researchercould not ascribe predictability to this weak explanation.
Like many other discourse, one side critiques the“self esteem perspective” on the academic field. Scholarshave purported that self esteem is pursued in the contextof making students feel good about them; thismisconception can lead to indiscriminate praise and theassumption that one should protect his or her student fromfailure (Baumeister, 1996; Learner, 1996). These theoristssuggested that students who feel good and are satisfiedwith their work do not necessarily achieve or develophabits that lead to success. Those criticisms have somemerit, which emerged in the present work. This studyfound that there is a positive association between self-esteem and shouting parents; but a shouting parent and/orteacher detracts from better academic performance.Suggesting that positive reinforcement has a direct link tobetter academic performance among 4th graders, andnegative criticisms have the reverse role on performancecompared to positive motivational mechanisms. Theyoung child (pupil) is, therefore, vulnerable to externalinfluences that are likely shape in one way or another self-esteem and academic performance. This work highlightsthat the positives of self-esteem on performance can bedepleted by the parental and teachers’ actions, whichsupports the theorists who believed that feeling good andare satisfied with their work do not necessarily achieve ordevelop habits that lead to success.
Rosenberg (1965) perspective that as early as age five(5) or six (6) years old children role playing abilities are

Asian J. Bus. Manage., 4(1): 36-57, 2012
53
sufficiently developed to enable them to consider theperceived judgments and reaction of others helps toexplains the parental and teachers’ actions on theperformance of 4th graders. Although parents mean theirchildren well, shouting is negative affecting theirchildren’s performance and the same thing can be said oftheir teachers. With the majority of teachers developingpositive self-esteem in their pupils, other negativebehaviour will erode the gains of self-esteem building onperformance. One teacher said that “Children performbetter when they are not plagued with self-esteemproblem” which is true; but academic performance can bedepleted by negative reinforcement (shouting, namecalling, et cetera) by the teacher and/or the parents.Another teacher mentioned that “Honestly at times Irespond in the negative way, but I [have] learn[t] torealize that it’s not healthy for the student/students so Ihave to teach them the right way along with measures forthem to continue doing the right and not the bad”,emphasizing the teacher’s negative action onperformance. Hence, not all low performance, therefore,should be ascribed to self-esteem as this may be as aresult of external stimuli (such as parental and teachers’actions). There can be a blur of the line of lowperformance attributable to self-esteem and other stimuli,as one teacher said “The ones with lower self-esteemusually perform poorly”, without realizing thedemarcation. Rosenberg (1965) helped us to understandthe role of other stimuli in self-esteem problems when heopined that students who believed that their parentslacked interest in them had much lower levels of selfesteem. Again, parental involvement as is the case ofteacher’s involvement could account for the disparity inlow and high performers.
Scarr and Thompson (1994) offered the perspectivethat children’s academic and social competence can bepredicted mainly by their family background, parents’psychological support and the most influential being othersources of support. Aspects of Scarr and Thompson’swork have some potency with this study; but, there aresome disagreements between the two studies. In this one,no single factor of academic performance or self-esteemcan be said to be a predictor, and social support is not themost influential factor of academic performance. Clearly,the involvement of parents and teachers play a role inacademic performance of 4th graders in Jamaica, however,it is self-esteem that is driving the performance amongthis group unlike the findings purported by Scarr andThompson (1994). While the social support plays a role inallocating the educational resources, school type, extraclasses, functions (museums, swimming, karate classes,et cetera) and is pivotal to the establishment anddevelopment of self-esteem, the end product of self-esteem is what account for the better grades of 4th gradersis.
Some academic researchers purported that the teacheris unlikely to be more influential than other facilitators ofchange in academic performance (Hattie, 1992), because
in the school setting, the teacher is the most salient sourceof feedback for a student’s academic proficiency.Undoubtedly the teacher is a facilitator, teaches thecurriculum, provides the feedback, re-teach the lesson,and guide academic work, which common sense mayhave people believe that the teacher is the most influentialfactor on performance, this research found that parentalattitude has influence than that of the teacher’s behaviouron academic performance of 4th graders, and that self-esteem play a critical role to all other factors that explainperformance. The teachers’ role is critical as it relates tothe information, correctness of the materials, cognitivethinking on the material, and the child’s ability to interpretthe materials, but it is the internal concept of self thatdrives interaction with the intended knowledge, andprovides a high competence with the knowledge base.
Empirical studies have identified many other factorsthat account for better academic performance such as peerrelationship (Buote, 2001; (Montero, 1990); familycohesion (Caplan et al., 2002); importance his or herparents assign to study at home (Castejon and Perez,1998); parents’ level of learning than on their level ofincome (Llorente, 1990); teacher’s motivation and that ofthe student (Atkinson, 2000), and teacher’s expectancies(Rosenthal and Jacobson, 1966). Rightfully so theaforementioned issues could increase the explanatorypower of the current model, but collectively they wouldonly account for less than 26.4% of the variance inacademic performance as self-esteem, gender, parentaction, and teachers’ behaviour account for 73.6% of thevariability in academic performance of 4th graders inJamaica. Clearly, with 26.4% of academic performancestill unexplained by the present work, there are otherfactors that provide some explanations, with self-esteemexplaining 37.4% (or 50.8% of the explanatory power ofthe model) which would indicate that no other factorsinside or outside of the current model can be moreinfluential than self-esteem on academic performance.
According to Simon and Simon (1975), children’sself esteem experienced a self- fulfilling prophecy relatedto poor performance. One pupil in the current research,when asked ‘Do you think you are a bright girl or boy?’responded no and gave the reasons as “Because peopletell me I am dunce.” The child’s average for the term was40% and chose other as her future occupational type.With Simon and Simon’s perspective that a child’sparents and/or teacher can developed a negative view ofthe child over time, could explain why the aforementionedparticipant mentioned that she was complimented by perparents and teachers, but did not select ‘sometimes’ or‘most times’. Berk’s work (2003) supports that of Simonand Simon as he commented that the child will personallyadopt that view for him or herself and performaccordingly. Berk is absolutely correct as the identifiedparticipant in the current study had low score and wouldbe acting out the perception stereotype of her. The sameparticipant indicated that she was not confident in herclass performance; she sometimes got good scores, her

Asian J. Bus. Manage., 4(1): 36-57, 2012
54
parent call her names and consistently shouts at her. Theidentified pupil has been demoralized by the parentalinvolvement, and while she sometimes received goodscores, she is playing to the general script of a poorperformer (‘dunce’).
On the other hand, another student who attended thesame school as the perceived ‘dunce’ student gave “Myparents encouragement” makes her believing that she is abright pupil. This student had a grade of 72% and that sheis mostly complimented by her parents, sometimes by herteacher and wants to be a professional. A positive self-esteem, therefore, extends beyond academic performanceand the same can be said of a low self-esteem(Schmeichel et al., 2009, 1077; Baumeister et al., 2003;Campbell and Fehr, 1990; Brockner, 1983; Tharenou,1979). Baumeister et al. (2003) theorized that self-esteemis strongly associated with happiness, confidence, and amoderate relationship with academic performance. Theynoted that individuals with high self-esteem are likely todo better on the jobs and with particular tasks (workperformance) than those with low self-esteem. Self-esteem is not only influential task performance and jobperformance it is equally affect future occupationaldesires as was revealed by the current work. Hence, self-esteem is impacting on the student’s performance,charting a desired career path, stimulating ‘positiveness’about oneself as this is supported by good academicperformance.
CONCLUSION
Fourth graders academic performance cannot bedrastically change with a fundamental improvement intheir self-esteem. While the Ministry of Educationcontinues to formulate policies and identify newapproaches to the teaching the curriculum, it has failed tochart a pathway of self-esteem development. The childrenlow academic performance is mirrored on the poor self-esteem, poor supervision from teachers and parents andthis is compounded by the infrequent school attendance,nutrition, state of depression among the children andsocial isolation. The emerging findings and knowledgegleaned from this work present a critical guide and aframework for policy practitioners to implement measurethat can effectively address low performance among 4th
graders.
REFERENCES
Abbot, P., 1993. Academic performance of candidateswho sat A’Level Accounting. In: Bourne, P.A.(2004). An Inquiry of certain factors that influencethe academic performance of students who write theAdvanced Level Accounting Examination, 2004. TheUniversity of the West Indies, Mona, UnpublishedBachelor of Science Thesis. Kingston.
Alexander, T., 2001. Defining self-esteem. What is self-esteem and why does it matter? Self-esteem as an aidto understanding and recovery. Mental Healthcare,4(10): 332-335.
Atkinson, E., 2000. An Investigation into the relationshipbetween Teacher motivation and pupil motivation.Educ. Psychol. 20(1): 45-57.
Auer, C.J., 1992. A comparison of the locus of control offirst and second grade students in whole language,Basal reader and Eclectic instructional approachclassroom doctoral dissertation. North IllinoisUniversity. Dissertation Abstract International, 5(11):3856.
Babbie, E., 2007. The Practice of Social ResearchWadsworth. 10th Edn., A Division of ThomsonLearning, Inc., Ohio.
Balashow, Y. and A. Rosenberg, 2002. Philosophy ofScience Contemporary Readings. Routledge,London.
Bankston, C.L. and M. Zhou, 2002. Being well vs. doingwell: Self-esteem and school performance amongimmigrant and non-immigrant racial and ethnicgroups. Inter. Migration Rev., 36: 389-415.
Baumeister, R., 1996. Should Schools try to Boost SelfEsteem? American Educator Summer, pp; 9-42.
Baumeister, R.F., J.D. Campbell, J.I. Krueger andK.D. Vohs, 2003. Does high self-esteem cause betterperformance, interpersonal success, happiness, orhealthier lifestyles? Psychol. Sci. Public Interest,4(1): 1-44.
Baumeister, R.F., T.F. Heatherton and D.M. Tice, 1993.When ego threats lead to self-regulation failure:Negative consequences of high self-esteem. J.Person. Soc. Psychol., 64: 141-156.
Benham, M.J., 1993. Fostering Self-Motivated Behavior,Personal Responsibility and Internal Locus ofControl, Eugene, Oregon. Office of EducationalResearch and Improvement (ERIC DocumentReproduction No. ED 386 621).
Berk, L.E., 2003. Child Development. 6th Edn., Allynand Bacon, Boston.
Berg, B.L., 2001. Qualitative Research Methods for theSocial Sciences. 4th Edn., Allyn and Bacon, Boston.
Blascovich, J. and J. Tomaka, 1991. Measures ofSelf-Esteem. In: Robinson, J.P., P.R. Shaver andL.S. Wrights man, (Eds.), Measures of Personalityand Social Psychological Attitudes, Volume I.Academic Press, San Diego, CA.
Booth, W.C., G.G. Colomb and J.M. Williams, 2008. TheCraft of Research, 3rd Edn., Chicago UniversityPress, Chicago.
Bourne, P.A., 2004. An Inquiry of certain factors thatinfluence the academic performance of students whowrite the Advanced Level Accounting Examination,2004. The University of the West Indies, Mona,Unpublished Bachelor of Science Thesis, Kingston.

Asian J. Bus. Manage., 4(1): 36-57, 2012
55
Boxill, I., B. Lewis, R. Russell, A. Bailey, L. Waller,C. James, P. Martin, A. Gibbs and M.A. Seligson,2007. Political culture of democracy in Jamaica,2006 Americas Barameter. The University of theWest Indies, Mona, Kingston.
Buote, C.A., 2001. Relations of Autonomy andRelatedness to School Functioning and Psychologicaladjustment during adolescence. DissertationAbstracts International Section A: Humanities andSocial Science
Brockner, J., 1983. Low self-esteem and behaviouralplasticity: Some implications. In: L. Wheeler and P.Shaver, (Eds.), Review of Personality and SocialPsychology, Beverly Hills, CA: Sage, 4: 237-271.
Brandon, N., 1994. The Six Pillars of Self-Esteem.Bantam, New York.
Brandon, N., 1969. The Psychology of Self-Esteem.Bantam, New York.
Bryman, A., 2001. Social Research Methods. OxfordUniversity Press, Oxford.
Burnham, P., K. Gilland, W. Grant and Z. Layton-Henry,2004. Research Methods in Politics. PalgraveMacmillan, New York.
Caplan, S., C. Henderson, J. Henderson and D. Fleming,2002. Socioemotional factors contributing toadjustment among early-entrance college students.Gifted Child Quart., 46(2): 124-134.
Cambridge University, 1991-2004. Cambridge-Examination Reports. Cambridge University Press,London.
Campbell, J.D. and B.A. Fehr, 1990. Self-esteem andperceptions of conveyed impressions: Is negativeaffectivity associated with greater realism? J. Person.Soc. Psychol., 58: 122-133.
Castejon, J.L. and A.M. Perez, 1998. A causativeexplicative model of about the influence of psycho-social variables on academic achievement. Bordón,50: 171-185.
Carr, M., J. Borkowski and S. Maxwell, 1991.Motivational components of underachievers. Dev.Psychol., 27: 108-118.
Coppersmith, M.V., 1981. The Antecedents of Self-Esteem. Freeman, San Francisco.
Cooley, C.H., 1902. Human Nature and the Social Order.Scribner’s, New York.
Covington, M.V., 1989. Self-esteem and Failure inSchool. The Social Importance of Self-Esteem.University of Cambridge Press, Berkeley, CA.
Crotty, M., 2005. The Foundations of Social Research:Meaning and Perspective in the Research Process.London, Sage.
Davis, D., 2005. Business Research for Decision Making.6th Edn., Thomson South-Western, Ohio.
Davis, R., 2004. Task Force on Educational Reform,Jamaica: A Transformed Educational System. FinalReport. Ministry of Education, Youth and Culture,Kingston.
Davies, J. and I. Brember, 1999. Reading andmathematics attainments and self-esteem in years 2and 6-an eight-year cross-sectional study. Educ.Stud., 25: 145-157.
Diaz, J.O.P., 1984. A cross-cultural study of the reliabilityof the coopersmith self esteem inventory. Educ.Psychol. Measur. 44: 575-581.
Douglas, L., 2010. Bad News for Grade 4 Literacy: JTAsays Test Results Demoralizing to Teachers. JamaicaObserver, Kingston.
Gecas, S.V. and M.A. Seff, 1990. Families andadolescents: A review of the 1980s. J. MarriageFamily, 52: 941-58.
Georgiou, S., et al., 2002. Teachers attributions of studentfailure and teacher behavior toward the failingstudent. Psychol. Schools, 39(5): 583-596.
Goel, M.L., 1988. Political Science Research: A MethodsHandbook. Iowa State University Press, Iowa.
Hakim, C., 1987. Research Design: Strategies andChoices in the Design of Social Research. UnwinHyman, London.
Hansford, B.C. and J.A. Hattie, 1982. The relationshipbetween self and achievement/performancemeasures. Rev. Educ. Res., 52: 123-142.
Hartup, W.W., 1983. Peer Relations. In: Mussen, P. andE.M. Hetherington, (Eds.), Manual of ChildPsychology. 4th Edn., John Wiley & Sons, NewYork.
Hattie, J., 1992. Self-concept, Hillsdale, NJ: Haralambus, M. and M. Holborn, 2002. Sociology:
Themes and Perspective. University Tutorial Press,London.
Harriott, A., 2004. The Jamaican Crime Problem: SomePolicy Consideration. In: Harriott, A., F. Brathwaiteand S. Wortley, (Eds.), Crime and Criminal Justice inthe Caribbean. Arawak Publishers, Kingston, pp:238-264.
Howerton, D.L., J.M. Enger and C.R. Cobbs, 1994. Self-esteem and achievement of at-risk adolescent Blackmales. Res. Schools, 1: 23-27.
James, W., 1983. The Principles of Psychology. HarvardUniversity Press, Cambridge, MA.
Katz, L.G., 1993. Distinction between Self Esteem andNarcissism: Implications for Practice. Perspectivesfrom ERIC/EEC, Monograph Series, No.5 (ERIC.Document Reproduction No. ED 363452.
Klein, J.D. and J. Keller, 1990. Influence of StudentAbility. Locus of control and type of instructionalcontrol performance and confidence. J. Educ. Res.,83(3): 14046.
Kugle, C.L., R.O. Clements and P.M. Powell, 1983. Leveland stability of self-esteem in relation to academicbehaviour of second graders. J. Person. Soc. Psychol.44: 201-207.
Kuhn, T.S., 1996. The Structure of Scientific Revolutions,3rd Edn., University of Chicago Press, Chicago.

Asian J. Bus. Manage., 4(1): 36-57, 2012
56
Learner, B., 1996. Self-Esteem and Excellence: TheChoice and the Paradox. American Educator,Summer, 9-13.
Llorente, M., 1990. School Failure and Social Origin.Universidad Ponteficia de Salamanca, Tesina.
Lockett, C.T. and J.P. Harrell, 2003. Racial Identity, self-esteem and academic achievement: Too littlesupporting data. J. Black Psychol., 29(3): 325-336.
Madon, S., L. Jussim and J. Eccles, 1997. In Search of thepowerful self fulfilling prophecy. J. Person. Soc.Psychol.
Marchesi, A. and E. Martin, 2002. Evaluation inSecondary Education. Snapshot from a ControversialEra. Institution IDEA, S.M., Madrid.
Ministry of Education (MOE), 2009. Grade Four LiteracyTest Results for Public Schools by Region. MOE,Kingston.
Ministry of Education, Youth and Culture, 2004. TheDevelopment of Education: National Report onJamaica, 2004. Kingston: Ministry of Education,Youth and Culture. Retrieved from: http://www.ibe.unesco.org/International/ICE47/English/Natreps/reports/jamaica.pdf, (Accessed on: July 14, 2011)
Moos, R.H. and B.S. Moos, 1976. A typology of socialenvironment. Family Process, 15(4): 357-371.
Montero, M.C., 1990. Predicting academic performance.A study of intervening variables in a sample of 8th
grade students with follow-up in the 10th grade].Tesis Universidad Pontifica de Salamanca.
Neuman, W.L., 2003. Social Research Methods:Qualitative and Quantitative Approaches, 5th Ed.Pearson Education, New York.
Pearlin, L.I., M.A. Lieberman, E.G. Menaghan andJ.T. Mullan, 1981. The stress process. J. Health Soc.Behav, 22: 337-356.
Planning Institute of Jamaica (PIOJ), 2000-2011.Economic and Social Survey, Jamaica, 2001-2010.PIOJ, Kingston.
Polgar, S. and S.A. Thomas, 2008. Introduction toResearch in the Health Sciences, 5th Edn., ChurchillLivinstone Elsevier, Philadelphia.
Polit, D.F., 1996. Data Analysis and Statistics for NursingResearch. Appleton and Lange Publisher, Stamford.
Powell, L.A., P. Bourne and L. Waller, 2007. ProbingJamaica’s Political Culture: Main Trends in the July-August 2006 Leadership and Governance Survey.Department of Government, the University of theWest Indies, Mona, Kingston.
Purkey, W., 1988. An Overview of Self-Concept Theoryfor Counselors. ERIC Clearing House on Counselingand Personal Services, Ann Arbor, Mich. (AnERIC/CAPS Digest: ED 304630). Retrieved form:http://www.edpsycinteractive.org/files/selfconc.html.
Purkey, W.W., 1970. Self-Concept and SchoolAchievement. Englewood Cliffs, Prentice-Hall, NJ.
Rabinow, P. and W.M. Sullivan, 1979. Interpretive SocialScience: A Reader. University of California Press,Los Angeles.
Rosenberg, M., 1965. Society and the Adolescent Self-Image. Princeton, Princeton University Press, NJ.
Rosenberg, M., 1979. Conceiving the Self. Basic Books,New York.
Rosenthal, R. and L. Jacobson, 1966. Pygmalion in theClassroom: Teacher Expectation and Pupils’Intellectual Development. Holt, New York.
Roxborough-Wright, P., 2002. Grade 4 Literacy test saidnot Effective. Jamaica Observer, Kingston.
Scarr, S. and W. Thompson, 1994. Effects of maternalemployment and nonmaternal infant care ondevelopment at two and four years. Early Dev.Parenting, 3(2): 113-123.
Schmeichel, B.J., M.T. Gailliot, E.A. Filardo,I. McGregor, S. Gitter and R.F. Baumeister, 2009.Terror management theory and self-esteem revisited:The roles of implicit and explicit self-esteem inmortality salience effects. J. Pers. Soc. Psychol.,96(5): 1077-1087.
Sekaran, U., 2006. Research Methods for Business: ASkill Building Approach, 4 Edn., Wiley India, pp: 35.
Schlick, M., 1979. Philosophical Paper. Mulder, H.L. andB.E.B. Van De Velde-Schlick, (Eds.), Reidel,Dordrecht, 2: 210-224.
Silverman, D., 2005. Interpreting Qualitative Data:Methods for Analyzing Talk, Text and Interaction.2nd Edn., Sage Publication, London, pp: 124.
Simon, W.E. and M.G. Simon, 1975. Self-esteem,intelligence and standardized academic achievement.Psychology Schools, 12: 97-100.
Solley, C.M. and R. Stagner, 1956. Effects of magnitudeof temporal barriers. Types of perception of self. J.Experimental Psychol. 51: 62-70.
Statistical Institute of Jamaica (STATIN), 1989-2000.Statistical Yearbook of Jamaica, 1990-1999.STATIN, Kingston.
Statistical Institute of Jamaica (STATIN). (2002).Population Census, Jamaica, 2001. STATIN,Kingston.
Statistical Institute of Jamaica (STATIN), 1999.Pocketbook of Statistics, Jamaica, 1999. STATIN,Kingston.
Stipek, D.K., 1984. The Development of AchievementMotivation. In: R. Ames, and C. Ames, (Eds.),Research on Motivation and Education. Vol. 1,Orlando, Academic Press, Florida.
Tharenou, P., 1979. Employee self-esteem: A review ofthe literature. J. Vocational Behaviour, 15: 316-346.
Tice, D.M., 1993. The Social Motivations of People withLow Self-Esteem. pp: 37-53 in Self-Esteem: Themuch interpretation, too little supporting data. J.Black Psychol., 29(3): 325-336.
Van Tuinen, M. and N.V. Ramanaiah, 1979. Amultimethod analysis of selected self-esteemmeasures. J. Res. Personality, 13: 16-24.

Asian J. Bus. Manage., 4(1): 36-57, 2012
57
Wallace, H.M. and R.F. Baumeister, 2002. Theperformance of narcissists rises and falls withperceived opportunity for glory. J. Personality Soc.Psychology, 82: 819-834.
Weber, M., 1949. The Methodology of the SocialSciences, Trans. Shils, E. and H. Finch, (Eds.), FreePress, New York.
Weber, M., 1974. Subjectivity and Determinism. In:Giddens, A., (Ed.), Positivism and Sociology.Heinemann, London, pp: 23-32.
Weber, M., 1981. Some Categories of InterpretativeSociology. Sociological Quarterly, 22: 151-180.
Wilson, T.D., 2002. Strangers to Ourselves: Discoveringthe Adaptive Unconscious. Harvard Univ. Press,Cambridge, MA.
Wylie, R.C., 1979. The Self-Concept: Theory andResearch on Selected Topics. University of NebraskaPress, Lincoln, Vol. 2.
Yabiku, S.T., W.G. Axinn and A. Thornton, 1999. Familyintegration and children’s self-esteem. Am. J. Soc.104: 1494.
Yogev, Y. and Y. Ilan, 1987. Does self-esteem affecteducation aspirations? The case of the ethnic enclave.Urban Educ., 22: 182-202.