sensors for smartcity
TRANSCRIPT

Urban pipelines reliability monitoring,failure prediction and preventive maintenance
IoT
The Technology of Smart City

THE TEAM
2
Sergey Z.Gumerov
Sales & Marketing
10 years in IBM (SW, GBS)5 year in Orange (Equant) telecom
EugenySvalov
Finance & Operations
15 years in telecom business Orange (Equant)
Vladimir Mikhelson-Aladinsky
Research & Engineering
15 years in pipeline operators Transneft, Gasprom

THE GREAT TEAM
3
25 highly motivated and energized
5 – mechanical engineers7 – mathematician engineers 5 – software engineers5 – projects & operations
The goal generates the Team:...to boost the world by making math modeling great again…
THE TECHNOLOGY
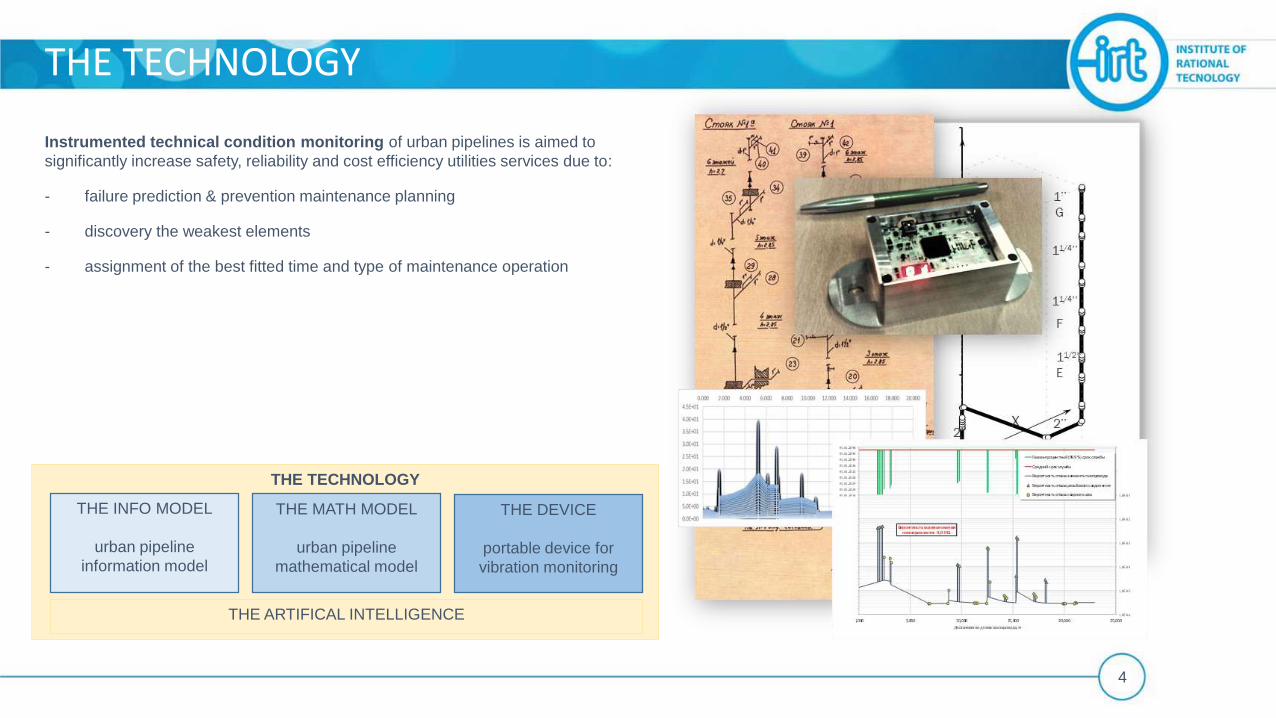
Instrumented technical condition monitoring of urban pipelines is aimed to
significantly increase safety, reliability and cost efficiency utilities services due to:
- failure prediction & prevention maintenance planning
- discovery the weakest elements
- assignment of the best fitted time and type of maintenance operation
THE TECHNOLOGY
4
THE INFO MODEL
urban pipeline
information model
THE MATH MODEL
urban pipeline
mathematical model
THE DEVICE
portable device for
vibration monitoring
THE ARTIFICAL INTELLIGENCE
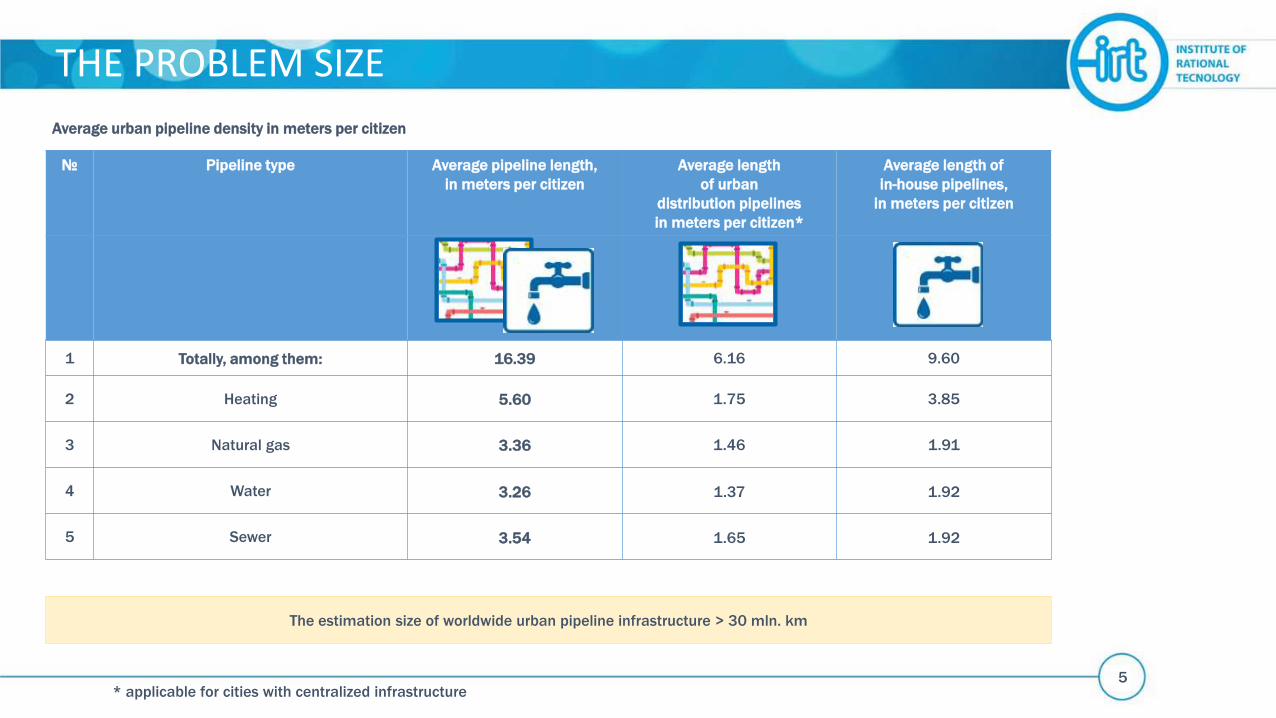
№ Pipeline type Average pipeline length,
in meters per citizen
Average length
of urban
distribution pipelines
in meters per citizen*
Average length of
in-house pipelines,
in meters per citizen
1 Totally, among them: 16.39 6.16 9.60
2 Heating 5.60 1.75 3.85
3 Natural gas 3.36 1.46 1.91
4 Water 3.26 1.37 1.92
5 Sewer 3.54 1.65 1.92
Average urban pipeline density in meters per citizen
* applicable for cities with centralized infrastructure5
THE PROBLEM SIZE
The estimation size of worldwide urban pipeline infrastructure > 30 mln. km
SIZE OF URBAN PIPELINE INFRASTRUCTURE
THE PROBLEM COST
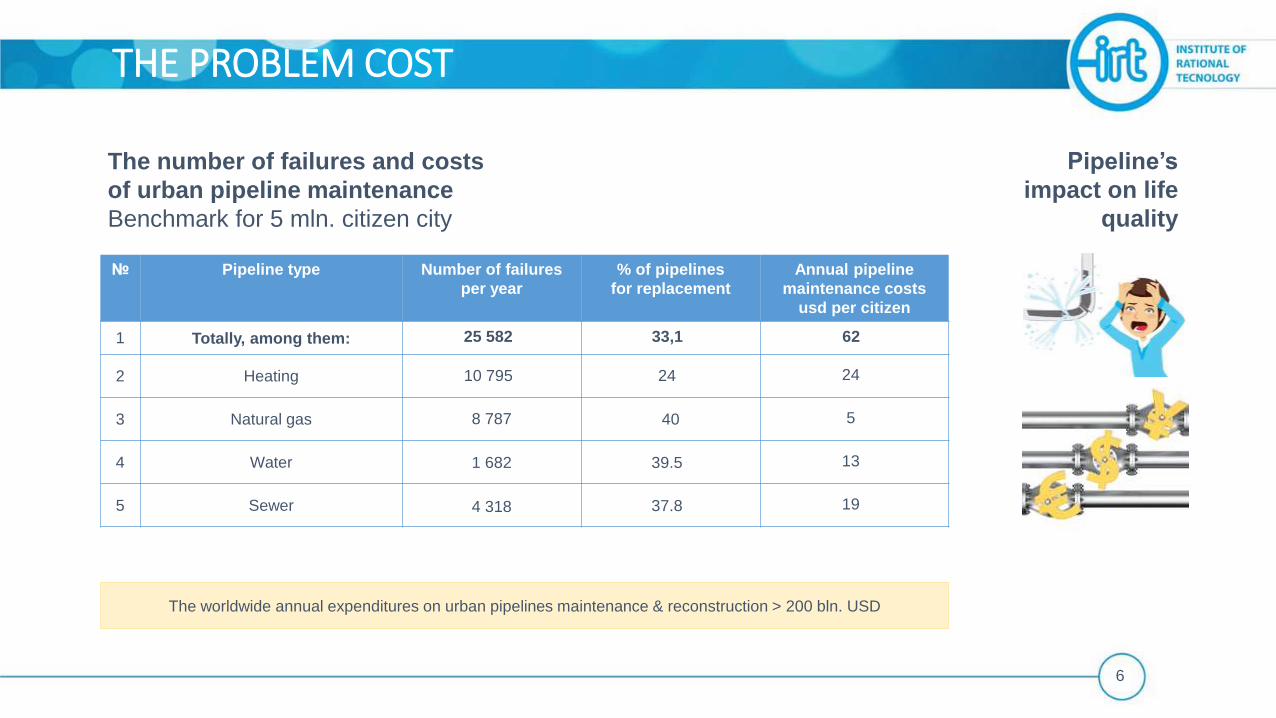
The number of failures and costs
of urban pipeline maintenance
Benchmark for 5 mln. citizen city
6
№ Pipeline type Number of failures
per year
% of pipelines
for replacement
Annual pipeline
maintenance costs
usd per citizen
1 Totally, among them: 25 582 33,1 62
2 Heating 10 795 24 24
3 Natural gas 8 787 40 5
4 Water 1 682 39.5 13
5 Sewer 4 318 37.8 19
Pipeline’s
impact on life
quality
The worldwide annual expenditures on urban pipelines maintenance & reconstruction > 200 bln. USD
THE CAUSES OF THE PROBLEM
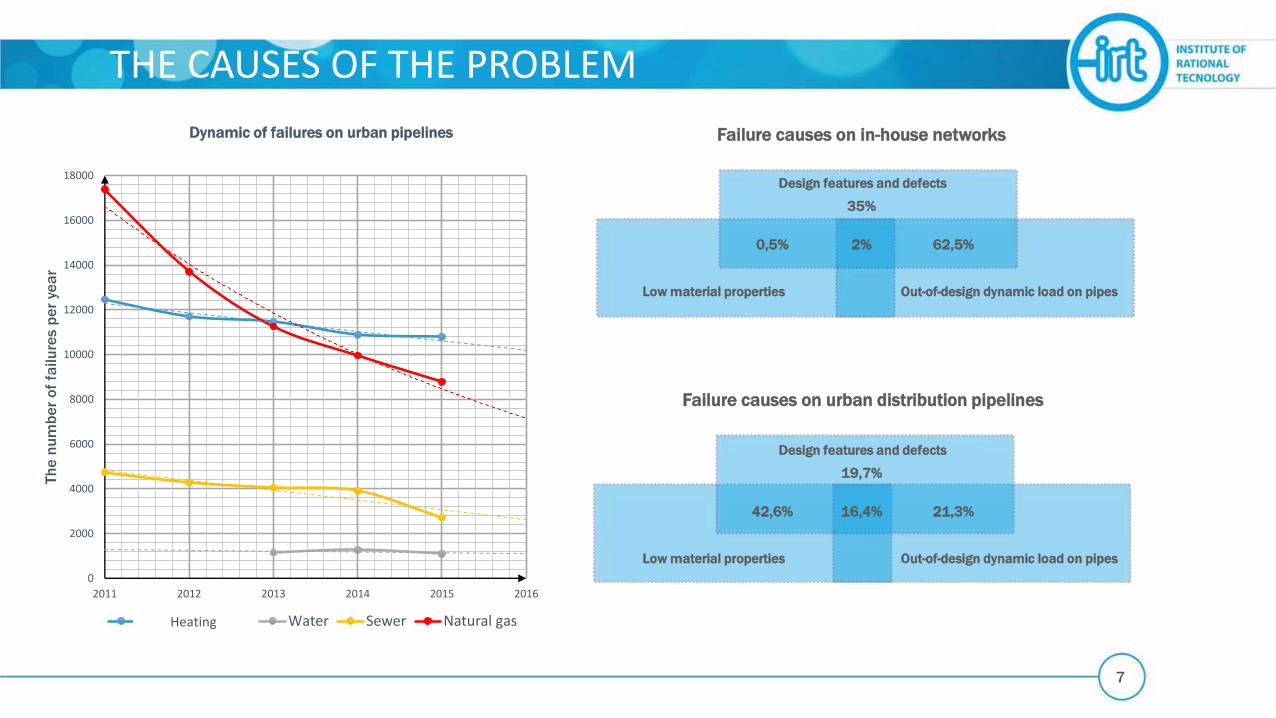
Failure causes on in-house networks
0
2000
4000
6000
8000
10000
12000
14000
16000
18000
2011 2012 2013 2014 2015 2016
Th
e n
um
be
r o
f fa
ilu
res p
er
yea
r
Теплоснабжение Water Sewer Natural gasHeating
Dynamic of failures on urban pipelines
Failure causes on urban distribution pipelines
7
Design features and defects
Low material properties Out-of-design dynamic load on pipes
35%
2%0,5% 62,5%
Design features and defects
Low material properties Out-of-design dynamic load on pipes
19,7%
16,4%42,6% 21,3%
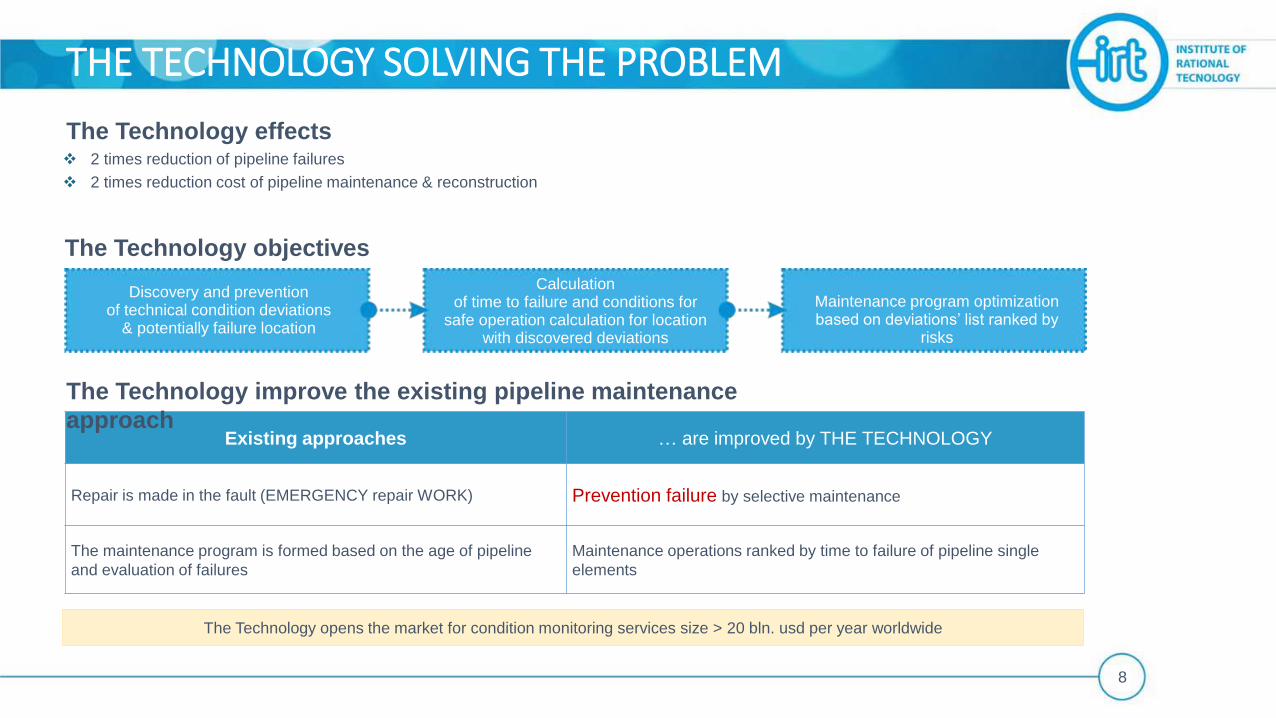
Existing approaches … are improved by THE TECHNOLOGY
Repair is made in the fault (EMERGENCY repair WORK) Prevention failure by selective maintenance
The maintenance program is formed based on the age of pipeline
and evaluation of failures
Maintenance operations ranked by time to failure of pipeline single
elements
2 times reduction of pipeline failures
2 times reduction cost of pipeline maintenance & reconstruction
The Technology effects
The Technology objectives
The Technology improve the existing pipeline maintenance
approach
8
THE TECHNOLOGY SOLVING THE PROBLEM
Discovery and preventionof technical condition deviations
& potentially failure location
Calculation of time to failure and conditions for
safe operation calculation for location with discovered deviations
Maintenance program optimization based on deviations’ list ranked by
risks
The Technology opens the market for condition monitoring services size > 20 bln. usd per year worldwide

The purpose and operating
conditions
Design parameters of the
pipeline
The characteristics of the
materials
The actual load on the
pipeline
Fa
cto
rs
The pumped product (environment)
Performance design
Temperatures
Soil conditions
Working pressure
The seasonal temperature
difference
Year of construction
The magnitude of the external loads
Impact from "third party"
Diameter
Wall thickness
Orientation in space
The location of subassemblies
and pins
The location, type, and
parameters of defects and
deviations
Tensile strength
Yield strength
The modulus of elasticity
The coefficient of strain
hardening
The safety factor for
strength
Distribution of accelerations
at the distance of the pipeline
Distribution of dynamic loads
on the distance of the
pipeline
Da
taS
ou
rce
Electronic pipeline passports
Design documentation
Operational documentation
Standards & Regulations
Electronic pipeline passports
Design documentation
Operational documentation
Database of mechanical
properties of materials
Standards
Technical requirements
Portable device for
measuring dynamic
characteristics and
parameters of the pipeline
The findings and diagnostic
tests
FACTORS THE TECHNOLOGY COVERED
9
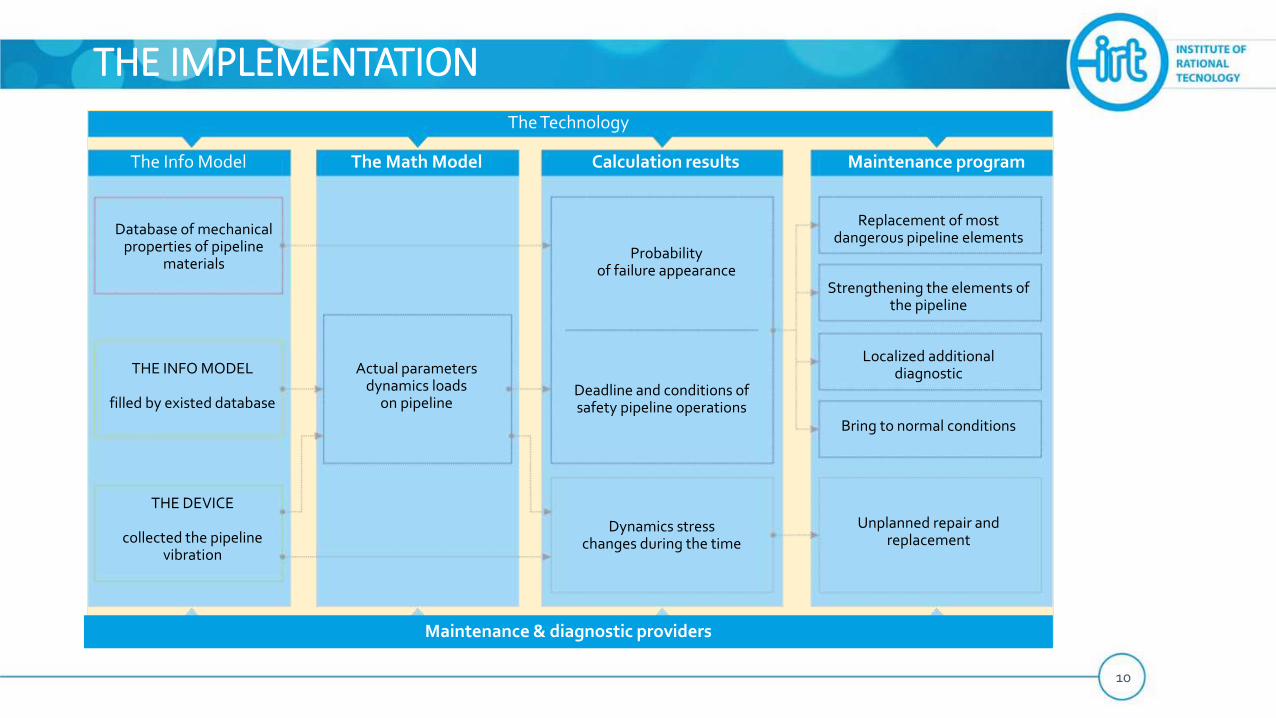
THE IMPLEMENTATION The Technology
The Info Model The Math Model Calculation results Maintenance program
Database of mechanical properties of pipeline
materials
THE INFO MODEL
filled by existed database
THE DEVICE
collected the pipeline vibration
Actual parameters dynamics loads
on pipeline
Probability of failure appearance
Deadline and conditions of safety pipeline operations
Dynamics stresschanges during the time
Replacement of most dangerous pipeline elements
Strengthening the elements of the pipeline
Localized additional diagnostic
Bring to normal conditions
Unplanned repair and replacement
Maintenance & diagnostic providers
10
1
2
3
4 5
0
0,0005
0,001
0,0015
0,002
0,0025
0,003
0,0035
0,004
0,001 0,01 0,1 1 10 100 1000
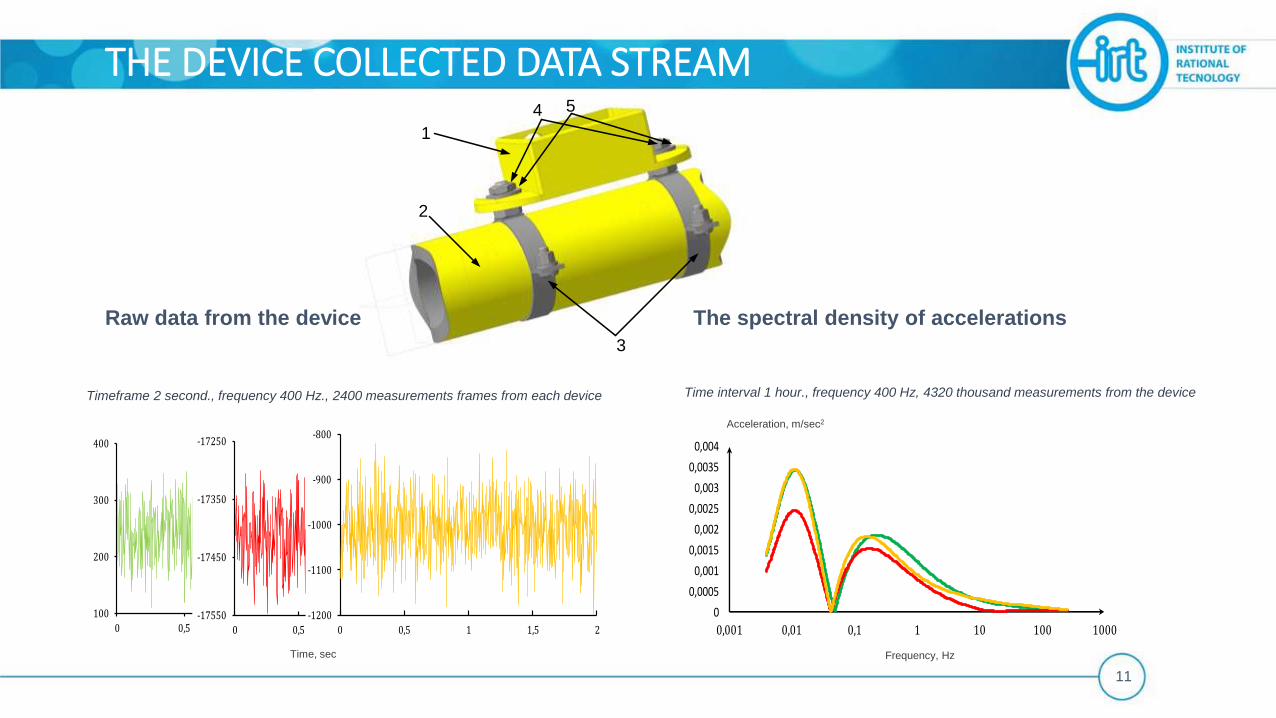
Time interval 1 hour., frequency 400 Hz, 4320 thousand measurements from the device
Frequency, Hz
Acceleration, m/seс2
Timeframe 2 second., frequency 400 Hz., 2400 measurements frames from each device
Time, sec
100
200
300
400
0 0,5 1 1,5 2-17550
-17450
-17350
-17250
0 0,5 1 1,5 2
-1200
-1100
-1000
-900
-800
0 0,5 1 1,5 2
THE DEVICE COLLECTED DATA STREAM
Raw data from the device The spectral density of accelerations
11
-0,006
-0,005
-0,004
-0,003
-0,002
-0,001
0
0,001
0,002
0,003
0,004
0 5 10 15 20 25
-0,008
-0,006
-0,004
-0,002
0
0,002
0,004
0,006
0 5 10 15 20 25
-0,014
-0,012
-0,01
-0,008
-0,006
-0,004
-0,002
0
0,002
0,004
0,006
0,008
0 5 10 15 20 25
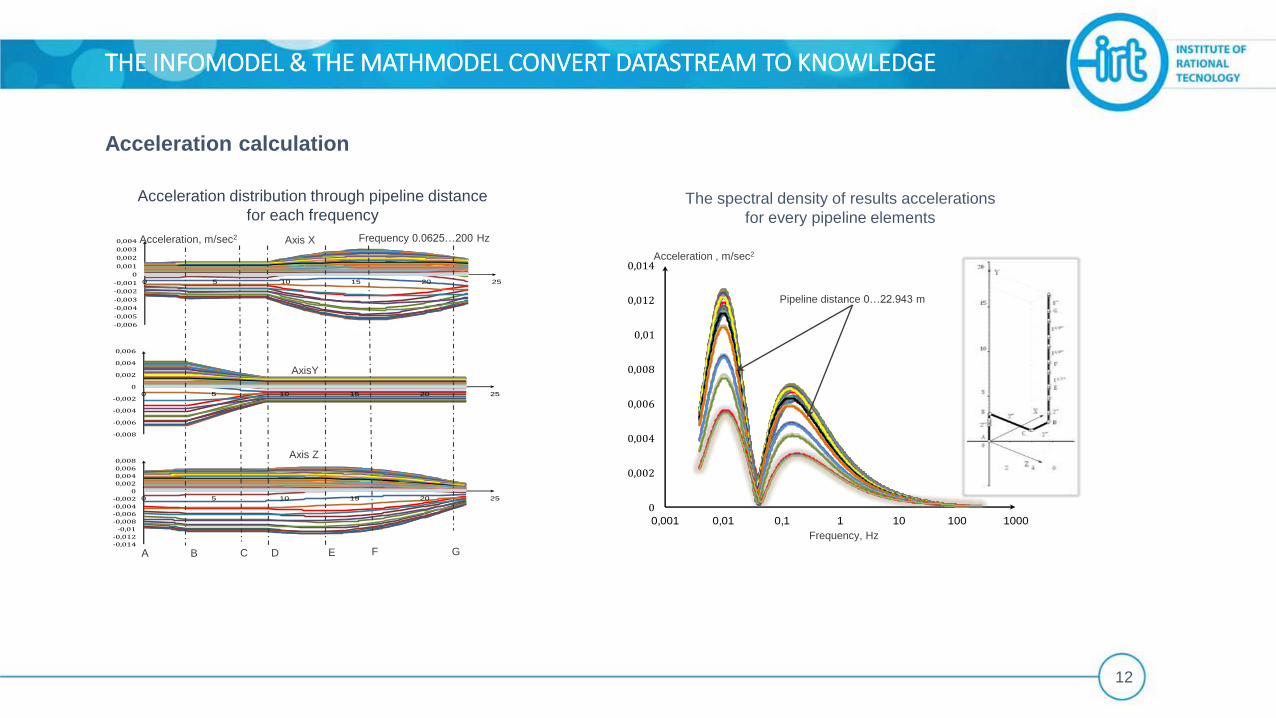
Acceleration distribution through pipeline distance
for each frequency
Acceleration, m/sec2 Axis X
AxisY
Axis Z
Frequency 0.0625…200 Hz
EBА DC F G
0
0,002
0,004
0,006
0,008
0,01
0,012
0,014
0,001 0,01 0,1 1 10 100 1000
The spectral density of results accelerations
for every pipeline elements
Frequency, Hz
Acceleration , m/sec2
Pipeline distance 0…22.943 m
THE INFOMODEL & THE MATHMODEL CONVERT DATASTREAM TO KNOWLEDGE
Acceleration calculation
12
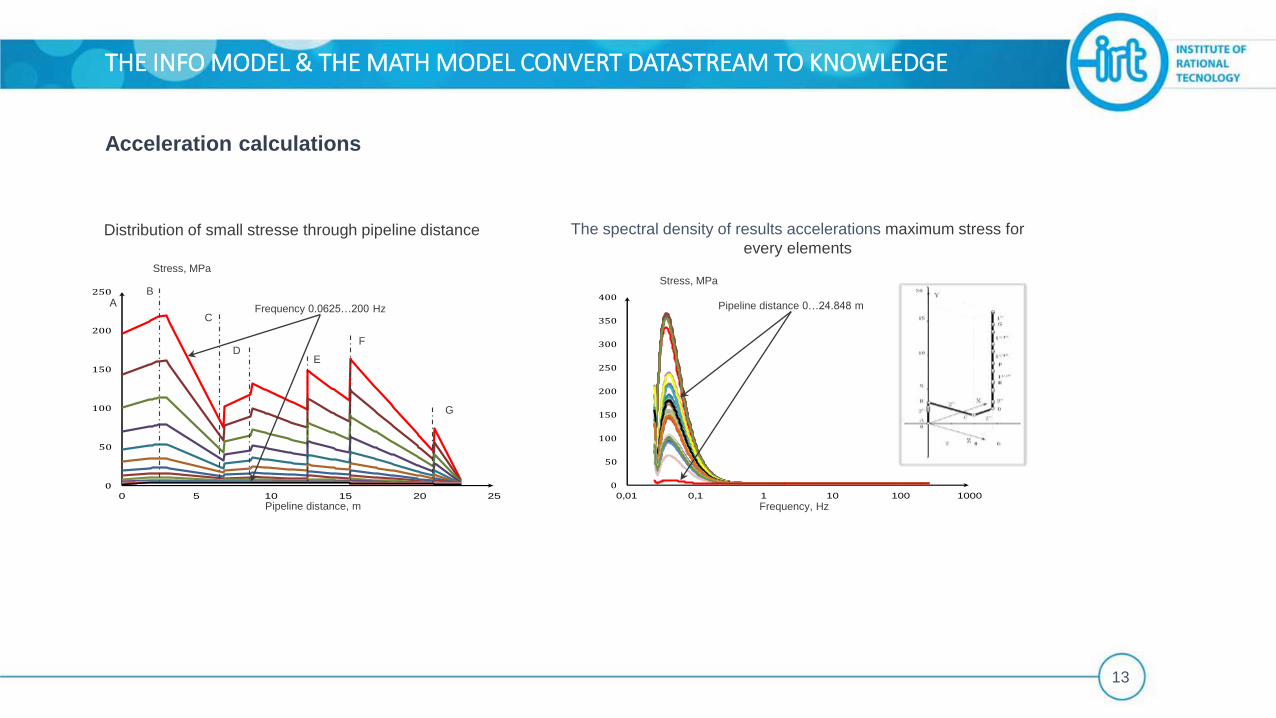
Distribution of small stresse through pipeline distance
0
50
100
150
200
250
0 5 10 15 20 25
Частота 0.0625 ...
Pipeline distance, m
Stress, MPa
Frequency 0.0625…200 Hz
E
BА
D
C
F
G
The spectral density of results accelerations maximum stress for
every elements
0
50
100
150
200
250
300
350
400
0,01 0,1 1 10 100 1000
Frequency, Hz
Stress, MPa
Pipeline distance 0…24.848 m
THE INFO MODEL & THE MATH MODEL CONVERT DATASTREAM TO KNOWLEDGE
Acceleration calculations
13
1E-20
1E-18
1E-16
1E-14
1E-12
1E-10
1E-08
1E-06
1E-04
1E-02
1E+00
0,01 0,1 1 10 100 1000
0
50
100
150
200
250
300
1,E+00 1,E+04 1,E+08 1,E+12 1,E+16 1,E+20 1,E+24
0
50
100
150
200
250
300
0,01 0,1 1 10 100 1000
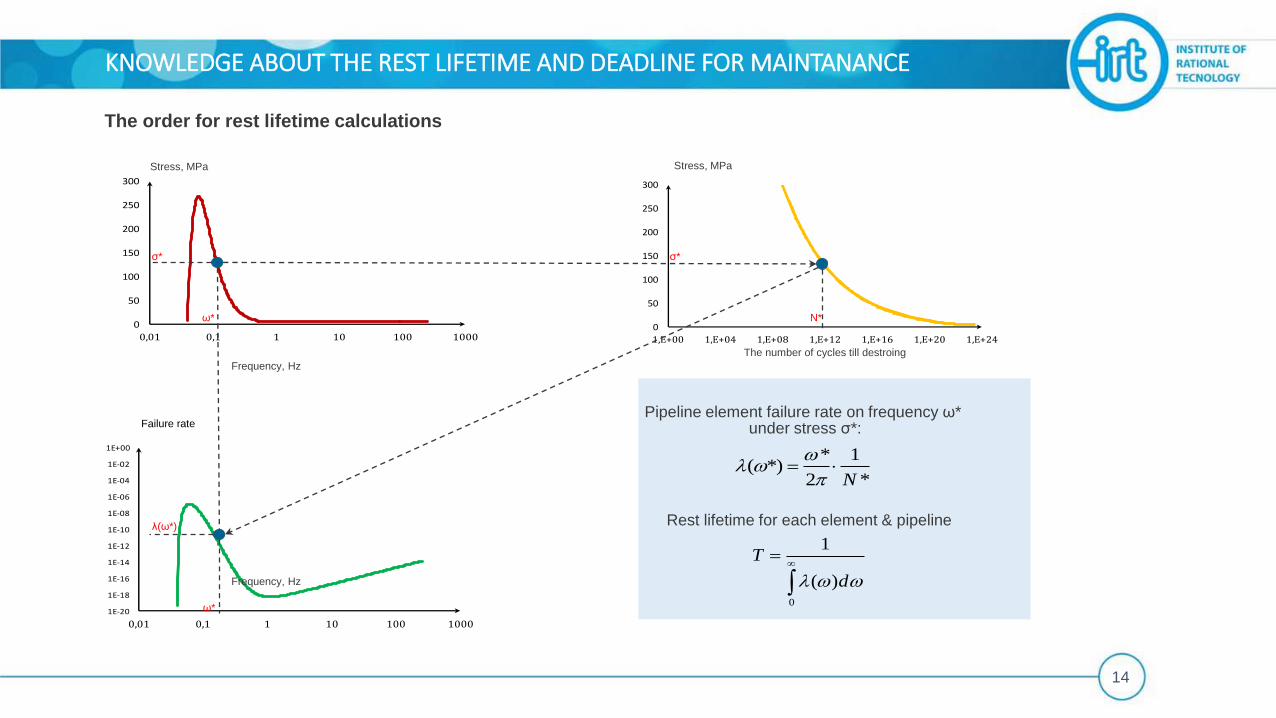
The number of cycles till destroing
Stress, MPa
Failure rate
ω* N*
λ(ω*)
ω*
* 1( *)
2 *N
Pipeline element failure rate on frequency ω*under stress σ*:
Rest lifetime for each element & pipeline
0
1
( )
T
d
σ* σ*
KNOWLEDGE ABOUT THE REST LIFETIME AND DEADLINE FOR MAINTANANCE
The order for rest lifetime calculations
14
Stress, MPa
Frequency, Hz
Frequency, Hz

Вероятность возникновения неисправности- 0,0192
1,0E-06
1,0E-05
1,0E-04
1,0E-03
1,0E-02
1,0E-01
1,0E+00
1,0E+01
01.01.1936
01.01.1940
01.01.1944
01.01.1948
01.01.1952
01.01.1956
01.01.1960
01.01.1964
01.01.1968
01.01.1972
01.01.1976
01.01.1980
01.01.1984
01.01.1988
01.01.1992
01.01.1996
01.01.2000
01.01.2004
01.01.2008
01.01.2012
01.01.2016
01.01.2020
01.01.2024
01.01.2028
01.01.2032
01.01.2036
01.01.2040
01.01.2044
01.01.2048
0,000 5,000 10,000 15,000 20,000 25,000
Дистанция по длине газопровода, м
Гамма-процентный (99.9 %) срок службы
Средний срок службы
Вероятность отказа элемента газопровода
Вероятность отказа резьбового соединения
Вероятность отказа сварного шва
Pipeline distance, m
Lifetime The probability of failure
KNOWLEDGE TO ACTION
15
gamma-percent (99,9%) lifetime
average lifetime
failure probability for each element
failure probability for screw joint
failure probability for welding joint
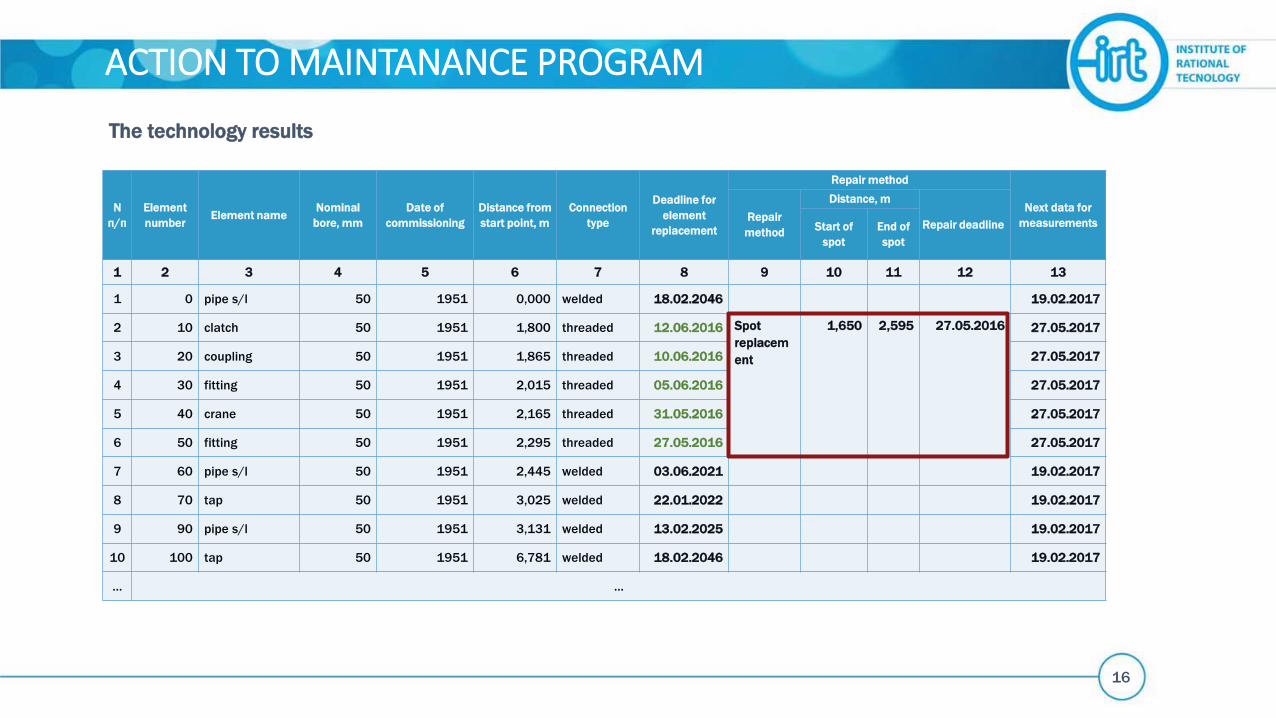
According to the results of application of THETECHNOLOGY it is recommended to replace 11of the structural elements of the pipeline withinsix months. Other areas and structural elementsof the pipeline under the existing loadingconditions will operate trouble-free until at least2020. The diagnosis should be regular andtimely commit changes external influences.
Action
Knowledge
Probability pipeline
failure – 1,92%
Lifetime for the weakest element – 1 month
Lifetime for the most elements – 30 years
Motion visualization
N
п/п
Element
numberElement name
Nominal
bore, mm
Date of
commissioning
Distance from
start point, m
Connection
type
Deadline for
element
replacement
Repair method
Next data for
measurementsRepair
method
Distance, m
Repair deadlineStart of
spot
End of
spot
1 2 3 4 5 6 7 8 9 10 11 12 13
1 0 pipe s/l 50 1951 0,000 welded 18.02.2046 19.02.2017
2 10 clatch 50 1951 1,800 threaded 12.06.2016 Spot
replacem
ent
1,650 2,595 27.05.2016 27.05.2017
3 20 coupling 50 1951 1,865 threaded 10.06.2016 27.05.2017
4 30 fitting 50 1951 2,015 threaded 05.06.2016 27.05.2017
5 40 crane 50 1951 2,165 threaded 31.05.2016 27.05.2017
6 50 fitting 50 1951 2,295 threaded 27.05.2016 27.05.2017
7 60 pipe s/l 50 1951 2,445 welded 03.06.2021 19.02.2017
8 70 tap 50 1951 3,025 welded 22.01.2022 19.02.2017
9 90 pipe s/l 50 1951 3,131 welded 13.02.2025 19.02.2017
10 100 tap 50 1951 6,781 welded 18.02.2046 19.02.2017
… …
The technology results
16
ACTION TO MAINTANANCE PROGRAM

Te
st №
1Te
st №
2
Te
st №
3
The weakening of the threaded connections of the tubing leads to a decrease in rigidity in connection with there
is a significant increase of vibration amplitude (change in vibration characteristics)
17
THE FIELD TESTING

19
THE COMPETITORS
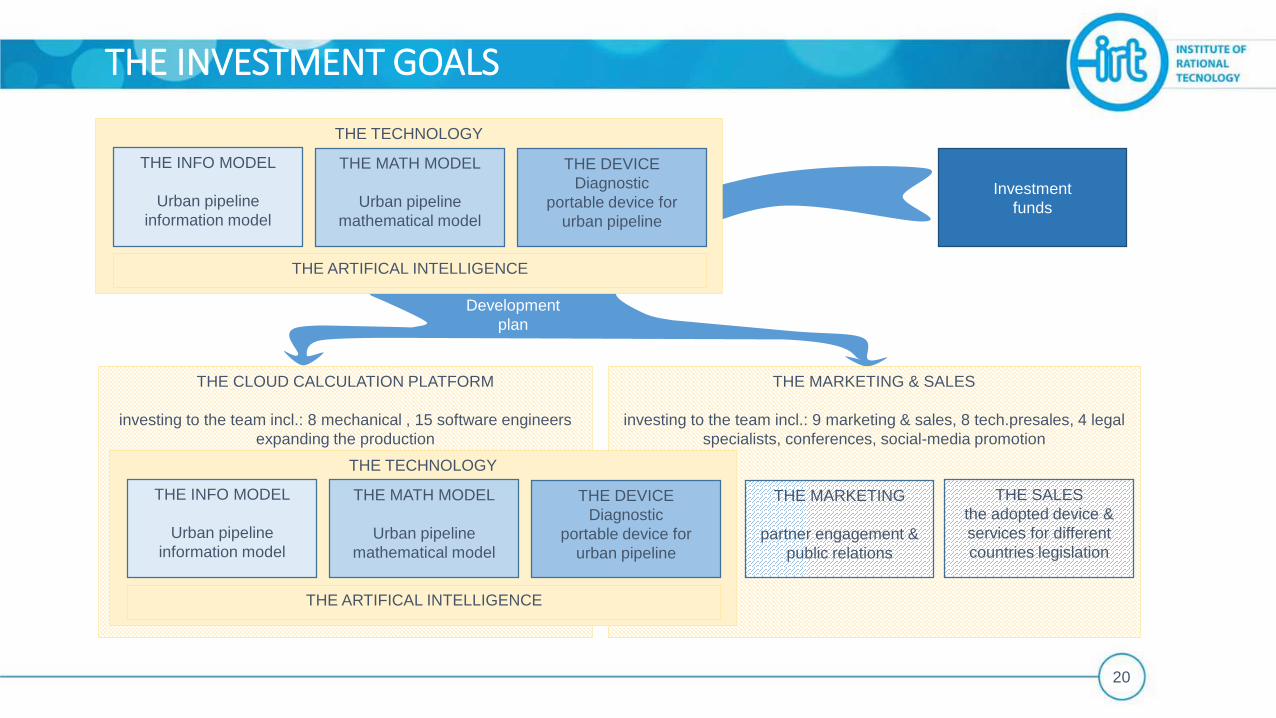
THE MARKETING & SALES
investing to the team incl.: 9 marketing & sales, 8 tech.presales, 4 legal
specialists, conferences, social-media promotion
THE CLOUD CALCULATION PLATFORM
investing to the team incl.: 8 mechanical , 15 software engineers
expanding the production
20
THE INVESTMENT GOALS
THE TECHNOLOGY
THE INFO MODEL
Urban pipeline
information model
THE MATH MODEL
Urban pipeline
mathematical model
THE DEVICE
Diagnostic
portable device for
urban pipeline
THE ARTIFICAL INTELLIGENCE
THE TECHNOLOGY
THE INFO MODEL
Urban pipeline
information model
THE MATH MODEL
Urban pipeline
mathematical model
THE DEVICE
Diagnostic
portable device for
urban pipeline
THE ARTIFICAL INTELLIGENCE
THE SALES
the adopted device &
services for different
countries legislation
THE MARKETING
partner engagement &
public relations
Development
plan
Investment
funds

THANK YOUSergey Z. Gumerov
Institute of Rational Technology
Levashovsky, 24
Russia, Saint-Petersburg
21