serving & sharing with passion market insights
TRANSCRIPT
1, rue Houdart de Lamotte – 75015 Paris – FranceTel. +33 6 11 96 33 78
Email : [email protected] – Website : www.smart-pharma.com
Serving & Sharing with Passion
October 2021PART 1
20th Anniversary
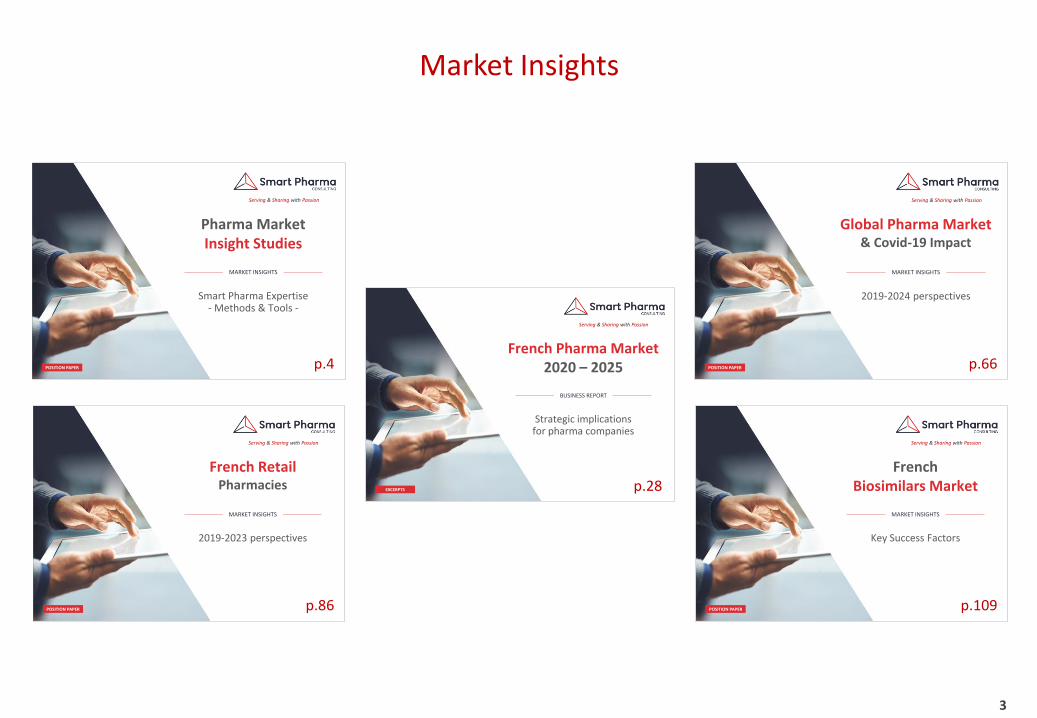
Pharma Market Insight Studies
French Pharma Market 2020 – 2025
Global Pharma Market & Covid-19 Impact
French Retail Pharmacies
French Biosimilars Market
Market InsightsConcepts – Methods – Tools
COLLECTION 2021
▪ This “2021 Collection” will be released in six parts:
1. Market Insights
2. Strategy & Market Access
3. Medical Affairs & Marketing
4. Sales Force Effectiveness
5. Management
6. Training Programs
▪ We hope that this 20th anniversary “gift” will be of high value to you
▪ We will keep on sharing with you our thoughts and recommendations in the years to come
Jean-Michel Peny
2
Introduction
Presentation of the 2016 – 2021 Publications
This e-book is the Part 1 of the 20th anniversary collection of Smart Pharma Consulting’s best position papers published, in line with its commitment to share knowledge and thoughts
October 2021Smart Pharma 2016 – 2021 Publications
▪ On the 20th anniversary of Smart Pharma Consulting, we have compiled 34 position papers published since 2016
▪ These publications propose effective and practical solutions to help pharma companies improve their performance
▪ For so doing, we share openly:
– Business insights
– Concepts
– Methods
– Tools
The majority of which have been developed by Smart Pharma Consulting
3
Market Insights
Serving & Sharing with Passion
Pharma Market Insight Studies
POSITION PAPER
Smart Pharma Expertise- Methods & Tools -
MARKET INSIGHTS
Serving & Sharing with Passion
French Pharma Market 2020 – 2025
EXCERPTS
Strategic implications for pharma companies
BUSINESS REPORT
Serving & Sharing with Passion
Global Pharma Market& Covid-19 Impact
POSITION PAPER
2019-2024 perspectives
MARKET INSIGHTS
Serving & Sharing with Passion
French Retail Pharmacies
POSITION PAPER
2019-2023 perspectives
MARKET INSIGHTS
FrenchBiosimilars Market
POSITION PAPER
Key Success Factors
MARKET INSIGHTS
Serving & Sharing with Passion
p.4 p.66
p.86 p.109
p.28

1, rue Houdart de Lamotte – 75015 Paris – FranceTel. +33 6 11 96 33 78
Email : [email protected] – Website : www.smart-pharma.com
Serving & Sharing with Passion
Pharma Market Insight Studies
POSITION PAPER October 2021
MARKET INSIGHTS
Smart Pharma Expertise- Methods & Tools -
5
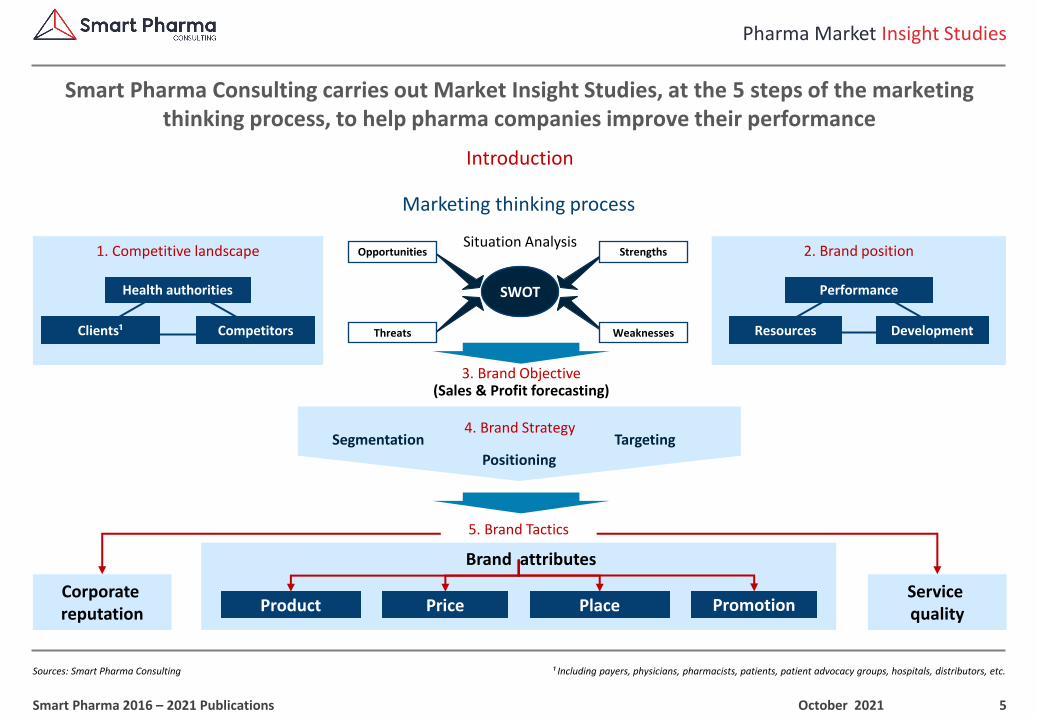
¹ Including payers, physicians, pharmacists, patients, patient advocacy groups, hospitals, distributors, etc.
Pharma Market Insight Studies
Sources: Smart Pharma Consulting
Introduction
Smart Pharma Consulting carries out Market Insight Studies, at the 5 steps of the marketing thinking process, to help pharma companies improve their performance
October 2021Smart Pharma 2016 – 2021 Publications
Marketing thinking process
Brand attributes
3. Brand Objective(Sales & Profit forecasting)
1. Competitive landscape 2. Brand position
SWOT
Clients¹
Health authorities
Competitors Resources
Performance
Development
Strengths
Weaknesses
Opportunities
Threats
Situation Analysis
PromotionProduct Price PlaceCorporate reputation
Service quality
5. Brand Tactics
TargetingSegmentation
Positioning
4. Brand Strategy
6
Pharma Market Insight Studies
Sources: Smart Pharma Consulting
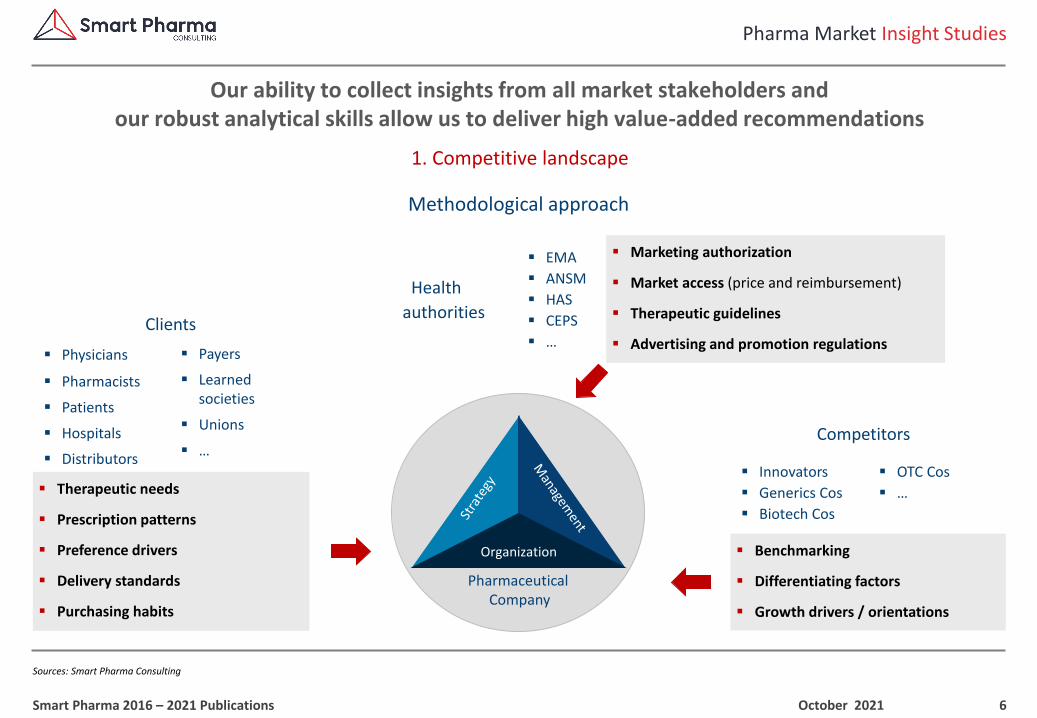
1. Competitive landscape
Our ability to collect insights from all market stakeholders and our robust analytical skills allow us to deliver high value-added recommendations
October 2021Smart Pharma 2016 – 2021 Publications
Methodological approach
▪ Physicians
▪ Pharmacists
▪ Patients
▪ Hospitals
▪ Distributors
▪ Payers
▪ Learned societies
▪ Unions
▪ …
▪ Therapeutic needs
▪ Prescription patterns
▪ Preference drivers
▪ Delivery standards
▪ Purchasing habits
▪ Innovators
▪ Generics Cos
▪ Biotech Cos
▪ OTC Cos
▪ …
▪ Benchmarking
▪ Differentiating factors
▪ Growth drivers / orientations
Organization
Pharmaceutical Company
▪ Marketing authorization
▪ Market access (price and reimbursement)
▪ Therapeutic guidelines
▪ Advertising and promotion regulations
▪ EMA
▪ ANSM
▪ HAS
▪ CEPS
▪ …Clients
Health
authorities
Competitors
7
Pharma Market Insight Studies
Sources: Smart Pharma Consulting
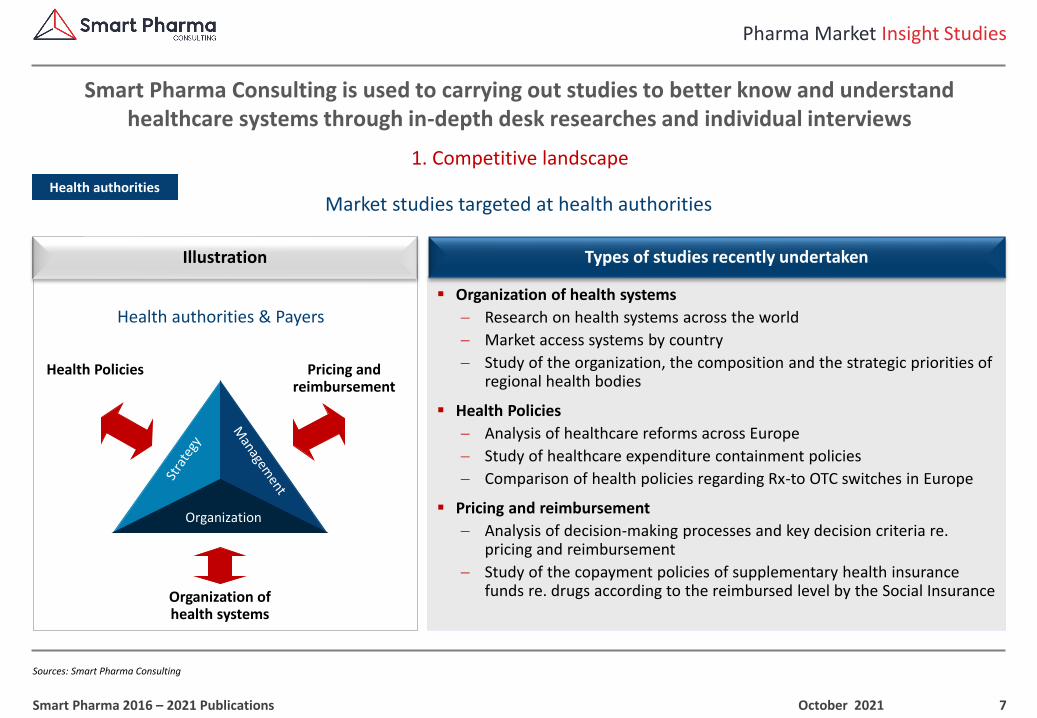
1. Competitive landscape
Smart Pharma Consulting is used to carrying out studies to better know and understand healthcare systems through in-depth desk researches and individual interviews
October 2021Smart Pharma 2016 – 2021 Publications
Market studies targeted at health authoritiesHealth authorities
▪ Organization of health systems
− Research on health systems across the world
− Market access systems by country
− Study of the organization, the composition and the strategic priorities of regional health bodies
▪ Health Policies
− Analysis of healthcare reforms across Europe
− Study of healthcare expenditure containment policies
− Comparison of health policies regarding Rx-to OTC switches in Europe
▪ Pricing and reimbursement
− Analysis of decision-making processes and key decision criteria re. pricing and reimbursement
− Study of the copayment policies of supplementary health insurance funds re. drugs according to the reimbursed level by the Social Insurance
Organization
Health authorities & Payers
Health Policies Pricing and reimbursement
Organization of health systems
Types of studies recently undertakenIllustration
8
1 Regional Health Agency (Agence Régionale de Santé) – 2 Hospital medical commission (Commission médicale d’établissement) – 3
Contract for healthcare quality and efficiency enhancement (Contrat d’amélioration de la qualité des soins)
Pharma Market Insight Studies
Sources: Smart Pharma Consulting
1. Competitive landscape
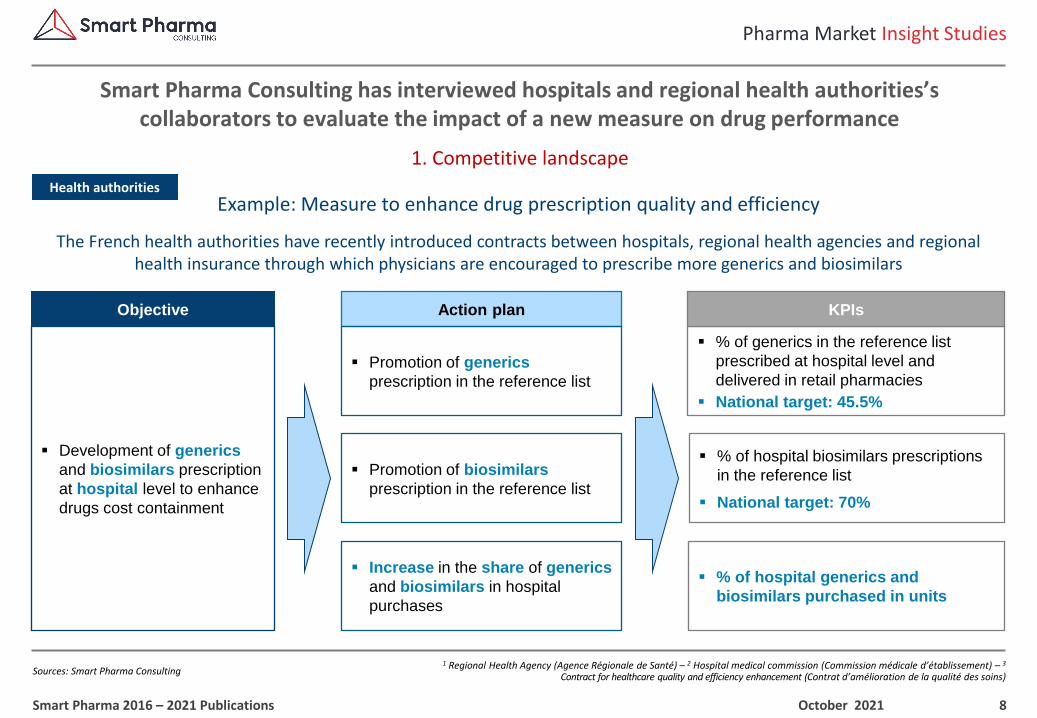
Smart Pharma Consulting has interviewed hospitals and regional health authorities’scollaborators to evaluate the impact of a new measure on drug performance
October 2021Smart Pharma 2016 – 2021 Publications
Example: Measure to enhance drug prescription quality and efficiencyHealth authorities
The French health authorities have recently introduced contracts between hospitals, regional health agencies and regional health insurance through which physicians are encouraged to prescribe more generics and biosimilars
Objective
▪ Development of generics
and biosimilars prescription
at hospital level to enhance
drugs cost containment
Action plan
▪ Promotion of generics
prescription in the reference list
▪ Increase in the share of generics
and biosimilars in hospital
purchases
▪ Promotion of biosimilars
prescription in the reference list
▪ % of generics in the reference list
prescribed at hospital level and
delivered in retail pharmacies
▪ National target: 45.5%
▪ % of hospital biosimilars prescriptions
in the reference list
▪ National target: 70%
▪ % of hospital generics and
biosimilars purchased in units
KPIs
9
Pharma Market Insight Studies
Sources: Smart Pharma Consulting
1. Competitive landscape
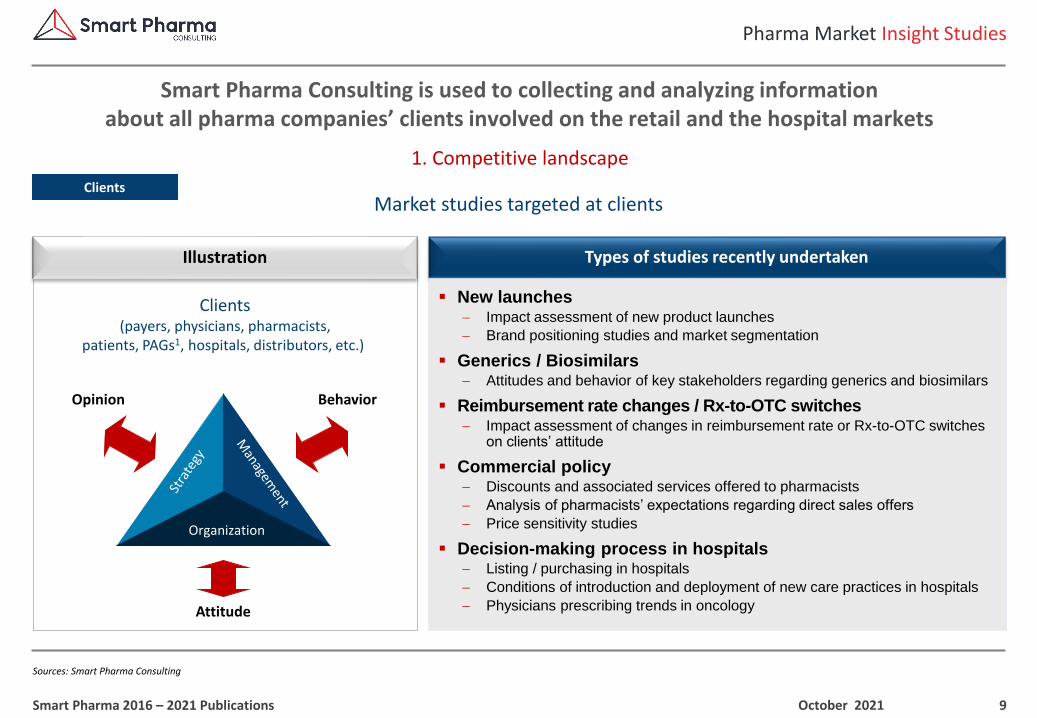
Smart Pharma Consulting is used to collecting and analyzing information about all pharma companies’ clients involved on the retail and the hospital markets
October 2021Smart Pharma 2016 – 2021 Publications
Market studies targeted at clientsClients
Types of studies recently undertakenIllustration
Organization
Clients(payers, physicians, pharmacists,
patients, PAGs1, hospitals, distributors, etc.)
Opinion Behavior
Attitude
▪ New launches− Impact assessment of new product launches
− Brand positioning studies and market segmentation
▪ Generics / Biosimilars− Attitudes and behavior of key stakeholders regarding generics and biosimilars
▪ Reimbursement rate changes / Rx-to-OTC switches− Impact assessment of changes in reimbursement rate or Rx-to-OTC switches
on clients’ attitude
▪ Commercial policy− Discounts and associated services offered to pharmacists
− Analysis of pharmacists’ expectations regarding direct sales offers
− Price sensitivity studies
▪ Decision-making process in hospitals− Listing / purchasing in hospitals
− Conditions of introduction and deployment of new care practices in hospitals
− Physicians prescribing trends in oncology
10
Pharma Market Insight Studies
Sources: Smart Pharma Consulting
1. Competitive landscape
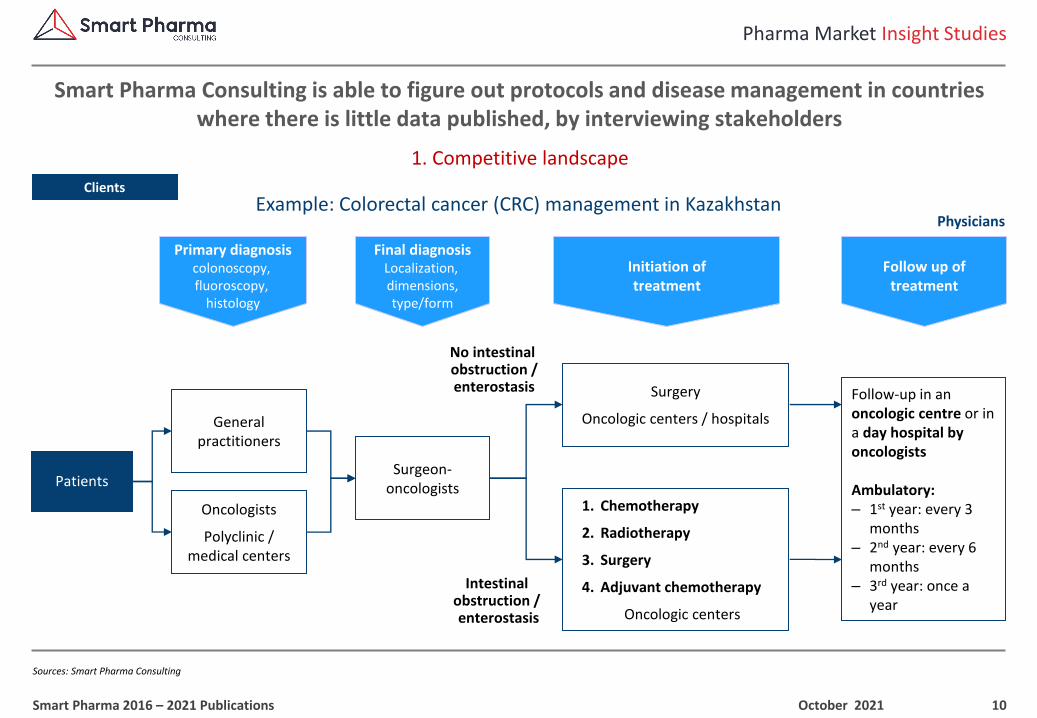
Smart Pharma Consulting is able to figure out protocols and disease management in countries where there is little data published, by interviewing stakeholders
October 2021Smart Pharma 2016 – 2021 Publications
Example: Colorectal cancer (CRC) management in KazakhstanClients
General practitioners
Oncologists
Polyclinic / medical centers
Patients
Primary diagnosiscolonoscopy, fluoroscopy,
histology
Initiation oftreatment
Follow up oftreatment
1. Chemotherapy
2. Radiotherapy
3. Surgery
4. Adjuvant chemotherapy
Oncologic centers
Surgeon-oncologists
Final diagnosisLocalization, dimensions,type/form
Intestinal obstruction / enterostasis
No intestinal obstruction /enterostasis Surgery
Oncologic centers / hospitals
Follow-up in an oncologic centre or in a day hospital by oncologists
Ambulatory:– 1st year: every 3
months– 2nd year: every 6
months– 3rd year: once a
year
Physicians
11
1 Developed by Smart Pharma Consulting (see position paper “How to get physicians prefer your brand?” on: www.smart-pharma.com)
Pharma Market Insight Studies
Sources: Smart Pharma Consulting
1. Competitive landscape
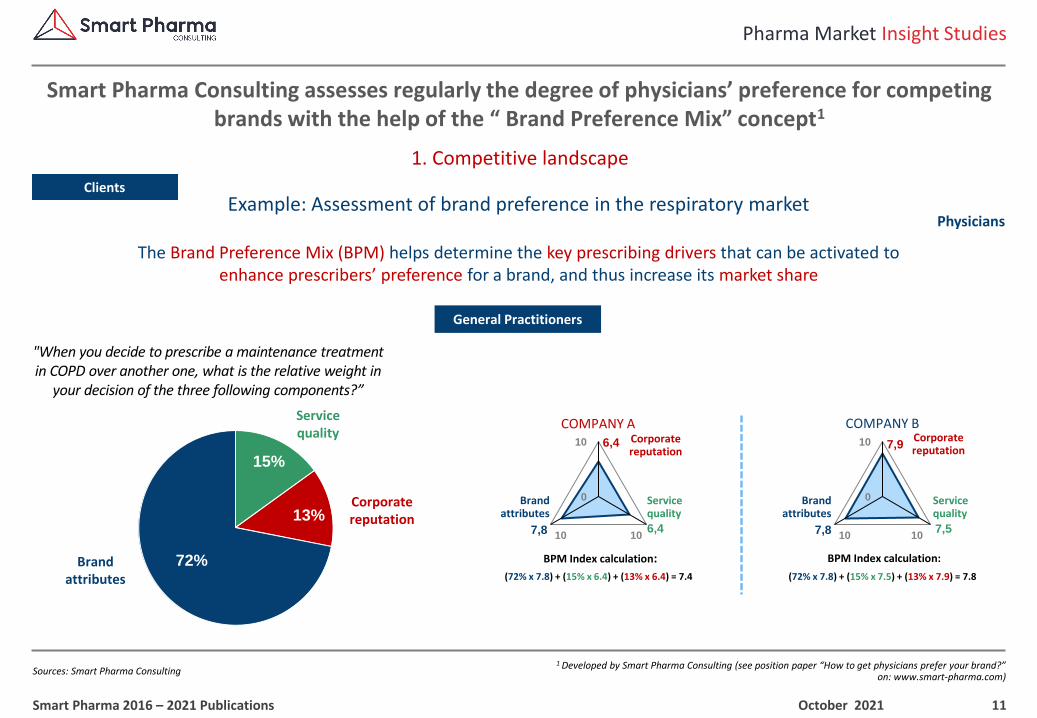
Smart Pharma Consulting assesses regularly the degree of physicians’ preference for competing brands with the help of the “ Brand Preference Mix” concept1
October 2021Smart Pharma 2016 – 2021 Publications
Example: Assessment of brand preference in the respiratory marketPhysicians
Clients
The Brand Preference Mix (BPM) helps determine the key prescribing drivers that can be activated to enhance prescribers’ preference for a brand, and thus increase its market share
General Practitioners
"When you decide to prescribe a maintenance treatment in COPD over another one, what is the relative weight in
your decision of the three following components?”
15%
13%
72%Brand attributes
Corporate reputation
Service quality
6,4
6,47,8
0
10
10 10
7,9
7,57,8
0
10
10 10
COMPANY A COMPANY B
BPM Index calculation:
(72% x 7.8) + (15% x 6.4) + (13% x 6.4) = 7.4
BPM Index calculation:
(72% x 7.8) + (15% x 7.5) + (13% x 7.9) = 7.8
Corporatereputation
Servicequality
Brandattributes
Corporatereputation
Servicequality
Brandattributes
12
1 Inclusive of legal margin, rebates, commercial agreements and remuneration for pharmaceutical services, notably those corresponding to the public health objectives (e.g., generics substitution objectives, pharmaceutical interviews with patients, etc.)
Pharma Market Insight Studies
Sources: CGP Experts Comptables – KPMG –Smart Pharma Consulting estimates
1. Competitive landscape
The in-depth knowledge and understanding of the market, through regular studies, enables Smart Pharma Consulting to produce complex and insightful analyses
October 2021Smart Pharma 2016 – 2021 Publications
Marketing thinking processPharmacists
Clients
0%
10%
20%
30%
40%
50%
54%(€ 988 K)
Reimbursable drugs(ethicals & semi-ethicals)
Relative weight of eachsegment in total sales(total = € 1,831 K)[CAGR 2014-2018:+1.0%]
20% 50% % of sales10% 30% 40% 70% 90%80% 100%60%0%
42%(€ 246 K)
Relative weight of each segment in gross margin(total = € 583 K)[CAGR 2014-2018:+1.2%]
25%
Average profitability by segment1
15%(€ 275 K)
12%(€ 220 K)
Trends 2018 vs. 2014
19% (€ 348 K)
33%
12%(€ 72 K)
Other healthcare products (non-drugs)
Reimbursablegenerics
50%
30%(€ 174 K)
33%
16%(€ 91 K)
Non-reimbursable drugs(OTC & “lifestyle” Rx products)
Average annual turnover of a retail pharmacy in 2018: € 1,831 K(public price excluding VAT)
Average profitability = 32%
50%
40%
30%
20%
10%
0%
13
Pharma Market Insight Studies
Sources: Smart Pharma Consulting
1. Competitive landscape
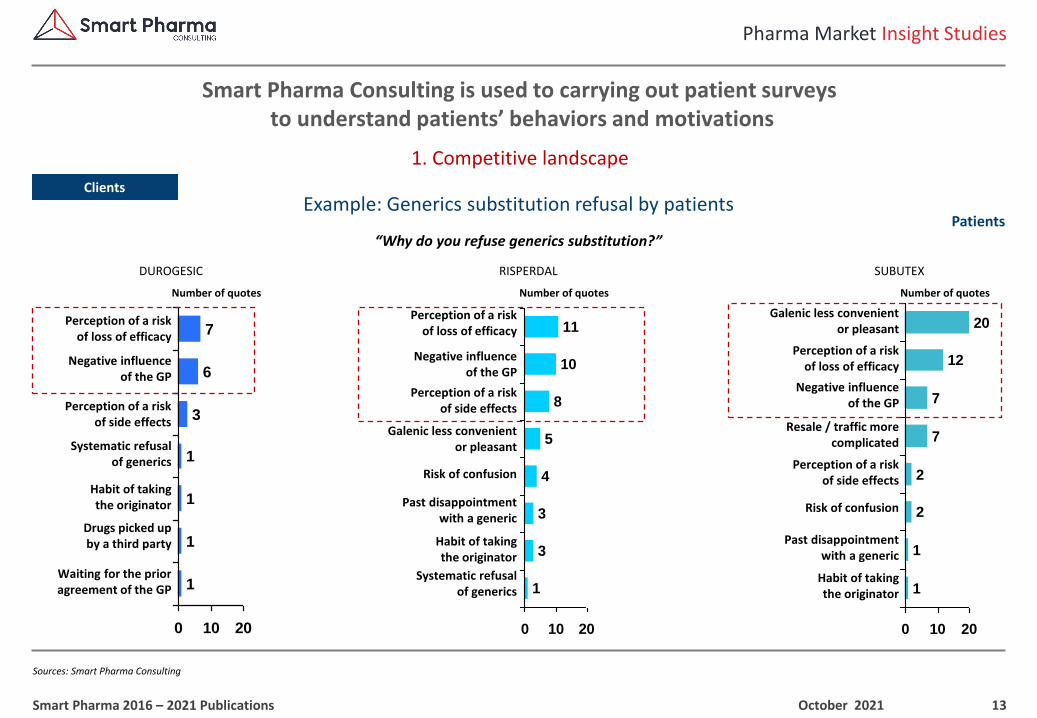
Smart Pharma Consulting is used to carrying out patient surveysto understand patients’ behaviors and motivations
October 2021Smart Pharma 2016 – 2021 Publications
Example: Generics substitution refusal by patientsPatients
Clients
“Why do you refuse generics substitution?”
1
1
1
1
3
6
7
0 10 20
DUROGESIC
Waiting for the prior agreement of the GP
Perception of a riskof loss of efficacy
Negative influenceof the GP
Perception of a risk of side effects
1
3
3
4
5
8
10
11
0 10 20
RISPERDAL
1
1
2
2
7
7
12
20
0 10 20
SUBUTEX
Habit of takingthe originator
Past disappointment with a generic
Risk of confusion
Galenic less convenientor pleasant
Perception of a riskof loss of efficacy
Perception of a risk of side effects
Negative influenceof the GP
Galenic less convenientor pleasant
Perception of a riskof loss of efficacy
Negative influenceof the GP
Resale / traffic more complicated
Perception of a risk of side effects
Risk of confusion
Past disappointment with a generic
Habit of takingthe originator
Systematic refusalof generics
Habit of takingthe originator
Drugs picked upby a third party
Systematic refusalof generics
Number of quotes Number of quotes Number of quotes
14
Pharma Market Insight Studies
Sources: Smart Pharma Consulting
1. Competitive landscape
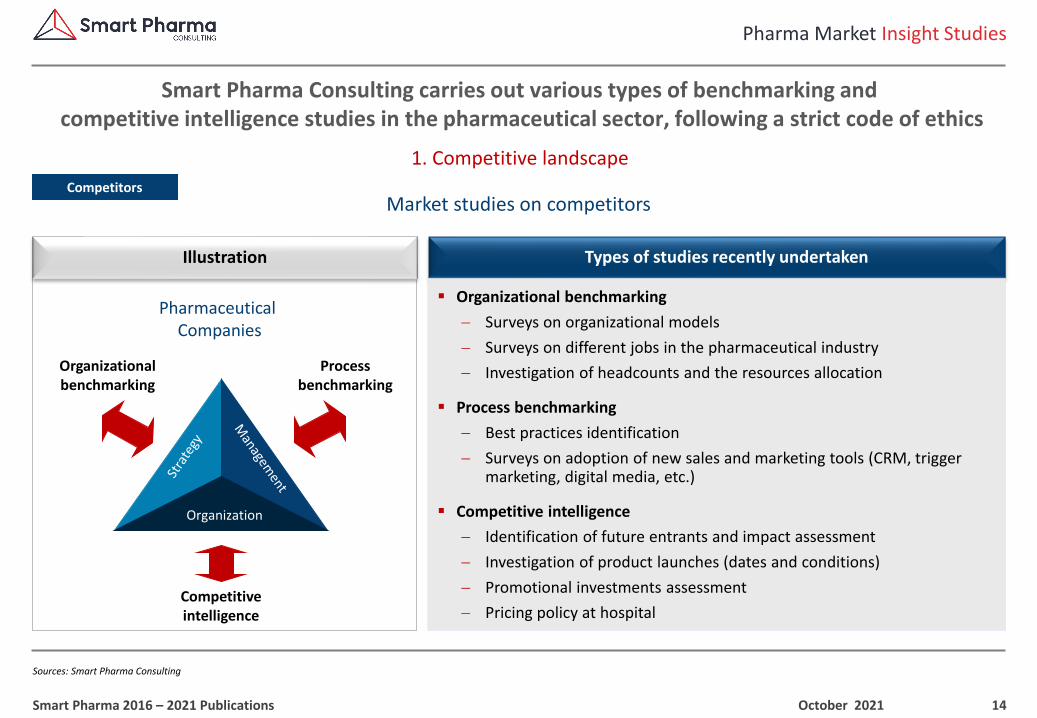
Smart Pharma Consulting carries out various types of benchmarking andcompetitive intelligence studies in the pharmaceutical sector, following a strict code of ethics
October 2021Smart Pharma 2016 – 2021 Publications
Market studies on competitors
Types of studies recently undertakenIllustration
Competitors
▪ Organizational benchmarking
− Surveys on organizational models
− Surveys on different jobs in the pharmaceutical industry
− Investigation of headcounts and the resources allocation
▪ Process benchmarking
− Best practices identification
− Surveys on adoption of new sales and marketing tools (CRM, trigger marketing, digital media, etc.)
▪ Competitive intelligence
− Identification of future entrants and impact assessment
− Investigation of product launches (dates and conditions)
− Promotional investments assessment
− Pricing policy at hospital
Organization
Pharmaceutical Companies
Organizational benchmarking
Process benchmarking
Competitive intelligence
15
Pharma Market Insight Studies
Sources: Smart Pharma Consulting
1. Competitive landscape
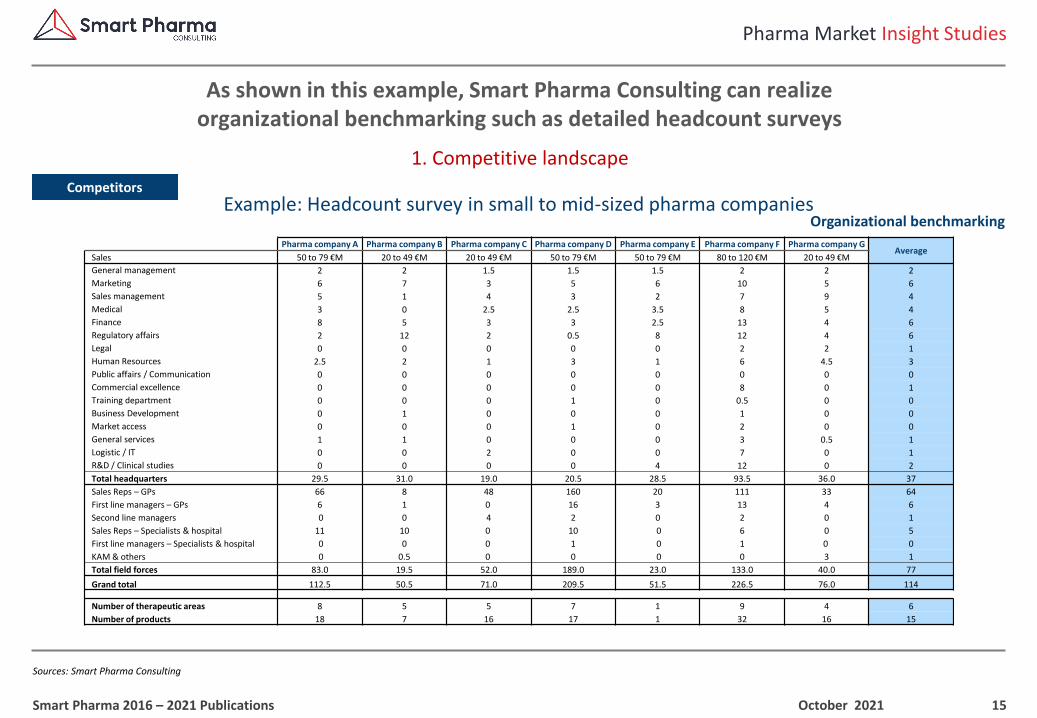
As shown in this example, Smart Pharma Consulting can realize organizational benchmarking such as detailed headcount surveys
October 2021Smart Pharma 2016 – 2021 Publications
Example: Headcount survey in small to mid-sized pharma companiesCompetitors
Organizational benchmarking
Pharma company A Pharma company B Pharma company C Pharma company D Pharma company E Pharma company F Pharma company GAverage
Sales 50 to 79 €M 20 to 49 €M 20 to 49 €M 50 to 79 €M 50 to 79 €M 80 to 120 €M 20 to 49 €M
General management 2 2 1.5 1.5 1.5 2 2 2
Marketing 6 7 3 5 6 10 5 6
Sales management 5 1 4 3 2 7 9 4
Medical 3 0 2.5 2.5 3.5 8 5 4
Finance 8 5 3 3 2.5 13 4 6
Regulatory affairs 2 12 2 0.5 8 12 4 6
Legal 0 0 0 0 0 2 2 1
Human Resources 2.5 2 1 3 1 6 4.5 3
Public affairs / Communication 0 0 0 0 0 0 0 0
Commercial excellence 0 0 0 0 0 8 0 1
Training department 0 0 0 1 0 0.5 0 0
Business Development 0 1 0 0 0 1 0 0
Market access 0 0 0 1 0 2 0 0
General services 1 1 0 0 0 3 0.5 1
Logistic / IT 0 0 2 0 0 7 0 1
R&D / Clinical studies 0 0 0 0 4 12 0 2
Total headquarters 29.5 31.0 19.0 20.5 28.5 93.5 36.0 37
Sales Reps – GPs 66 8 48 160 20 111 33 64
First line managers – GPs 6 1 0 16 3 13 4 6
Second line managers 0 0 4 2 0 2 0 1
Sales Reps – Specialists & hospital 11 10 0 10 0 6 0 5
First line managers – Specialists & hospital 0 0 0 1 0 1 0 0
KAM & others 0 0.5 0 0 0 0 3 1
Total field forces 83.0 19.5 52.0 189.0 23.0 133.0 40.0 77
Grand total 112.5 50.5 71.0 209.5 51.5 226.5 76.0 114
Number of therapeutic areas 8 5 5 7 1 9 4 6
Number of products 18 7 16 17 1 32 16 15
16
Pharma Market Insight Studies
Sources: Smart Pharma Consulting
1. Competitive landscape
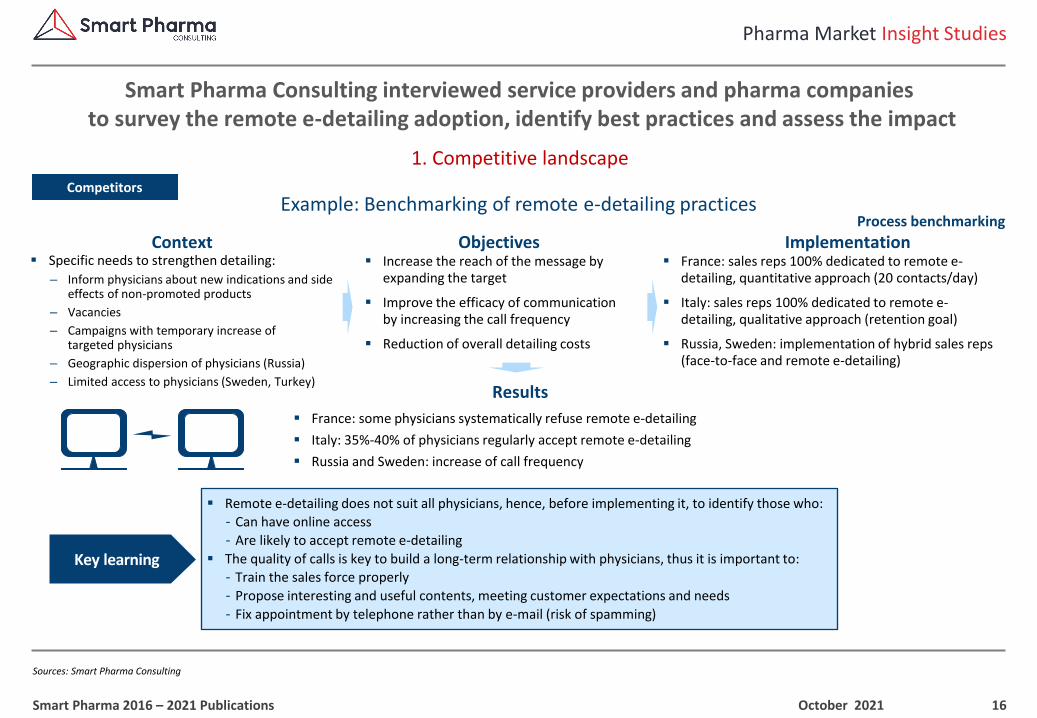
Smart Pharma Consulting interviewed service providers and pharma companiesto survey the remote e-detailing adoption, identify best practices and assess the impact
October 2021Smart Pharma 2016 – 2021 Publications
Example: Benchmarking of remote e-detailing practicesCompetitors
Process benchmarking
▪ Specific needs to strengthen detailing:
– Inform physicians about new indications and side effects of non-promoted products
– Vacancies
– Campaigns with temporary increase of targeted physicians
– Geographic dispersion of physicians (Russia)
– Limited access to physicians (Sweden, Turkey)
▪ Increase the reach of the message by expanding the target
▪ Improve the efficacy of communication by increasing the call frequency
▪ Reduction of overall detailing costs
Context Objectives▪ France: sales reps 100% dedicated to remote e-
detailing, quantitative approach (20 contacts/day)
▪ Italy: sales reps 100% dedicated to remote e-detailing, qualitative approach (retention goal)
▪ Russia, Sweden: implementation of hybrid sales reps (face-to-face and remote e-detailing)
Implementation
▪ France: some physicians systematically refuse remote e-detailing
▪ Italy: 35%-40% of physicians regularly accept remote e-detailing
▪ Russia and Sweden: increase of call frequency
Results
▪ Remote e-detailing does not suit all physicians, hence, before implementing it, to identify those who:- Can have online access
- Are likely to accept remote e-detailing
▪ The quality of calls is key to build a long-term relationship with physicians, thus it is important to:
- Train the sales force properly
- Propose interesting and useful contents, meeting customer expectations and needs
- Fix appointment by telephone rather than by e-mail (risk of spamming)
Key learning
17
Pharma Market Insight Studies
Sources: Smart Pharma Consulting
1. Competitive landscape
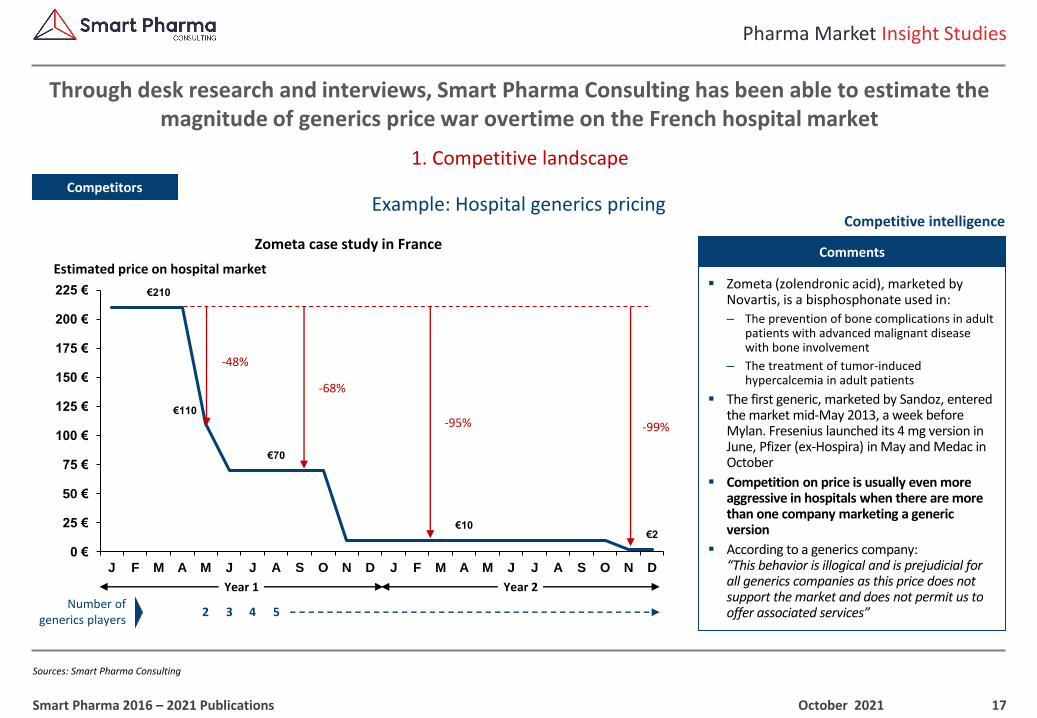
Through desk research and interviews, Smart Pharma Consulting has been able to estimate the magnitude of generics price war overtime on the French hospital market
October 2021Smart Pharma 2016 – 2021 Publications
Example: Hospital generics pricingCompetitors
Competitive intelligence
▪ Zometa (zolendronic acid), marketed by Novartis, is a bisphosphonate used in:
– The prevention of bone complications in adult patients with advanced malignant disease with bone involvement
– The treatment of tumor-induced hypercalcemia in adult patients
▪ The first generic, marketed by Sandoz, entered the market mid-May 2013, a week before Mylan. Fresenius launched its 4 mg version in June, Pfizer (ex-Hospira) in May and Medac in October
▪ Competition on price is usually even more aggressive in hospitals when there are more than one company marketing a generic version
▪ According to a generics company:“This behavior is illogical and is prejudicial for all generics companies as this price does not support the market and does not permit us to offer associated services”
Comments
€210
€110
€70
€10 €2
0 €
25 €
50 €
75 €
100 €
125 €
150 €
175 €
200 €
225 €
J F M A M J J A S O N D J F M A M J J A S O N D
Zometa case study in France
Estimated price on hospital market
-48%
-95% -99%
Number of generics players
2
Year 1 Year 2
3 4 5
-68%
18
Pharma Market Insight Studies
Sources: Smart Pharma Consulting
2. Brand Position
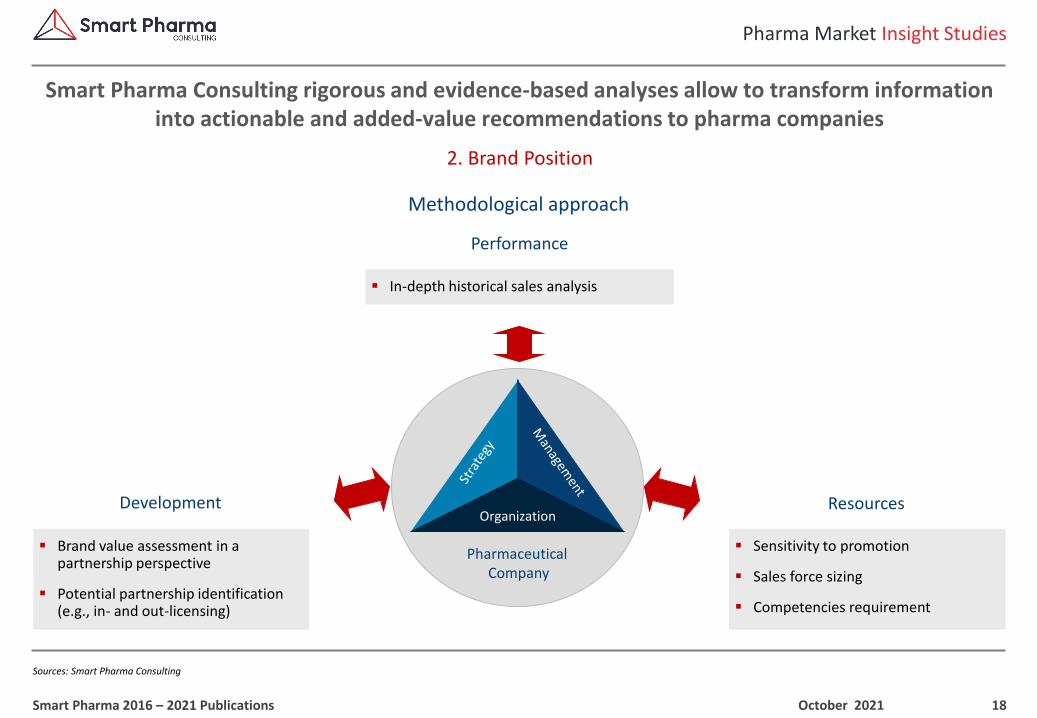
Smart Pharma Consulting rigorous and evidence-based analyses allow to transform information into actionable and added-value recommendations to pharma companies
October 2021Smart Pharma 2016 – 2021 Publications
Methodological approach
Development
▪ Sensitivity to promotion
▪ Sales force sizing
▪ Competencies requirement
Resources
▪ Brand value assessment in a partnership perspective
▪ Potential partnership identification (e.g., in- and out-licensing)
Organization
Pharmaceutical Company
▪ In-depth historical sales analysis
Performance
19
1 Intra-uterine system – 2 Product launched at the end of March 2018 – 3 Compound annual growth rate
Pharma Market Insight Studies
Sources: Smart Pharma Consulting
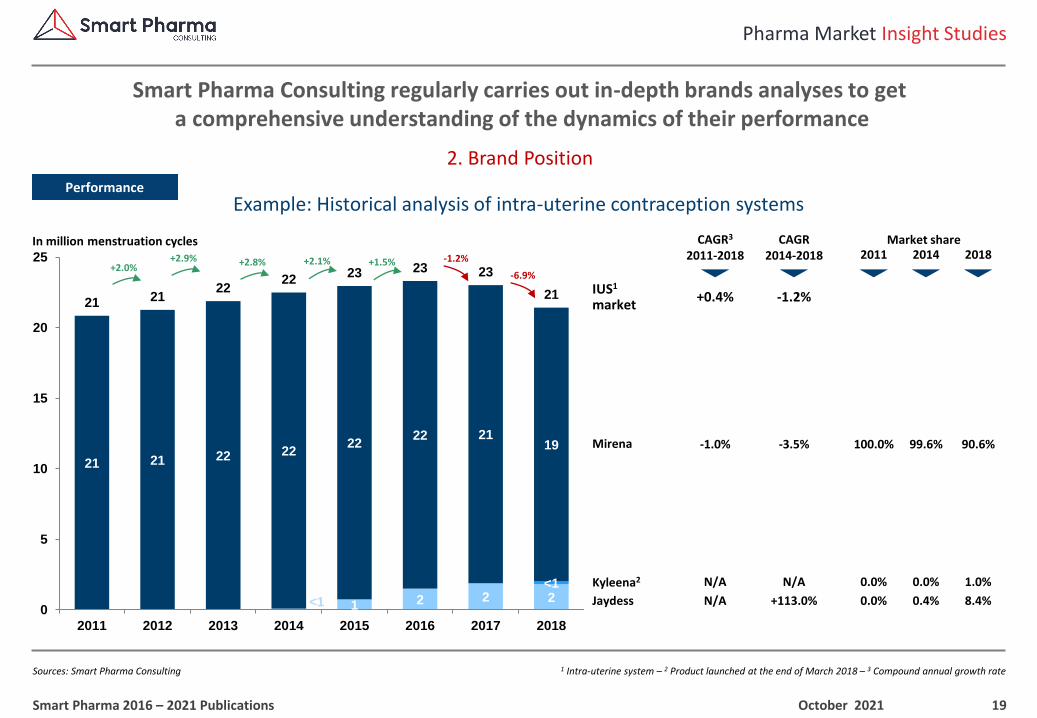
2. Brand Position
Smart Pharma Consulting regularly carries out in-depth brands analyses to geta comprehensive understanding of the dynamics of their performance
October 2021Smart Pharma 2016 – 2021 Publications
Example: Historical analysis of intra-uterine contraception systemsPerformance
<1 1 2 2 2<1
21 21 22 2222
22 2119
21 2122
2223 23 23
21
0
5
10
15
20
25
2011 2012 2013 2014 2015 2016 2017 2018
Millio
ns
-1.0% -3.5%
N/A N/A
N/A +113.0%
100.0% 90.6%
0.0% 1.0%
0.0% 8.4%
99.6%
0.0%
0.4%Jaydess
Kyleena2
Mirena
+2.0%+2.9% +2.1% -1.2%
CAGR2014-2018 2011 2018
Market shareCAGR3
2011-2018 2014
+0.4% -1.2%IUS1
market
In million menstruation cycles
+2.8% +1.5%-6.9%
20
Pharma Market Insight Studies
Sources: Smart Pharma Consulting
2. Brand Position
Smart Pharma Consulting can help pharma companies assess the sensitivity of their brandsto promotional investments in quantitative and qualitative terms
October 2021Smart Pharma 2016 – 2021 Publications
Example: Sensitivity to promotional investmentsResources
0%
5%
10%
15%
20%
25%
0%
10%
20%
30%
40%
50%
60%
70%
80%
90%
100%
2015 2016 2017 2018 2019
0,0
0,5
1,0
1,5
2,0
0,0
0,5
1,0
2015 2016 2017 2018 2019
Calls
0,0
0,5
1,0
1,5
2,0
2015 2016 2017 2018 2019
Callsin €M
Other investmentsin €M Media mix
Promotional mixInvestment per targetin €M
Target mix
Performance & share of voice
% of calls investments
Market Share
Share of voice - Specialists
Share of voice - GPs
Pharmacists
GPsSpecialists
Market Share (%)
Press SamplesCongress Clinical trials
21
1 Developed by Smart Pharma Consulting (see position paper “Best-in-Class Pharma BD&L” on: www.smart-pharma.com)
Pharma Market Insight Studies
Sources: Smart Pharma Consulting
2. Brand Position
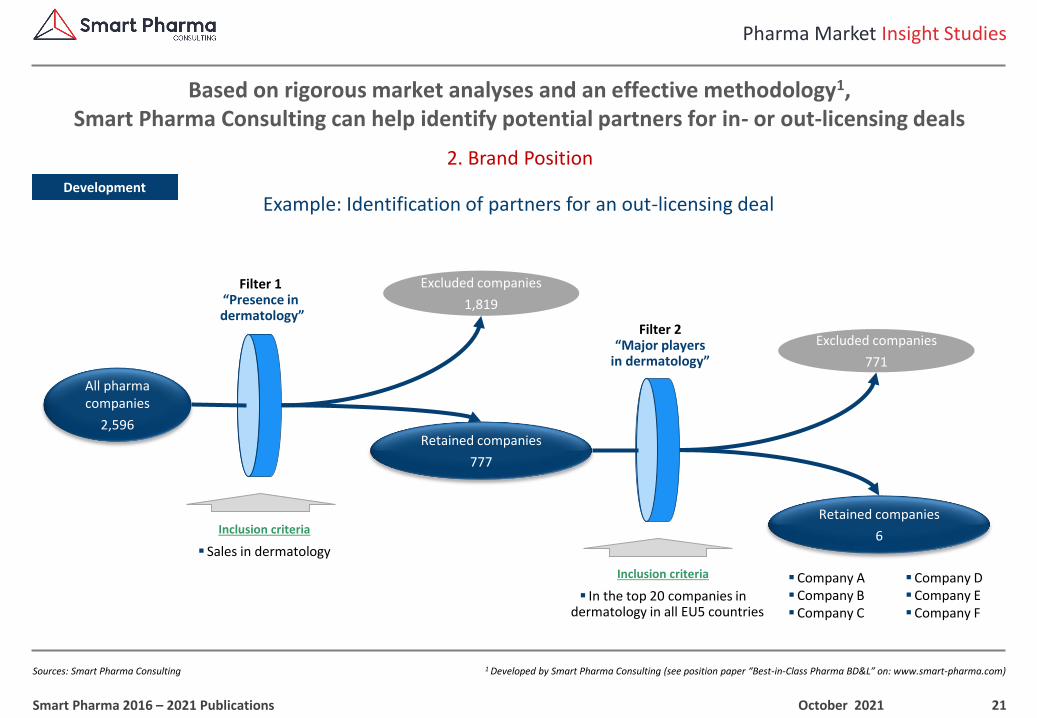
Based on rigorous market analyses and an effective methodology1, Smart Pharma Consulting can help identify potential partners for in- or out-licensing deals
October 2021Smart Pharma 2016 – 2021 Publications
Example: Identification of partners for an out-licensing dealDevelopment
Filter 1“Presence indermatology”
Inclusion criteria
▪ Sales in dermatology
Inclusion criteria
▪ In the top 20 companies in dermatology in all EU5 countries
Excluded companies
1,819
Retained companies
777
All pharma companies
2,596
Retained companies
6
Filter 2“Major players
in dermatology”
Excluded companies
771
▪Company A▪Company B▪Company C
▪Company D▪Company E▪Company F
22
Pharma Market Insight Studies
Sources: Smart Pharma Consulting
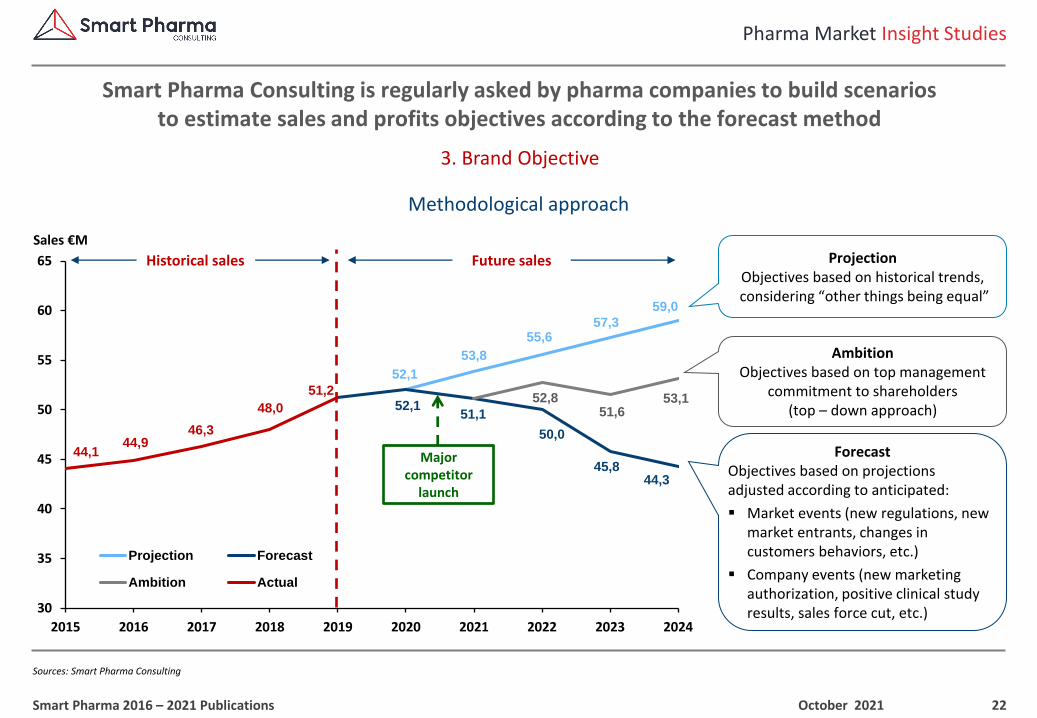
3. Brand Objective
Smart Pharma Consulting is regularly asked by pharma companies to build scenarios to estimate sales and profits objectives according to the forecast method
October 2021Smart Pharma 2016 – 2021 Publications
Methodological approach
52,1
53,8
55,657,3
59,0
52,1 51,1
50,0
45,8 44,3
52,8 51,6
53,1
44,1 44,9
46,3
48,0
51,2
30
35
40
45
50
55
60
65
2015 2016 2017 2018 2019 2020 2021 2022 2023 2024
Projection Forecast
Ambition Actual
Major competitor
launch
Sales €MProjection
Objectives based on historical trends,considering “other things being equal”
Ambition Objectives based on top management
commitment to shareholders(top – down approach)
ForecastObjectives based on projections adjusted according to anticipated:
▪ Market events (new regulations, new market entrants, changes in customers behaviors, etc.)
▪ Company events (new marketing authorization, positive clinical study results, sales force cut, etc.)
Historical sales Future sales
23
1 Compound annual growth rate
Pharma Market Insight Studies
Sources: Smart Pharma Consulting
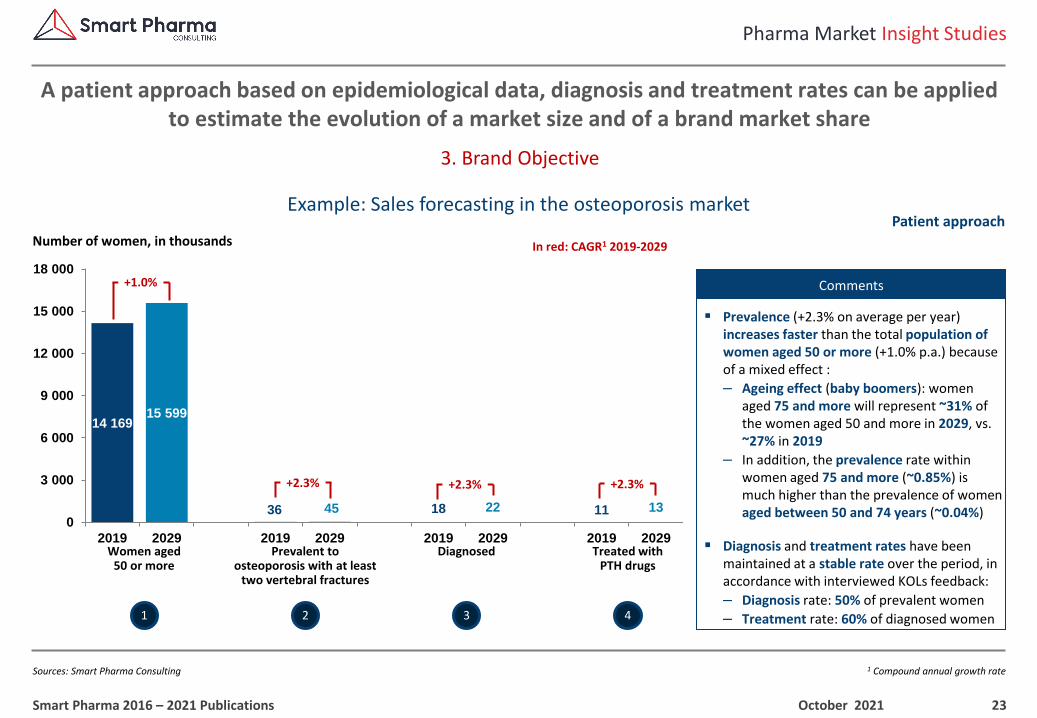
3. Brand Objective
A patient approach based on epidemiological data, diagnosis and treatment rates can be applied to estimate the evolution of a market size and of a brand market share
October 2021Smart Pharma 2016 – 2021 Publications
Example: Sales forecasting in the osteoporosis marketPatient approach
1 2 43
Number of women, in thousands In red: CAGR1 2019-2029
Women aged 50 or more
Prevalent to osteoporosis with at least
two vertebral fractures
Diagnosed Treated withPTH drugs
+1.0%
+2.3% +2.3% +2.3%
▪ Prevalence (+2.3% on average per year) increases faster than the total population of women aged 50 or more (+1.0% p.a.) because of a mixed effect :
– Ageing effect (baby boomers): women aged 75 and more will represent ~31% of the women aged 50 and more in 2029, vs. ~27% in 2019
– In addition, the prevalence rate within women aged 75 and more (~0.85%) is much higher than the prevalence of women aged between 50 and 74 years (~0.04%)
▪ Diagnosis and treatment rates have been maintained at a stable rate over the period, in accordance with interviewed KOLs feedback:
– Diagnosis rate: 50% of prevalent women
– Treatment rate: 60% of diagnosed women
Comments
14 16915 599
36 45 18 22 11 130
3 000
6 000
9 000
12 000
15 000
18 000
2019 2029 2019 2029 2019 2029 2019 2029
24
1 Compound annual growth rate
Pharma Market Insight Studies
Sources: Smart Pharma Consulting
3. Brand Objective
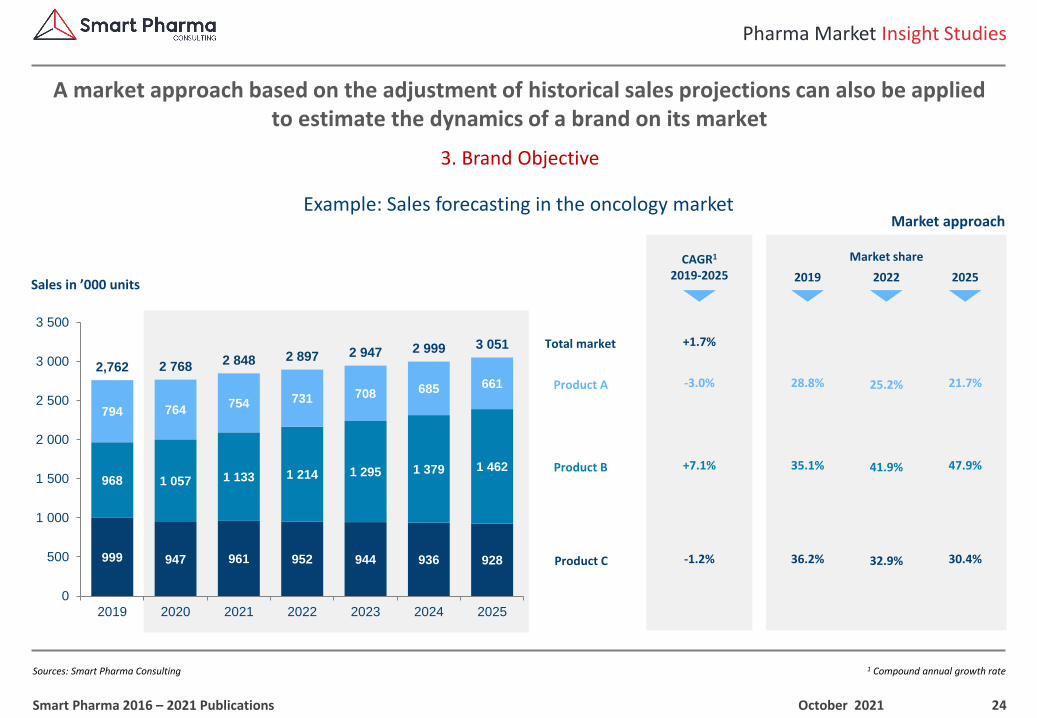
A market approach based on the adjustment of historical sales projections can also be appliedto estimate the dynamics of a brand on its market
October 2021Smart Pharma 2016 – 2021 Publications
Example: Sales forecasting in the oncology marketMarket approach
Market share
2019 2022 2025
CAGR1
2019-2025Sales in ’000 units
Total market
Product A
Product B
Product C
28.8%
36.2%
35.1%
25.2%
32.9%
41.9%
21.7%
30.4%
47.9%
+1.7%
-3.0%
-1.2%
+7.1%
999 947 961 952 944 936 928
968 1 057 1 133 1 214 1 295 1 379 1 462
794 764754 731 708 685 661
2,762 2 7682 848 2 897 2 947 2 999 3 051
0
500
1 000
1 500
2 000
2 500
3 000
3 500
2019 2020 2021 2022 2023 2024 2025
25
1 Constant ex-factory prices, excluding VAT
Pharma Market Insight Studies
Sources: Smart Pharma Consulting
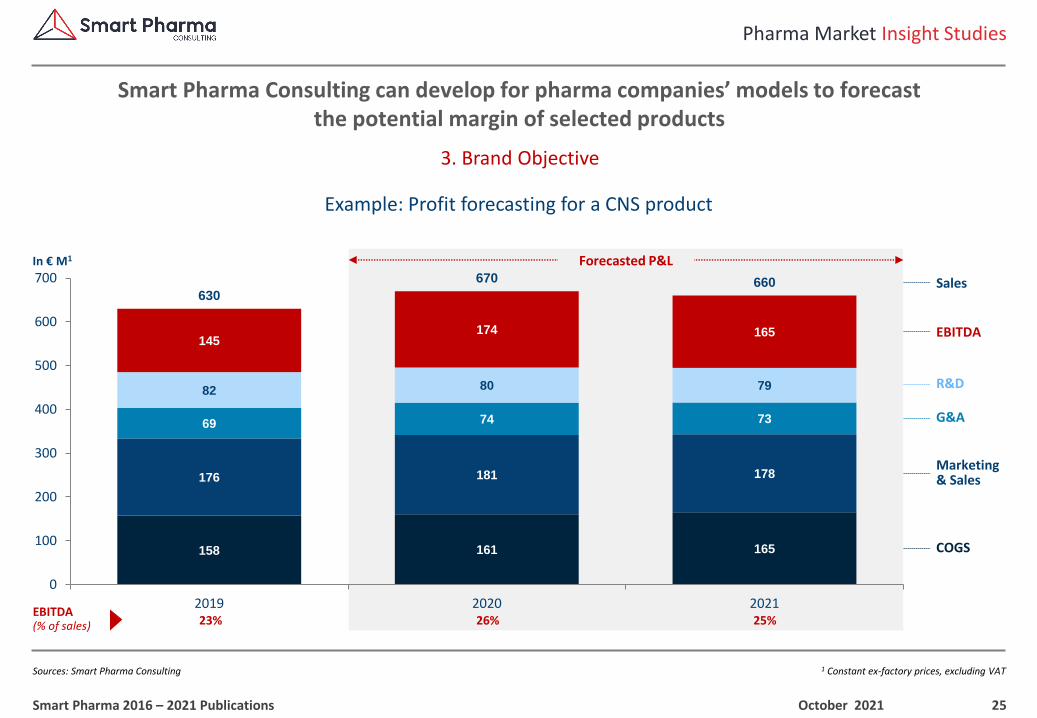
3. Brand Objective
Smart Pharma Consulting can develop for pharma companies’ models to forecastthe potential margin of selected products
October 2021Smart Pharma 2016 – 2021 Publications
Example: Profit forecasting for a CNS product
Sales
EBITDA
COGS
G&A
Marketing & Sales
R&D
In € M1 Forecasted P&L
EBITDA (% of sales) 23% 26% 25%
158 161 165
176 181 178
69 74 73
82 80 79
145 174 165
630
670 660
0
100
200
300
400
500
600
700
2019 2020 2021
26
1 Developed by Smart Pharma Consulting (see position paper “Best-in-Class Pharma Marketers” on: www.smart-pharma.com) – 2 By market (competitors + brand) and by brand – 3 Medico-marketing-sales investments
Pharma Market Insight Studies
Sources: Smart Pharma Consulting
4. Brand Strategy
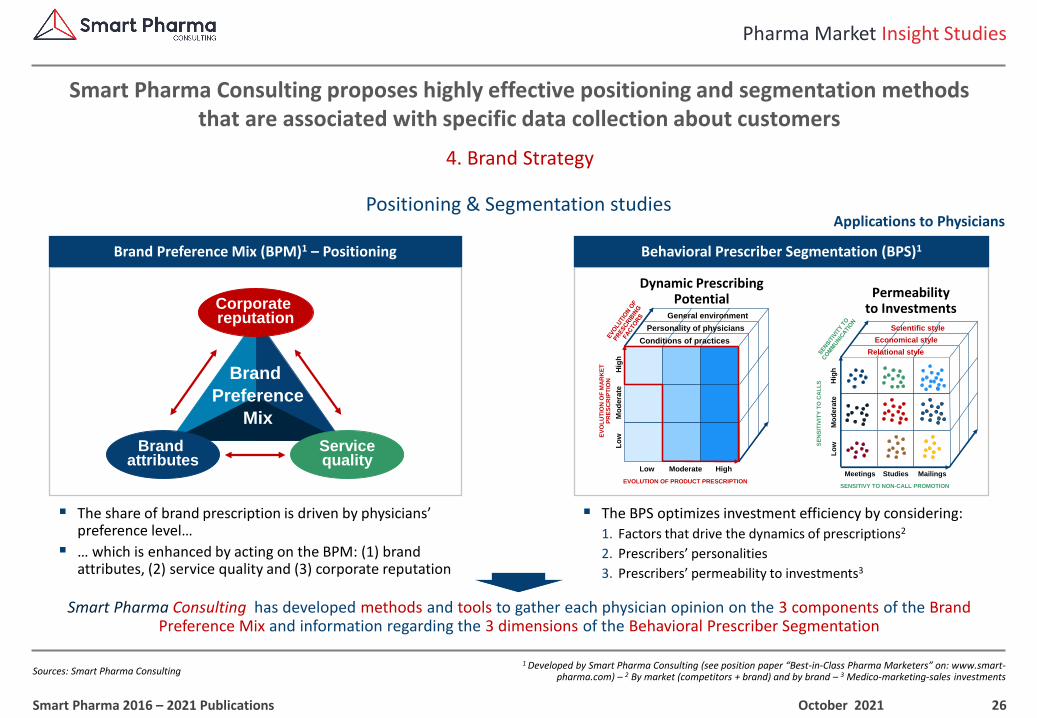
Smart Pharma Consulting proposes highly effective positioning and segmentation methodsthat are associated with specific data collection about customers
October 2021Smart Pharma 2016 – 2021 Publications
Positioning & Segmentation studies
Brand Preference Mix (BPM)1 – Positioning Behavioral Prescriber Segmentation (BPS)1
Dynamic Prescribing Potential Permeability
to Investments
Conditions of practices
Personality of physicians
General environment
EV
OL
UT
ION
OF
MA
RK
ET
P
RE
SC
RIP
TIO
N
EVOLUTION OF PRODUCT PRESCRIPTION
Lo
wM
od
era
teH
igh
Low Moderate High
Lo
wH
igh
SE
NS
ITIV
ITY
TO
CA
LL
S
Mo
dera
te
Meetings Studies Mailings
SENSITIVY TO NON-CALL PROMOTION
Relational style
Economical style
Scientific style
Corporate reputation
Servicequality
Brand attributes
Brand
Preference
Mix
Smart Pharma Consulting has developed methods and tools to gather each physician opinion on the 3 components of the Brand Preference Mix and information regarding the 3 dimensions of the Behavioral Prescriber Segmentation
▪ The BPS optimizes investment efficiency by considering:
1. Factors that drive the dynamics of prescriptions2
2. Prescribers’ personalities
3. Prescribers’ permeability to investments3
▪ The share of brand prescription is driven by physicians’ preference level…
▪ … which is enhanced by acting on the BPM: (1) brand attributes, (2) service quality and (3) corporate reputation
Applications to Physicians
27
1 Developed by Smart Pharma Consulting (see position paper “Best-in-Class Medical Reps” on: www.smart-pharma.com) – 2 Sales Force Effectiveness
Pharma Market Insight Studies
Sources: Smart Pharma Consulting
5. Brand Tactics
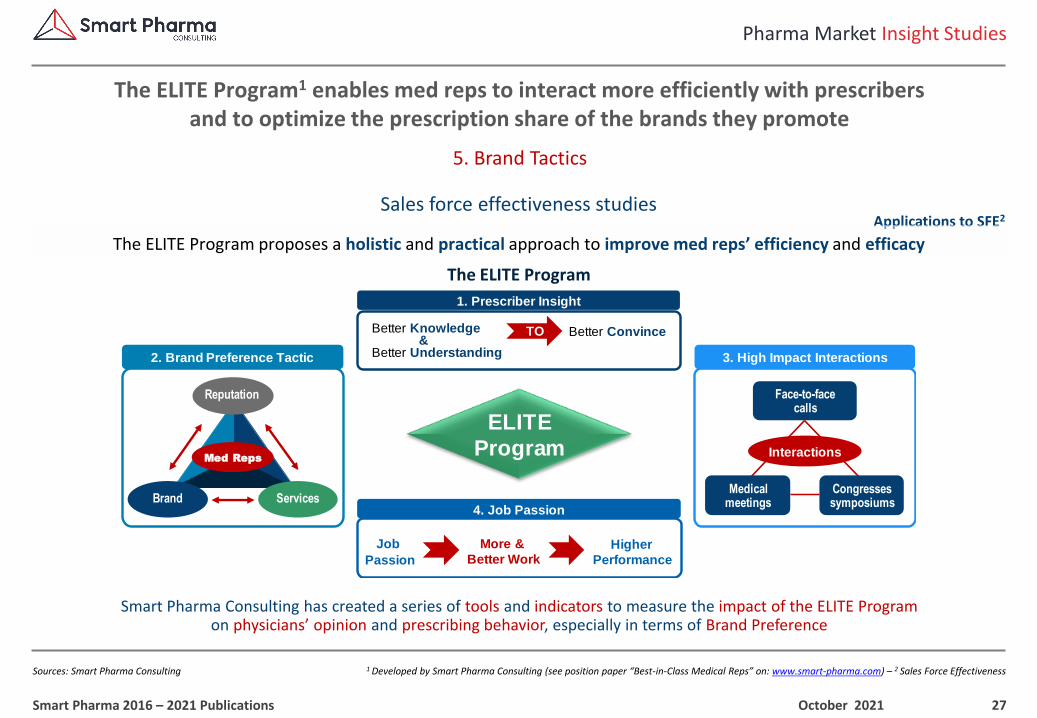
The ELITE Program1 enables med reps to interact more efficiently with prescribers and to optimize the prescription share of the brands they promote
October 2021Smart Pharma 2016 – 2021 Publications
Sales force effectiveness studiesApplications to SFE2
The ELITE Program proposes a holistic and practical approach to improve med reps’ efficiency and efficacy
The ELITE Program
Smart Pharma Consulting has created a series of tools and indicators to measure the impact of the ELITE Program on physicians’ opinion and prescribing behavior, especially in terms of Brand Preference
2. Brand Preference Tactic
Reputation
ServicesBrand
Med Reps
1. Prescriber Insight
Better Knowledge&
Better Understanding
TO Better Convince
3. High Impact Interactions
Interactions
Face-to-face calls
Medical meetings
Congressessymposiums
4. Job Passion
More &
Better WorkHigher
Performance
Job
Passion
ELITE
Program
1, rue Houdart de Lamotte – 75015 Paris – FranceTel. +33 6 11 96 33 78
Email : [email protected] – Website : www.smart-pharma.com
Serving & Sharing with Passion
French Pharma Market 2020 – 2025
EXCERPTS
BUSINESS REPORT
October 2021
Strategic implications for pharma companies
29
1 This position paper represents an excerpt of a comprehensive report published in 2021 by Smart Pharma Consulting that can be ordered at the following address: [email protected]
The France Pharma Market (2020 – 2025) – Excerpts
Sources: Smart Pharma Consulting
Introduction – Foreword
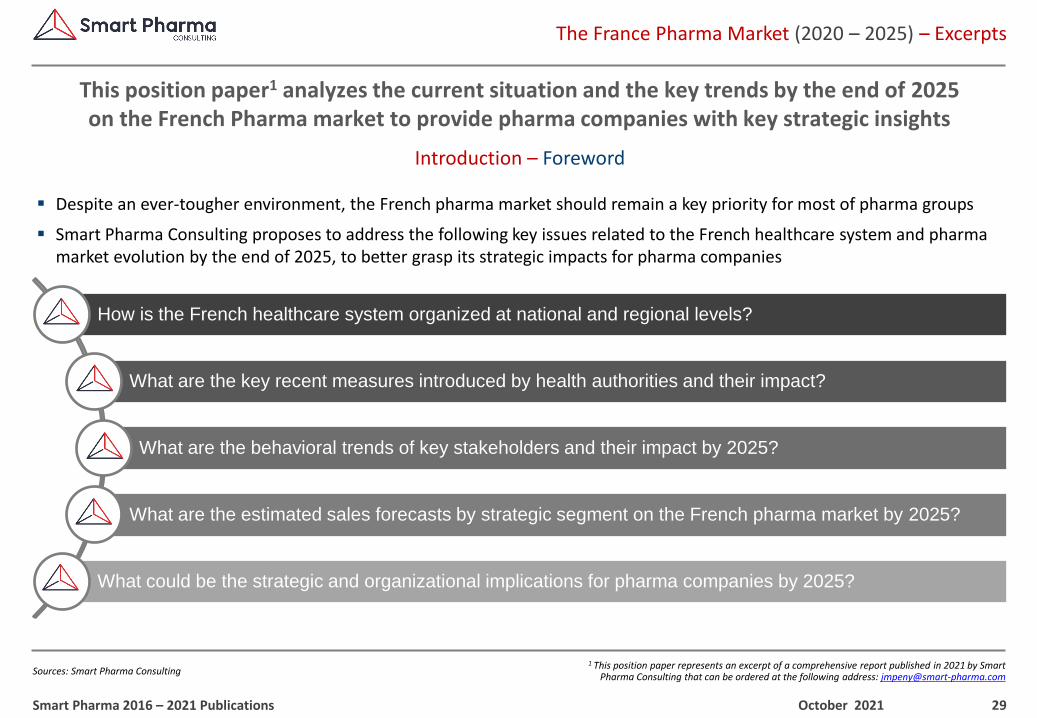
This position paper1 analyzes the current situation and the key trends by the end of 2025 on the French Pharma market to provide pharma companies with key strategic insights
October 2021Smart Pharma 2016 – 2021 Publications
How is the French healthcare system organized at national and regional levels?
What are the key recent measures introduced by health authorities and their impact?
What are the behavioral trends of key stakeholders and their impact by 2025?
What are the estimated sales forecasts by strategic segment on the French pharma market by 2025?
What could be the strategic and organizational implications for pharma companies by 2025?
▪ Despite an ever-tougher environment, the French pharma market should remain a key priority for most of pharma groups
▪ Smart Pharma Consulting proposes to address the following key issues related to the French healthcare system and pharma market evolution by the end of 2025, to better grasp its strategic impacts for pharma companies
30
1 France, Germany, Italy, Spain, UK – 2 Ex-factory price before rebates – 3 Brazil, Russia, India – 4 USA and Canada
The France Pharma Market (2020 – 2025) – Excerpts
Sources: IQVIA Institute (March 2020) – Smart Pharma Consulting estimates
Introduction – Global pharma market (2020 – 2025)
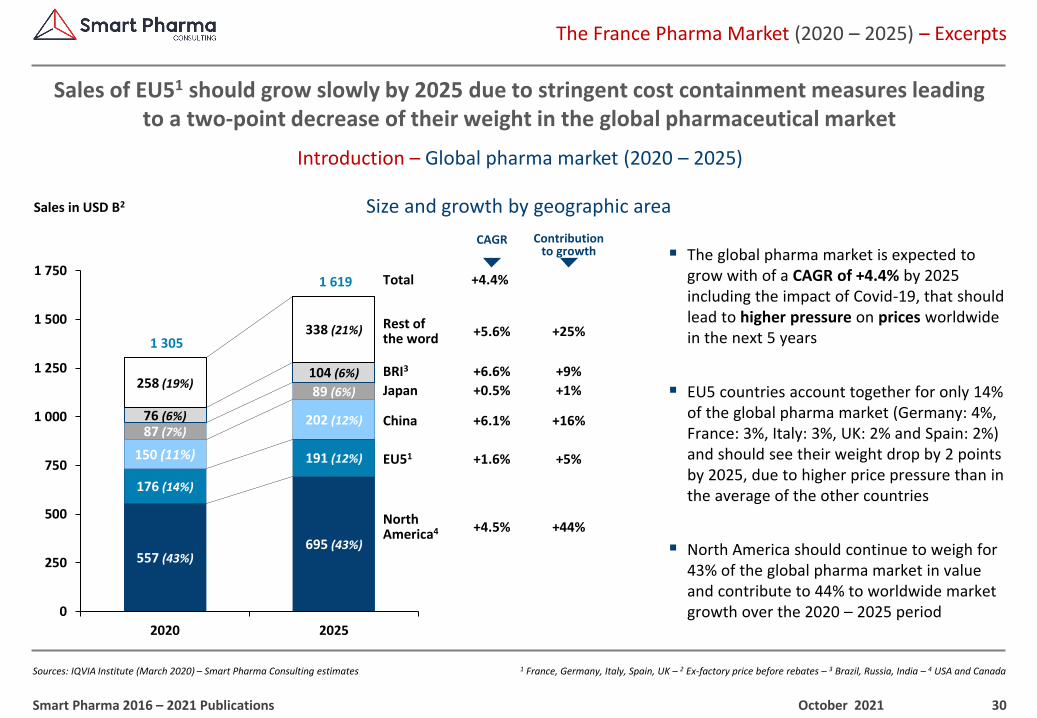
Sales of EU51 should grow slowly by 2025 due to stringent cost containment measures leadingto a two-point decrease of their weight in the global pharmaceutical market
October 2021Smart Pharma 2016 – 2021 Publications
Size and growth by geographic area
557 (43%)695 (43%)
176 (14%)
191 (12%)150 (11%)
202 (12%)87 (7%)
89 (6%)
76 (6%)
104 (6%)258 (19%)
338 (21%)1 305
1 619
0
250
500
750
1 000
1 250
1 500
1 750
2020 2025
Sales in USD B2
CAGR
Total +4.4%
+5.6%Rest of the word +25%
+6.6%BRI3 +9%
+0.5%Japan +1%
+1.6%EU51 +5%
Contributionto growth
+6.1%China +16%
▪ The global pharma market is expected to grow with of a CAGR of +4.4% by 2025 including the impact of Covid-19, that should lead to higher pressure on prices worldwide in the next 5 years
▪ EU5 countries account together for only 14% of the global pharma market (Germany: 4%, France: 3%, Italy: 3%, UK: 2% and Spain: 2%) and should see their weight drop by 2 points by 2025, due to higher price pressure than in the average of the other countries
▪ North America should continue to weigh for 43% of the global pharma market in value and contribute to 44% to worldwide market growth over the 2020 – 2025 period
+4.5%North America4 +44%
31
1 The exact name of this ministry is: Ministry of Solidarity and Health – 2 The exact name of this ministry is the Ministry for the Economy and Finance which includes the budget and the industry
The France Pharma Market (2020 – 2025) – Excerpts
Sources: Smart Pharma Consulting
The French healthcare system – Key stakeholders
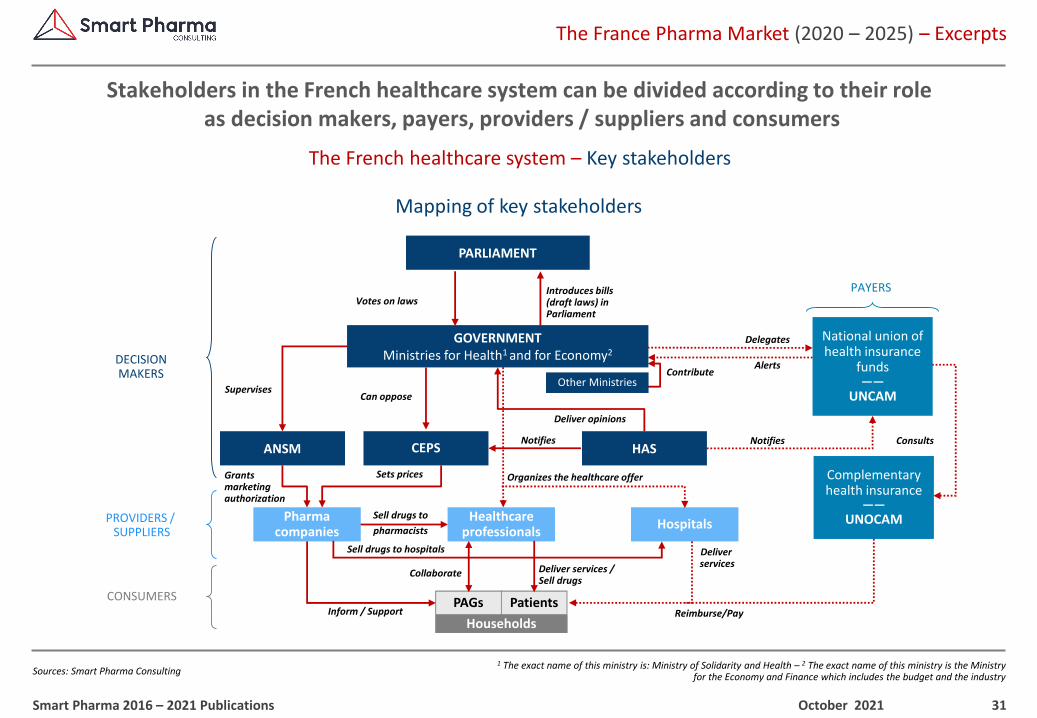
Stakeholders in the French healthcare system can be divided according to their roleas decision makers, payers, providers / suppliers and consumers
October 2021Smart Pharma 2016 – 2021 Publications
Mapping of key stakeholders
Healthcare professionals
PARLIAMENT
GOVERNMENTMinistries for Health1 and for Economy2
ANSM CEPS HAS
Votes on lawsIntroduces bills(draft laws) in Parliament
Supervises
Sets prices
Notifies
Delegates
Pharma companies
Hospitals
Can oppose
Notifies
Alerts
Other MinistriesContribute
Organizes the healthcare offer
DECISIONMAKERS
PROVIDERS / SUPPLIERS
PAYERS
PAGsCONSUMERS
HouseholdsReimburse/Pay
Consults
Complementary health insurance
——UNOCAM
National union of health insurance
funds ——
UNCAM
Inform / Support
Grants marketing authorization
DeliverservicesDeliver services /
Sell drugs
Sell drugs to hospitals
Sell drugs to
pharmacists
Patients
Collaborate
Deliver opinions

32
1 Clinically Relevant Comparator – 2 Insufficient Clinical Benefit – 3 Clinical Added Value
The France Pharma Market (2020 – 2025) – Excerpts
Sources: Transparency Committee doctrine December 2020 – Smart Pharma Consulting analyses
The French healthcare system – Key stakeholders
To assess the therapeutic progress of a product, the Transparency Committee will expect direct comparison – whenever possible – in terms of efficacy and safety with existing relevant therapies
October 2021Smart Pharma 2016 – 2021 Publications
Transparency Committee – Clinical added value (CAV) assessment
No
Yes
Versus CRC1?
Yes
Superiority?Non-inferiority?
Yes Yes
Conclusive? Conclusive?
Yes Yes
No
Justified?
No Yes
iCB2 Sufficient CBCAV3 I to V
Sufficient CBCAV V
Sufficient CBCAV I to V
No
iCB
▪ The Transparency Committee (TC) will particularly pay attention to the following criteria, in view of medical need:
‒ The quality of the demonstration:
• The choice of comparator(s)
• The methodological quality of the study
• The appropriateness of the population included
• The relevance and significance of clinical endpoints
‒ The effect size in terms of clinical efficacy, quality of life and safety in view of the demonstration robustness
‒ The clinical relevance of this effect compared to clinically relevant comparators
▪ Double-blind, randomized controlled studies is a prerequisite
▪ The absence of direct comparison to comparator must be justified and may be accepted by the TC in certain situations
▪ The absence of a direct comparison, which the TC believes was possible, may lead to an ASMR V
▪ The TC reasoning presented in this figure is not fixed and is adapted to the context of each evaluation
Direct comparison
33
1 In this case, French price cannot be lower than the lowest price in the rest of EU5 (Germany, UK, Italy and Spain) –2 Including the manufacturing of active components, finished goods and/or packaging
The France Pharma Market (2020 – 2025) – Excerpts
Sources: Framework agreement signed between CEPS and Leem (March 5, 2021) – Smart Pharma Consulting analyses
The French healthcare system – Key stakeholders
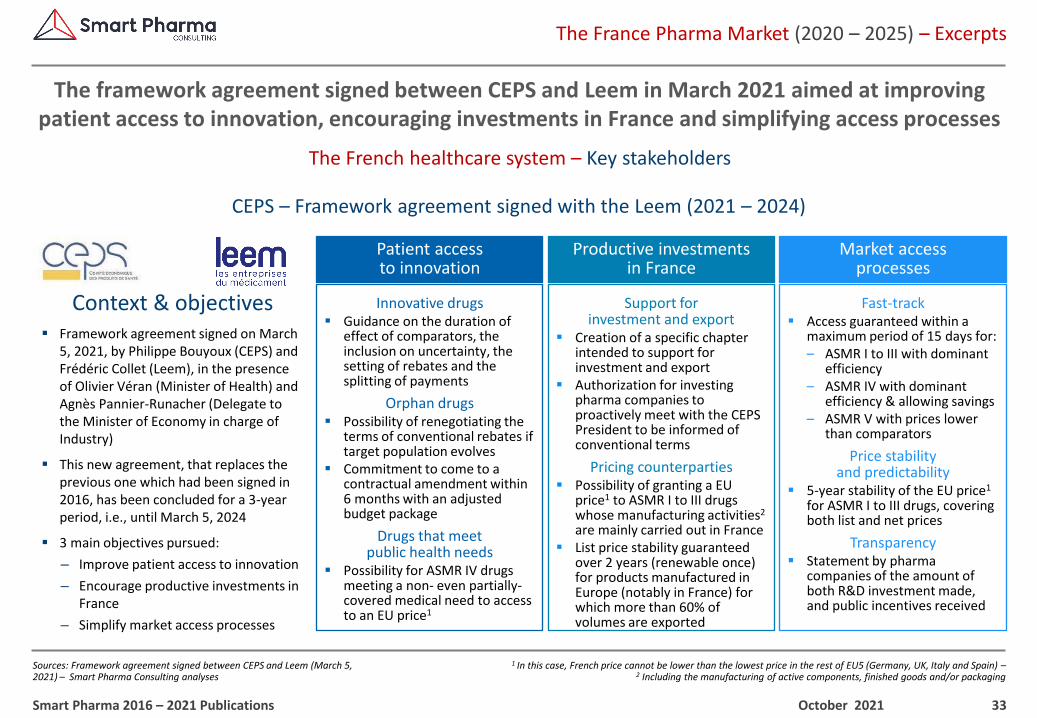
The framework agreement signed between CEPS and Leem in March 2021 aimed at improving patient access to innovation, encouraging investments in France and simplifying access processes
October 2021Smart Pharma 2016 – 2021 Publications
CEPS – Framework agreement signed with the Leem (2021 – 2024)
Context & objectives▪ Framework agreement signed on March
5, 2021, by Philippe Bouyoux (CEPS) and Frédéric Collet (Leem), in the presence of Olivier Véran (Minister of Health) and Agnès Pannier-Runacher (Delegate to the Minister of Economy in charge of Industry)
▪ This new agreement, that replaces the previous one which had been signed in 2016, has been concluded for a 3-year period, i.e., until March 5, 2024
▪ 3 main objectives pursued:
‒ Improve patient access to innovation
‒ Encourage productive investments in France
‒ Simplify market access processes
Productive investmentsin France
Market accessprocesses
Patient access to innovation
Support for investment and export
▪ Creation of a specific chapter intended to support for investment and export
▪ Authorization for investing pharma companies to proactively meet with the CEPS President to be informed of conventional terms
Pricing counterparties▪ Possibility of granting a EU
price1 to ASMR I to III drugs whose manufacturing activities2
are mainly carried out in France▪ List price stability guaranteed
over 2 years (renewable once) for products manufactured in Europe (notably in France) for which more than 60% of volumes are exported
Fast-track▪ Access guaranteed within a
maximum period of 15 days for:– ASMR I to III with dominant
efficiency– ASMR IV with dominant
efficiency & allowing savings– ASMR V with prices lower
than comparators
Price stability and predictability
▪ 5-year stability of the EU price1
for ASMR I to III drugs, covering both list and net prices
Transparency▪ Statement by pharma
companies of the amount of both R&D investment made, and public incentives received
Innovative drugs▪ Guidance on the duration of
effect of comparators, the inclusion on uncertainty, the setting of rebates and the splitting of payments
Orphan drugs▪ Possibility of renegotiating the
terms of conventional rebates if target population evolves
▪ Commitment to come to a contractual amendment within 6 months with an adjusted budget package
Drugs that meet public health needs
▪ Possibility for ASMR IV drugs meeting a non- even partially-covered medical need to access to an EU price1

34
1 Purchasing group for the Regional Teaching hospitals and other public hospitals – 2 Purchasing group for largest public hospitals in Paris and close suburbs
The France Pharma Market (2020 – 2025) – Excerpts
Sources: Business Intelligence – Smart Pharma Consulting analyses
The French healthcare system – Key stakeholders
Bosentan net price has dropped drastically as soon as the 1st call for tender, enabling the best bidder to discard competitors while taking the risk to make this “market” little or even non profitable
October 2021Smart Pharma 2016 – 2021 Publications
CEPS – Hospital generics pricing: Bosentan (Tracleer)
▪ For bosentan, the purchasers did not really value the quality of the dossier
▪ UNIHA1 and the AGEPS2 account for 80% of the total bosentan market
▪ The UNIHA market has been won at €0.25, Teva offered €0.50, and the originator price was €19
▪ The prices on generics should go up for the future calls for tender
▪ The prices should not remain at this level, which is unlikely to generate profits
▪ Such a drastic drop was not expected by Actelion (Janssen)
▪ Few small accounts do not list generics of bosentan
▪ Janssen doesn’t discount beyond -75%
100%(€33.9)
95.8%(€32.5)
57.5%(€19.5)
Initial Reference Price for Tracleer in
2017
1st reference price cut by the
CEPSApril 2017
2nd reference price cut by the CEPS Nov. 2017
-4%
Reference prices applied to bosentan 125mg 1st UNIHA Tender
1st tender won by generics
companies in Q4 2017
-99%
-40%
1st generics entry – September 2017
0.7%(€0.25)
Comments
35
1 Tarif Forfaitaire de Responsabilité (Reference price) – 2 Including cooperation and other commercial rebates
The France Pharma Market (2020 – 2025) – Excerpts
Sources: CEPS annual report (September 2020) – Legifrance (e.g., decree on September 14, 2020? intended to reevaluate wholesalers’ margin from February 1, 2021) – Ameli – Leem –Smart Pharma Consulting analyses
The French healthcare system – Key stakeholders
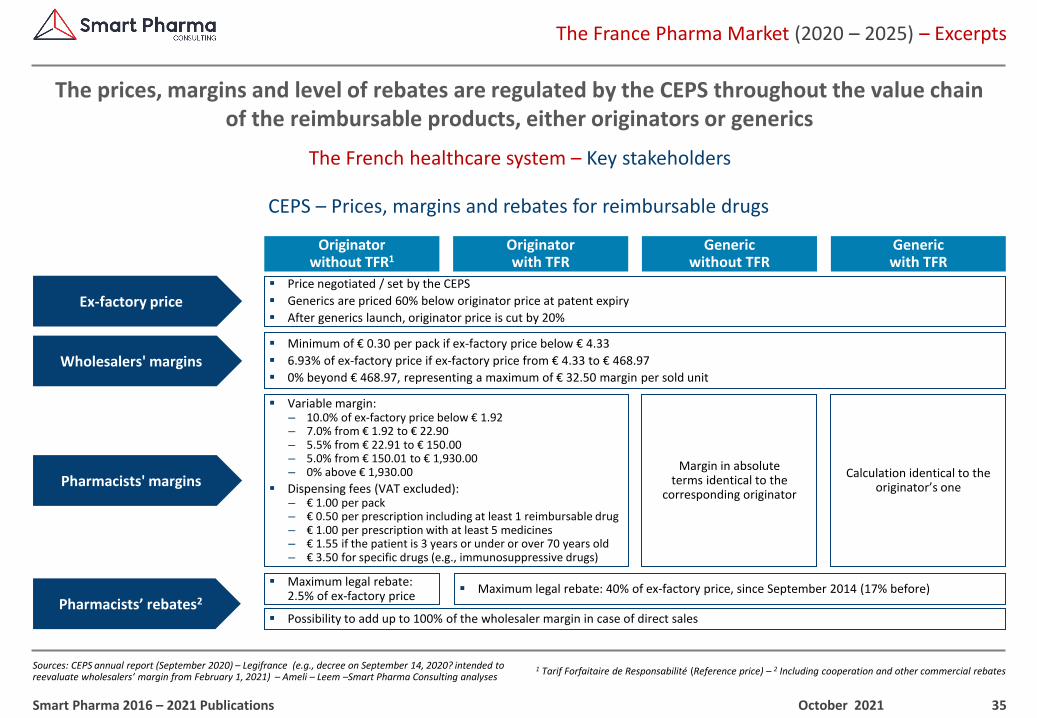
The prices, margins and level of rebates are regulated by the CEPS throughout the value chainof the reimbursable products, either originators or generics
October 2021Smart Pharma 2016 – 2021 Publications
CEPS – Prices, margins and rebates for reimbursable drugs
Originator without TFR1
Originator with TFR
Generic without TFR
Generic with TFR
Wholesalers' margins▪ Minimum of € 0.30 per pack if ex-factory price below € 4.33
▪ 6.93% of ex-factory price if ex-factory price from € 4.33 to € 468.97
▪ 0% beyond € 468.97, representing a maximum of € 32.50 margin per sold unit
Ex-factory price▪ Price negotiated / set by the CEPS
▪ Generics are priced 60% below originator price at patent expiry
▪ After generics launch, originator price is cut by 20%
Pharmacists’ rebates2▪ Maximum legal rebate: 40% of ex-factory price, since September 2014 (17% before)
▪ Maximum legal rebate: 2.5% of ex-factory price
▪ Possibility to add up to 100% of the wholesaler margin in case of direct sales
Pharmacists' margins
▪ Variable margin: – 10.0% of ex-factory price below € 1.92– 7.0% from € 1.92 to € 22.90 – 5.5% from € 22.91 to € 150.00– 5.0% from € 150.01 to € 1,930.00– 0% above € 1,930.00
▪ Dispensing fees (VAT excluded): – € 1.00 per pack– € 0.50 per prescription including at least 1 reimbursable drug– € 1.00 per prescription with at least 5 medicines– € 1.55 if the patient is 3 years or under or over 70 years old– € 3.50 for specific drugs (e.g., immunosuppressive drugs)
Margin in absoluteterms identical to the
corresponding originator
Calculation identical to the originator’s one
36
1 Excluding early access programs for breakthrough innovations (e.g., ATU in France) –2 For drugs receiving their first marketing authorization between 2015 and 2017
The France Pharma Market (2020 – 2025) – Excerpts
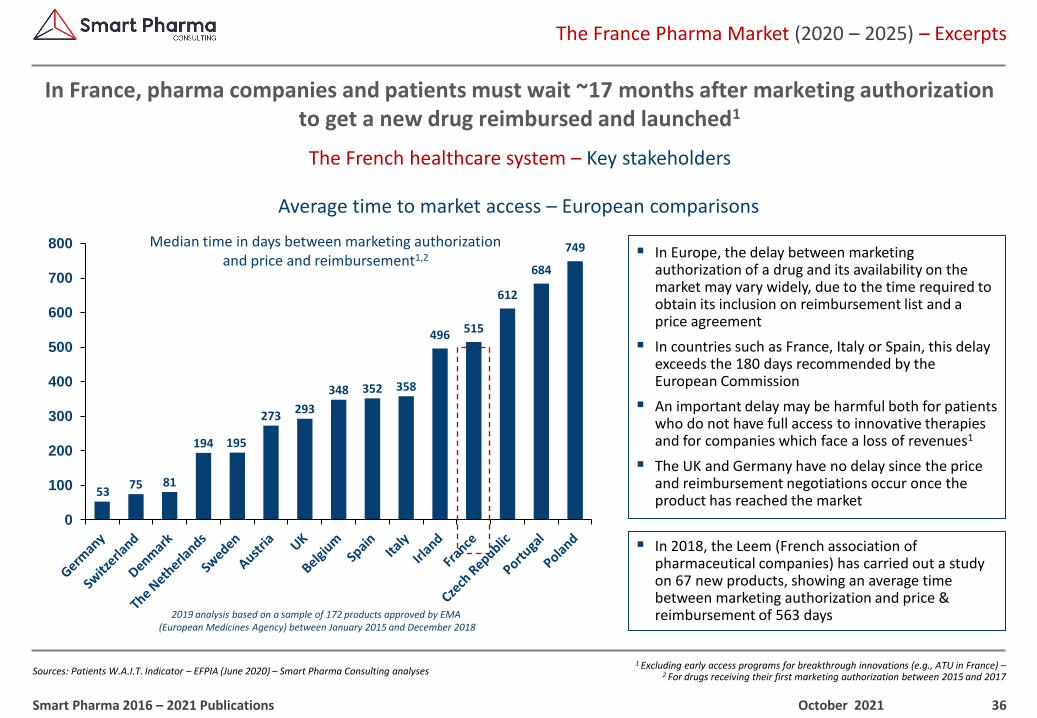
Sources: Patients W.A.I.T. Indicator – EFPIA (June 2020) – Smart Pharma Consulting analyses
In France, pharma companies and patients must wait ~17 months after marketing authorization to get a new drug reimbursed and launched1
October 2021Smart Pharma 2016 – 2021 Publications
Average time to market access – European comparisons
5375 81
194 195
273293
348 352 358
496 515
612
684
749
0
100
200
300
400
500
600
700
800 Median time in days between marketing authorizationand price and reimbursement1,2 ▪ In Europe, the delay between marketing
authorization of a drug and its availability on the market may vary widely, due to the time required to obtain its inclusion on reimbursement list and a price agreement
▪ In countries such as France, Italy or Spain, this delay exceeds the 180 days recommended by the European Commission
▪ An important delay may be harmful both for patients who do not have full access to innovative therapies and for companies which face a loss of revenues1
▪ The UK and Germany have no delay since the price and reimbursement negotiations occur once the product has reached the market
▪ In 2018, the Leem (French association of pharmaceutical companies) has carried out a study on 67 new products, showing an average time between marketing authorization and price & reimbursement of 563 days2019 analysis based on a sample of 172 products approved by EMA
(European Medicines Agency) between January 2015 and December 2018
The French healthcare system – Key stakeholders
37
The France Pharma Market (2020 – 2025) – Excerpts
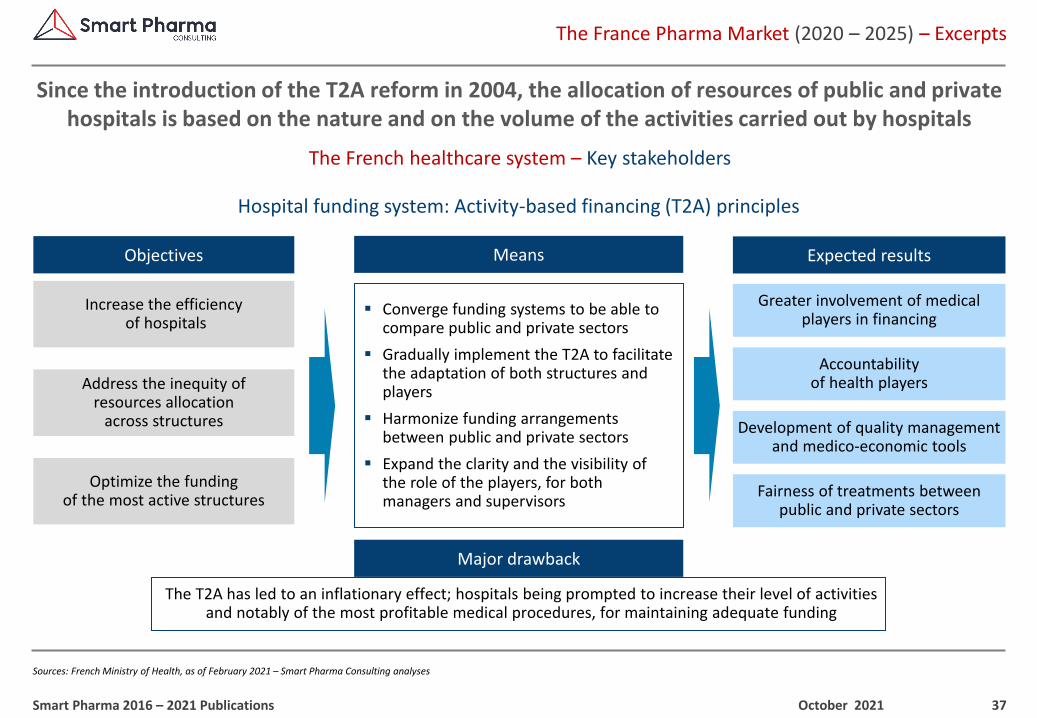
Sources: French Ministry of Health, as of February 2021 – Smart Pharma Consulting analyses
Since the introduction of the T2A reform in 2004, the allocation of resources of public and private hospitals is based on the nature and on the volume of the activities carried out by hospitals
October 2021Smart Pharma 2016 – 2021 Publications
Hospital funding system: Activity-based financing (T2A) principles
Objectives Means Expected results
The T2A has led to an inflationary effect; hospitals being prompted to increase their level of activities and notably of the most profitable medical procedures, for maintaining adequate funding
Major drawback
Increase the efficiencyof hospitals
Optimize the fundingof the most active structures
Address the inequity ofresources allocation
across structures
Greater involvement of medical players in financing
Accountability of health players
Development of quality management and medico-economic tools
Fairness of treatments between public and private sectors
▪ Converge funding systems to be able to compare public and private sectors
▪ Gradually implement the T2A to facilitate the adaptation of both structures and players
▪ Harmonize funding arrangements between public and private sectors
▪ Expand the clarity and the visibility of the role of the players, for both managers and supervisors
The French healthcare system – Key stakeholders
38
1 Inclusive of legal margin, rebates, commercial agreements and remuneration for pharmaceutical services, notably those corresponding to the public health objectives (e.g., generics substitution objectives, pharmaceutical interviews with patients, etc.)
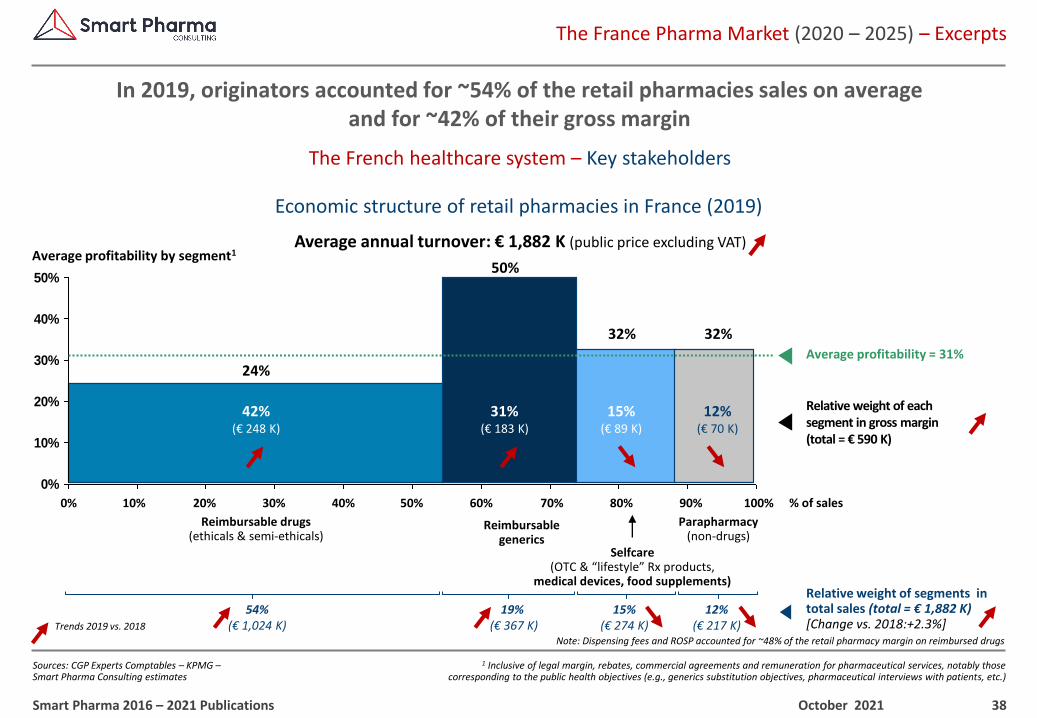
The France Pharma Market (2020 – 2025) – Excerpts
Sources: CGP Experts Comptables – KPMG –Smart Pharma Consulting estimates
The French healthcare system – Key stakeholders
In 2019, originators accounted for ~54% of the retail pharmacies sales on averageand for ~42% of their gross margin
October 2021Smart Pharma 2016 – 2021 Publications
Economic structure of retail pharmacies in France (2019)
54%(€ 1,024 K)
0%
10%
20%
30%
40%
50%
Reimbursable drugs(ethicals & semi-ethicals)
Relative weight of segments in total sales (total = € 1,882 K)[Change vs. 2018:+2.3%]
20% 50% % of sales10% 30% 40% 70% 90%80% 100%60%0%
42%(€ 248 K)
Relative weight of each segment in gross margin(total = € 590 K)
24%
Average profitability by segment1
15%(€ 274 K)
12%(€ 217 K)Trends 2019 vs. 2018
19% (€ 367 K)
32%
12%(€ 70 K)
Parapharmacy(non-drugs)
Reimbursablegenerics
50%
31%(€ 183 K)
32%
15%(€ 89 K)
Selfcare(OTC & “lifestyle” Rx products,
medical devices, food supplements)
Average annual turnover: € 1,882 K (public price excluding VAT)
Average profitability = 31%
Note: Dispensing fees and ROSP accounted for ~48% of the retail pharmacy margin on reimbursed drugs
39
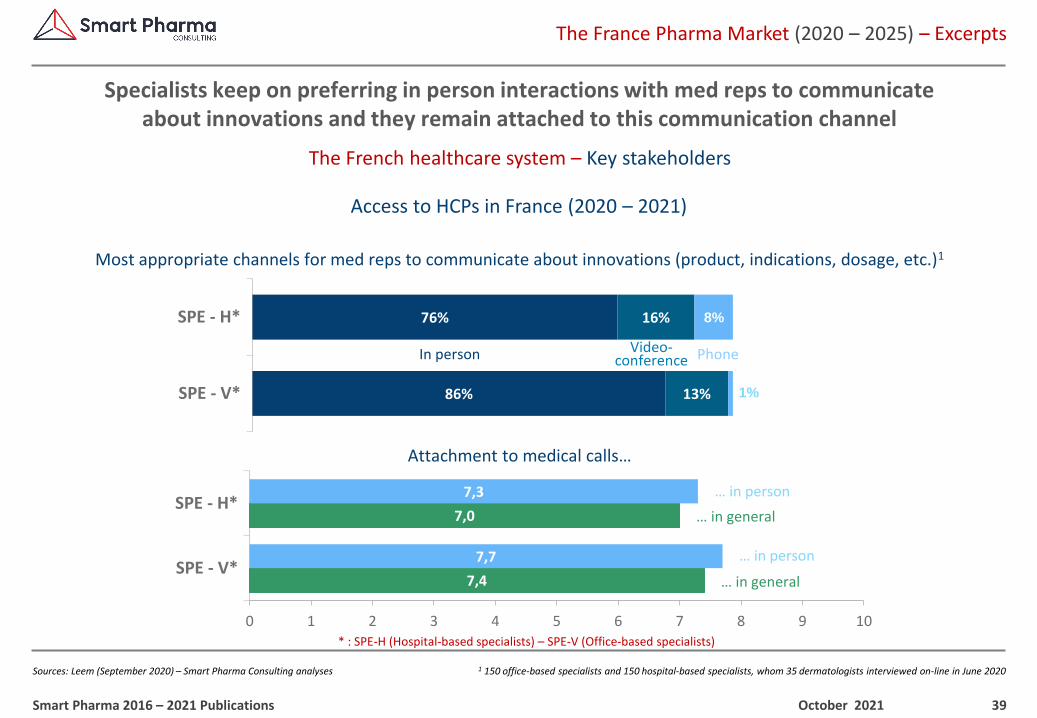
1 150 office-based specialists and 150 hospital-based specialists, whom 35 dermatologists interviewed on-line in June 2020
The France Pharma Market (2020 – 2025) – Excerpts
Sources: Leem (September 2020) – Smart Pharma Consulting analyses
The French healthcare system – Key stakeholders
Specialists keep on preferring in person interactions with med reps to communicate about innovations and they remain attached to this communication channel
October 2021Smart Pharma 2016 – 2021 Publications
Access to HCPs in France (2020 – 2021)
Most appropriate channels for med reps to communicate about innovations (product, indications, dosage, etc.)1
* : SPE-H (Hospital-based specialists) – SPE-V (Office-based specialists)
7,4
7,0
7,7
7,3
0 1 2 3 4 5 6 7 8 9 10
SPE - V*
SPE - H*… in general
… in person
In person Video-conference Phone
… in general
… in person
Attachment to medical calls…
86%
76%
13%
16%
1%
8%
SPE - V*
SPE - H*
40
The France Pharma Market (2020 – 2025) – Excerpts
Sources: Smart Pharma Consulting estimates and analyses based on multiple historical studies (e.g., DRGs – ZS – McKinsey)
The French healthcare system – Key stakeholders
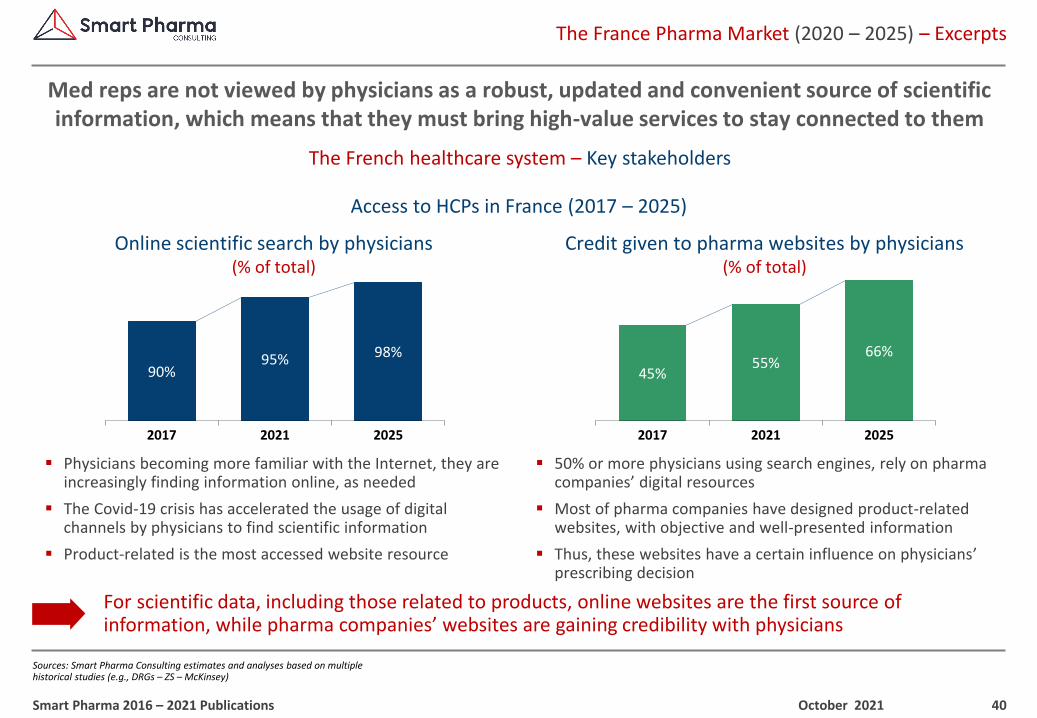
Med reps are not viewed by physicians as a robust, updated and convenient source of scientific information, which means that they must bring high-value services to stay connected to them
October 2021Smart Pharma 2016 – 2021 Publications
Access to HCPs in France (2017 – 2025)
Online scientific search by physicians(% of total)
Credit given to pharma websites by physicians(% of total)
90%95% 98%
2017 2021 2025
45%55%
66%
2017 2021 2025
▪ Physicians becoming more familiar with the Internet, they are increasingly finding information online, as needed
▪ The Covid-19 crisis has accelerated the usage of digital channels by physicians to find scientific information
▪ Product-related is the most accessed website resource
▪ 50% or more physicians using search engines, rely on pharma companies’ digital resources
▪ Most of pharma companies have designed product-related websites, with objective and well-presented information
▪ Thus, these websites have a certain influence on physicians’ prescribing decision
For scientific data, including those related to products, online websites are the first source of information, while pharma companies’ websites are gaining credibility with physicians
41
1 For non-valid reasons – 2 This law created by the LFSS 2014 has never been implemented in the absence of a decree defining the conditions of substitution
The France Pharma Market (2020 – 2025) – Excerpts
Sources: LFSS 2020 – “Loi de Financement de la Sécurité Sociale pour 2020” NILE Consulting – Smart Pharma Consulting analyses
The French healthcare system – Recent reforms
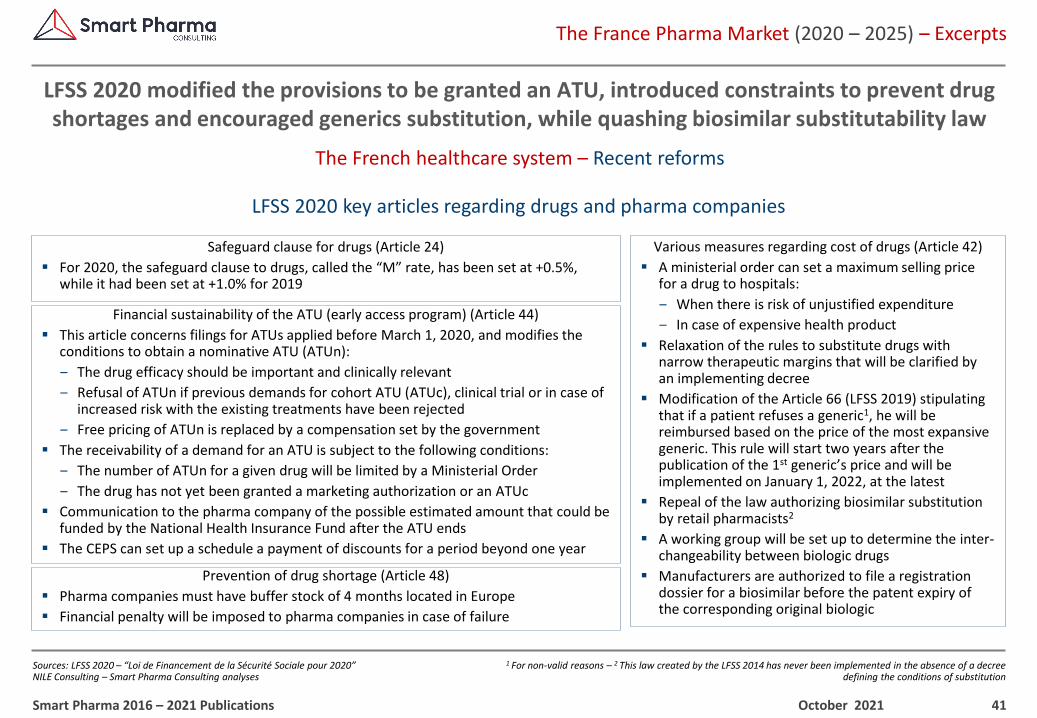
LFSS 2020 modified the provisions to be granted an ATU, introduced constraints to prevent drug shortages and encouraged generics substitution, while quashing biosimilar substitutability law
October 2021Smart Pharma 2016 – 2021 Publications
LFSS 2020 key articles regarding drugs and pharma companies
Safeguard clause for drugs (Article 24)
▪ For 2020, the safeguard clause to drugs, called the “M” rate, has been set at +0.5%, while it had been set at +1.0% for 2019
Various measures regarding cost of drugs (Article 42)
▪ A ministerial order can set a maximum selling price for a drug to hospitals:
‒ When there is risk of unjustified expenditure
‒ In case of expensive health product
▪ Relaxation of the rules to substitute drugs with narrow therapeutic margins that will be clarified by an implementing decree
▪ Modification of the Article 66 (LFSS 2019) stipulating that if a patient refuses a generic1, he will be reimbursed based on the price of the most expansive generic. This rule will start two years after the publication of the 1st generic’s price and will be implemented on January 1, 2022, at the latest
▪ Repeal of the law authorizing biosimilar substitution by retail pharmacists2
▪ A working group will be set up to determine the inter-changeability between biologic drugs
▪ Manufacturers are authorized to file a registration dossier for a biosimilar before the patent expiry of the corresponding original biologic
Financial sustainability of the ATU (early access program) (Article 44)
▪ This article concerns filings for ATUs applied before March 1, 2020, and modifies the conditions to obtain a nominative ATU (ATUn):
‒ The drug efficacy should be important and clinically relevant
‒ Refusal of ATUn if previous demands for cohort ATU (ATUc), clinical trial or in case of increased risk with the existing treatments have been rejected
‒ Free pricing of ATUn is replaced by a compensation set by the government
▪ The receivability of a demand for an ATU is subject to the following conditions:
‒ The number of ATUn for a given drug will be limited by a Ministerial Order
‒ The drug has not yet been granted a marketing authorization or an ATUc
▪ Communication to the pharma company of the possible estimated amount that could be funded by the National Health Insurance Fund after the ATU ends
▪ The CEPS can set up a schedule a payment of discounts for a period beyond one year
Prevention of drug shortage (Article 48)
▪ Pharma companies must have buffer stock of 4 months located in Europe
▪ Financial penalty will be imposed to pharma companies in case of failure
42
1 Also named PDS (Plateforme des données de santé) – 2 Système National des Données de Santé – 3 Commission Nationale de l’Informatique et des Libertés
(National commission for information technology and civil liberties)
The France Pharma Market (2020 – 2025) – Excerpts
Sources: “La Plateforme des données de santé (Health Data Hub)”, CNIL (February 2021) – “Health Data Hub : 6 questions sur la plateforme de données de santé et sa polémique”, Numerama (June 2020) – “Le Health Data Hub : quelles opportunités pour l’industrie pharmaceutique ?”, Alcimed (July 2020) – Smart Pharma Consulting analyses
The French healthcare system – Recent reforms
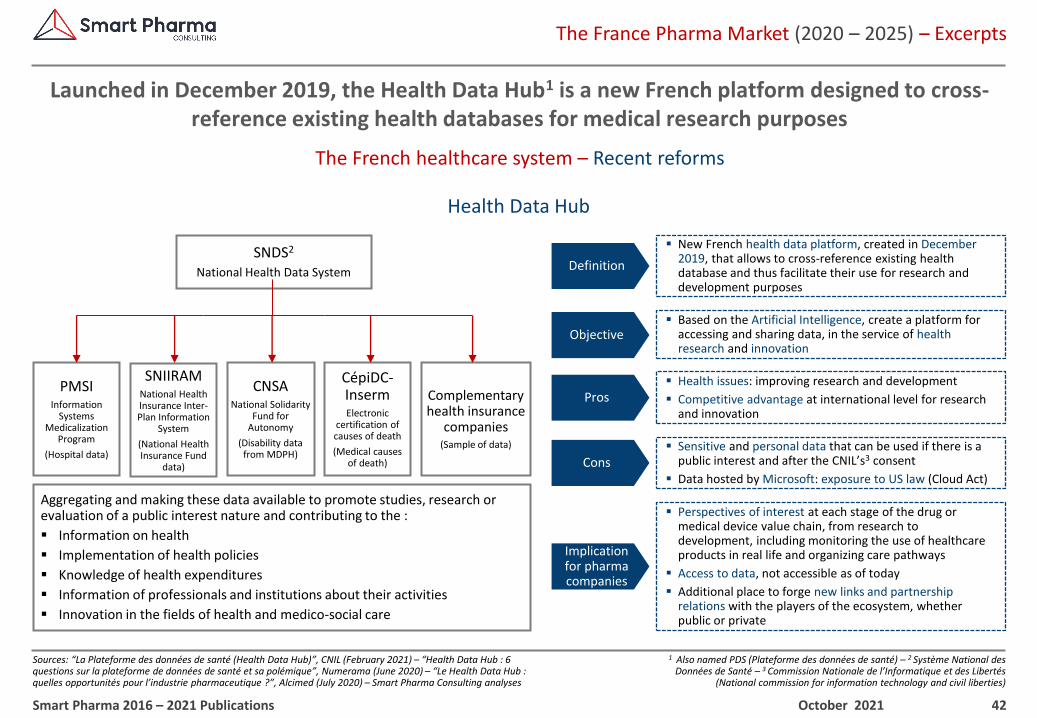
Launched in December 2019, the Health Data Hub1 is a new French platform designed to cross-reference existing health databases for medical research purposes
October 2021Smart Pharma 2016 – 2021 Publications
Health Data Hub
▪ Health issues: improving research and development
▪ Competitive advantage at international level for research and innovation
▪ New French health data platform, created in December 2019, that allows to cross-reference existing health database and thus facilitate their use for research and development purposes
Definition
▪ Based on the Artificial Intelligence, create a platform for accessing and sharing data, in the service of health research and innovation
Objective
Pros
Cons
Implication for pharma companies
▪ Sensitive and personal data that can be used if there is a public interest and after the CNIL’s3 consent
▪ Data hosted by Microsoft: exposure to US law (Cloud Act)
▪ Perspectives of interest at each stage of the drug or medical device value chain, from research to development, including monitoring the use of healthcare products in real life and organizing care pathways
▪ Access to data, not accessible as of today
▪ Additional place to forge new links and partnership relations with the players of the ecosystem, whether public or private
SNDS2
National Health Data System
PMSIInformation
Systems Medicalization
Program
(Hospital data)
CNSANational Solidarity
Fund for Autonomy
(Disability data from MDPH)
Complementary health insurance
companies(Sample of data)
CépiDC-InsermElectronic
certification of causes of death
(Medical causes of death)
SNIIRAMNational Health Insurance Inter-Plan Information
System
(National Health Insurance Fund
data)
Aggregating and making these data available to promote studies, research or evaluation of a public interest nature and contributing to the :
▪ Information on health
▪ Implementation of health policies
▪ Knowledge of health expenditures
▪ Information of professionals and institutions about their activities
▪ Innovation in the fields of health and medico-social care
43
1 Rare exceptions (e.g., vaccines) – 2 Psychotropic or narcotic drugs – 3 When the pharma company does not wish to communicate to the general public –4 Whatever the claims – 5 Possibility of “free access” within the retail pharmacy for certain OTC products –
6 Only for claims relating to healing, alleviating or preventing diseases – 7 Other than drugs and pharmaceutical products
The France Pharma Market (2020 – 2025) – Excerpts
Sources: ANSM – DGCCRF –Smart Pharma Consulting analyses
The French pharmaceutical market – Evolution of drugs sales
Pharmaceutical products can be split into prescription-bound and non-prescription-bound drugs, knowing that some of the prescribed drugs are not reimbursed
October 2021Smart Pharma 2016 – 2021 Publications
Classification of pharmaceutical products in France
Prescription-bound(included in the List I or II of toxic/dangerous substances)
Non-prescription-bound(not listed among toxic/dangerous
substances)
Prescription No prescription
Reimbursable /non reimbursable
Reimbursable(only if prescribed)
Not reimbursable(OTCs)
Pharmacy-promoted drugs
DTC drugs
Not allowed1 Not allowed¹Not allowed2
Not requested3Allowed upon
request4
PharmacyBehind the counter
PharmacyBehind the counter
PharmacyPossible free access5
PharmacyPossible free access5
OTC Market (strict definition)OTX Market
Prescriptionconditions
Reimbursementstatus
DTC advertising
Delivery point
Pharmaceutical products(requiring a marketing authorization)
Health products7
Food supplements(no marketing authorization)
Prescriptionnot required
Not reimbursable
Authorized upon request6
Pharmacies,Parapharmacies, etc.
Self-medication market (on OTC)Note: OTC = Over-the-counter, OTX = combination of prescription (RX) and over-the-counter (OTC), DTC = Direct to consumer
Semi-ethicaldrugs
Ethical drugs
44
1 Constant ex-factory price, excluding rebates and taxes (including rebates, the hospital market amounted to ~€ 7.9 billion in 2020)
The France Pharma Market (2020 – 2025) – Excerpts
Sources: GERS – Smart Pharma Consulting analyses
The French pharmaceutical market – Evolution of drugs sales
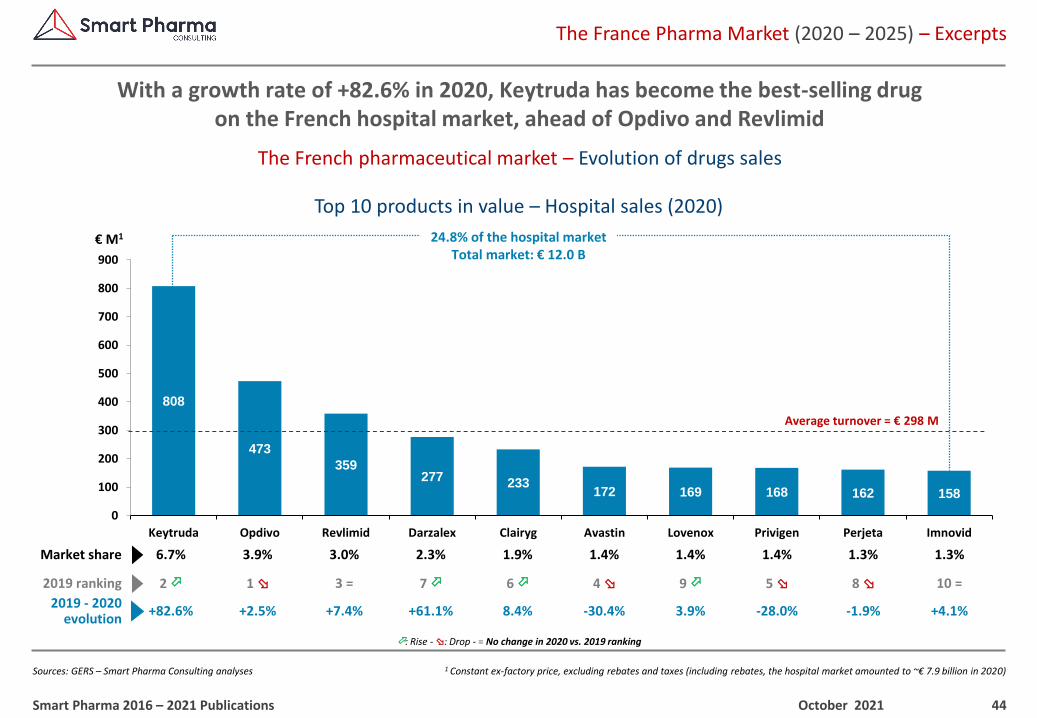
With a growth rate of +82.6% in 2020, Keytruda has become the best-selling drugon the French hospital market, ahead of Opdivo and Revlimid
October 2021Smart Pharma 2016 – 2021 Publications
Top 10 products in value – Hospital sales (2020)
808
473
359277 233
172 169 168 162 158
0
100
200
300
400
500
600
700
800
900
Keytruda Opdivo Revlimid Darzalex Clairyg Avastin Lovenox Privigen Perjeta Imnovid
Average turnover = € 298 M
€ M1
3.0%6.7% 1.3%1.4%3.9% 2.3% 1.9% 1.4% 1.4% 1.3%Market share
2019 - 2020evolution
+7.4%+82.6% -1.9%-30.4%+2.5% +61.1% 8.4% 3.9% -28.0% +4.1%
: Rise - : Drop - = No change in 2020 vs. 2019 ranking
24.8% of the hospital marketTotal market: € 12.0 B
3 =2 8 4 1 7 6 9 5 2019 ranking 10 =
45
1 Ex-factory price, excluding rebates and taxes
The France Pharma Market (2020 – 2025) – Excerpts
Sources: GERS – Smart Pharma Consulting analyses
The French pharmaceutical market – Evolution of drugs sales
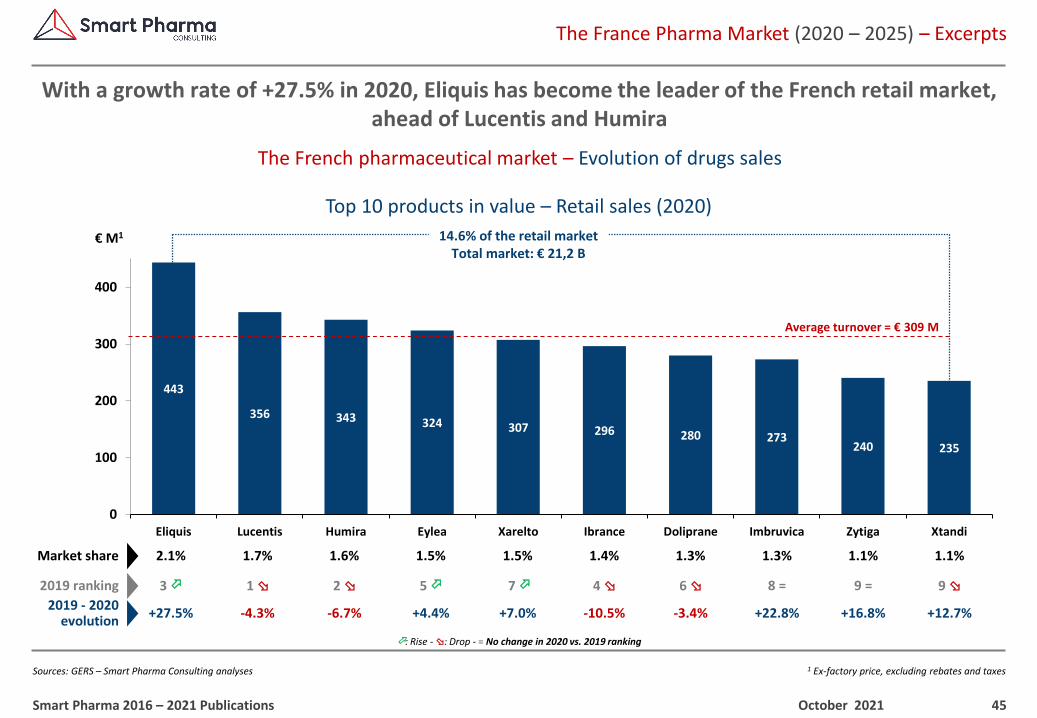
With a growth rate of +27.5% in 2020, Eliquis has become the leader of the French retail market, ahead of Lucentis and Humira
October 2021Smart Pharma 2016 – 2021 Publications
Top 10 products in value – Retail sales (2020)
: Rise - : Drop - = No change in 2020 vs. 2019 ranking
443
356 343 324 307 296 280 273240 235
0
100
200
300
400
Eliquis Lucentis Humira Eylea Xarelto Ibrance Doliprane Imbruvica Zytiga Xtandi
Average turnover = € 309 M
€ M1
1.6%2.1% 1.1%1.4%1.7% 1.5% 1.5% 1.3% 1.3% 1.1%Market share
2019 - 2020evolution
-6.7%+27.5% +16.8%-10.5%-4.3% +4.4% +7.0% -3.4% +22.8% +12.7%
14.6% of the retail marketTotal market: € 21,2 B
2 3 9 =4 1 5 7 6 8 =2019 ranking 9
46
1 Constant ex-factory prices, excluding taxes and rebates, except for hospital sales for which rebated sales have been estimated – 2 Including Sandoz –3 Company founded in November 2020 by the merger of Mylan, Mylan Medical and Pfizer Upjohn activities – 4 Including Celgene (acquired in 2019)
but excluding UPSA (acquired by Taisho Pharmaceutical in 2019) – 5 Janssen and J&J Santé Beauté – 6 Including Biogaran
The France Pharma Market (2020 – 2025) – Excerpts
Sources: GERS – Smart Pharma Consulting analyses and estimates
The French pharmaceutical market – Evolution of pharma companies’ sales
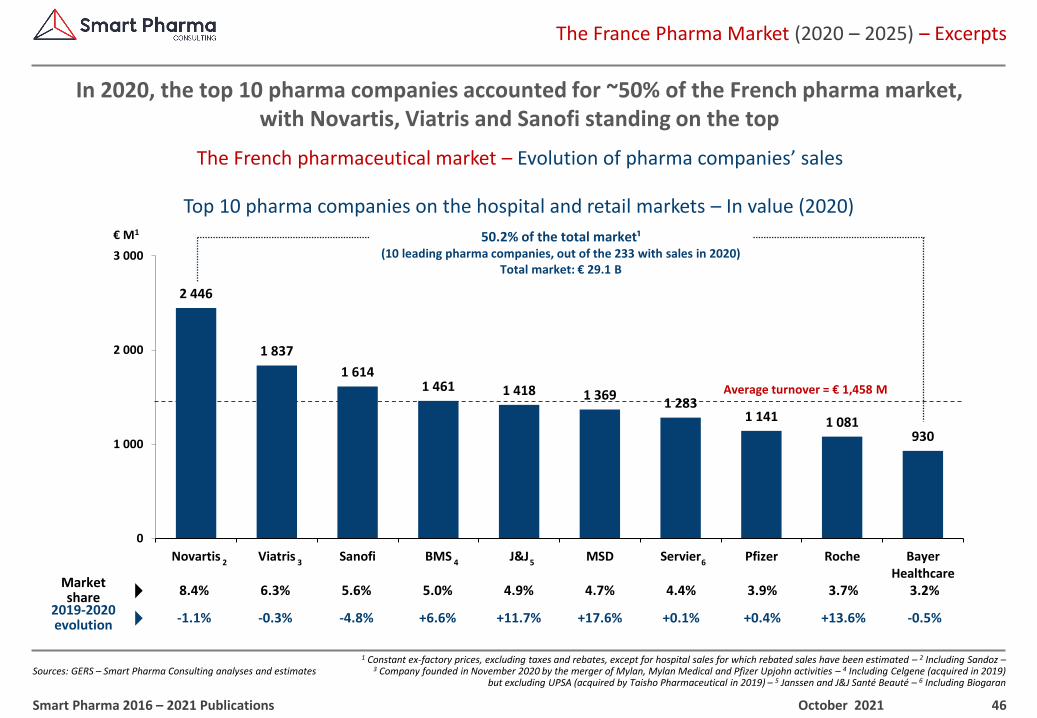
In 2020, the top 10 pharma companies accounted for ~50% of the French pharma market,with Novartis, Viatris and Sanofi standing on the top
October 2021Smart Pharma 2016 – 2021 Publications
Top 10 pharma companies on the hospital and retail markets – In value (2020)
2 446
1 837
1 6141 461 1 418 1 369
1 2831 141 1 081
930
0
1 000
2 000
3 000
Novartis Viatris Sanofi BMS J&J MSD Servier Pfizer Roche BayerHealthcare
Marketshare
€ M1 50.2% of the total market¹(10 leading pharma companies, out of the 233 with sales in 2020)
Total market: € 29.1 B
5.6%8.4% 3.7%4.7%6.3% 5.0% 4.9% 4.4% 3.9% 3.2%
Average turnover = € 1,458 M
2019-2020evolution -4.8%-1.1% +13.6%+17.6%-0.3% +6.6% +11.7% +0.1% +0.4% -0.5%
2 3 4 5 6
47
1 Reimbursable and non-reimbursable, listed in the ANSM generics Directory, including quasi generics – 2 Ex-factory price, excluding taxes and rebates – 3 Part of Aurobindo, since its acquisition of Actavis in 2014 – 4 Acquired by Advent
International on September 30th, 2018 – 5 Subsidiary of Stada which was acquired by Bain Capital and Cinven in August 2017
The France Pharma Market (2020 – 2025) – Excerpts
Sources: GERS – Smart Pharma Consulting analyses and estimates
The French pharmaceutical market – Evolution of pharma companies’ sales
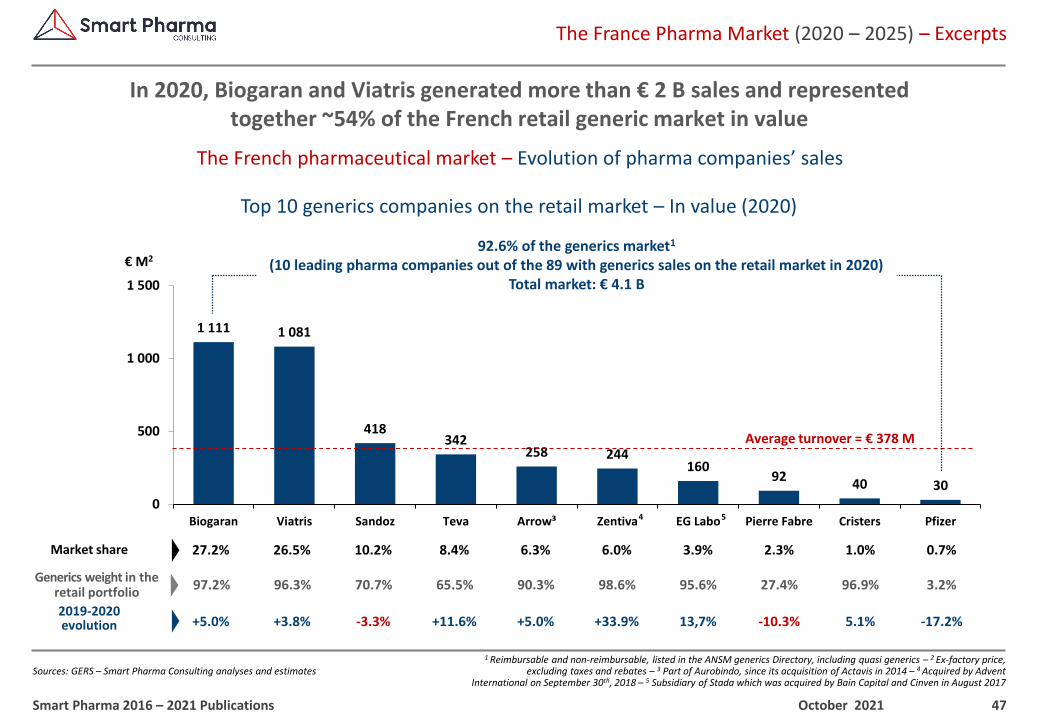
In 2020, Biogaran and Viatris generated more than € 2 B sales and representedtogether ~54% of the French retail generic market in value
October 2021Smart Pharma 2016 – 2021 Publications
Top 10 generics companies on the retail market – In value (2020)
1 111 1 081
418342
258 244160
9240 30
0
500
1 000
1 500
Biogaran Viatris Sandoz Teva Arrow³ Zentiva EG Labo Pierre Fabre Cristers Pfizer
Average turnover = € 378 M
€ M2
96.3%97.2% 3.2%95.6%70.7% 90.3% 98.6% 27.4% 96.9%65.5%Generics weight in the
retail portfolio
+3.8%+5.0% -17.2%13,7%-3.3% +5.0% +33.9% -10.3% 5.1%+11.6%2019-2020evolution
92.6% of the generics market1
(10 leading pharma companies out of the 89 with generics sales on the retail market in 2020)Total market: € 4.1 B
4
26.5%27.2% 0.7%3.9%10.2% 6.3% 6.0% 2.3% 1.0%8.4%Market share
5
48
1 Non-listed, non-reimbursable products – 2 Ex-factory prices, excluding rebates and taxes – 3 Being sold by Charterhouse, which had acquired it from Caravelle in 2015 – 4 Acquired by Taisho Pharmaceutical in 2019 –
5 Company founded in November 2020 by the merger of Mylan, Mylan Medical and Pfizer Upjohn activities
The France Pharma Market (2020 – 2025) – Excerpts
Sources: GERS – Smart Pharma Consulting analyses and estimates
The French pharmaceutical market – Evolution of pharma companies’ sales
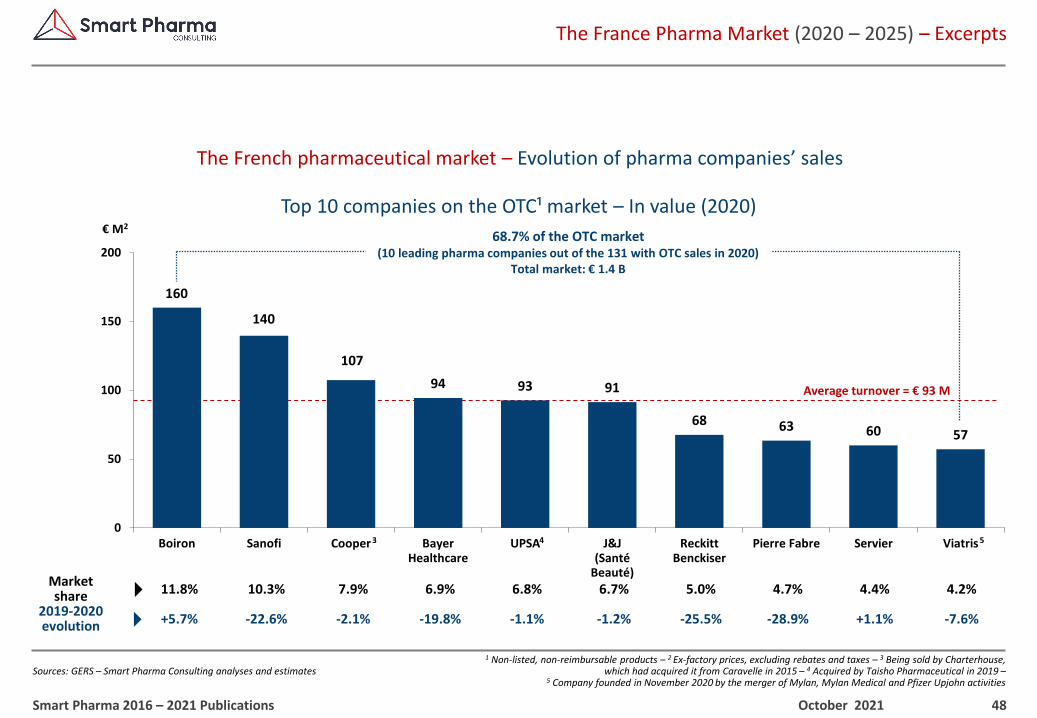
October 2021Smart Pharma 2016 – 2021 Publications
Top 10 companies on the OTC¹ market – In value (2020)
160
140
107
94 93 91
68 63 60 57
0
50
100
150
200
Boiron Sanofi Cooper Bayer Healthcare
UPSA J&J(Santé
Beauté)
Reckitt Benckiser
Pierre Fabre Servier Viatris
€ M2
68.7% of the OTC market(10 leading pharma companies out of the 131 with OTC sales in 2020)
Total market: € 1.4 B
Average turnover = € 93 M
Marketshare
2019-2020evolution -22.6%
6.9%
-2.1%
10.3%
-19.8%
7.9%
+5.7%
11.8%
-1.1%
6.8%
-1.2%
6.7%
-25.5%
5.0%
+1.1%
4.4%
-28.9%
4.7%
-7.6%
4.2%
3 4 5
49
¹ Constant ex-factory prices – 2 Estimated rebated sales including hospital sales of biosimilars, products invoiced on top of “T2A” and reassigned medicines3 Sales of drugs whose patents have not expired and of other specific products (calcium, sodium, potassium, paracetamol, etc.) – 4 Compound annual growth rate
The France Pharma Market (2020 – 2025) – Excerpts
Sources: GERS dashboards –Smart Pharma Consulting estimates
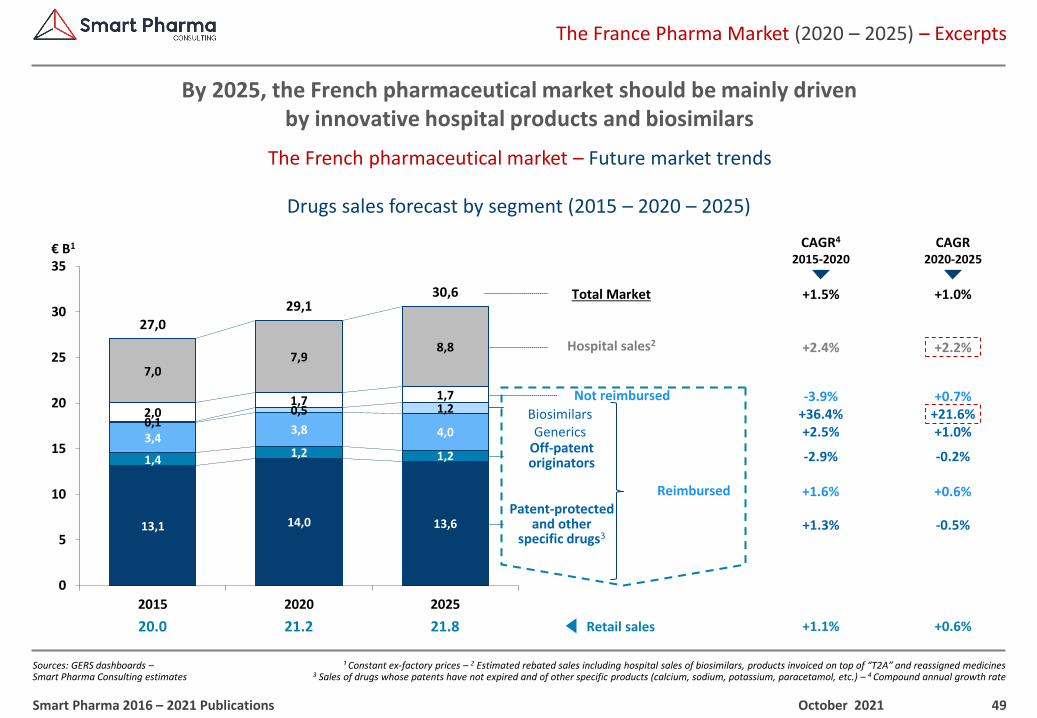
The French pharmaceutical market – Future market trends
By 2025, the French pharmaceutical market should be mainly driven by innovative hospital products and biosimilars
October 2021Smart Pharma 2016 – 2021 Publications
Drugs sales forecast by segment (2015 – 2020 – 2025)
+0.6%
+2.2%
+0.7%
+1.0%
-0.2%
+0.6%
+21.6%
-0.5%
+1.0%
21.821.220.0
Total Market
€ B1
+1.5%
Hospital sales2
Off-patentoriginators
Patent-protectedand other
specific drugs3
Not reimbursed
Retail sales
Generics
Reimbursed +1.6%
+2.4%
-3.9%
+2.5%
-2.9%
+1.1%
+36.4%
+1.3%13,1 14,0 13,6
1,41,2 1,2
3,43,8 4,0
0,10,5 1,22,01,7 1,7
7,07,9
8,8
27,0
29,130,6
0
5
10
15
20
25
30
35
2015 2020 2025
Biosimilars
CAGR4
2015-2020CAGR
2020-2025
50
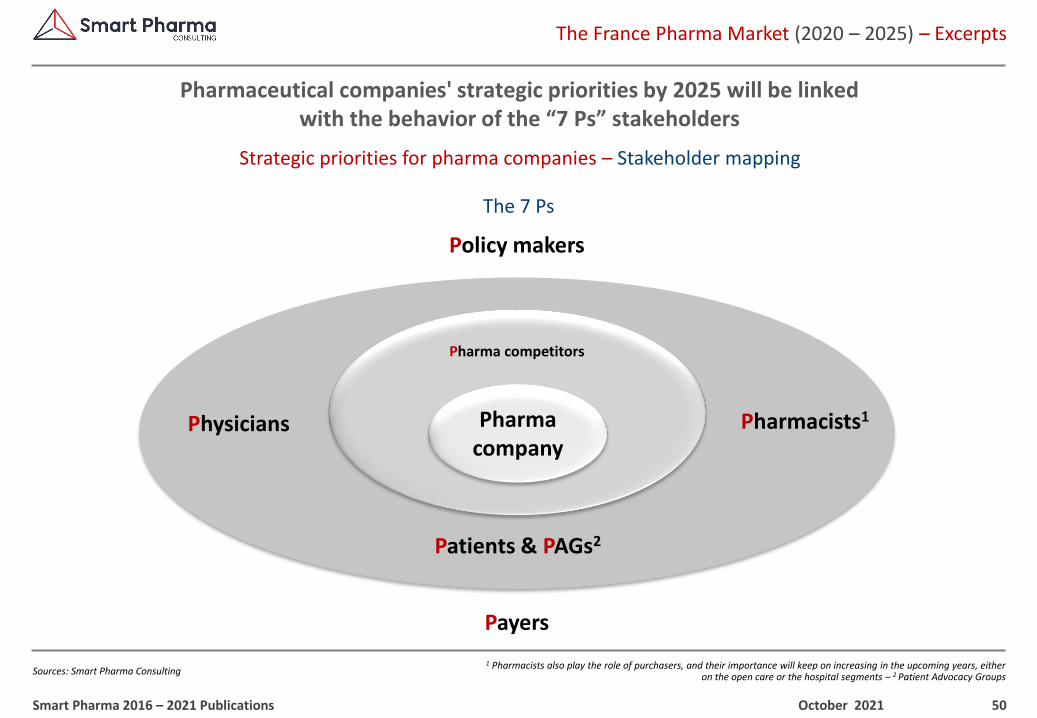
1 Pharmacists also play the role of purchasers, and their importance will keep on increasing in the upcoming years, either on the open care or the hospital segments – 2 Patient Advocacy Groups
The France Pharma Market (2020 – 2025) – Excerpts
Sources: Smart Pharma Consulting
Strategic priorities for pharma companies – Stakeholder mapping
Pharmaceutical companies' strategic priorities by 2025 will be linkedwith the behavior of the “7 Ps” stakeholders
October 2021Smart Pharma 2016 – 2021 Publications
The 7 Ps
Patients & PAGs2
Physicians Pharmacists1
Policy makers
Payers
Pharma competitors
Pharmacompany
51
1 As addressed in the Article 51 of the LFSS 2018 – 2 Bonus program to encourage physicians to comply with “best prescribing practices” for a better efficacy/cost ratio – 3 100% cost coverage for chronic and long-lasting diseases
The France Pharma Market (2020 – 2025) – Excerpts
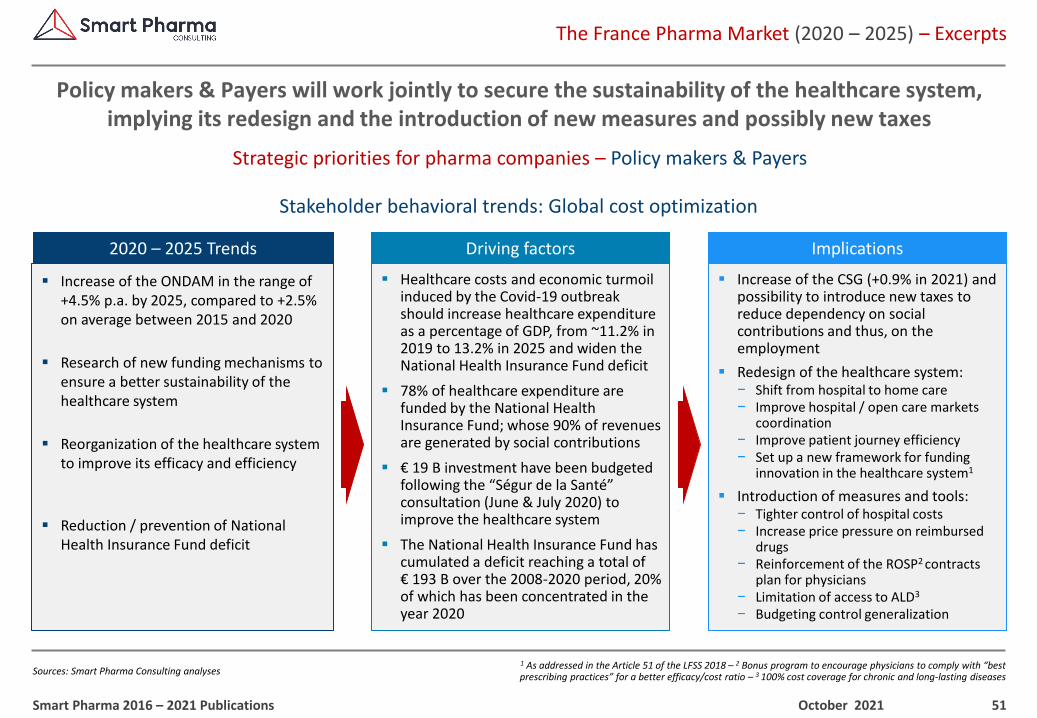
Sources: Smart Pharma Consulting analyses
Strategic priorities for pharma companies – Policy makers & Payers
Policy makers & Payers will work jointly to secure the sustainability of the healthcare system, implying its redesign and the introduction of new measures and possibly new taxes
October 2021Smart Pharma 2016 – 2021 Publications
Stakeholder behavioral trends: Global cost optimization
▪ Increase of the ONDAM in the range of +4.5% p.a. by 2025, compared to +2.5% on average between 2015 and 2020
▪ Research of new funding mechanisms to ensure a better sustainability of the healthcare system
▪ Reorganization of the healthcare system to improve its efficacy and efficiency
▪ Reduction / prevention of National Health Insurance Fund deficit
▪ Increase of the CSG (+0.9% in 2021) and possibility to introduce new taxes to reduce dependency on social contributions and thus, on the employment
▪ Redesign of the healthcare system:− Shift from hospital to home care− Improve hospital / open care markets
coordination− Improve patient journey efficiency− Set up a new framework for funding
innovation in the healthcare system1
▪ Introduction of measures and tools: − Tighter control of hospital costs− Increase price pressure on reimbursed
drugs− Reinforcement of the ROSP2 contracts
plan for physicians− Limitation of access to ALD3
− Budgeting control generalization
▪ Healthcare costs and economic turmoil induced by the Covid-19 outbreak should increase healthcare expenditure as a percentage of GDP, from ~11.2% in 2019 to 13.2% in 2025 and widen the National Health Insurance Fund deficit
▪ 78% of healthcare expenditure are funded by the National Health Insurance Fund; whose 90% of revenues are generated by social contributions
▪ € 19 B investment have been budgeted following the “Ségur de la Santé” consultation (June & July 2020) to improve the healthcare system
▪ The National Health Insurance Fund has cumulated a deficit reaching a total of € 193 B over the 2008-2020 period, 20% of which has been concentrated in the year 2020
2020 – 2025 Trends Driving factors Implications
52
1 EUnetHTA – 2 Number of indications, volume per indication, patient profiles, etc. – 3 Physicians and pharmacists should be incentivized to meet objectives of prescriptions within the generic directory of the ANSM and of substitution rate by generics, respectively –
4 Physicians could be encouraged to prescribe biosimilars as it is yet the case with etanercept, insulin glargine, adalimumab
The France Pharma Market (2020 – 2025) – Excerpts
Sources: Smart Pharma Consulting analyses
Strategic priorities for pharma companies – Policy makers & Payers
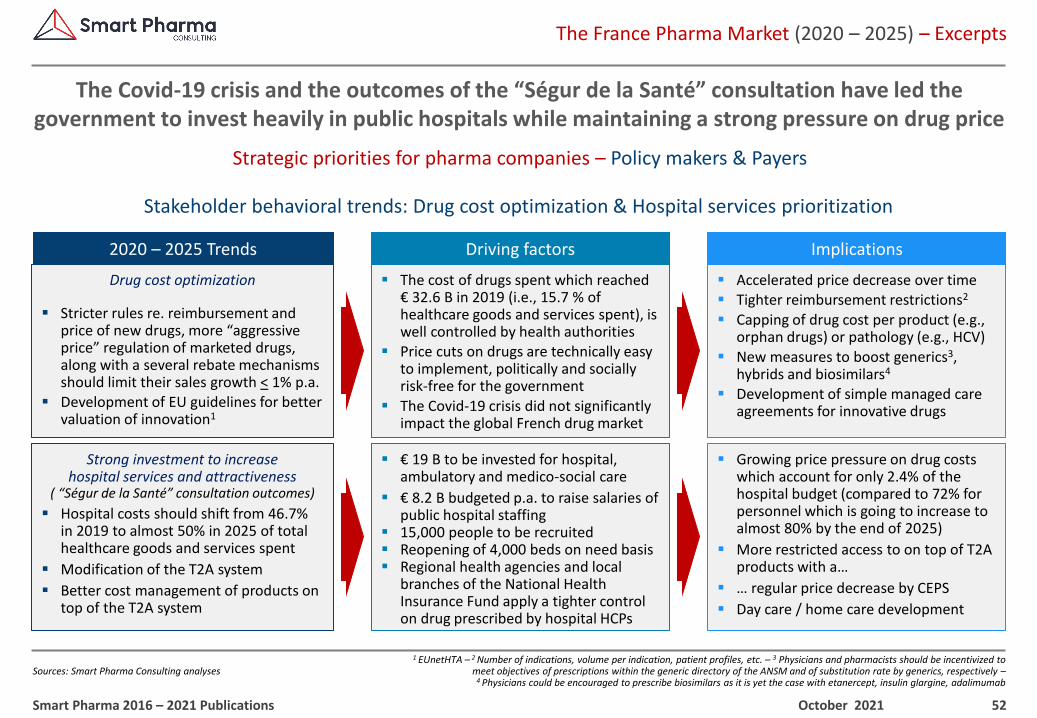
The Covid-19 crisis and the outcomes of the “Ségur de la Santé” consultation have led the government to invest heavily in public hospitals while maintaining a strong pressure on drug price
October 2021Smart Pharma 2016 – 2021 Publications
Stakeholder behavioral trends: Drug cost optimization & Hospital services prioritization
▪ Accelerated price decrease over time ▪ Tighter reimbursement restrictions2
▪ Capping of drug cost per product (e.g., orphan drugs) or pathology (e.g., HCV)
▪ New measures to boost generics3, hybrids and biosimilars4
▪ Development of simple managed care agreements for innovative drugs
▪ The cost of drugs spent which reached € 32.6 B in 2019 (i.e., 15.7 % of healthcare goods and services spent), is well controlled by health authorities
▪ Price cuts on drugs are technically easy to implement, politically and socially risk-free for the government
▪ The Covid-19 crisis did not significantly impact the global French drug market
Drug cost optimization
▪ Stricter rules re. reimbursement and price of new drugs, more “aggressive price” regulation of marketed drugs, along with a several rebate mechanisms should limit their sales growth < 1% p.a.
▪ Development of EU guidelines for better valuation of innovation1
Strong investment to increasehospital services and attractiveness
( “Ségur de la Santé” consultation outcomes)
▪ Hospital costs should shift from 46.7% in 2019 to almost 50% in 2025 of total healthcare goods and services spent
▪ Modification of the T2A system
▪ Better cost management of products on top of the T2A system
▪ Growing price pressure on drug costs which account for only 2.4% of the hospital budget (compared to 72% for personnel which is going to increase to almost 80% by the end of 2025)
▪ More restricted access to on top of T2A products with a…
▪ … regular price decrease by CEPS
▪ Day care / home care development
▪ € 19 B to be invested for hospital, ambulatory and medico-social care
▪ € 8.2 B budgeted p.a. to raise salaries of public hospital staffing
▪ 15,000 people to be recruited ▪ Reopening of 4,000 beds on need basis▪ Regional health agencies and local
branches of the National Health Insurance Fund apply a tighter control on drug prescribed by hospital HCPs
2020 – 2025 Trends Driving factors Implications
53
1 A universal coverage is provided by the National Health Insurance Fund for all patients, irrespective of the severity of the disease since April 2017 –2 Early Access Program – 3 Resources allocated to coordinate healthcare networks (e.g., CPTS), creation of community hospitable territories (GHTs)
The France Pharma Market (2020 – 2025) – Excerpts
Sources: Smart Pharma Consulting analyses
Strategic priorities for pharma companies – Policy makers & Payers
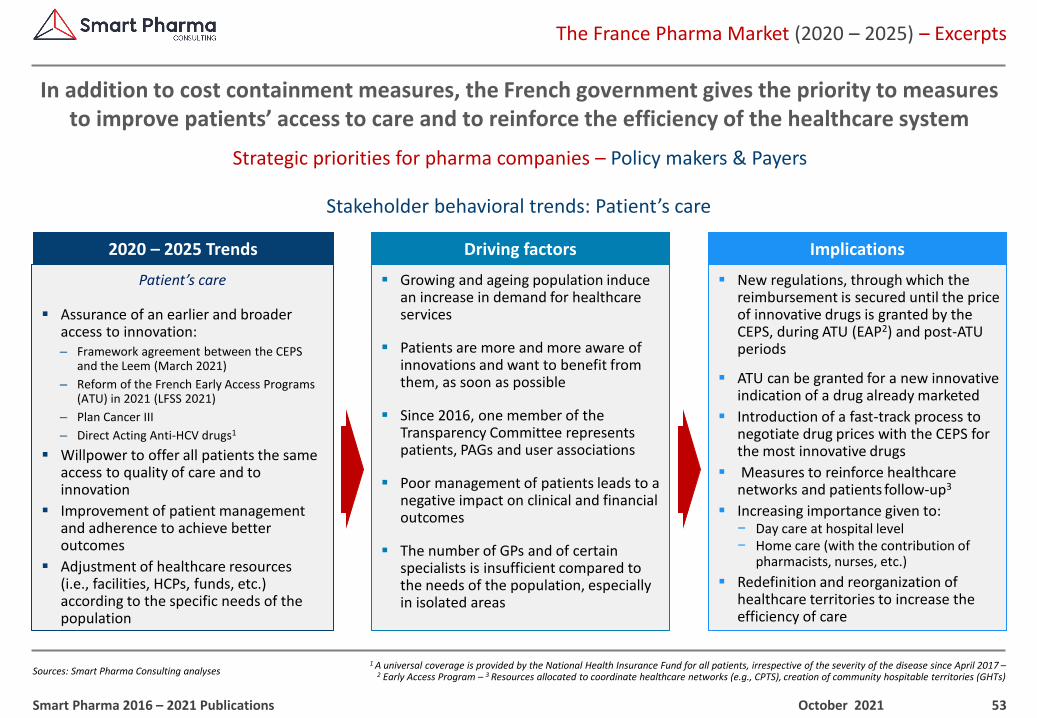
In addition to cost containment measures, the French government gives the priority to measures to improve patients’ access to care and to reinforce the efficiency of the healthcare system
October 2021Smart Pharma 2016 – 2021 Publications
Stakeholder behavioral trends: Patient’s care
Patient’s care
▪ Assurance of an earlier and broader access to innovation: ‒ Framework agreement between the CEPS
and the Leem (March 2021)
‒ Reform of the French Early Access Programs (ATU) in 2021 (LFSS 2021)
‒ Plan Cancer III
‒ Direct Acting Anti-HCV drugs1
▪ Willpower to offer all patients the same access to quality of care and to innovation
▪ Improvement of patient management and adherence to achieve better outcomes
▪ Adjustment of healthcare resources (i.e., facilities, HCPs, funds, etc.) according to the specific needs of the population
▪ New regulations, through which the reimbursement is secured until the price of innovative drugs is granted by the CEPS, during ATU (EAP2) and post-ATU periods
▪ ATU can be granted for a new innovative indication of a drug already marketed
▪ Introduction of a fast-track process to negotiate drug prices with the CEPS for the most innovative drugs
▪ Measures to reinforce healthcare networks and patients follow-up3
▪ Increasing importance given to:− Day care at hospital level− Home care (with the contribution of
pharmacists, nurses, etc.)
▪ Redefinition and reorganization of healthcare territories to increase the efficiency of care
▪ Growing and ageing population induce an increase in demand for healthcare services
▪ Patients are more and more aware of innovations and want to benefit from them, as soon as possible
▪ Since 2016, one member of the Transparency Committee represents patients, PAGs and user associations
▪ Poor management of patients leads to a negative impact on clinical and financial outcomes
▪ The number of GPs and of certain specialists is insufficient compared to the needs of the population, especially in isolated areas
2020 – 2025 Trends Driving factors Implications
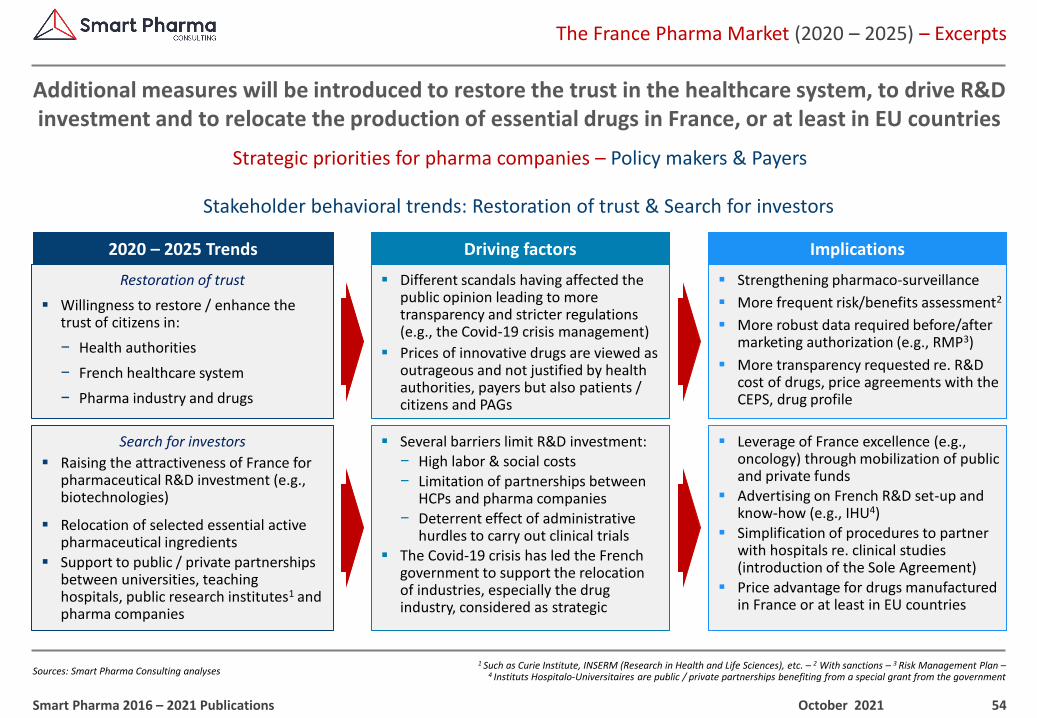
54
1 Such as Curie Institute, INSERM (Research in Health and Life Sciences), etc. – 2 With sanctions – 3 Risk Management Plan –4 Instituts Hospitalo-Universitaires are public / private partnerships benefiting from a special grant from the government
The France Pharma Market (2020 – 2025) – Excerpts
Sources: Smart Pharma Consulting analyses
Strategic priorities for pharma companies – Policy makers & Payers
Additional measures will be introduced to restore the trust in the healthcare system, to drive R&D investment and to relocate the production of essential drugs in France, or at least in EU countries
October 2021Smart Pharma 2016 – 2021 Publications
Stakeholder behavioral trends: Restoration of trust & Search for investors
Restoration of trust
▪ Willingness to restore / enhance the trust of citizens in:
− Health authorities
− French healthcare system
− Pharma industry and drugs
▪ Strengthening pharmaco-surveillance
▪ More frequent risk/benefits assessment2
▪ More robust data required before/after marketing authorization (e.g., RMP3)
▪ More transparency requested re. R&D cost of drugs, price agreements with the CEPS, drug profile
▪ Different scandals having affected the public opinion leading to more transparency and stricter regulations (e.g., the Covid-19 crisis management)
▪ Prices of innovative drugs are viewed as outrageous and not justified by health authorities, payers but also patients / citizens and PAGs
Search for investors
▪ Raising the attractiveness of France for pharmaceutical R&D investment (e.g., biotechnologies)
▪ Relocation of selected essential active pharmaceutical ingredients
▪ Support to public / private partnerships between universities, teaching hospitals, public research institutes1 and pharma companies
▪ Leverage of France excellence (e.g., oncology) through mobilization of public and private funds
▪ Advertising on French R&D set-up and know-how (e.g., IHU4)
▪ Simplification of procedures to partner with hospitals re. clinical studies (introduction of the Sole Agreement)
▪ Price advantage for drugs manufactured in France or at least in EU countries
▪ Several barriers limit R&D investment:− High labor & social costs− Limitation of partnerships between
HCPs and pharma companies− Deterrent effect of administrative
hurdles to carry out clinical trials▪ The Covid-19 crisis has led the French
government to support the relocation of industries, especially the drug industry, considered as strategic
2020 – 2025 Trends Driving factors Implications
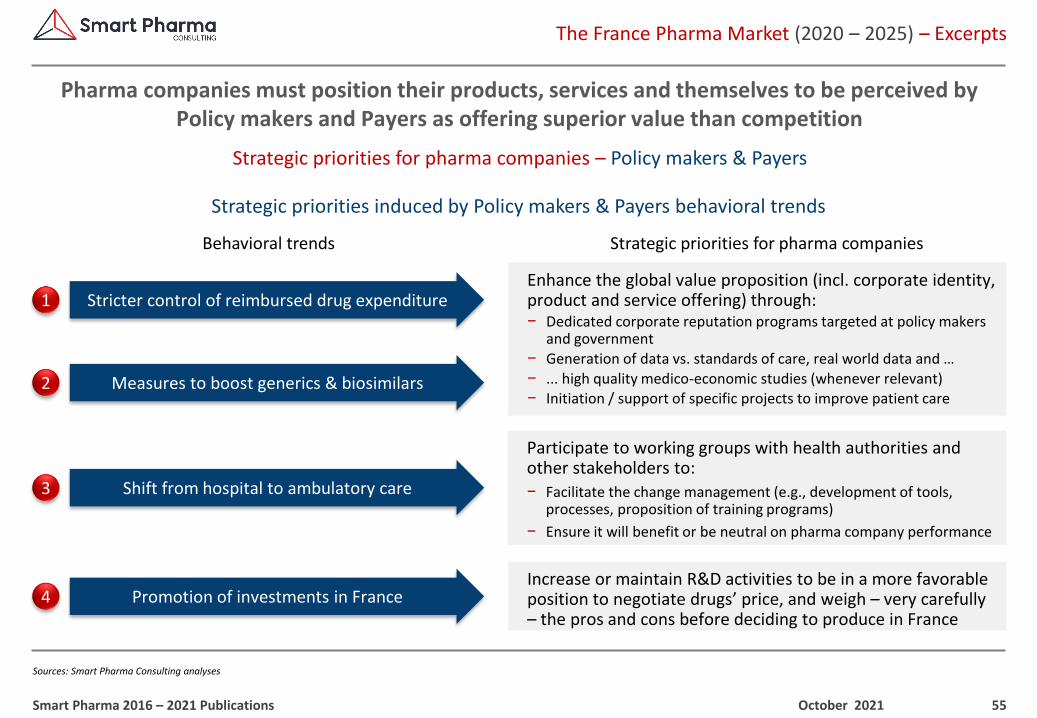
55
The France Pharma Market (2020 – 2025) – Excerpts
Sources: Smart Pharma Consulting analyses
Strategic priorities for pharma companies – Policy makers & Payers
Pharma companies must position their products, services and themselves to be perceived by Policy makers and Payers as offering superior value than competition
October 2021Smart Pharma 2016 – 2021 Publications
Strategic priorities induced by Policy makers & Payers behavioral trends
3
4
Enhance the global value proposition (incl. corporate identity, product and service offering) through:− Dedicated corporate reputation programs targeted at policy makers
and government− Generation of data vs. standards of care, real world data and …
− ... high quality medico-economic studies (whenever relevant)− Initiation / support of specific projects to improve patient care
Increase or maintain R&D activities to be in a more favorable position to negotiate drugs’ price, and weigh – very carefully – the pros and cons before deciding to produce in France
Participate to working groups with health authorities and other stakeholders to:− Facilitate the change management (e.g., development of tools,
processes, proposition of training programs)
− Ensure it will benefit or be neutral on pharma company performance
Stricter control of reimbursed drug expenditure1
2 Measures to boost generics & biosimilars
Shift from hospital to ambulatory care
Promotion of investments in France
Strategic priorities for pharma companiesBehavioral trends
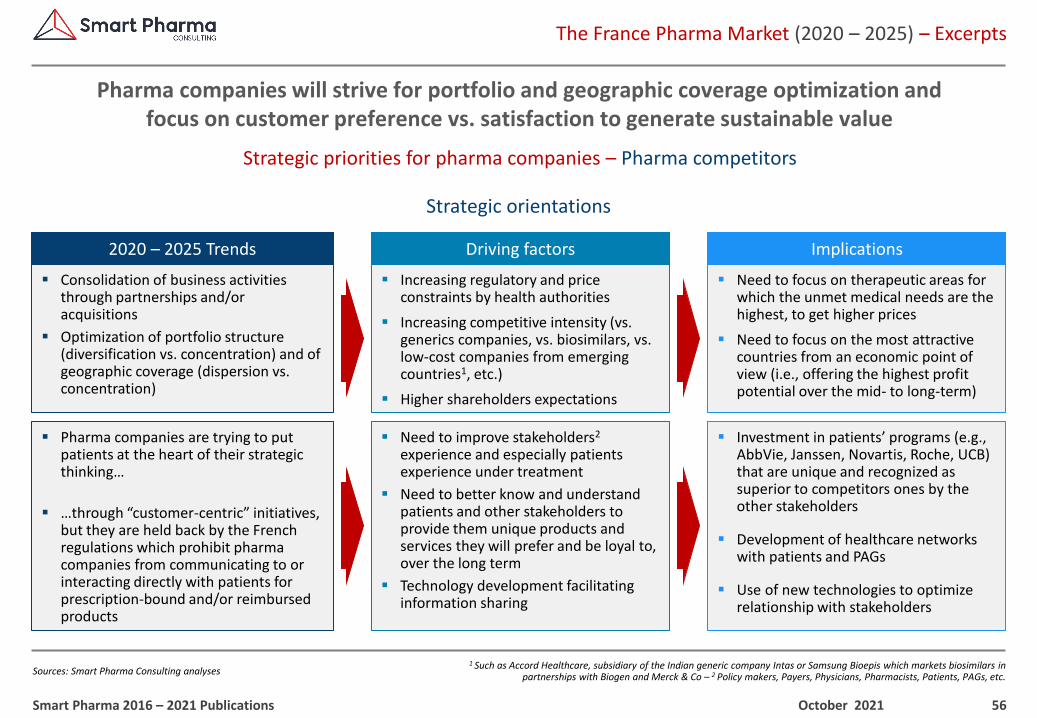
56
1 Such as Accord Healthcare, subsidiary of the Indian generic company Intas or Samsung Bioepis which markets biosimilars in partnerships with Biogen and Merck & Co – 2 Policy makers, Payers, Physicians, Pharmacists, Patients, PAGs, etc.
The France Pharma Market (2020 – 2025) – Excerpts
Sources: Smart Pharma Consulting analyses
Strategic priorities for pharma companies – Pharma competitors
Pharma companies will strive for portfolio and geographic coverage optimization andfocus on customer preference vs. satisfaction to generate sustainable value
October 2021Smart Pharma 2016 – 2021 Publications
Strategic orientations
▪ Pharma companies are trying to put patients at the heart of their strategic thinking…
▪ …through “customer-centric” initiatives, but they are held back by the French regulations which prohibit pharma companies from communicating to or interacting directly with patients for prescription-bound and/or reimbursed products
▪ Need to focus on therapeutic areas for which the unmet medical needs are the highest, to get higher prices
▪ Need to focus on the most attractive countries from an economic point of view (i.e., offering the highest profit potential over the mid- to long-term)
▪ Increasing regulatory and price constraints by health authorities
▪ Increasing competitive intensity (vs. generics companies, vs. biosimilars, vs. low-cost companies from emerging countries1, etc.)
▪ Higher shareholders expectations
▪ Consolidation of business activities through partnerships and/or acquisitions
▪ Optimization of portfolio structure (diversification vs. concentration) and of geographic coverage (dispersion vs. concentration)
▪ Investment in patients’ programs (e.g., AbbVie, Janssen, Novartis, Roche, UCB) that are unique and recognized as superior to competitors ones by the other stakeholders
▪ Development of healthcare networks with patients and PAGs
▪ Use of new technologies to optimize relationship with stakeholders
▪ Need to improve stakeholders2
experience and especially patients experience under treatment
▪ Need to better know and understand patients and other stakeholders to provide them unique products and services they will prefer and be loyal to, over the long term
▪ Technology development facilitating information sharing
2020 – 2025 Trends Driving factors Implications
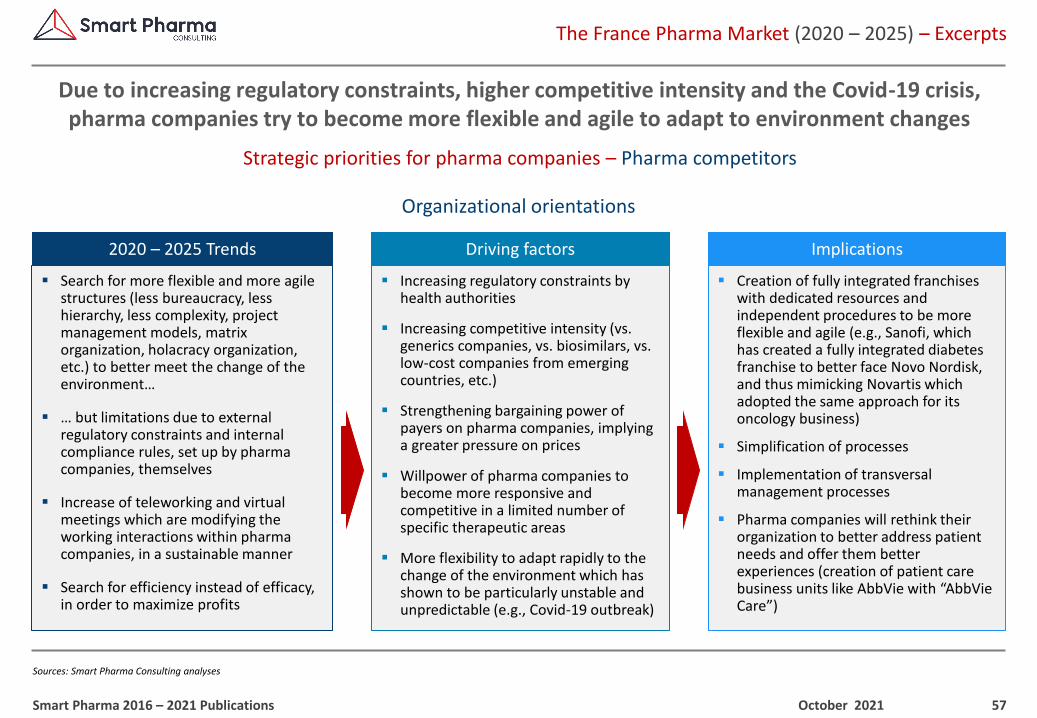
57
The France Pharma Market (2020 – 2025) – Excerpts
Sources: Smart Pharma Consulting analyses
Strategic priorities for pharma companies – Pharma competitors
Due to increasing regulatory constraints, higher competitive intensity and the Covid-19 crisis, pharma companies try to become more flexible and agile to adapt to environment changes
October 2021Smart Pharma 2016 – 2021 Publications
Organizational orientations
▪ Search for more flexible and more agile structures (less bureaucracy, less hierarchy, less complexity, project management models, matrix organization, holacracy organization, etc.) to better meet the change of the environment…
▪ … but limitations due to external regulatory constraints and internal compliance rules, set up by pharma companies, themselves
▪ Increase of teleworking and virtual meetings which are modifying the working interactions within pharma companies, in a sustainable manner
▪ Search for efficiency instead of efficacy, in order to maximize profits
▪ Creation of fully integrated franchises with dedicated resources and independent procedures to be more flexible and agile (e.g., Sanofi, which has created a fully integrated diabetes franchise to better face Novo Nordisk, and thus mimicking Novartis which adopted the same approach for its oncology business)
▪ Simplification of processes
▪ Implementation of transversal management processes
▪ Pharma companies will rethink their organization to better address patient needs and offer them better experiences (creation of patient care business units like AbbVie with “AbbVie Care”)
▪ Increasing regulatory constraints by health authorities
▪ Increasing competitive intensity (vs. generics companies, vs. biosimilars, vs. low-cost companies from emerging countries, etc.)
▪ Strengthening bargaining power of payers on pharma companies, implying a greater pressure on prices
▪ Willpower of pharma companies to become more responsive and competitive in a limited number of specific therapeutic areas
▪ More flexibility to adapt rapidly to the change of the environment which has shown to be particularly unstable and unpredictable (e.g., Covid-19 outbreak)
2020 – 2025 Trends Driving factors Implications
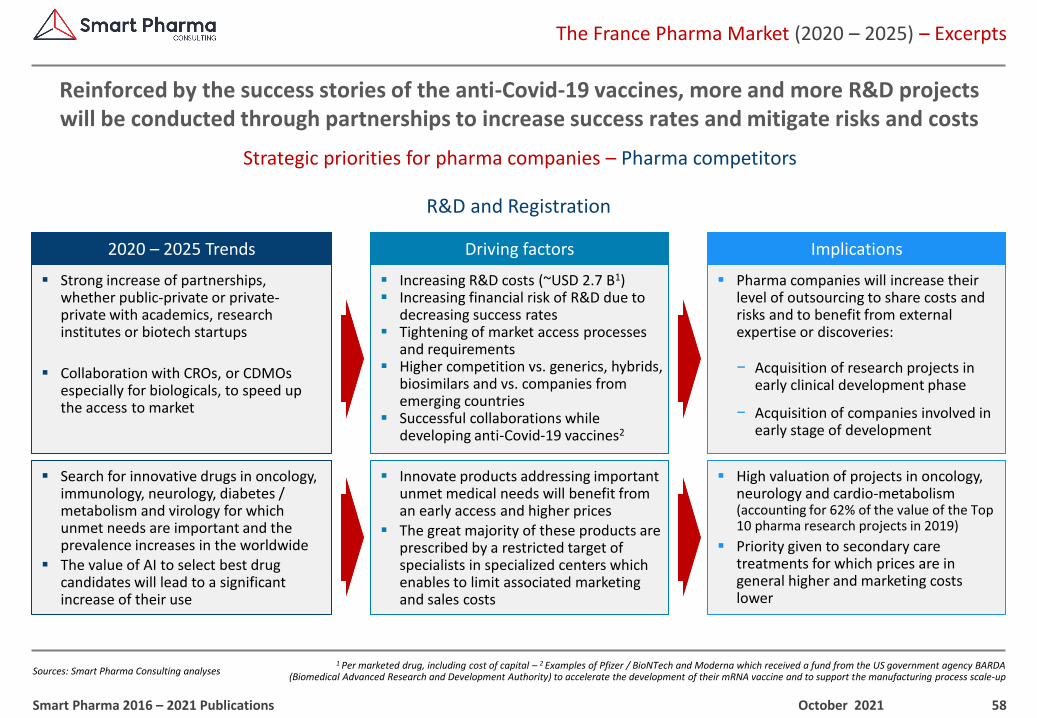
58
1 Per marketed drug, including cost of capital – 2 Examples of Pfizer / BioNTech and Moderna which received a fund from the US government agency BARDA(Biomedical Advanced Research and Development Authority) to accelerate the development of their mRNA vaccine and to support the manufacturing process scale-up
The France Pharma Market (2020 – 2025) – Excerpts
Sources: Smart Pharma Consulting analyses
Strategic priorities for pharma companies – Pharma competitors
Reinforced by the success stories of the anti-Covid-19 vaccines, more and more R&D projects will be conducted through partnerships to increase success rates and mitigate risks and costs
October 2021Smart Pharma 2016 – 2021 Publications
R&D and Registration
▪ Strong increase of partnerships, whether public-private or private-private with academics, research institutes or biotech startups
▪ Collaboration with CROs, or CDMOs especially for biologicals, to speed up the access to market
▪ Pharma companies will increase their level of outsourcing to share costs and risks and to benefit from external expertise or discoveries:
− Acquisition of research projects in early clinical development phase
− Acquisition of companies involved in early stage of development
▪ Increasing R&D costs (~USD 2.7 B1)▪ Increasing financial risk of R&D due to
decreasing success rates ▪ Tightening of market access processes
and requirements▪ Higher competition vs. generics, hybrids,
biosimilars and vs. companies from emerging countries
▪ Successful collaborations while developing anti-Covid-19 vaccines2
▪ Search for innovative drugs in oncology, immunology, neurology, diabetes / metabolism and virology for which unmet needs are important and the prevalence increases in the worldwide
▪ The value of AI to select best drug candidates will lead to a significant increase of their use
▪ High valuation of projects in oncology, neurology and cardio-metabolism (accounting for 62% of the value of the Top 10 pharma research projects in 2019)
▪ Priority given to secondary care treatments for which prices are in general higher and marketing costs lower
▪ Innovate products addressing important unmet medical needs will benefit from an early access and higher prices
▪ The great majority of these products are prescribed by a restricted target of specialists in specialized centers which enables to limit associated marketing and sales costs
2020 – 2025 Trends Driving factors Implications
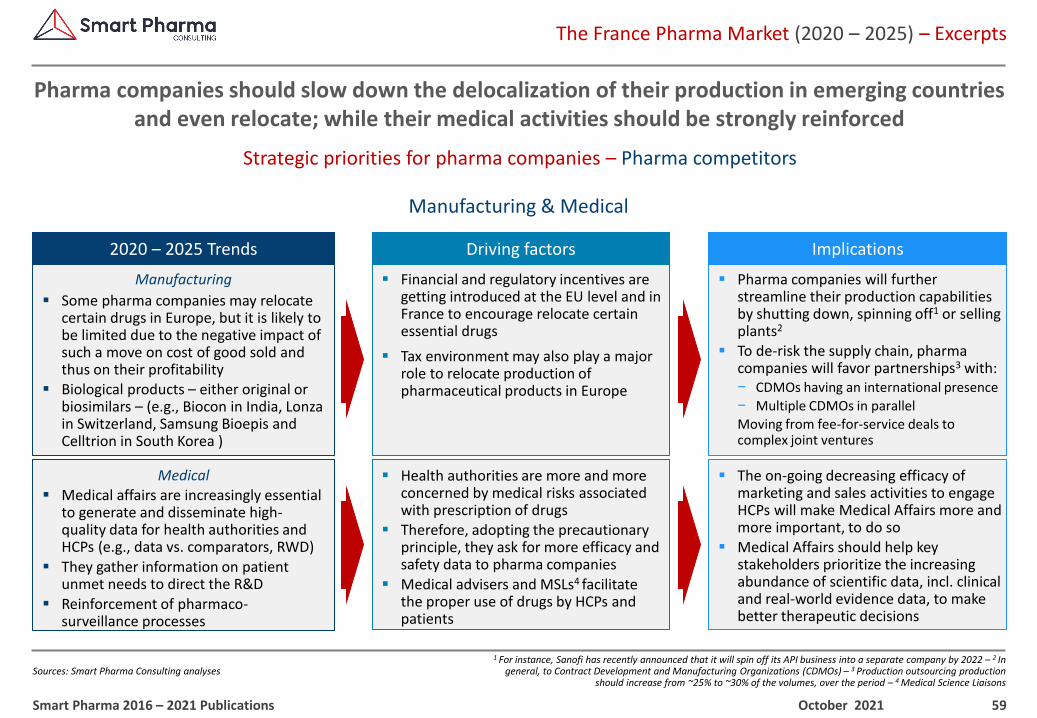
59
1 For instance, Sanofi has recently announced that it will spin off its API business into a separate company by 2022 – 2 In general, to Contract Development and Manufacturing Organizations (CDMOs) – 3 Production outsourcing production
should increase from ~25% to ~30% of the volumes, over the period – 4 Medical Science Liaisons
The France Pharma Market (2020 – 2025) – Excerpts
Sources: Smart Pharma Consulting analyses
Strategic priorities for pharma companies – Pharma competitors
Pharma companies should slow down the delocalization of their production in emerging countries and even relocate; while their medical activities should be strongly reinforced
October 2021Smart Pharma 2016 – 2021 Publications
Manufacturing & Medical
Manufacturing
▪ Some pharma companies may relocate certain drugs in Europe, but it is likely to be limited due to the negative impact of such a move on cost of good sold and thus on their profitability
▪ Biological products – either original or biosimilars – (e.g., Biocon in India, Lonza in Switzerland, Samsung Bioepis and Celltrion in South Korea )
▪ Pharma companies will further streamline their production capabilities by shutting down, spinning off1 or selling plants2
▪ To de-risk the supply chain, pharma companies will favor partnerships3 with: − CDMOs having an international presence
− Multiple CDMOs in parallelMoving from fee-for-service deals to complex joint ventures
▪ Financial and regulatory incentives are getting introduced at the EU level and in France to encourage relocate certain essential drugs
▪ Tax environment may also play a major role to relocate production of pharmaceutical products in Europe
Medical▪ Medical affairs are increasingly essential
to generate and disseminate high-quality data for health authorities and HCPs (e.g., data vs. comparators, RWD)
▪ They gather information on patient unmet needs to direct the R&D
▪ Reinforcement of pharmaco-surveillance processes
▪ The on-going decreasing efficacy of marketing and sales activities to engage HCPs will make Medical Affairs more and more important, to do so
▪ Medical Affairs should help key stakeholders prioritize the increasing abundance of scientific data, incl. clinical and real-world evidence data, to make better therapeutic decisions
▪ Health authorities are more and more concerned by medical risks associated with prescription of drugs
▪ Therefore, adopting the precautionary principle, they ask for more efficacy and safety data to pharma companies
▪ Medical advisers and MSLs4 facilitate the proper use of drugs by HCPs and patients
2020 – 2025 Trends Driving factors Implications
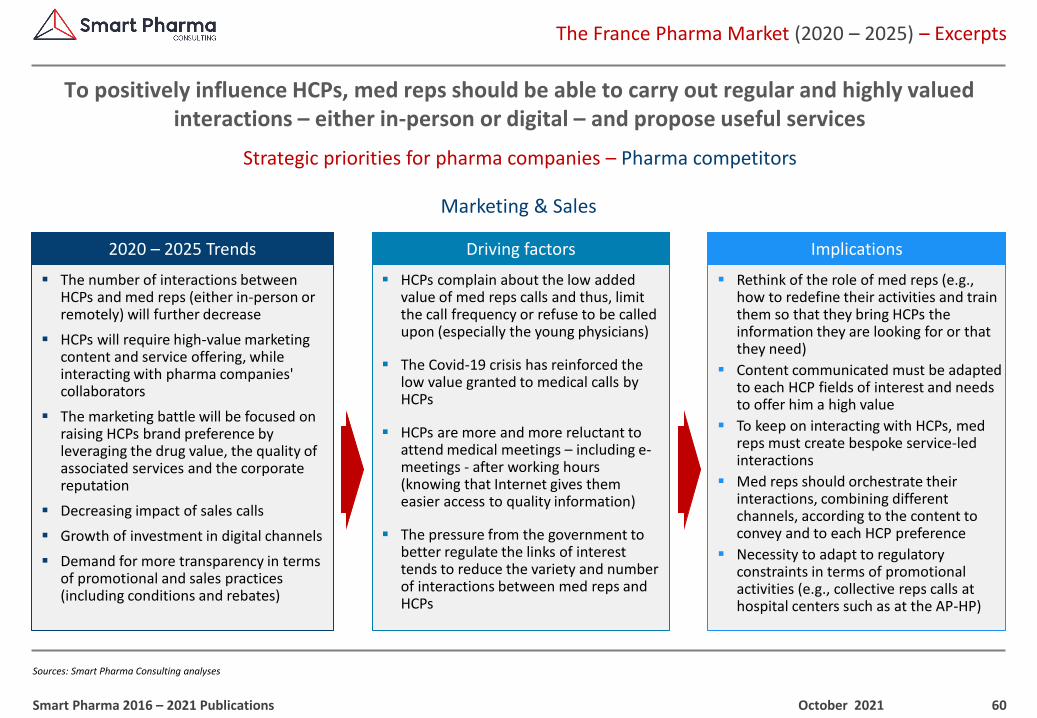
60
The France Pharma Market (2020 – 2025) – Excerpts
Sources: Smart Pharma Consulting analyses
Strategic priorities for pharma companies – Pharma competitors
To positively influence HCPs, med reps should be able to carry out regular and highly valued interactions – either in-person or digital – and propose useful services
October 2021Smart Pharma 2016 – 2021 Publications
Marketing & Sales
▪ The number of interactions between HCPs and med reps (either in-person or remotely) will further decrease
▪ HCPs will require high-value marketing content and service offering, while interacting with pharma companies' collaborators
▪ The marketing battle will be focused on raising HCPs brand preference by leveraging the drug value, the quality of associated services and the corporate reputation
▪ Decreasing impact of sales calls
▪ Growth of investment in digital channels
▪ Demand for more transparency in terms of promotional and sales practices (including conditions and rebates)
▪ Rethink of the role of med reps (e.g., how to redefine their activities and train them so that they bring HCPs the information they are looking for or that they need)
▪ Content communicated must be adapted to each HCP fields of interest and needs to offer him a high value
▪ To keep on interacting with HCPs, med reps must create bespoke service-led interactions
▪ Med reps should orchestrate their interactions, combining different channels, according to the content to convey and to each HCP preference
▪ Necessity to adapt to regulatory constraints in terms of promotional activities (e.g., collective reps calls at hospital centers such as at the AP-HP)
▪ HCPs complain about the low added value of med reps calls and thus, limit the call frequency or refuse to be called upon (especially the young physicians)
▪ The Covid-19 crisis has reinforced the low value granted to medical calls by HCPs
▪ HCPs are more and more reluctant to attend medical meetings – including e-meetings - after working hours (knowing that Internet gives them easier access to quality information)
▪ The pressure from the government to better regulate the links of interest tends to reduce the variety and number of interactions between med reps and HCPs
2020 – 2025 Trends Driving factors Implications
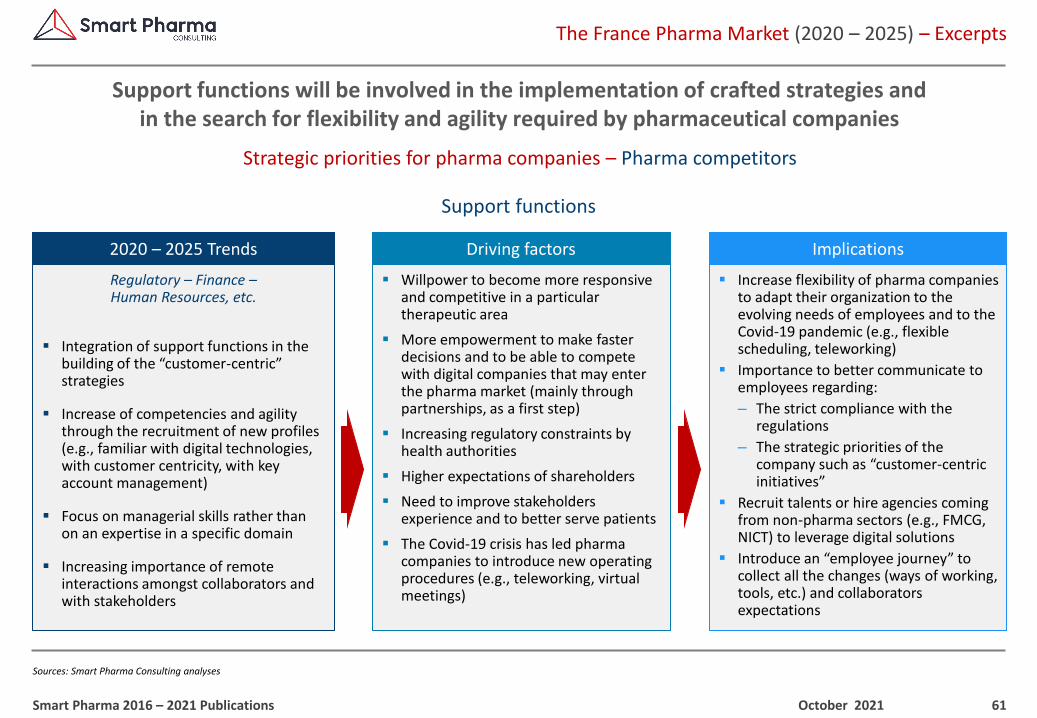
61
The France Pharma Market (2020 – 2025) – Excerpts
Sources: Smart Pharma Consulting analyses
Strategic priorities for pharma companies – Pharma competitors
Support functions will be involved in the implementation of crafted strategies andin the search for flexibility and agility required by pharmaceutical companies
October 2021Smart Pharma 2016 – 2021 Publications
Support functions
Regulatory – Finance –Human Resources, etc.
▪ Integration of support functions in the building of the “customer-centric” strategies
▪ Increase of competencies and agility through the recruitment of new profiles (e.g., familiar with digital technologies, with customer centricity, with key account management)
▪ Focus on managerial skills rather than on an expertise in a specific domain
▪ Increasing importance of remote interactions amongst collaborators and with stakeholders
▪ Increase flexibility of pharma companies to adapt their organization to the evolving needs of employees and to the Covid-19 pandemic (e.g., flexible scheduling, teleworking)
▪ Importance to better communicate to employees regarding:
– The strict compliance with the regulations
– The strategic priorities of the company such as “customer-centric initiatives”
▪ Recruit talents or hire agencies coming from non-pharma sectors (e.g., FMCG, NICT) to leverage digital solutions
▪ Introduce an “employee journey” to collect all the changes (ways of working, tools, etc.) and collaborators expectations
▪ Willpower to become more responsive and competitive in a particular therapeutic area
▪ More empowerment to make faster decisions and to be able to compete with digital companies that may enter the pharma market (mainly through partnerships, as a first step)
▪ Increasing regulatory constraints by health authorities
▪ Higher expectations of shareholders
▪ Need to improve stakeholders experience and to better serve patients
▪ The Covid-19 crisis has led pharma companies to introduce new operating procedures (e.g., teleworking, virtual meetings)
2020 – 2025 Trends Driving factors Implications
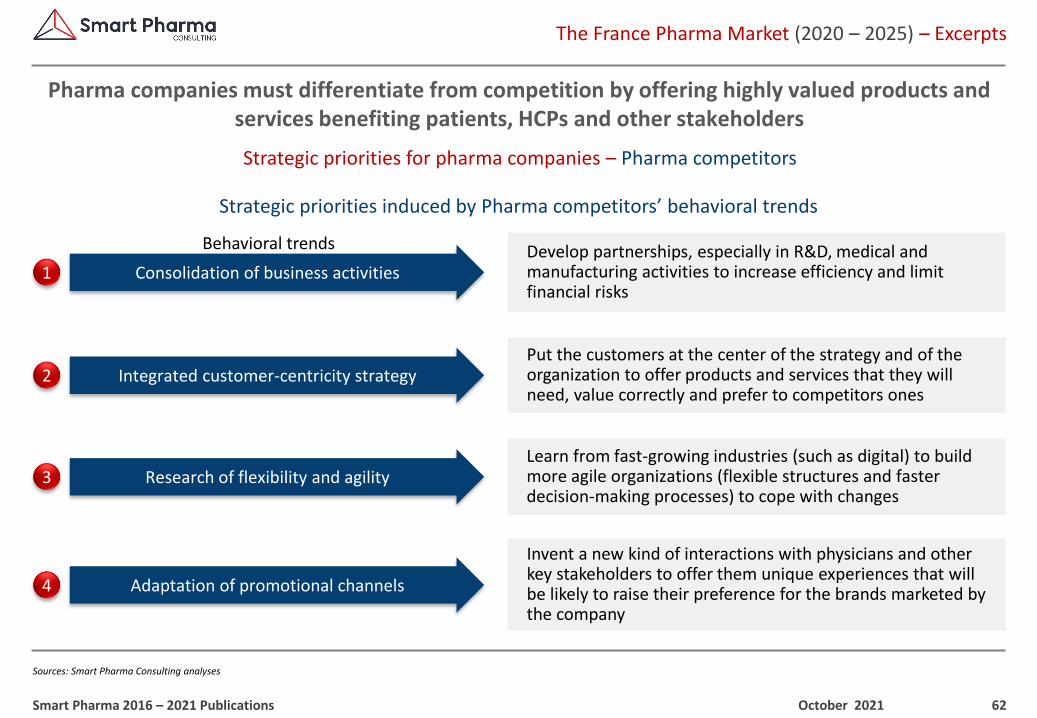
62
The France Pharma Market (2020 – 2025) – Excerpts
Sources: Smart Pharma Consulting analyses
Strategic priorities for pharma companies – Pharma competitors
Pharma companies must differentiate from competition by offering highly valued products and services benefiting patients, HCPs and other stakeholders
October 2021Smart Pharma 2016 – 2021 Publications
Strategic priorities induced by Pharma competitors’ behavioral trends
Strategic priorities for pharma companiesBehavioral trends
2
3Learn from fast-growing industries (such as digital) to build more agile organizations (flexible structures and faster decision-making processes) to cope with changes
Put the customers at the center of the strategy and of the organization to offer products and services that they will need, value correctly and prefer to competitors ones
1Develop partnerships, especially in R&D, medical and manufacturing activities to increase efficiency and limit financial risks
4
Invent a new kind of interactions with physicians and other key stakeholders to offer them unique experiences that will be likely to raise their preference for the brands marketed by the company
Consolidation of business activities
Integrated customer-centricity strategy
Research of flexibility and agility
Adaptation of promotional channels
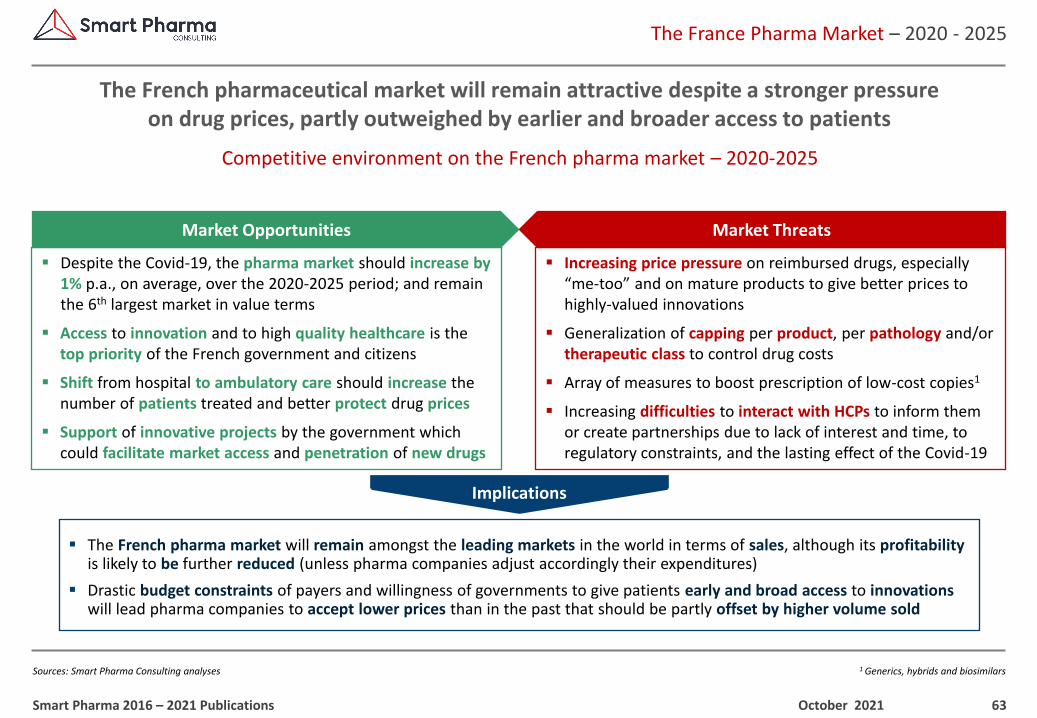
63
1 Generics, hybrids and biosimilars
The France Pharma Market – 2020 - 2025
Sources: Smart Pharma Consulting analyses
Competitive environment on the French pharma market – 2020-2025
The French pharmaceutical market will remain attractive despite a stronger pressureon drug prices, partly outweighed by earlier and broader access to patients
October 2021Smart Pharma 2016 – 2021 Publications
Implications
▪ The French pharma market will remain amongst the leading markets in the world in terms of sales, although its profitability is likely to be further reduced (unless pharma companies adjust accordingly their expenditures)
▪ Drastic budget constraints of payers and willingness of governments to give patients early and broad access to innovationswill lead pharma companies to accept lower prices than in the past that should be partly offset by higher volume sold
▪ Despite the Covid-19, the pharma market should increase by 1% p.a., on average, over the 2020-2025 period; and remain the 6th largest market in value terms
▪ Access to innovation and to high quality healthcare is the top priority of the French government and citizens
▪ Shift from hospital to ambulatory care should increase the number of patients treated and better protect drug prices
▪ Support of innovative projects by the government which could facilitate market access and penetration of new drugs
▪ Increasing price pressure on reimbursed drugs, especially “me-too” and on mature products to give better prices to highly-valued innovations
▪ Generalization of capping per product, per pathology and/or therapeutic class to control drug costs
▪ Array of measures to boost prescription of low-cost copies1
▪ Increasing difficulties to interact with HCPs to inform them or create partnerships due to lack of interest and time, to regulatory constraints, and the lasting effect of the Covid-19
Market Opportunities Market Threats
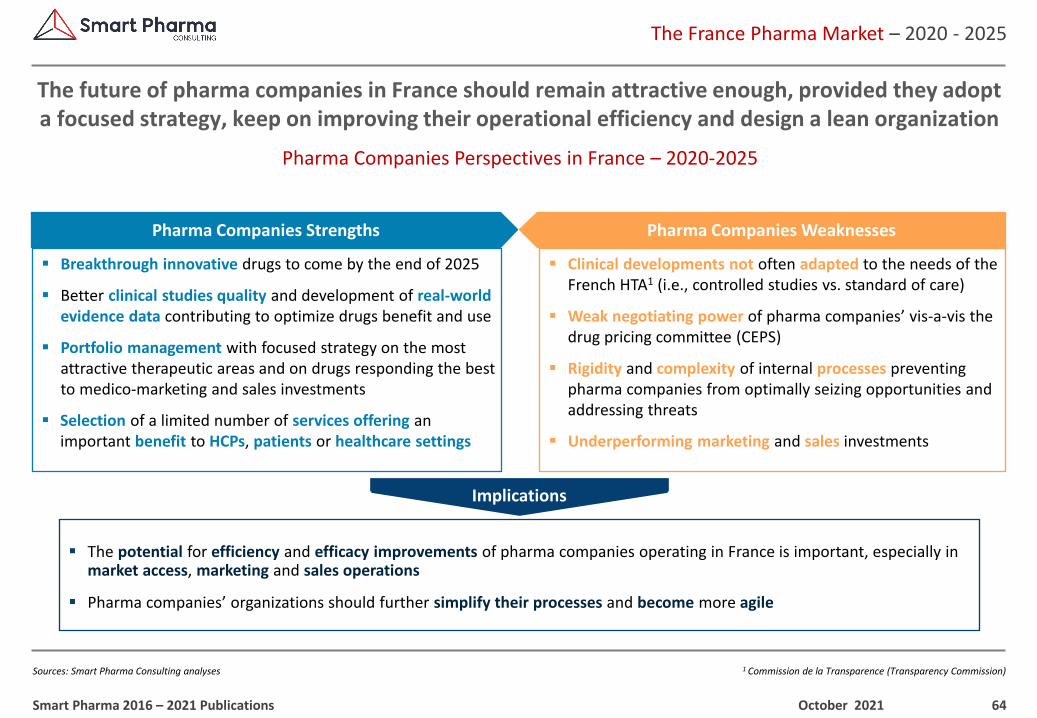
64
1 Commission de la Transparence (Transparency Commission)
The France Pharma Market – 2020 - 2025
Sources: Smart Pharma Consulting analyses
Pharma Companies Perspectives in France – 2020-2025
The future of pharma companies in France should remain attractive enough, provided they adopt a focused strategy, keep on improving their operational efficiency and design a lean organization
October 2021Smart Pharma 2016 – 2021 Publications
▪ Breakthrough innovative drugs to come by the end of 2025
▪ Better clinical studies quality and development of real-world evidence data contributing to optimize drugs benefit and use
▪ Portfolio management with focused strategy on the most attractive therapeutic areas and on drugs responding the best to medico-marketing and sales investments
▪ Selection of a limited number of services offering an important benefit to HCPs, patients or healthcare settings
▪ Clinical developments not often adapted to the needs of the French HTA1 (i.e., controlled studies vs. standard of care)
▪ Weak negotiating power of pharma companies’ vis-a-vis the drug pricing committee (CEPS)
▪ Rigidity and complexity of internal processes preventing pharma companies from optimally seizing opportunities and addressing threats
▪ Underperforming marketing and sales investments
Pharma Companies Strengths Pharma Companies Weaknesses
Implications
▪ The potential for efficiency and efficacy improvements of pharma companies operating in France is important, especially in market access, marketing and sales operations
▪ Pharma companies’ organizations should further simplify their processes and become more agile
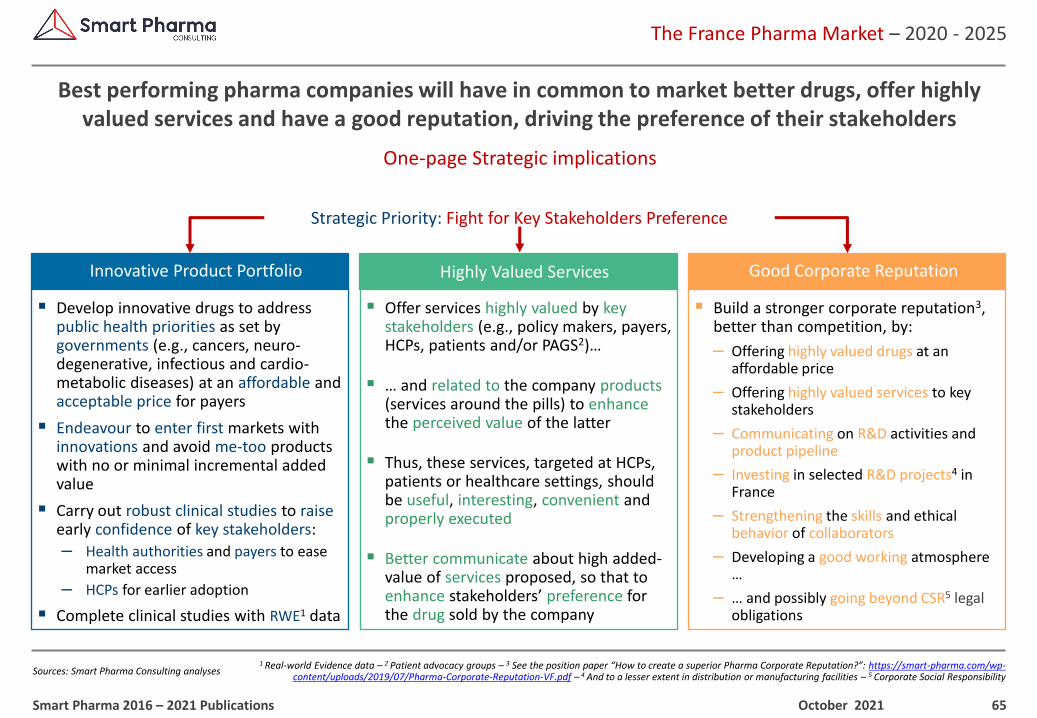
65
1 Real-world Evidence data – 2 Patient advocacy groups – 3 See the position paper “How to create a superior Pharma Corporate Reputation?”: https://smart-pharma.com/wp-content/uploads/2019/07/Pharma-Corporate-Reputation-VF.pdf – 4 And to a lesser extent in distribution or manufacturing facilities – 5 Corporate Social Responsibility
The France Pharma Market – 2020 - 2025
Sources: Smart Pharma Consulting analyses
One-page Strategic implications
Best performing pharma companies will have in common to market better drugs, offer highly valued services and have a good reputation, driving the preference of their stakeholders
October 2021Smart Pharma 2016 – 2021 Publications
Innovative Product Portfolio Highly Valued Services Good Corporate Reputation
▪ Develop innovative drugs to address public health priorities as set by governments (e.g., cancers, neuro-degenerative, infectious and cardio-metabolic diseases) at an affordable and acceptable price for payers
▪ Endeavour to enter first markets with innovations and avoid me-too products with no or minimal incremental added value
▪ Carry out robust clinical studies to raiseearly confidence of key stakeholders:
‒ Health authorities and payers to ease market access
‒ HCPs for earlier adoption
▪ Complete clinical studies with RWE1 data
▪ Offer services highly valued by key stakeholders (e.g., policy makers, payers, HCPs, patients and/or PAGS2)…
▪ … and related to the company products(services around the pills) to enhancethe perceived value of the latter
▪ Thus, these services, targeted at HCPs, patients or healthcare settings, should be useful, interesting, convenient and properly executed
▪ Better communicate about high added-value of services proposed, so that to enhance stakeholders’ preference for the drug sold by the company
▪ Build a stronger corporate reputation3, better than competition, by:
‒ Offering highly valued drugs at an affordable price
‒ Offering highly valued services to key stakeholders
‒ Communicating on R&D activities and product pipeline
‒ Investing in selected R&D projects4 in France
‒ Strengthening the skills and ethical behavior of collaborators
‒ Developing a good working atmosphere …
‒ … and possibly going beyond CSR5 legalobligations
Strategic Priority: Fight for Key Stakeholders Preference
1, rue Houdart de Lamotte – 75015 Paris – FranceTel. +33 6 11 96 33 78
Email : [email protected] – Website : www.smart-pharma.com
Serving & Sharing with Passion
Global Pharma Market& Covid-19 Impact
POSITION PAPER
MARKET INSIGHTS
July 2020
“Wrong decisions are often due to weak market insights”
2019-2024 perspectives
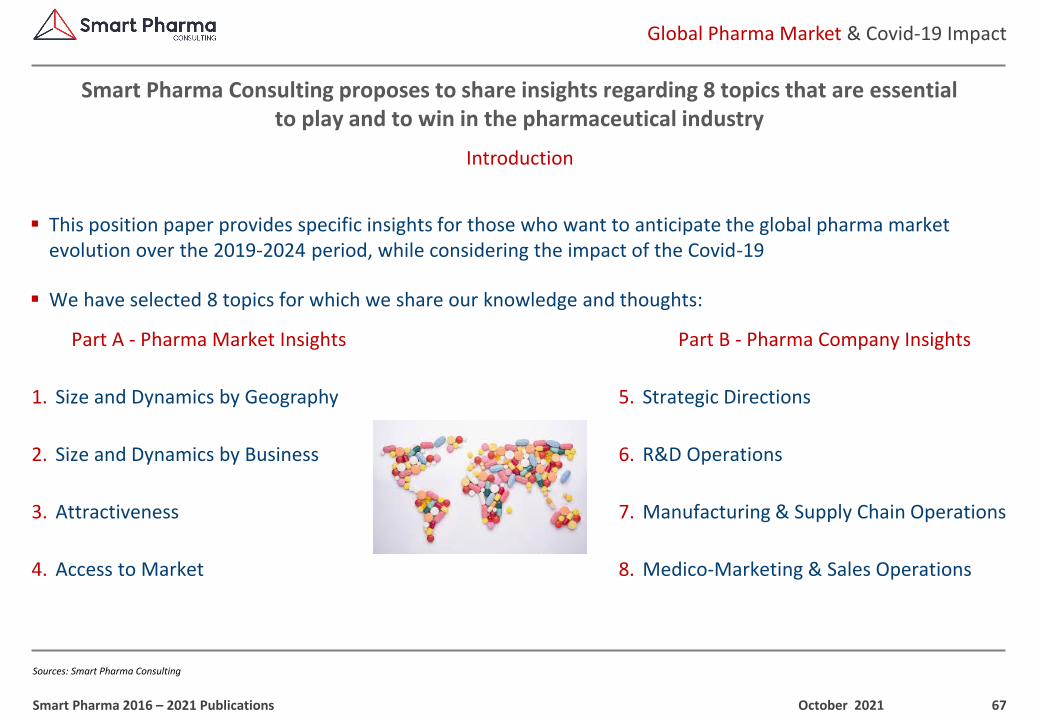
67
Global Pharma Market & Covid-19 Impact
Sources: Smart Pharma Consulting
Introduction
Smart Pharma Consulting proposes to share insights regarding 8 topics that are essentialto play and to win in the pharmaceutical industry
October 2021Smart Pharma 2016 – 2021 Publications
▪ This position paper provides specific insights for those who want to anticipate the global pharma market evolution over the 2019-2024 period, while considering the impact of the Covid-19
▪ We have selected 8 topics for which we share our knowledge and thoughts:
Part A - Pharma Market Insights
1. Size and Dynamics by Geography
2. Size and Dynamics by Business
3. Attractiveness
4. Access to Market
Part B - Pharma Company Insights
5. Strategic Directions
6. R&D Operations
7. Manufacturing & Supply Chain Operations
8. Medico-Marketing & Sales Operations
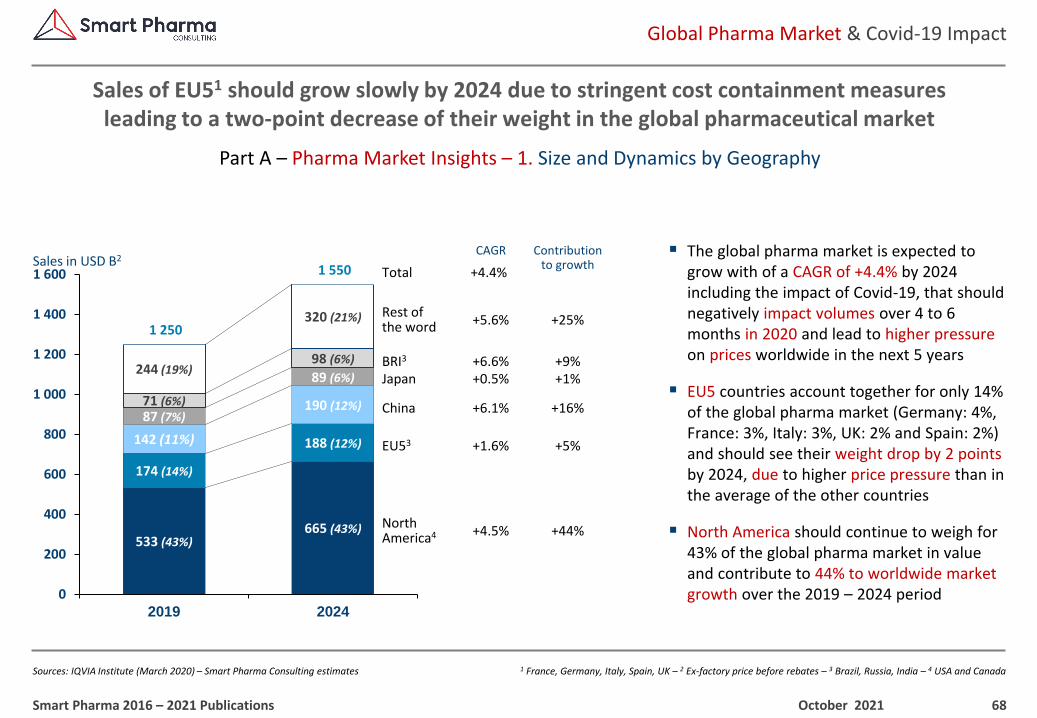
68
1 France, Germany, Italy, Spain, UK – 2 Ex-factory price before rebates – 3 Brazil, Russia, India – 4 USA and Canada
Global Pharma Market & Covid-19 Impact
Sources: IQVIA Institute (March 2020) – Smart Pharma Consulting estimates
Part A – Pharma Market Insights – 1. Size and Dynamics by Geography
Sales of EU51 should grow slowly by 2024 due to stringent cost containment measures leading to a two-point decrease of their weight in the global pharmaceutical market
October 2021Smart Pharma 2016 – 2021 Publications
533 (43%)665 (43%)
174 (14%)
188 (12%)142 (11%)
190 (12%)87 (7%)
89 (6%)
71 (6%)
98 (6%)244 (19%)
320 (21%)1 250
1 550
0
200
400
600
800
1 000
1 200
1 400
1 600
2019 2024
Sales in USD B2CAGR
Total +4.4%
+5.6%Rest of the word +25%
+6.6%BRI3 +9%+0.5%Japan +1%
+1.6%EU53 +5%
+4.5%North America4 +44%
Contributionto growth
+6.1%China +16%
▪ The global pharma market is expected to grow with of a CAGR of +4.4% by 2024 including the impact of Covid-19, that should negatively impact volumes over 4 to 6 months in 2020 and lead to higher pressure on prices worldwide in the next 5 years
▪ EU5 countries account together for only 14% of the global pharma market (Germany: 4%, France: 3%, Italy: 3%, UK: 2% and Spain: 2%) and should see their weight drop by 2 points by 2024, due to higher price pressure than in the average of the other countries
▪ North America should continue to weigh for 43% of the global pharma market in value and contribute to 44% to worldwide market growth over the 2019 – 2024 period
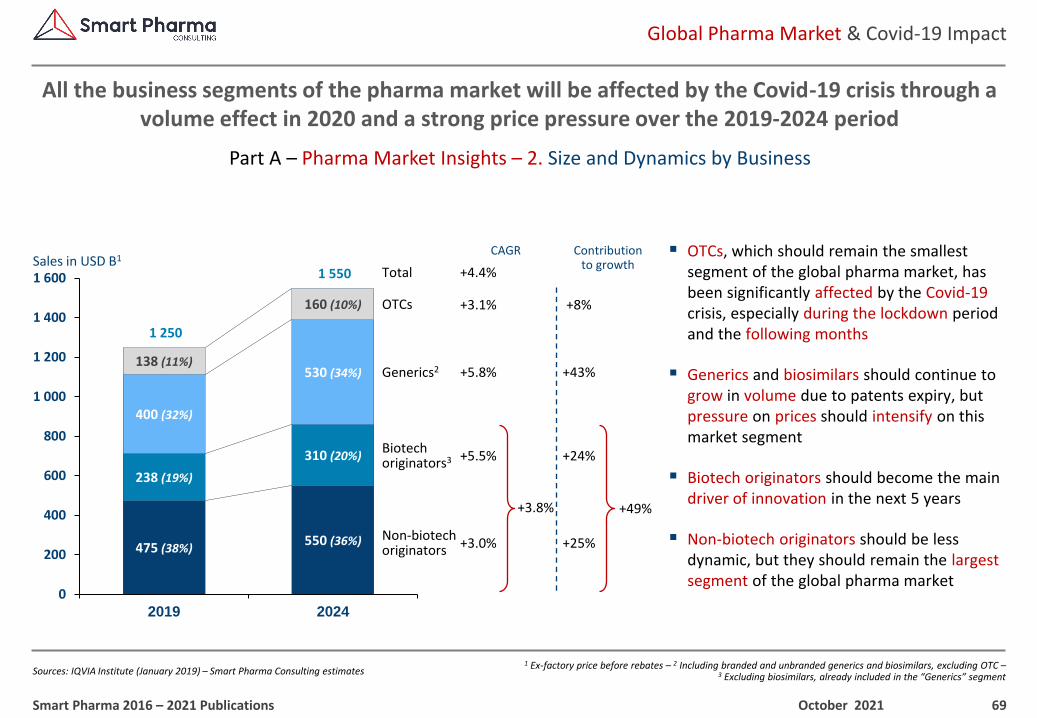
69
1 Ex-factory price before rebates – 2 Including branded and unbranded generics and biosimilars, excluding OTC –3 Excluding biosimilars, already included in the “Generics” segment
Global Pharma Market & Covid-19 Impact
Sources: IQVIA Institute (January 2019) – Smart Pharma Consulting estimates
Part A – Pharma Market Insights – 2. Size and Dynamics by Business
All the business segments of the pharma market will be affected by the Covid-19 crisis through a volume effect in 2020 and a strong price pressure over the 2019-2024 period
October 2021Smart Pharma 2016 – 2021 Publications
475 (38%)550 (36%)
238 (19%)
310 (20%)
400 (32%)
530 (34%)138 (11%)
160 (10%)
1 250
1 550
0
200
400
600
800
1 000
1 200
1 400
1 600
2019 2024
Sales in USD B1
OTCs
▪ OTCs, which should remain the smallest segment of the global pharma market, has been significantly affected by the Covid-19crisis, especially during the lockdown period and the following months
▪ Generics and biosimilars should continue to grow in volume due to patents expiry, but pressure on prices should intensify on this market segment
▪ Biotech originators should become the main driver of innovation in the next 5 years
▪ Non-biotech originators should be less dynamic, but they should remain the largest segment of the global pharma market
CAGR Contributionto growth
+49%
+8%
Total
+25%Non-biotech originators +3.0%
Generics2 +43%+5.8%
Biotech originators3 +24%+5.5%
+3.1%
+3.8%
+4.4%
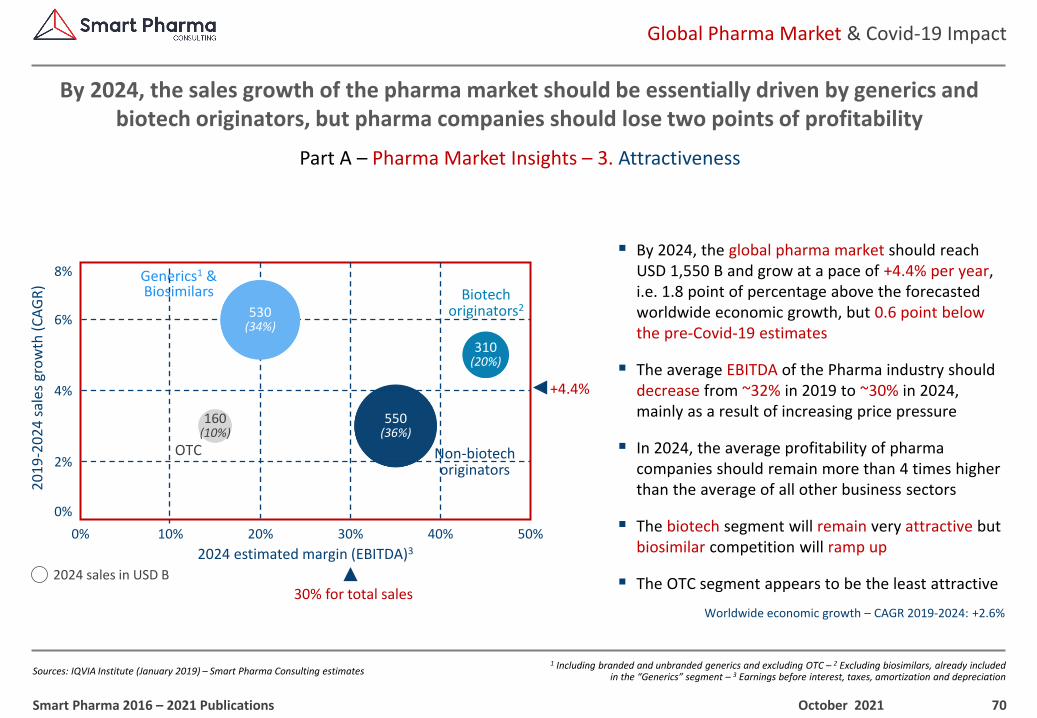
70
1 Including branded and unbranded generics and excluding OTC – 2 Excluding biosimilars, already includedin the “Generics” segment – 3 Earnings before interest, taxes, amortization and depreciation
Global Pharma Market & Covid-19 Impact
Sources: IQVIA Institute (January 2019) – Smart Pharma Consulting estimates
Part A – Pharma Market Insights – 3. Attractiveness
By 2024, the sales growth of the pharma market should be essentially driven by generics and biotech originators, but pharma companies should lose two points of profitability
October 2021Smart Pharma 2016 – 2021 Publications
▪ By 2024, the global pharma market should reach USD 1,550 B and grow at a pace of +4.4% per year, i.e. 1.8 point of percentage above the forecasted worldwide economic growth, but 0.6 point below the pre-Covid-19 estimates
▪ The average EBITDA of the Pharma industry should decrease from ~32% in 2019 to ~30% in 2024, mainly as a result of increasing price pressure
▪ In 2024, the average profitability of pharma companies should remain more than 4 times higher than the average of all other business sectors
▪ The biotech segment will remain very attractive but biosimilar competition will ramp up
▪ The OTC segment appears to be the least attractive
2024 estimated margin (EBITDA)3
20
19
-20
24
sal
es g
row
th (
CA
GR
)
10% 50%30% 40%
0%
8%
2024 sales in USD B
Generics1 &Biosimilars
30% for total sales
6%
2%
550(36%)
310(20%)
OTC
+4.4%4%
0%
Non-biotech originators
Biotech originators2530
(34%)
20%
160(10%)
Worldwide economic growth – CAGR 2019-2024: +2.6%
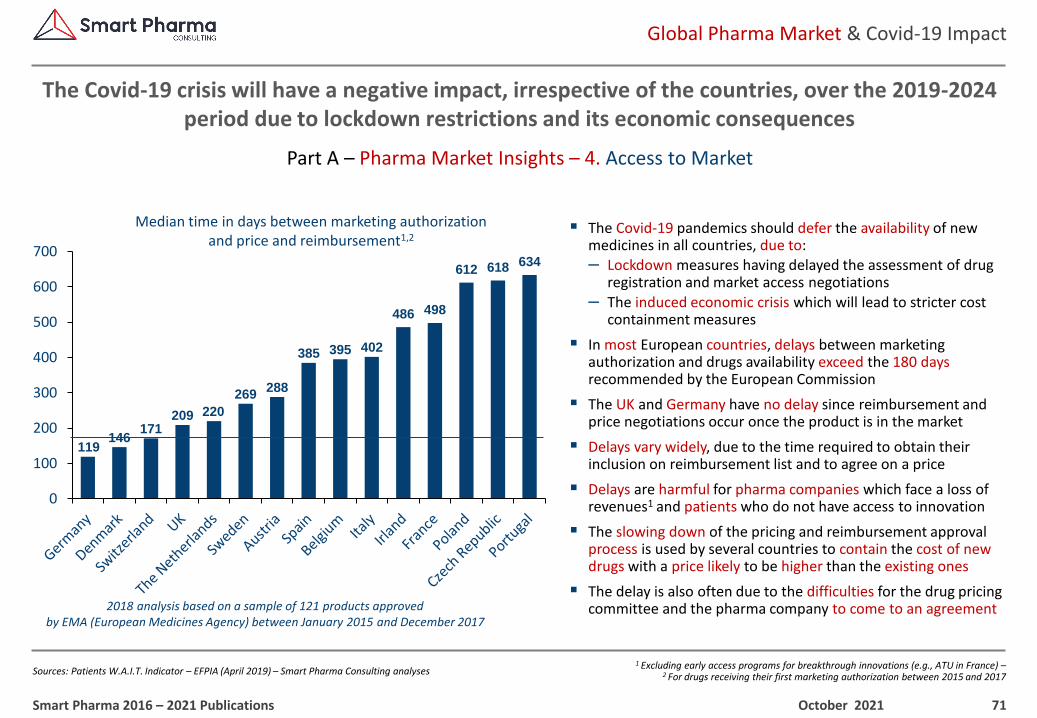
71
1 Excluding early access programs for breakthrough innovations (e.g., ATU in France) –2 For drugs receiving their first marketing authorization between 2015 and 2017
Global Pharma Market & Covid-19 Impact
Sources: Patients W.A.I.T. Indicator – EFPIA (April 2019) – Smart Pharma Consulting analyses
Part A – Pharma Market Insights – 4. Access to Market
The Covid-19 crisis will have a negative impact, irrespective of the countries, over the 2019-2024 period due to lockdown restrictions and its economic consequences
October 2021Smart Pharma 2016 – 2021 Publications
119146
171209 220
269288
385 395 402
486 498
612 618 634
0
100
200
300
400
500
600
700
Median time in days between marketing authorizationand price and reimbursement1,2
▪ The Covid-19 pandemics should defer the availability of new medicines in all countries, due to:– Lockdown measures having delayed the assessment of drug
registration and market access negotiations– The induced economic crisis which will lead to stricter cost
containment measures
▪ In most European countries, delays between marketing authorization and drugs availability exceed the 180 days recommended by the European Commission
▪ The UK and Germany have no delay since reimbursement and price negotiations occur once the product is in the market
▪ Delays vary widely, due to the time required to obtain their inclusion on reimbursement list and to agree on a price
▪ Delays are harmful for pharma companies which face a loss of revenues1 and patients who do not have access to innovation
▪ The slowing down of the pricing and reimbursement approval process is used by several countries to contain the cost of new drugs with a price likely to be higher than the existing ones
▪ The delay is also often due to the difficulties for the drug pricing committee and the pharma company to come to an agreement2018 analysis based on a sample of 121 products approved
by EMA (European Medicines Agency) between January 2015 and December 2017
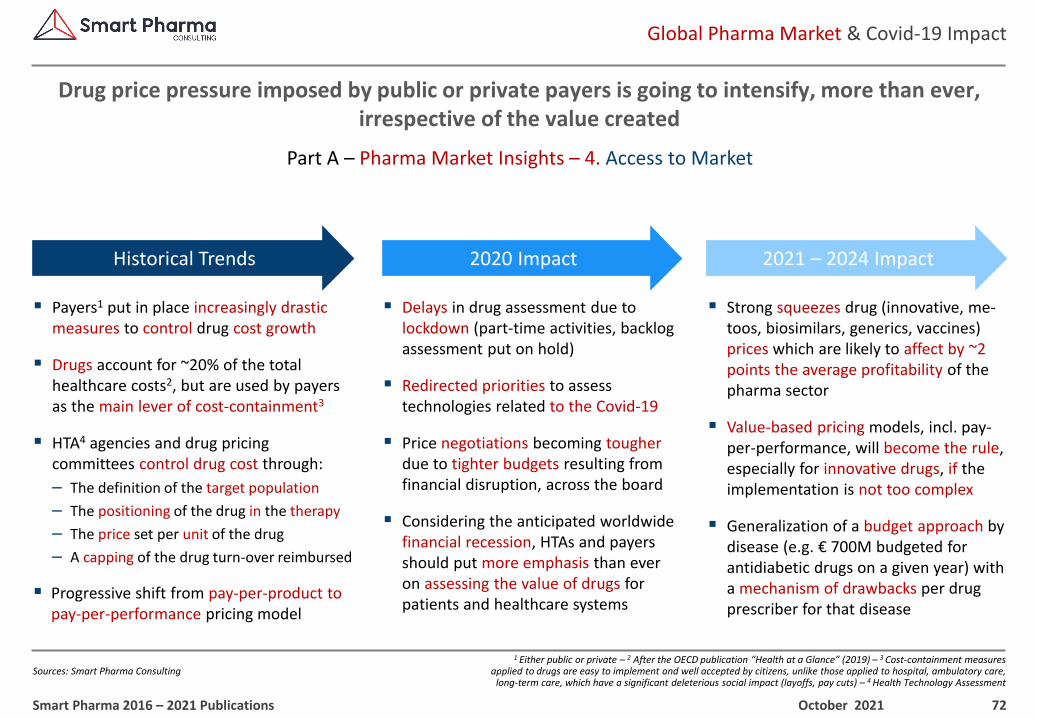
72
1 Either public or private – 2 After the OECD publication “Health at a Glance” (2019) – 3 Cost-containment measures applied to drugs are easy to implement and well accepted by citizens, unlike those applied to hospital, ambulatory care,
long-term care, which have a significant deleterious social impact (layoffs, pay cuts) – 4 Health Technology Assessment
Global Pharma Market & Covid-19 Impact
Sources: Smart Pharma Consulting
Part A – Pharma Market Insights – 4. Access to Market
Drug price pressure imposed by public or private payers is going to intensify, more than ever, irrespective of the value created
October 2021Smart Pharma 2016 – 2021 Publications
▪ Strong squeezes drug (innovative, me-toos, biosimilars, generics, vaccines) prices which are likely to affect by ~2 points the average profitability of the pharma sector
▪ Value-based pricing models, incl. pay-per-performance, will become the rule, especially for innovative drugs, if the implementation is not too complex
▪ Generalization of a budget approach by disease (e.g. € 700M budgeted for antidiabetic drugs on a given year) with a mechanism of drawbacks per drug prescriber for that disease
▪ Delays in drug assessment due to lockdown (part-time activities, backlog assessment put on hold)
▪ Redirected priorities to assess technologies related to the Covid-19
▪ Price negotiations becoming tougher due to tighter budgets resulting from financial disruption, across the board
▪ Considering the anticipated worldwide financial recession, HTAs and payers should put more emphasis than ever on assessing the value of drugs for patients and healthcare systems
▪ Payers1 put in place increasingly drastic measures to control drug cost growth
▪ Drugs account for ~20% of the total healthcare costs2, but are used by payers as the main lever of cost-containment3
▪ HTA4 agencies and drug pricing committees control drug cost through:
– The definition of the target population
– The positioning of the drug in the therapy
– The price set per unit of the drug
– A capping of the drug turn-over reimbursed
▪ Progressive shift from pay-per-product topay-per-performance pricing model
2020 Impact 2021 – 2024 ImpactHistorical Trends
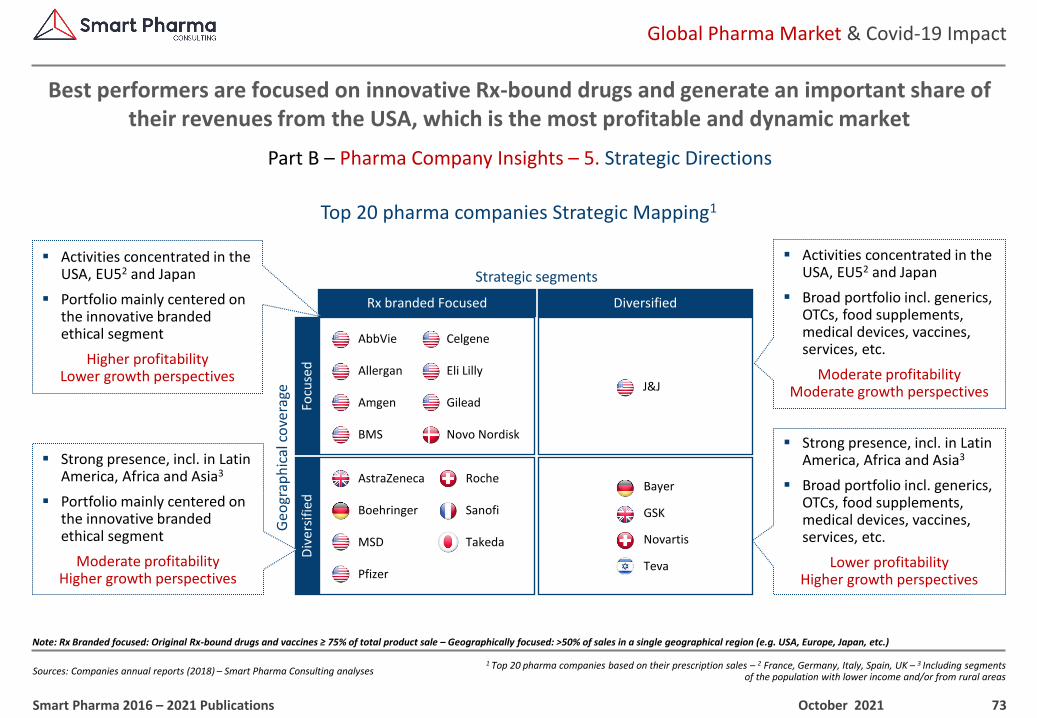
73
1 Top 20 pharma companies based on their prescription sales – 2 France, Germany, Italy, Spain, UK – 3 Including segments of the population with lower income and/or from rural areas
Global Pharma Market & Covid-19 Impact
Sources: Companies annual reports (2018) – Smart Pharma Consulting analyses
Part B – Pharma Company Insights – 5. Strategic Directions
Best performers are focused on innovative Rx-bound drugs and generate an important share of their revenues from the USA, which is the most profitable and dynamic market
October 2021Smart Pharma 2016 – 2021 Publications
Strategic segmentsG
eogr
aph
ical
co
vera
ge
AbbVie
Allergan
Amgen
BMS
Celgene
Eli Lilly
Gilead
Novo Nordisk
J&J
Bayer
GSK
Novartis
Teva
AstraZeneca
Boehringer
MSD
Pfizer
Roche
Sanofi
Takeda
Rx branded Focused DiversifiedFo
cuse
dD
ive
rsif
ied
Top 20 pharma companies Strategic Mapping1
▪ Activities concentrated in the USA, EU52 and Japan
▪ Portfolio mainly centered on the innovative branded ethical segment
Higher profitability Lower growth perspectives
▪ Activities concentrated in the USA, EU52 and Japan
▪ Broad portfolio incl. generics, OTCs, food supplements, medical devices, vaccines, services, etc.
Moderate profitability Moderate growth perspectives
▪ Strong presence, incl. in Latin America, Africa and Asia3
▪ Broad portfolio incl. generics, OTCs, food supplements, medical devices, vaccines, services, etc.
Lower profitability Higher growth perspectives
▪ Strong presence, incl. in Latin America, Africa and Asia3
▪ Portfolio mainly centered on the innovative branded ethical segment
Moderate profitability Higher growth perspectives
Note: Rx Branded focused: Original Rx-bound drugs and vaccines ≥ 75% of total product sale – Geographically focused: >50% of sales in a single geographical region (e.g. USA, Europe, Japan, etc.)

74
Global Pharma Market & Covid-19 Impact
Sources: World Preview 2019 – Outlook to 2024 , Evaluate Pharma (June 2019) – Smart Pharma Consulting estimate
Part B – Pharma Company Insights – 6. R&D Operations
The important growth in oncology will be mainly driven by anti PD-1 products while immunosuppressants will benefit from an increased incidence of chronic diseases
October 2021Smart Pharma 2016 – 2021 Publications
▪ The 2024 therapeutic area forecasts shows the steadily increasing weight of specialty products, sustained by the development of new biological drugs
▪ Oncology prevails as the leading therapeutic area and will be notably driven by the growth of PD-1 inhibitors
▪ Immunosuppressants will have the highest CAGR through 2024, driven by the incidence of chronic diseases and the use of immunotherapeutic agents in clinical development for other therapeutic areas
▪ Biosimilars are beginning to make their mark on the anti-rheumatic segment, which should see a decline in its CAGR despite the high drive in sales from JAK inhibitors
▪ If a vaccine and/or a treatment for the Covid-19were discovered, the Vaccines and the Anti-viralssegments could be boosted over the period
25
31
31
32
36
42
45
55
58
237
0 50 100 150 200 250
Anti-coagulants
Sensory organs
Bronchodilators
Dermatologicals
Immunosuppressants
Anti-virals
Vaccines
Anti-rheumatics
Anti-diabetics
Oncology drugs
USD B
CAGR2019-2024
+11%
+3%
-1%
+7%
+1%
+17%
+2%
+5%
+13%
+4%
2024 sales per top 10 therapeutic area
1
2
3
4
5
6
7
8
9
10
2024 Market share
19%
5%
5%
4%
4%
3%
3%
3%
3%
2%
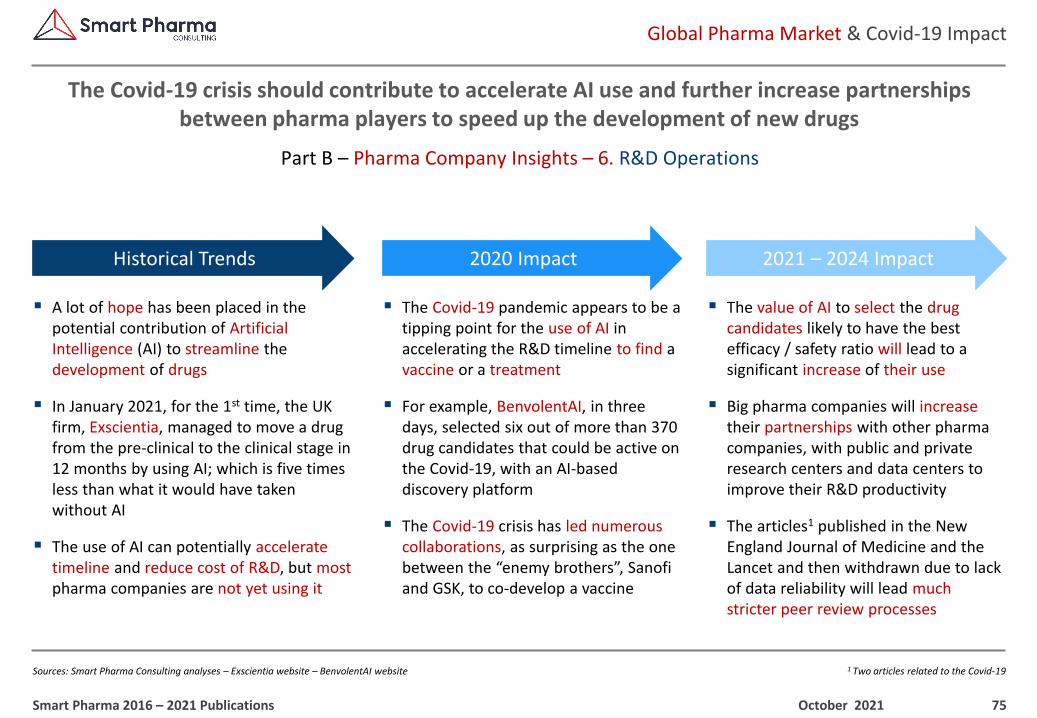
75
1 Two articles related to the Covid-19
Global Pharma Market & Covid-19 Impact
Sources: Smart Pharma Consulting analyses – Exscientia website – BenvolentAI website
Part B – Pharma Company Insights – 6. R&D Operations
The Covid-19 crisis should contribute to accelerate AI use and further increase partnerships between pharma players to speed up the development of new drugs
October 2021Smart Pharma 2016 – 2021 Publications
▪ The value of AI to select the drugcandidates likely to have the best efficacy / safety ratio will lead to a significant increase of their use
▪ Big pharma companies will increase their partnerships with other pharma companies, with public and private research centers and data centers to improve their R&D productivity
▪ The articles1 published in the New England Journal of Medicine and the Lancet and then withdrawn due to lack of data reliability will lead much stricter peer review processes
▪ The Covid-19 pandemic appears to be a tipping point for the use of AI in accelerating the R&D timeline to find a vaccine or a treatment
▪ For example, BenvolentAI, in three days, selected six out of more than 370 drug candidates that could be active on the Covid-19, with an AI-based discovery platform
▪ The Covid-19 crisis has led numerous collaborations, as surprising as the one between the “enemy brothers”, Sanofi and GSK, to co-develop a vaccine
▪ A lot of hope has been placed in the potential contribution of Artificial Intelligence (AI) to streamline the development of drugs
▪ In January 2021, for the 1st time, the UK firm, Exscientia, managed to move a drug from the pre-clinical to the clinical stage in 12 months by using AI; which is five times less than what it would have taken without AI
▪ The use of AI can potentially accelerate timeline and reduce cost of R&D, but most pharma companies are not yet using it
2020 Impact 2021 – 2024 ImpactHistorical Trends
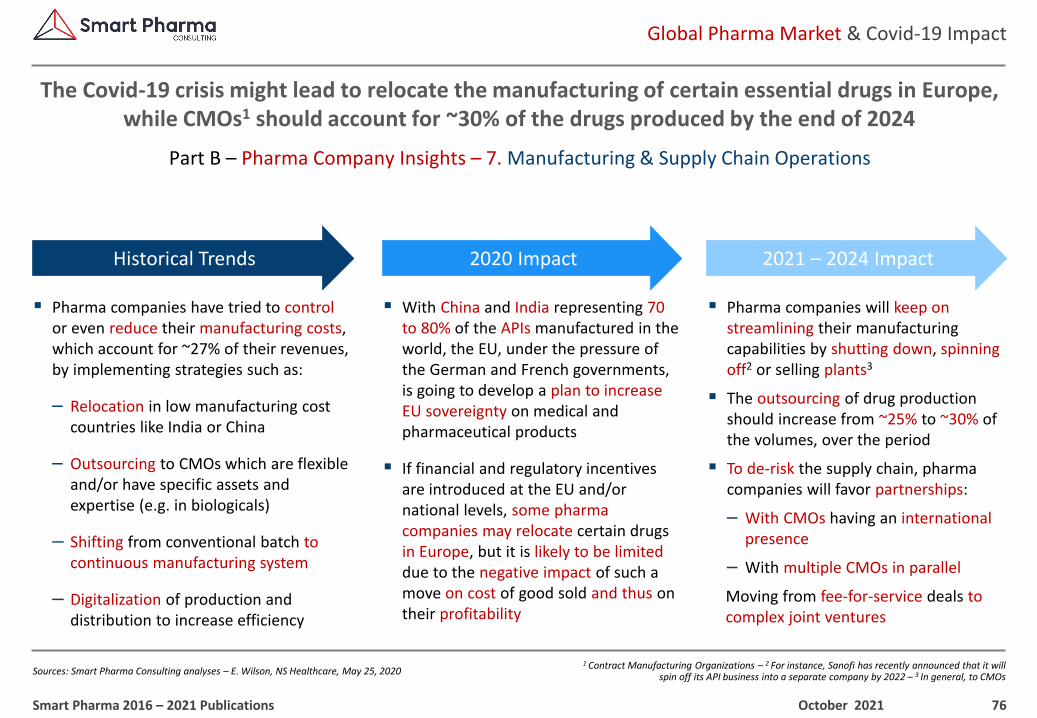
76
1 Contract Manufacturing Organizations – 2 For instance, Sanofi has recently announced that it will spin off its API business into a separate company by 2022 – 3 In general, to CMOs
Global Pharma Market & Covid-19 Impact
Sources: Smart Pharma Consulting analyses – E. Wilson, NS Healthcare, May 25, 2020
Part B – Pharma Company Insights – 7. Manufacturing & Supply Chain Operations
The Covid-19 crisis might lead to relocate the manufacturing of certain essential drugs in Europe, while CMOs1 should account for ~30% of the drugs produced by the end of 2024
October 2021Smart Pharma 2016 – 2021 Publications
▪ Pharma companies will keep on streamlining their manufacturing capabilities by shutting down, spinning off2 or selling plants3
▪ The outsourcing of drug production should increase from ~25% to ~30% of the volumes, over the period
▪ To de-risk the supply chain, pharma companies will favor partnerships:
– With CMOs having an internationalpresence
– With multiple CMOs in parallel
Moving from fee-for-service deals tocomplex joint ventures
▪ With China and India representing 70 to 80% of the APIs manufactured in the world, the EU, under the pressure of the German and French governments, is going to develop a plan to increase EU sovereignty on medical and pharmaceutical products
▪ If financial and regulatory incentives are introduced at the EU and/or national levels, some pharma companies may relocate certain drugs in Europe, but it is likely to be limited due to the negative impact of such a move on cost of good sold and thus on their profitability
▪ Pharma companies have tried to control or even reduce their manufacturing costs, which account for ~27% of their revenues, by implementing strategies such as:
– Relocation in low manufacturing cost countries like India or China
– Outsourcing to CMOs which are flexible and/or have specific assets and expertise (e.g. in biologicals)
‒ Shifting from conventional batch to continuous manufacturing system
‒ Digitalization of production and distribution to increase efficiency
2020 Impact 2021 – 2024 ImpactHistorical Trends
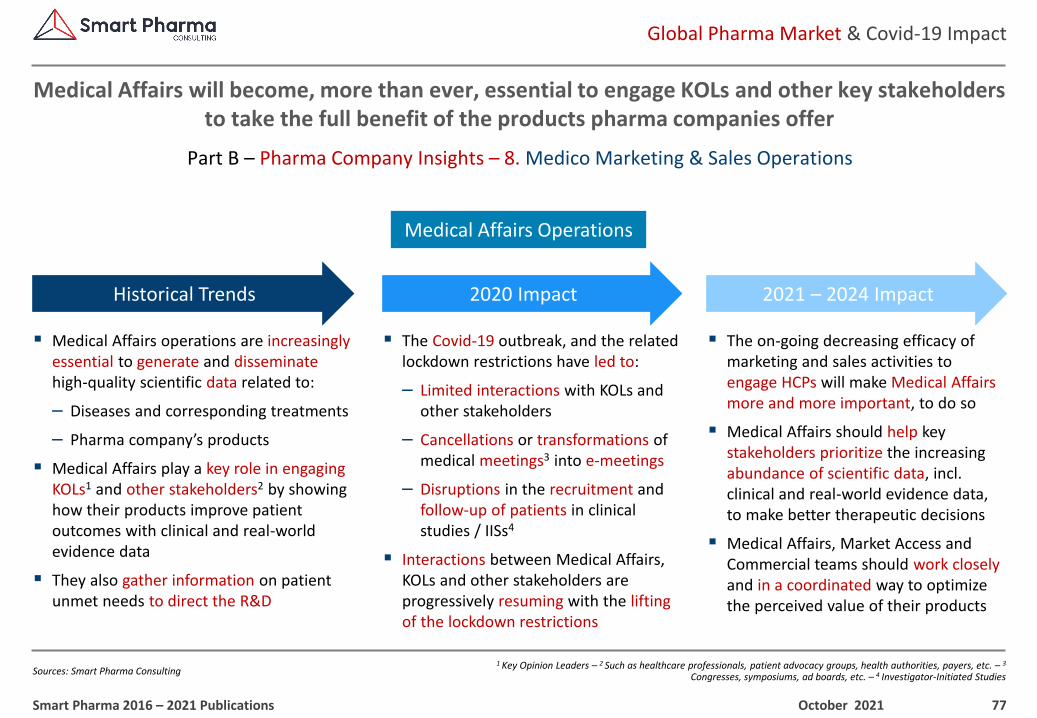
77
1 Key Opinion Leaders – 2 Such as healthcare professionals, patient advocacy groups, health authorities, payers, etc. – 3
Congresses, symposiums, ad boards, etc. – 4 Investigator-Initiated Studies
Global Pharma Market & Covid-19 Impact
Sources: Smart Pharma Consulting
Part B – Pharma Company Insights – 8. Medico Marketing & Sales Operations
Medical Affairs will become, more than ever, essential to engage KOLs and other key stakeholders to take the full benefit of the products pharma companies offer
October 2021Smart Pharma 2016 – 2021 Publications
▪ The on-going decreasing efficacy of marketing and sales activities to engage HCPs will make Medical Affairs more and more important, to do so
▪ Medical Affairs should help key stakeholders prioritize the increasing abundance of scientific data, incl. clinical and real-world evidence data, to make better therapeutic decisions
▪ Medical Affairs, Market Access and Commercial teams should work closely and in a coordinated way to optimize the perceived value of their products
▪ The Covid-19 outbreak, and the related lockdown restrictions have led to:
– Limited interactions with KOLs and other stakeholders
– Cancellations or transformations of medical meetings3 into e-meetings
– Disruptions in the recruitment and follow-up of patients in clinical studies / IISs4
▪ Interactions between Medical Affairs, KOLs and other stakeholders are progressively resuming with the lifting of the lockdown restrictions
▪ Medical Affairs operations are increasingly essential to generate and disseminate high-quality scientific data related to:
– Diseases and corresponding treatments
– Pharma company’s products
▪ Medical Affairs play a key role in engaging KOLs1 and other stakeholders2 by showing how their products improve patient outcomes with clinical and real-world evidence data
▪ They also gather information on patient unmet needs to direct the R&D
2020 Impact 2021 – 2024 ImpactHistorical Trends
Medical Affairs Operations
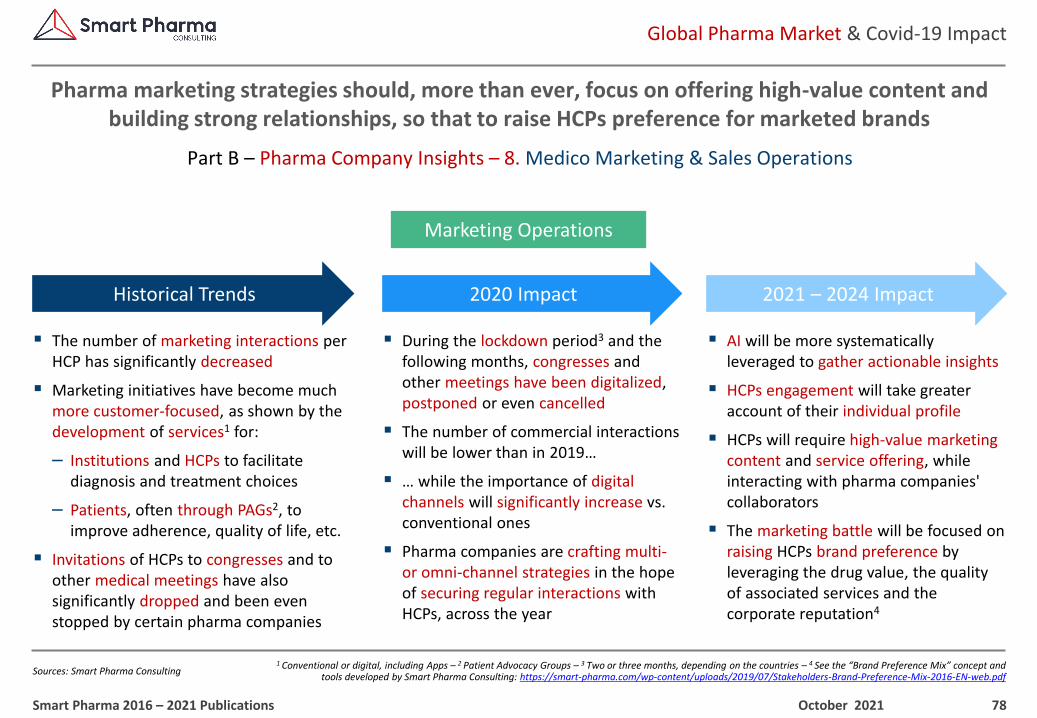
78
1 Conventional or digital, including Apps – 2 Patient Advocacy Groups – 3 Two or three months, depending on the countries – 4 See the “Brand Preference Mix” concept and tools developed by Smart Pharma Consulting: https://smart-pharma.com/wp-content/uploads/2019/07/Stakeholders-Brand-Preference-Mix-2016-EN-web.pdf
Global Pharma Market & Covid-19 Impact
Sources: Smart Pharma Consulting
Part B – Pharma Company Insights – 8. Medico Marketing & Sales Operations
Pharma marketing strategies should, more than ever, focus on offering high-value content and building strong relationships, so that to raise HCPs preference for marketed brands
October 2021Smart Pharma 2016 – 2021 Publications
Marketing Operations
2020 Impact 2021 – 2024 ImpactHistorical Trends
▪ AI will be more systematically leveraged to gather actionable insights
▪ HCPs engagement will take greater account of their individual profile
▪ HCPs will require high-value marketing content and service offering, while interacting with pharma companies' collaborators
▪ The marketing battle will be focused on raising HCPs brand preference by leveraging the drug value, the quality of associated services and the corporate reputation4
▪ During the lockdown period3 and the following months, congresses and other meetings have been digitalized, postponed or even cancelled
▪ The number of commercial interactions will be lower than in 2019…
▪ … while the importance of digital channels will significantly increase vs. conventional ones
▪ Pharma companies are crafting multi-or omni-channel strategies in the hope of securing regular interactions with HCPs, across the year
▪ The number of marketing interactions per HCP has significantly decreased
▪ Marketing initiatives have become much more customer-focused, as shown by the development of services1 for:
– Institutions and HCPs to facilitate diagnosis and treatment choices
– Patients, often through PAGs2, to improve adherence, quality of life, etc.
▪ Invitations of HCPs to congresses and to other medical meetings have also significantly dropped and been even stopped by certain pharma companies
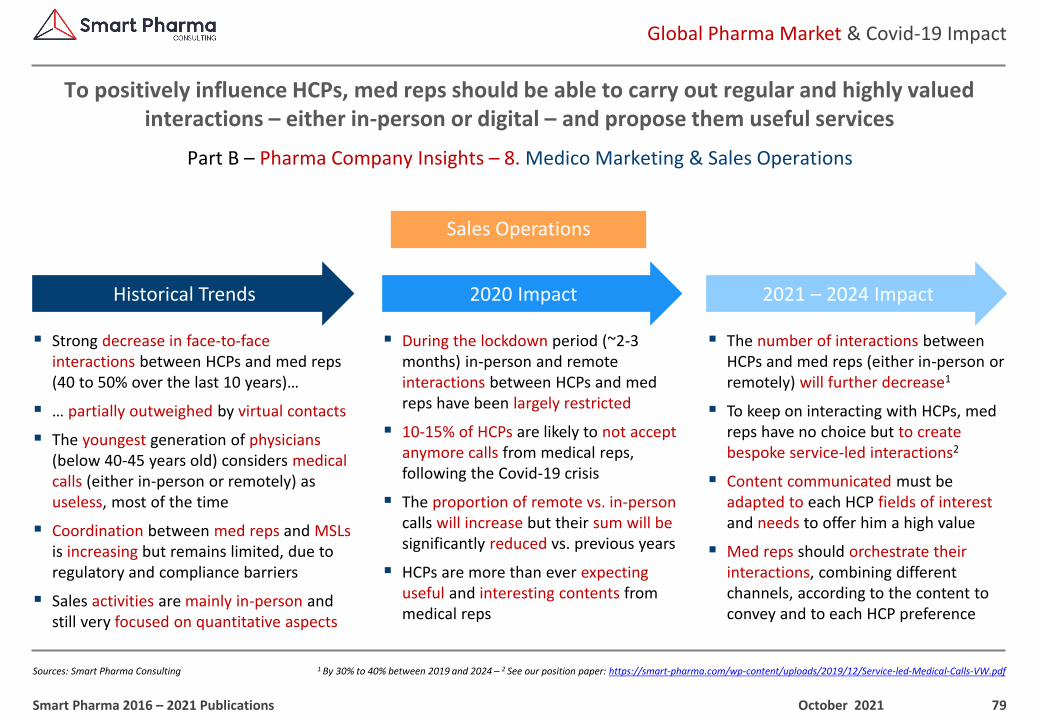
79
1 By 30% to 40% between 2019 and 2024 – 2 See our position paper: https://smart-pharma.com/wp-content/uploads/2019/12/Service-led-Medical-Calls-VW.pdf
Global Pharma Market & Covid-19 Impact
Sources: Smart Pharma Consulting
Part B – Pharma Company Insights – 8. Medico Marketing & Sales Operations
To positively influence HCPs, med reps should be able to carry out regular and highly valued interactions – either in-person or digital – and propose them useful services
October 2021Smart Pharma 2016 – 2021 Publications
Sales Operations
2020 Impact 2021 – 2024 ImpactHistorical Trends
▪ The number of interactions between HCPs and med reps (either in-person or remotely) will further decrease1
▪ To keep on interacting with HCPs, med reps have no choice but to create bespoke service-led interactions2
▪ Content communicated must be adapted to each HCP fields of interest and needs to offer him a high value
▪ Med reps should orchestrate their interactions, combining different channels, according to the content to convey and to each HCP preference
▪ During the lockdown period (~2-3 months) in-person and remote interactions between HCPs and med reps have been largely restricted
▪ 10-15% of HCPs are likely to not accept anymore calls from medical reps, following the Covid-19 crisis
▪ The proportion of remote vs. in-person calls will increase but their sum will be significantly reduced vs. previous years
▪ HCPs are more than ever expecting useful and interesting contents from medical reps
▪ Strong decrease in face-to-face interactions between HCPs and med reps (40 to 50% over the last 10 years)…
▪ … partially outweighed by virtual contacts
▪ The youngest generation of physicians(below 40-45 years old) considers medical calls (either in-person or remotely) as useless, most of the time
▪ Coordination between med reps and MSLsis increasing but remains limited, due to regulatory and compliance barriers
▪ Sales activities are mainly in-person and still very focused on quantitative aspects
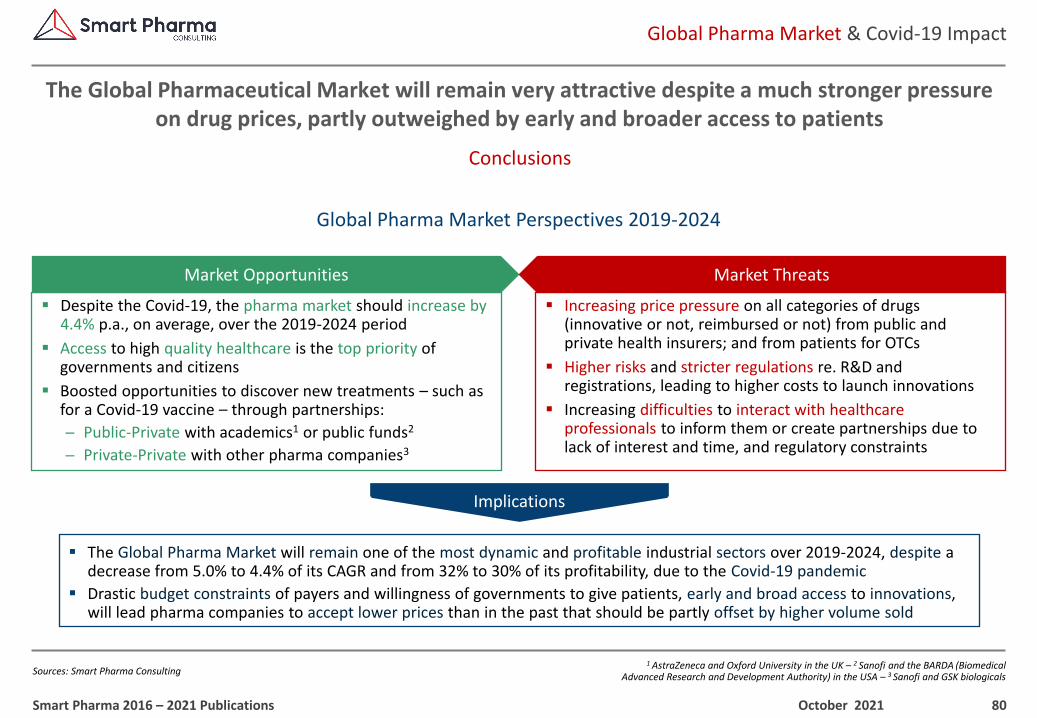
80
1 AstraZeneca and Oxford University in the UK – 2 Sanofi and the BARDA (Biomedical Advanced Research and Development Authority) in the USA – 3 Sanofi and GSK biologicals
Global Pharma Market & Covid-19 Impact
Sources: Smart Pharma Consulting
Conclusions
The Global Pharmaceutical Market will remain very attractive despite a much stronger pressure on drug prices, partly outweighed by early and broader access to patients
October 2021Smart Pharma 2016 – 2021 Publications
▪ Despite the Covid-19, the pharma market should increase by 4.4% p.a., on average, over the 2019-2024 period
▪ Access to high quality healthcare is the top priority of governments and citizens
▪ Boosted opportunities to discover new treatments – such as for a Covid-19 vaccine – through partnerships:
– Public-Private with academics1 or public funds2
– Private-Private with other pharma companies3
▪ Increasing price pressure on all categories of drugs (innovative or not, reimbursed or not) from public and private health insurers; and from patients for OTCs
▪ Higher risks and stricter regulations re. R&D and registrations, leading to higher costs to launch innovations
▪ Increasing difficulties to interact with healthcare professionals to inform them or create partnerships due to lack of interest and time, and regulatory constraints
Global Pharma Market Perspectives 2019-2024
Market Opportunities Market Threats
Implications
▪ The Global Pharma Market will remain one of the most dynamic and profitable industrial sectors over 2019-2024, despite a decrease from 5.0% to 4.4% of its CAGR and from 32% to 30% of its profitability, due to the Covid-19 pandemic
▪ Drastic budget constraints of payers and willingness of governments to give patients, early and broad access to innovations, will lead pharma companies to accept lower prices than in the past that should be partly offset by higher volume sold
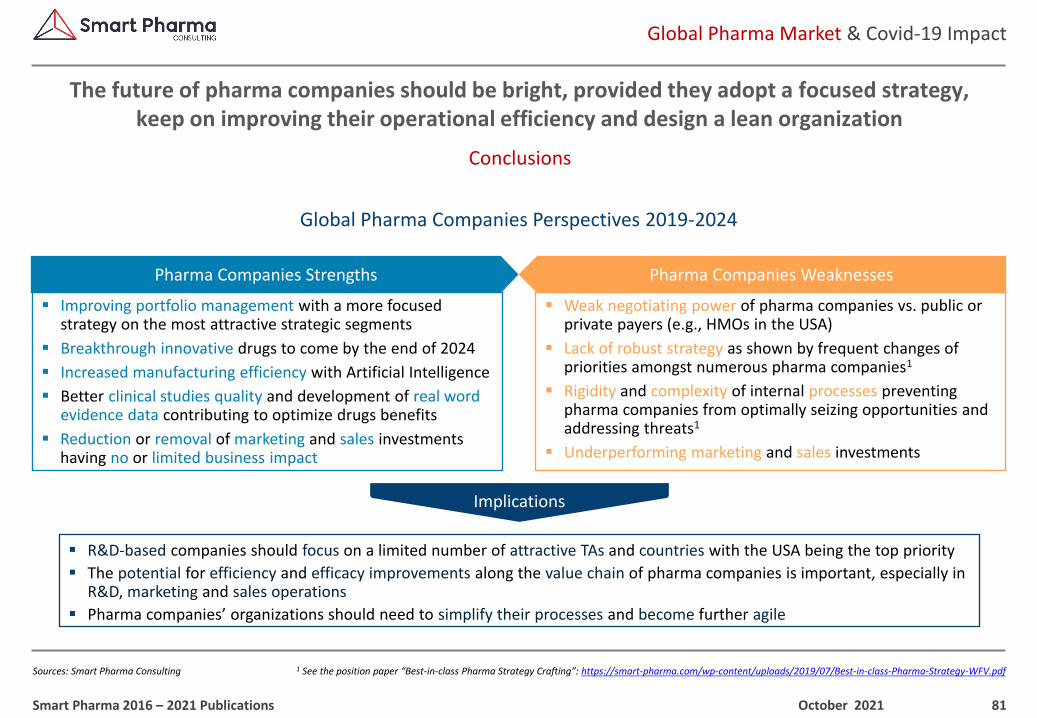
81
1 See the position paper “Best-in-class Pharma Strategy Crafting”: https://smart-pharma.com/wp-content/uploads/2019/07/Best-in-class-Pharma-Strategy-WFV.pdf
Global Pharma Market & Covid-19 Impact
Sources: Smart Pharma Consulting
Conclusions
The future of pharma companies should be bright, provided they adopt a focused strategy, keep on improving their operational efficiency and design a lean organization
October 2021Smart Pharma 2016 – 2021 Publications
▪ Improving portfolio management with a more focused strategy on the most attractive strategic segments
▪ Breakthrough innovative drugs to come by the end of 2024
▪ Increased manufacturing efficiency with Artificial Intelligence
▪ Better clinical studies quality and development of real word evidence data contributing to optimize drugs benefits
▪ Reduction or removal of marketing and sales investments having no or limited business impact
▪ Weak negotiating power of pharma companies vs. public or private payers (e.g., HMOs in the USA)
▪ Lack of robust strategy as shown by frequent changes of priorities amongst numerous pharma companies1
▪ Rigidity and complexity of internal processes preventing pharma companies from optimally seizing opportunities and addressing threats1
▪ Underperforming marketing and sales investments
Global Pharma Companies Perspectives 2019-2024
Pharma Companies Strengths Pharma Companies Weaknesses
Implications
▪ R&D-based companies should focus on a limited number of attractive TAs and countries with the USA being the top priority
▪ The potential for efficiency and efficacy improvements along the value chain of pharma companies is important, especially in R&D, marketing and sales operations
▪ Pharma companies’ organizations should need to simplify their processes and become further agile

82
1 Real World Evidence data – 2 Patient advocacy groups – 3 See the position paper “How to create a superior Pharma Corporate Reputation?”: https://smart-pharma.com/wp-content/uploads/2019/07/Pharma-Corporate-Reputation-VF.pdf – 4 And to a lesser extent in distribution or manufacturing facilities – 5 Corporate Social Responsibility
Global Pharma Market & Covid-19 Impact
Sources: Smart Pharma Consulting
Conclusions
Best performing pharma companies have in common to market better drugs, offer highly valued services and have a good reputation, driving the preference of their stakeholders
October 2021Smart Pharma 2016 – 2021 Publications
Innovative Product Portfolio Highly Valued Services Good Corporate Reputation
▪ Develop innovative drugs to address public health priorities as set by governments (e.g. cancers, neuro-degenerative, infectious and cardio-metabolic diseases) at an affordable and acceptable price for payers
▪ Endeavour to enter first markets with innovations and avoid me-too products with no or minimal incremental added value
▪ Carry out robust clinical studies to raiseearly confidence of key stakeholders:‒ Health authorities and payers to ease
market access‒ HCPs for earlier adoption
▪ Complete clinical studies with RWE1 data
▪ Offer services highly valued by key stakeholders (e.g. policy makers, payers, HCPs, patients and/or PAGS2)…
▪ … and related to the company products(services around the pills) to enhancethe perceived value of the latter
▪ Thus, these services should be useful, interesting, convenient and properlyexecuted
▪ Better communicate about high added-value services proposed, so that to enhance stakeholders’ preference for the drug sold by the company
▪ Build a stronger corporate reputation3, better than competition, by:
‒ Offering highly valued drugs at an affordable price
‒ Offering highly valued services to key stakeholders
‒ Communicating on R&D activities and product pipeline
‒ Investing in R&D projects4 in strategic markets
‒ Strengthening the skills and ethical behavior of collaborators
‒ Developing a good working atmosphere …
‒ … and possibly going beyond CSR5 legalobligations
Strategic Priority: Fight for Key Stakeholders Preference
1, rue Houdart de Lamotte – 75015 Paris – FranceTel. +33 6 11 96 33 78
Email : [email protected] – Website : www.smart-pharma.com
Serving & Sharing with Passion
French Retail Pharmacies
POSITION PAPER
2019-2023 perspectives
MARKET INSIGHTS
January 2020
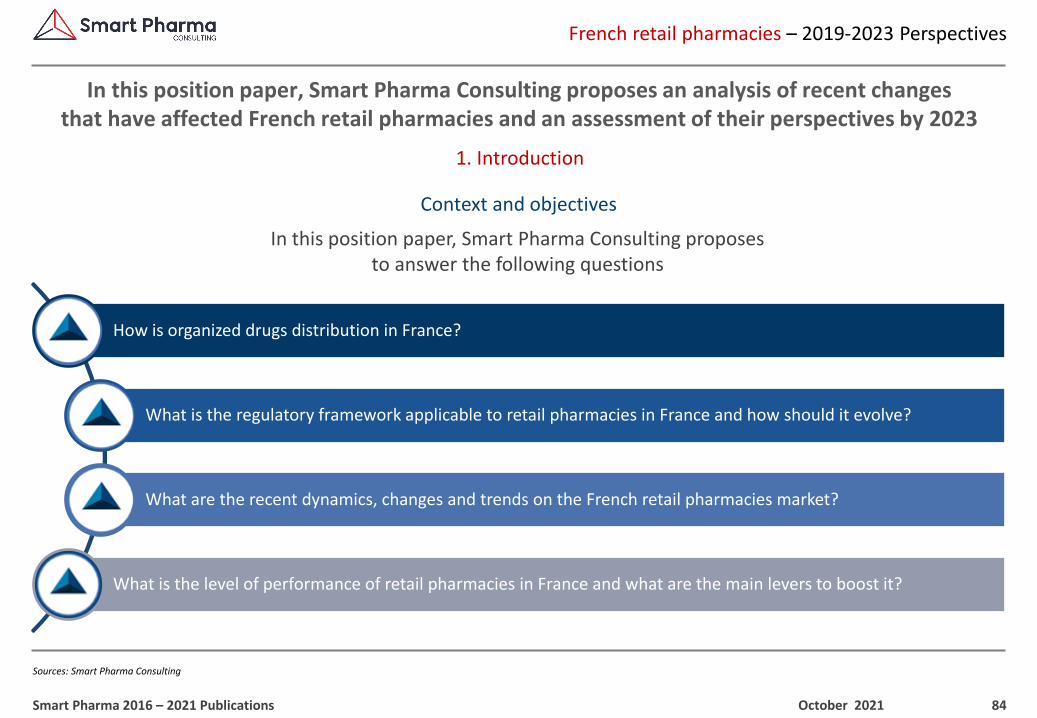
84
French retail pharmacies – 2019-2023 Perspectives
Sources: Smart Pharma Consulting
1. Introduction
In this position paper, Smart Pharma Consulting proposes an analysis of recent changes that have affected French retail pharmacies and an assessment of their perspectives by 2023
October 2021Smart Pharma 2016 – 2021 Publications
How is organized drugs distribution in France?
What is the regulatory framework applicable to retail pharmacies in France and how should it evolve?
What are the recent dynamics, changes and trends on the French retail pharmacies market?
What is the level of performance of retail pharmacies in France and what are the main levers to boost it?
In this position paper, Smart Pharma Consulting proposes to answer the following questions
Context and objectives
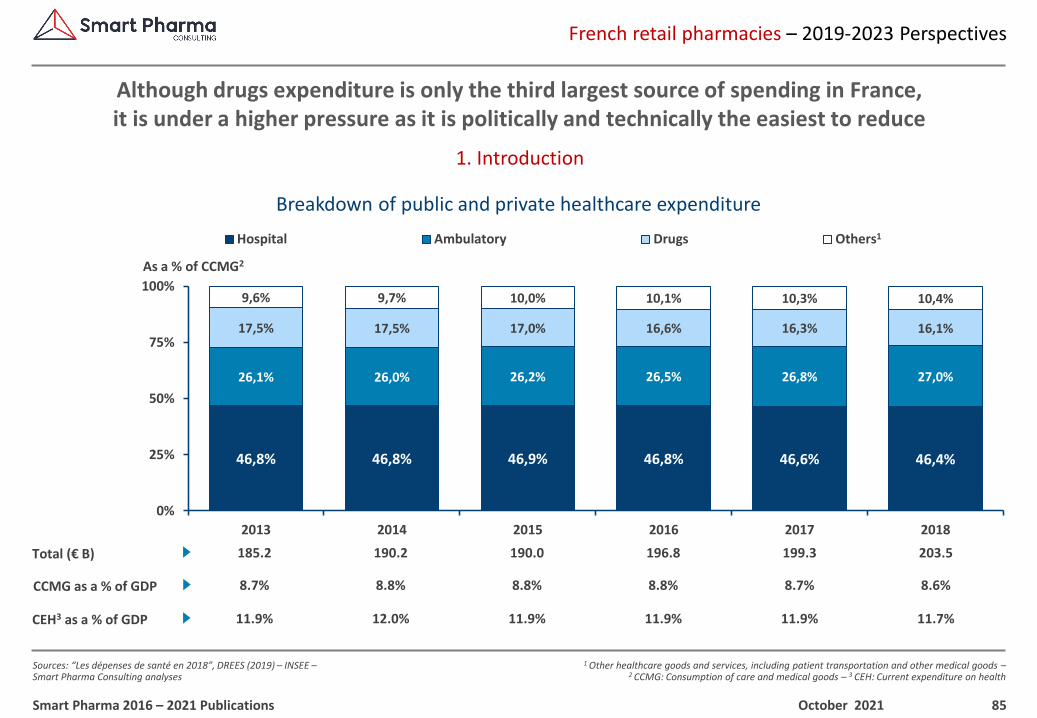
85
1 Other healthcare goods and services, including patient transportation and other medical goods –2 CCMG: Consumption of care and medical goods – 3 CEH: Current expenditure on health
French retail pharmacies – 2019-2023 Perspectives
Sources: “Les dépenses de santé en 2018”, DREES (2019) – INSEE –Smart Pharma Consulting analyses
1. Introduction
Although drugs expenditure is only the third largest source of spending in France,it is under a higher pressure as it is politically and technically the easiest to reduce
October 2021Smart Pharma 2016 – 2021 Publications
46,8% 46,8% 46,9% 46,8% 46,6% 46,4%
26,1% 26,0% 26,2% 26,5% 26,8% 27,0%
17,5% 17,5% 17,0% 16,6% 16,3% 16,1%
9,6% 9,7% 10,0% 10,1% 10,3% 10,4%
0%
25%
50%
75%
100%
2013 2014 2015 2016 2017 2018
Hospital Ambulatory Drugs Others
As a % of CCMG2
Total (€ B)
CEH3 as a % of GDP
190.2
12.0%
8.8%
185.2
11.9%
8.7%CCMG as a % of GDP
190.0
11.9%
8.8%
196.8
11.9%
8.8%
199.3
11.9%
8.7%
1
203.5
11.7%
8.6%
Breakdown of public and private healthcare expenditure
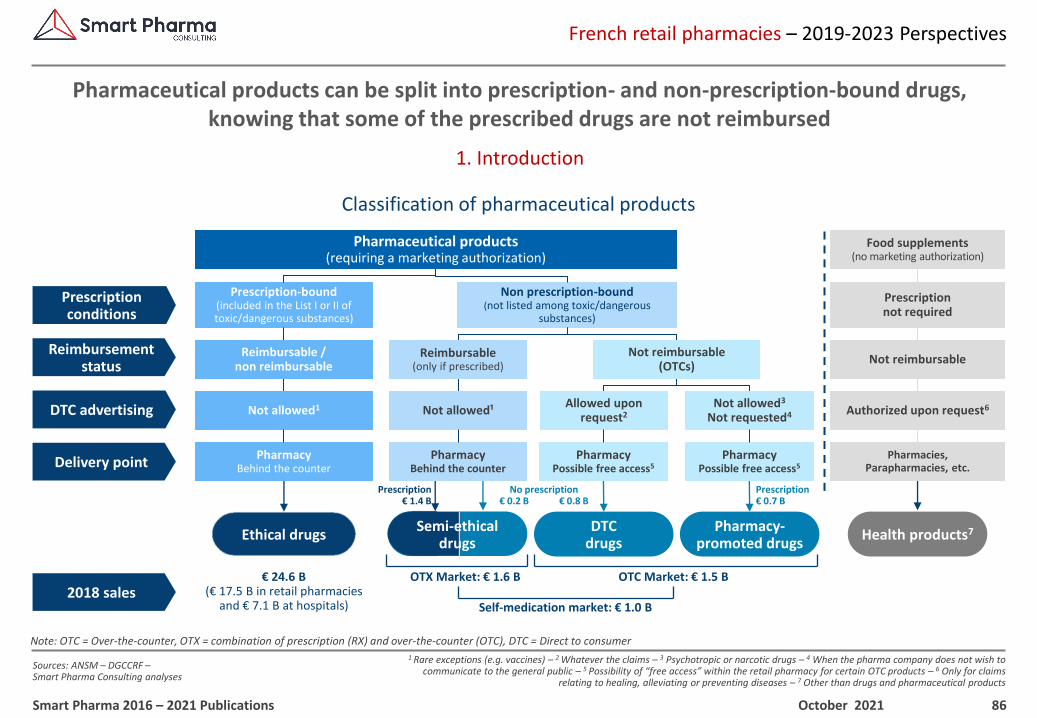
86
1 Rare exceptions (e.g. vaccines) – 2 Whatever the claims – 3 Psychotropic or narcotic drugs – 4 When the pharma company does not wish to communicate to the general public – 5 Possibility of “free access” within the retail pharmacy for certain OTC products – 6 Only for claims
relating to healing, alleviating or preventing diseases – 7 Other than drugs and pharmaceutical products
French retail pharmacies – 2019-2023 Perspectives
Sources: ANSM – DGCCRF –Smart Pharma Consulting analyses
1. Introduction
Pharmaceutical products can be split into prescription- and non-prescription-bound drugs, knowing that some of the prescribed drugs are not reimbursed
October 2021Smart Pharma 2016 – 2021 Publications
Note: OTC = Over-the-counter, OTX = combination of prescription (RX) and over-the-counter (OTC), DTC = Direct to consumer
Ethical drugs
Prescription-bound(included in the List I or II of toxic/dangerous substances)
Non prescription-bound(not listed among toxic/dangerous
substances)
Reimbursable /non reimbursable
Reimbursable(only if prescribed)
Not reimbursable(OTCs)
DTCdrugs
Pharmacy-promoted drugs
Not allowed1 Not allowed¹Allowed upon
request2Not allowed3
Not requested4
PharmacyBehind the counter
PharmacyBehind the counter
PharmacyPossible free access5
PharmacyPossible free access5
OTC Market: € 1.5 BOTX Market: € 1.6 B
Semi-ethicaldrugs
Prescriptionconditions
Reimbursementstatus
DTC advertising
Delivery point
Pharmaceutical products(requiring a marketing authorization)
Health products7
Food supplements(no marketing authorization)
Prescriptionnot required
Not reimbursable
Authorized upon request6
Pharmacies,Parapharmacies, etc.
Prescription€ 1.4 B
No prescription€ 0.2 B € 0.8 B
Self-medication market: € 1.0 B
€ 24.6 B(€ 17.5 B in retail pharmacies
and € 7.1 B at hospitals)2018 sales
Prescription€ 0.7 B
Classification of pharmaceutical products
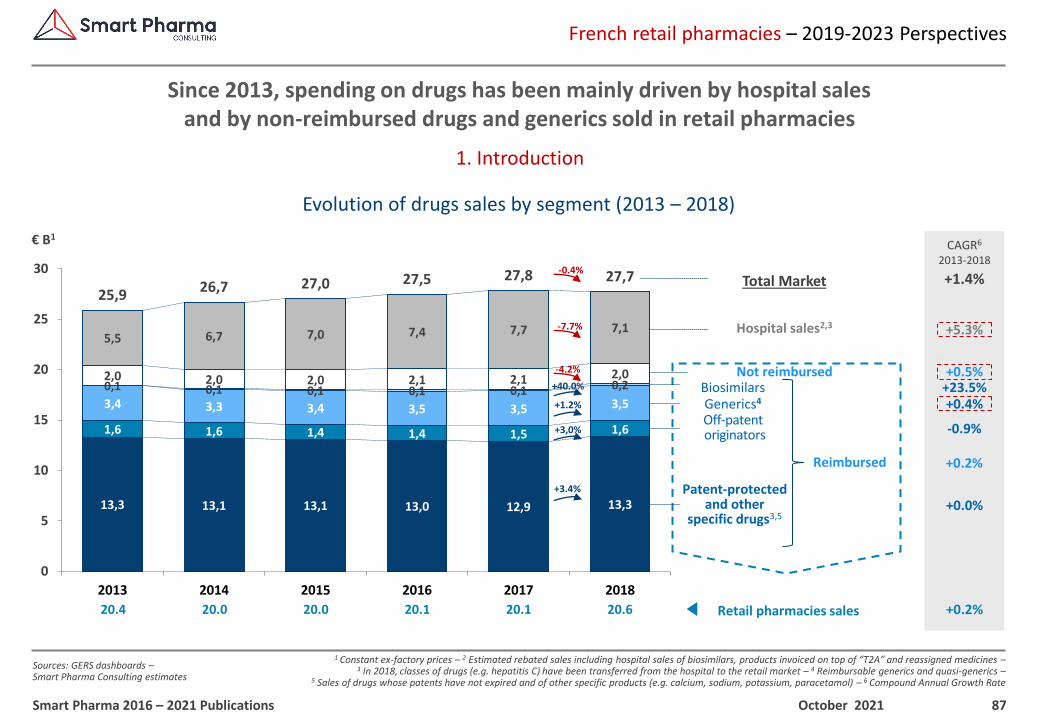
87
1 Constant ex-factory prices – 2 Estimated rebated sales including hospital sales of biosimilars, products invoiced on top of “T2A” and reassigned medicines –3 In 2018, classes of drugs (e.g. hepatitis C) have been transferred from the hospital to the retail market – 4 Reimbursable generics and quasi-generics –
5 Sales of drugs whose patents have not expired and of other specific products (e.g. calcium, sodium, potassium, paracetamol) – 6 Compound Annual Growth Rate
French retail pharmacies – 2019-2023 Perspectives
Sources: GERS dashboards –Smart Pharma Consulting estimates
1. Introduction
Since 2013, spending on drugs has been mainly driven by hospital salesand by non-reimbursed drugs and generics sold in retail pharmacies
October 2021Smart Pharma 2016 – 2021 Publications
20.120.020.4
Hospital sales2,3
Off-patent originators
Patent-protectedand other
specific drugs3,5
Total Market
Not reimbursed
Retail pharmacies sales
€ B1
Generics4
+3,0%
+3.4%
Reimbursed
+1.2%
+40.0%
-4.2%
20.1
-7.7%
-0.4%
CAGR6
2013-2018
+0.2%
+1.4%
+5.3%
+0.5%
+0.4%
-0.9%
+0.2%
Biosimilars +23.5%
+0.0%
20.620.0
13,3 13,1 13,1 13,0 12,9 13,3
1,6 1,6 1,4 1,4 1,5 1,6
3,4 3,3 3,4 3,5 3,5 3,5
0,1 0,1 0,1 0,1 0,1 0,22,0 2,0 2,0 2,1 2,1 2,0
5,5 6,7 7,0 7,4 7,7 7,1
25,926,7 27,0 27,5 27,8 27,7
0
5
10
15
20
25
30
2013 2014 2015 2016 2017 2018
Evolution of drugs sales by segment (2013 – 2018)
88
1 Accounting for ~97.7% of the wholesalers market in 2018 – 2 Pre-wholesalers –3 Including 620 pharmacies located in French overseas departments – 4 Of which 17 with more than 500 members individually – 5 Mandatory or optional medical prescription, reimbursed or not
French retail pharmacies – 2019-2023 Perspectives
Sources: CSRP – LEEM – GERS – French Council of Pharmacists – ANSM –DREES –Ameli and RPPS database –Smart Pharma Consulting analyses
2. Drugs distribution
The drug supply chain organization involves 4 categories of stakeholders which are highly dependent on the decisions made by healthcare authorities and payers
October 2021Smart Pharma 2016 – 2021 Publications
21,447 pharmacies3
Sales Delivery
Information / Promotion Prescription
Indirect sales (~80%)
~67.0 millionpatients / consumers
▪ Drugs5
▪ Medical device
▪ Parapharmacy
▪ Etc.
▪ 123,753 specialists▪ 102,466 GPs
Prescribers
34 VTOs4
Deposit
Manufacturers
Semi-direct sales (<1%)
7 main wholesalers1
~100 agents2
Distributors
Clients
Authorities & Payers
Key stakeholders
89
¹ Pre-wholeselling to wholesalers or VTOs or directly selling to retail pharmacists – 2 Market share in value (2018) –3 Non-members of the “Chambre Syndicale de la Répartition Pharmaceutique (CSRP)”
French retail pharmacies – 2019-2023 Perspectives
Sources: Xerfi – LEEM – GERS – CSRP –ANSM – Register of the French pharmaceutical establishments – Smart Pharma Consulting analyses
2. Drugs distribution
~80% of the value goes through wholesalers, who are the cornerstoneof the supply chain between pharma companies and retail pharmacies
October 2021Smart Pharma 2016 – 2021 Publications
▪ Independent health specialists:
– CSP
▪ Subsidiaries of integrated distribution groups and health specialists:
– Alloga / Directlog (Alliance Healthcare)
– Eurodep (CERP)
– IvryLab (PharmaVie / Phoenix Pharma)
– Movianto1 (Owens & Minor, USA)
– Sogiphar (Giphar)
▪ Subsidiaries of integrated distribution groups; non health specialists:
– FM Health (FM Logistic)
– Arvato Services Healthcare(Bertelsmann group)
– Pharmalog (Geodis)
– Rhenus (previously Wincanton)
▪ Subsidiaries of pharmaceutical companies:
– AstraZeneca
– Pierre Fabre
– Sanofi Pasteur
– Servier
Wholesalers (~80%)
Market share2
▪ CERP network 36.2%– CERP Rouen (Astera) 20.7%– CERP Rhin Rhône Méditerranée 11.8%– CERP Bretagne Atlantique 3.7%
▪ OCP (McKesson) 31.3%
▪ Alliance Healthcare France 19.2%(Alliance Boots)
▪ Phoenix Pharma (Phoenix Group) 8.4%
▪ Giphar 2.6%
▪ Others3 2.3%
Pharmaceuticalcompanies
Direct sales
5%
Wholesalers10%
15% 15%
5%
70%80%
Agents1
Agents (~20%)
Retailpharmacies(€ 20.6 B)
Share of direct sales in the retail market
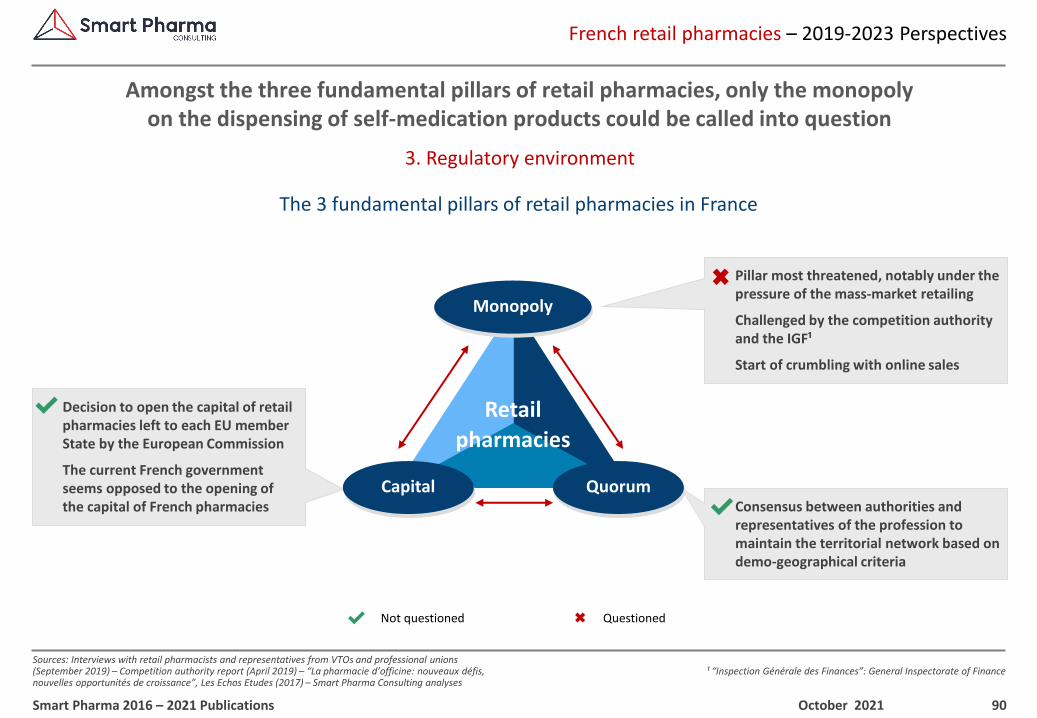
90
¹ “Inspection Générale des Finances”: General Inspectorate of Finance
French retail pharmacies – 2019-2023 Perspectives
Sources: Interviews with retail pharmacists and representatives from VTOs and professional unions (September 2019) – Competition authority report (April 2019) – “La pharmacie d’officine: nouveaux défis, nouvelles opportunités de croissance”, Les Echos Etudes (2017) – Smart Pharma Consulting analyses
3. Regulatory environment
Amongst the three fundamental pillars of retail pharmacies, only the monopoly on the dispensing of self-medication products could be called into question
October 2021Smart Pharma 2016 – 2021 Publications
QuestionedNot questioned✔
Consensus between authorities and representatives of the profession to maintain the territorial network based on demo-geographical criteria
Pillar most threatened, notably under the pressure of the mass-market retailing
Challenged by the competition authority and the IGF¹
Start of crumbling with online sales
Decision to open the capital of retail pharmacies left to each EU member State by the European Commission
The current French government seems opposed to the opening of the capital of French pharmacies ✔
✔
Monopoly
Capital
Retail
pharmacies
Quorum
The 3 fundamental pillars of retail pharmacies in France
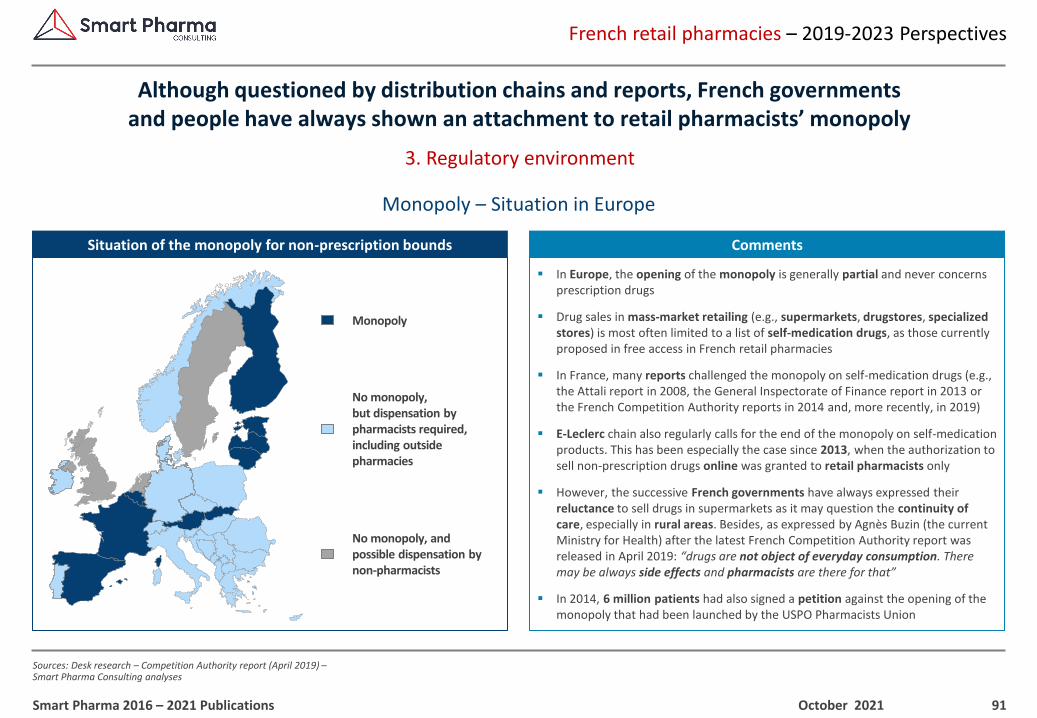
91
French retail pharmacies – 2019-2023 Perspectives
Sources: Desk research – Competition Authority report (April 2019) –Smart Pharma Consulting analyses
3. Regulatory environment
Although questioned by distribution chains and reports, French governments and people have always shown an attachment to retail pharmacists’ monopoly
October 2021Smart Pharma 2016 – 2021 Publications
Situation of the monopoly for non-prescription bounds
▪ In Europe, the opening of the monopoly is generally partial and never concerns prescription drugs
▪ Drug sales in mass-market retailing (e.g., supermarkets, drugstores, specialized stores) is most often limited to a list of self-medication drugs, as those currently proposed in free access in French retail pharmacies
▪ In France, many reports challenged the monopoly on self-medication drugs (e.g., the Attali report in 2008, the General Inspectorate of Finance report in 2013 or the French Competition Authority reports in 2014 and, more recently, in 2019)
▪ E-Leclerc chain also regularly calls for the end of the monopoly on self-medication products. This has been especially the case since 2013, when the authorization to sell non-prescription drugs online was granted to retail pharmacists only
▪ However, the successive French governments have always expressed their reluctance to sell drugs in supermarkets as it may question the continuity of care, especially in rural areas. Besides, as expressed by Agnès Buzin (the current Ministry for Health) after the latest French Competition Authority report was released in April 2019: “drugs are not object of everyday consumption. There may be always side effects and pharmacists are there for that”
▪ In 2014, 6 million patients had also signed a petition against the opening of the monopoly that had been launched by the USPO Pharmacists Union
Comments
No monopoly, but dispensation by pharmacists required, including outside pharmacies
Monopoly
No monopoly, and possible dispensation by non-pharmacists
Monopoly – Situation in Europe
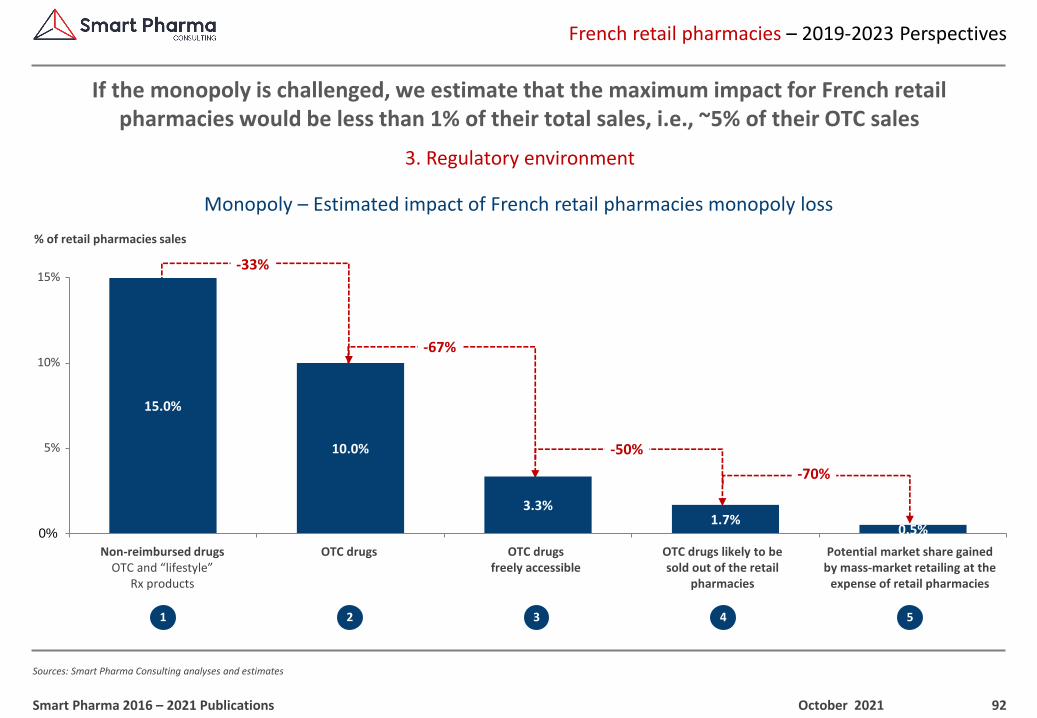
92
French retail pharmacies – 2019-2023 Perspectives
Sources: Smart Pharma Consulting analyses and estimates
3. Regulatory environment
If the monopoly is challenged, we estimate that the maximum impact for French retail pharmacies would be less than 1% of their total sales, i.e., ~5% of their OTC sales
October 2021Smart Pharma 2016 – 2021 Publications
1 2 3 4 5
% of retail pharmacies sales
-33%
-67%
-50%
-70%
15.0%
10.0%
3.3%1.7%
0.5%0%
33%
67%
100%
Non-reimbursabledrugs
OTC Free access Share of drugs that would notbe sold exclusively in retail
pharmacies
Potential market share gainedby supermarkets
Non-reimbursed drugsOTC and “lifestyle”
Rx products
OTC drugs OTC drugsfreely accessible
OTC drugs likely to besold out of the retail
pharmacies
Potential market share gained by mass-market retailing at the
expense of retail pharmacies
15%
10%
5%
Monopoly – Estimated impact of French retail pharmacies monopoly loss
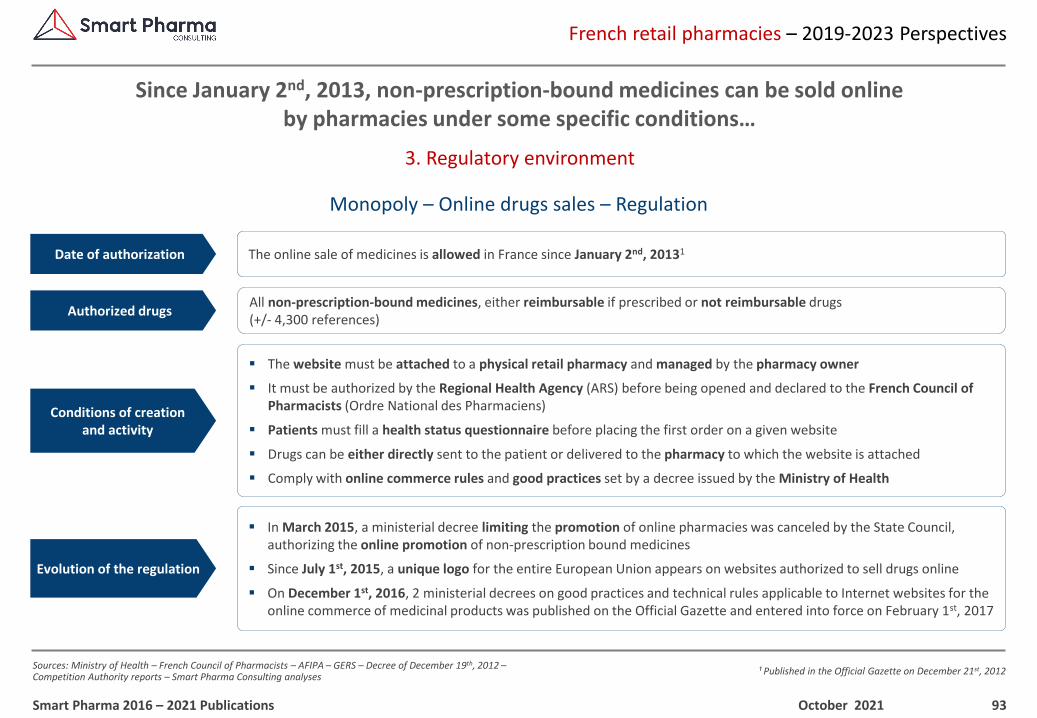
93
¹ Published in the Official Gazette on December 21st, 2012
French retail pharmacies – 2019-2023 Perspectives
Sources: Ministry of Health – French Council of Pharmacists – AFIPA – GERS – Decree of December 19th, 2012 –Competition Authority reports – Smart Pharma Consulting analyses
3. Regulatory environment
Since January 2nd, 2013, non-prescription-bound medicines can be sold onlineby pharmacies under some specific conditions…
October 2021Smart Pharma 2016 – 2021 Publications
The online sale of medicines is allowed in France since January 2nd, 20131Date of authorization
All non-prescription-bound medicines, either reimbursable if prescribed or not reimbursable drugs (+/- 4,300 references)
Authorized drugs
Conditions of creationand activity
▪ In March 2015, a ministerial decree limiting the promotion of online pharmacies was canceled by the State Council, authorizing the online promotion of non-prescription bound medicines
▪ Since July 1st, 2015, a unique logo for the entire European Union appears on websites authorized to sell drugs online
▪ On December 1st, 2016, 2 ministerial decrees on good practices and technical rules applicable to Internet websites for the online commerce of medicinal products was published on the Official Gazette and entered into force on February 1st, 2017
Evolution of the regulation
Monopoly – Online drugs sales – Regulation
▪ The website must be attached to a physical retail pharmacy and managed by the pharmacy owner
▪ It must be authorized by the Regional Health Agency (ARS) before being opened and declared to the French Council of Pharmacists (Ordre National des Pharmaciens)
▪ Patients must fill a health status questionnaire before placing the first order on a given website
▪ Drugs can be either directly sent to the patient or delivered to the pharmacy to which the website is attached
▪ Comply with online commerce rules and good practices set by a decree issued by the Ministry of Health
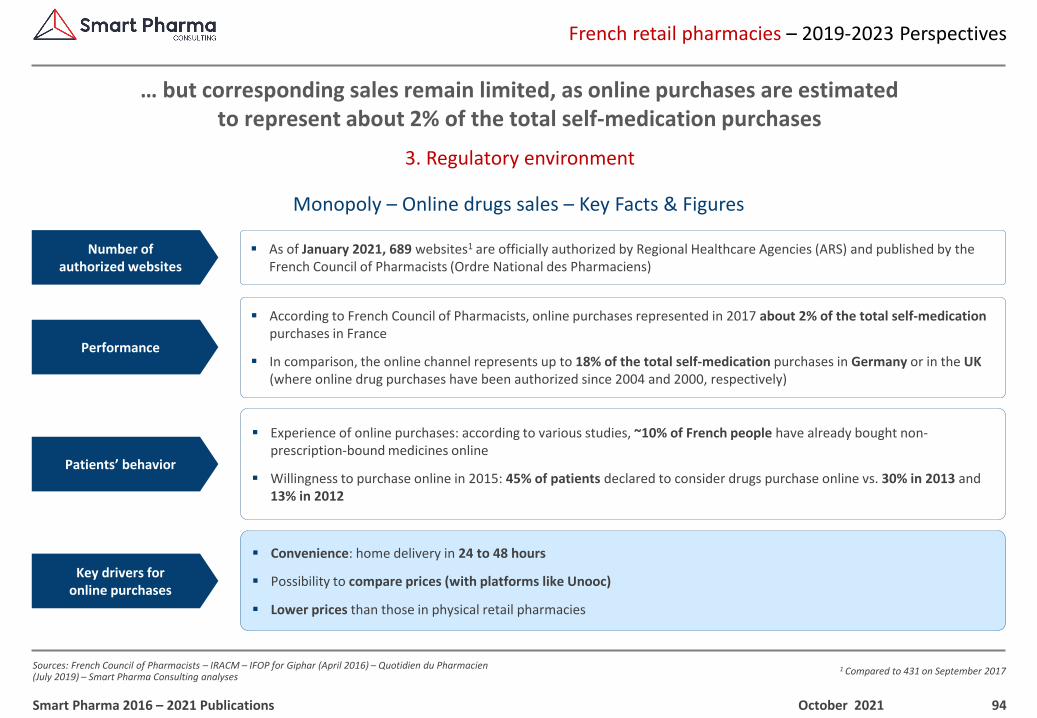
94
1 Compared to 431 on September 2017
French retail pharmacies – 2019-2023 Perspectives
Sources: French Council of Pharmacists – IRACM – IFOP for Giphar (April 2016) – Quotidien du Pharmacien(July 2019) – Smart Pharma Consulting analyses
3. Regulatory environment
… but corresponding sales remain limited, as online purchases are estimated to represent about 2% of the total self-medication purchases
October 2021Smart Pharma 2016 – 2021 Publications
▪ As of January 2021, 689 websites1 are officially authorized by Regional Healthcare Agencies (ARS) and published by the French Council of Pharmacists (Ordre National des Pharmaciens)
Number of authorized websites
▪ According to French Council of Pharmacists, online purchases represented in 2017 about 2% of the total self-medication purchases in France
▪ In comparison, the online channel represents up to 18% of the total self-medication purchases in Germany or in the UK(where online drug purchases have been authorized since 2004 and 2000, respectively)
Performance
▪ Experience of online purchases: according to various studies, ~10% of French people have already bought non-prescription-bound medicines online
▪ Willingness to purchase online in 2015: 45% of patients declared to consider drugs purchase online vs. 30% in 2013 and 13% in 2012
Patients’ behavior
▪ Convenience: home delivery in 24 to 48 hours
▪ Possibility to compare prices (with platforms like Unooc)
▪ Lower prices than those in physical retail pharmacies
Key drivers foronline purchases
Monopoly – Online drugs sales – Key Facts & Figures
95
French retail pharmacies – 2019-2023 Perspectives
Sources: Press release n° 44/09 from the Court of Justice of the European Communities –Ferrand report (October 2014) –La distribution au détail du médicament au sein de l'Union Européenne: un croisement entre santé et commerce, CAIRN –Le Quotidien du Pharmacien (13/10/2014) –Smart Pharma Consulting analyses
3. Regulatory environment
Various government reports have advocated the opening of the capital of pharmaciesbut it does not seem that there is any real political will to adopt such a law
October 2021Smart Pharma 2016 – 2021 Publications
Current regulation
▪ In Europe, although some countries have made the choice to reduce the ownership of retail pharmacies capital to pharmacists, as in France, other countries have chosen to open the capital of retail pharmacies to non-pharmacists, leading to the creation of drug chains (e.g., UK, Netherlands, etc.)
▪ In this context, and since the early 2000s, various government reports aimed at modernizing the French economy (e.g., Beigbeder, Attali and Longuet reports) recommended the opening of the capital to non-pharmacists …
▪ … like the European Commission which, in March 2007, put France and other countries in need of liberalization
▪ Subsequently, the European Court of Justice was solicited on similar cases in Italy and Germany. It ruled that a pharmacist "is supposed to operate the pharmacy not for a purely economic purpose, but also for a professional purpose related to his medical training. The subordinationof pharmacists, as employees, to an outside operator could make it difficult to oppose the instructions given”
▪ More recently, in October 2014, the Ferrand report submitted to the Minister of the Economy, recommended "to allow the opening of the capital of the liberal exercise societies (SEL) within the health professions, subject to the respect of the rules of incompatibility”
▪ The negotiations following the Ferrand report are today in the spirit of compromise, with the possibility of opening up the capital to the employees of the pharmacy only
Capital – Situation
96
1 Penalties up to the prohibition from exercising
French retail pharmacies – 2019-2023 Perspectives
Sources: Legifrance –Smart Pharma Consulting analyses
3. Regulatory environment
Since November 2019, retail pharmacists must report to the French Council of Pharmacistsall agreements / amendments signed with their related parties (including lenders)
October 2021Smart Pharma 2016 – 2021 Publications
The “Transparency” amendment (July 2019)
▪ On July 24th, 2019, the article L4221-19 of the French Public Health Code was amended to increase transparency on the agreements that may signed between pharmacy owners and non-pharmacists (e.g., investment funds)
▪ The amended article is written as follows:
– “Pharmacists must communicate to the French Council of Pharmacists, in addition to the statutes of their pharmacy and their endorsements, all agreements and corresponding amendments related to their operations with related parties, including partners and, when applicable, lenders contributing to the funding of their pharmacy”
– “These documents must be communicated within one month after the signature of the agreement or amendment”
– “Contractual provisions which are incompatible with the rules of the profession, or which may deprive the contracting parties of their professional independence render them liable to the disciplinary sanctions provided for in Article L. 4234-6 of the French Public Health Code”1
▪ This amendment came into force from November 1, 2019
Capital – Recent measure
97
French retail pharmacies – 2019-2023 Perspectives
Sources: Public service website (September 2019) – Smart Pharma Consulting analyses
3. Regulatory environment
The authorization to set up a pharmacy in a city depends on the number of inhabitantsand any creation, grouping or transfer is subject to the issue of a license
October 2021Smart Pharma 2016 – 2021 Publications
Current regulation
▪ In France, the authorization to establish a retail pharmacy in a city depends on the number of inhabitants identified in the city where it will be located, in accordance with the numerus clausus
▪ The opening of a pharmacy, by transfer or creation, is possible in cities with over 2,500 inhabitants (or 3,500 in Guyana, Moselle and Alsace and 7,500 for Mayotte). Then, the opening or transfer of new pharmacies is allowed for every 4,500 inhabitants. Thus, a second pharmacy can in a city with more than 7,000 inhabitants
▪ The establishment of a pharmacy in a city of less than 2,500 inhabitants is not allowed unless the city previously had a pharmacy that served more than 2,500 inhabitants
▪ The transfer of a pharmacy to another city is possible only if the city of origin has fewer than 2,500 inhabitants, if there is only one pharmacy or a population of less than 4,500 inhabitants per additional pharmacy
▪ Any transfer, grouping or creation of pharmacies is subject to the issue of a license by the Regional Health Agency (ARS)
▪ In some cases, the regional Prefect may also impose a minimum distance between the pharmacies of the district where the transfer takes place
Quorum – Situation
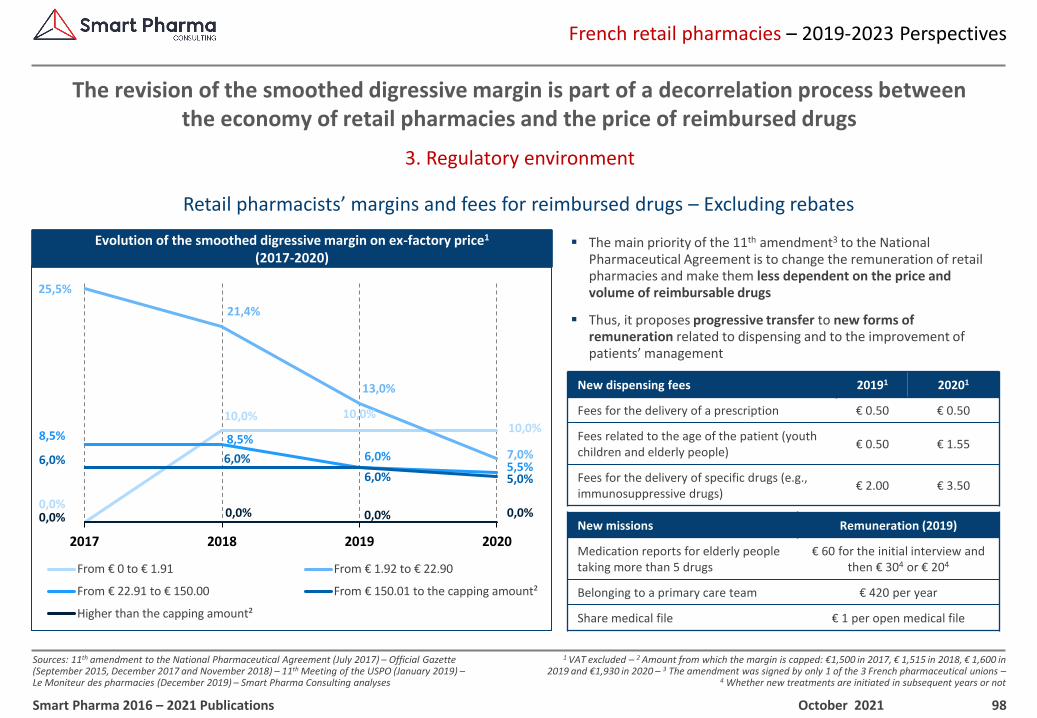
98
1 VAT excluded – 2 Amount from which the margin is capped: €1,500 in 2017, € 1,515 in 2018, € 1,600 in 2019 and €1,930 in 2020 – 3 The amendment was signed by only 1 of the 3 French pharmaceutical unions –
4 Whether new treatments are initiated in subsequent years or not
French retail pharmacies – 2019-2023 Perspectives
Sources: 11th amendment to the National Pharmaceutical Agreement (July 2017) – Official Gazette (September 2015, December 2017 and November 2018) – 11th Meeting of the USPO (January 2019) –Le Moniteur des pharmacies (December 2019) – Smart Pharma Consulting analyses
3. Regulatory environment
The revision of the smoothed digressive margin is part of a decorrelation process betweenthe economy of retail pharmacies and the price of reimbursed drugs
October 2021Smart Pharma 2016 – 2021 Publications
▪ The main priority of the 11th amendment3 to the National Pharmaceutical Agreement is to change the remuneration of retail pharmacies and make them less dependent on the price and volume of reimbursable drugs
▪ Thus, it proposes progressive transfer to new forms of remuneration related to dispensing and to the improvement of patients’ management
New dispensing fees 20191 20201
Fees for the delivery of a prescription € 0.50 € 0.50
Fees related to the age of the patient (youth children and elderly people)
€ 0.50 € 1.55
Fees for the delivery of specific drugs (e.g., immunosuppressive drugs)
€ 2.00 € 3.50
New missions Remuneration (2019)
Medication reports for elderly people taking more than 5 drugs
€ 60 for the initial interview and then € 304 or € 204
Belonging to a primary care team € 420 per year
Share medical file € 1 per open medical file
0,0%
10,0% 10,0%10,0%
25,5%
21,4%
13,0%
7,0%
8,5% 8,5%
6,0%5,5%
6,0% 6,0%
6,0% 5,0%
0,0% 0,0% 0,0% 0,0%
2017 2018 2019 2020
From € 0 to € 1.91 From € 1.92 to € 22.90
From € 22.91 to € 150.00 From € 150.01 to the capping amount²
Higher than the capping amount²
Evolution of the smoothed digressive margin on ex-factory price1
(2017-2020)
Retail pharmacists’ margins and fees for reimbursed drugs – Excluding rebates
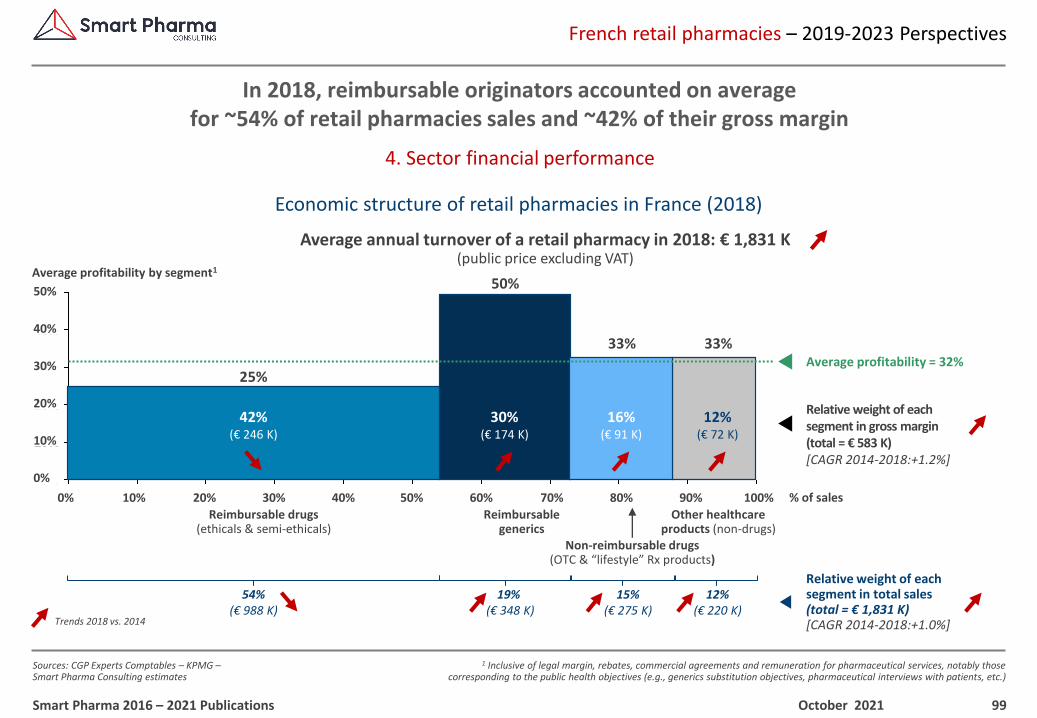
99
1 Inclusive of legal margin, rebates, commercial agreements and remuneration for pharmaceutical services, notably those corresponding to the public health objectives (e.g., generics substitution objectives, pharmaceutical interviews with patients, etc.)
French retail pharmacies – 2019-2023 Perspectives
Sources: CGP Experts Comptables – KPMG –Smart Pharma Consulting estimates
4. Sector financial performance
In 2018, reimbursable originators accounted on average for ~54% of retail pharmacies sales and ~42% of their gross margin
October 2021Smart Pharma 2016 – 2021 Publications
0%
10%
20%
30%
40%
50%
54%(€ 988 K)
Reimbursable drugs(ethicals & semi-ethicals)
Relative weight of eachsegment in total sales(total = € 1,831 K)[CAGR 2014-2018:+1.0%]
20% 50% % of sales10% 30% 40% 70% 90%80% 100%60%0%
42%(€ 246 K)
Relative weight of each segment in gross margin(total = € 583 K)[CAGR 2014-2018:+1.2%]
25%
Average profitability by segment1
15%(€ 275 K)
12%(€ 220 K)
Trends 2018 vs. 2014
19% (€ 348 K)
33%
12%(€ 72 K)
Other healthcare products (non-drugs)
Reimbursablegenerics
50%
30%(€ 174 K)
33%
16%(€ 91 K)
Non-reimbursable drugs(OTC & “lifestyle” Rx products)
Average annual turnover of a retail pharmacy in 2018: € 1,831 K(public price excluding VAT)
Average profitability = 32%
50%
40%
30%
20%
10%
0%
Economic structure of retail pharmacies in France (2018)
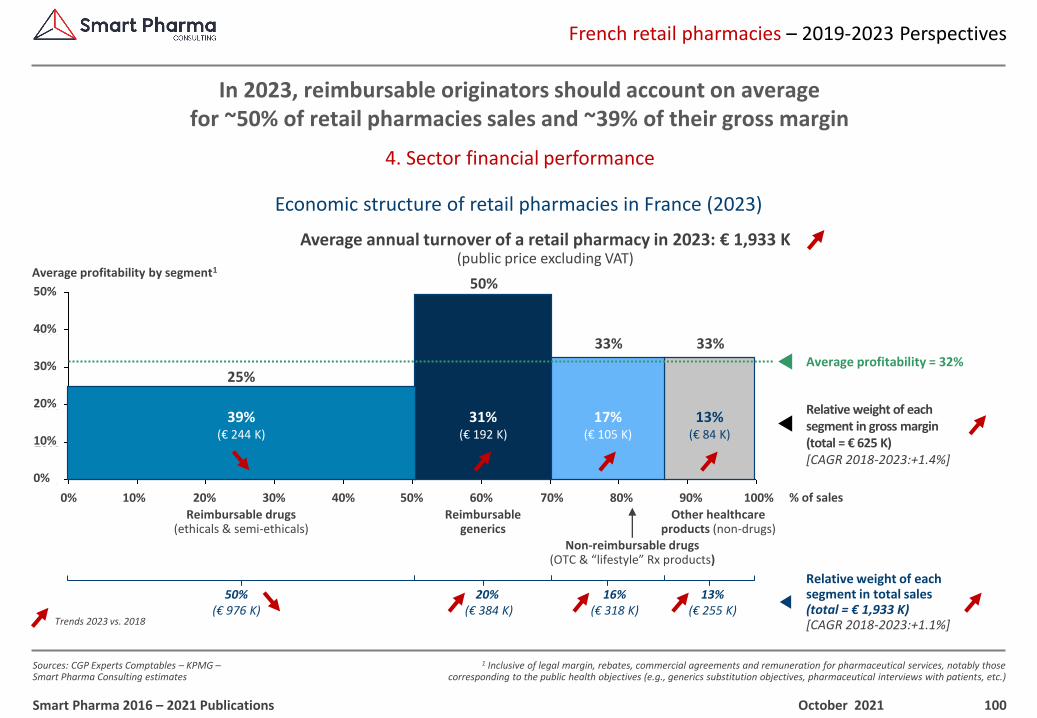
100
1 Inclusive of legal margin, rebates, commercial agreements and remuneration for pharmaceutical services, notably those corresponding to the public health objectives (e.g., generics substitution objectives, pharmaceutical interviews with patients, etc.)
French retail pharmacies – 2019-2023 Perspectives
Sources: CGP Experts Comptables – KPMG –Smart Pharma Consulting estimates
4. Sector financial performance
In 2023, reimbursable originators should account on average for ~50% of retail pharmacies sales and ~39% of their gross margin
October 2021Smart Pharma 2016 – 2021 Publications
0%
10%
20%
30%
40%
50%
50%(€ 976 K)
Reimbursable drugs(ethicals & semi-ethicals)
Relative weight of eachsegment in total sales(total = € 1,933 K)[CAGR 2018-2023:+1.1%]
20% 50% % of sales10% 30% 40% 70% 90%80% 100%60%0%
39%(€ 244 K)
Relative weight of each segment in gross margin(total = € 625 K)[CAGR 2018-2023:+1.4%]
25%
Average profitability by segment1
16%(€ 318 K)
13%(€ 255 K)
Trends 2023 vs. 2018
20% (€ 384 K)
33%
13%(€ 84 K)
Other healthcare products (non-drugs)
Reimbursablegenerics
50%
31%(€ 192 K)
33%
17%(€ 105 K)
Non-reimbursable drugs(OTC & “lifestyle” Rx products)
Average annual turnover of a retail pharmacy in 2023: € 1,933 K(public price excluding VAT)
Average profitability = 32%
50%
40%
30%
20%
10%
0%
Economic structure of retail pharmacies in France (2023)
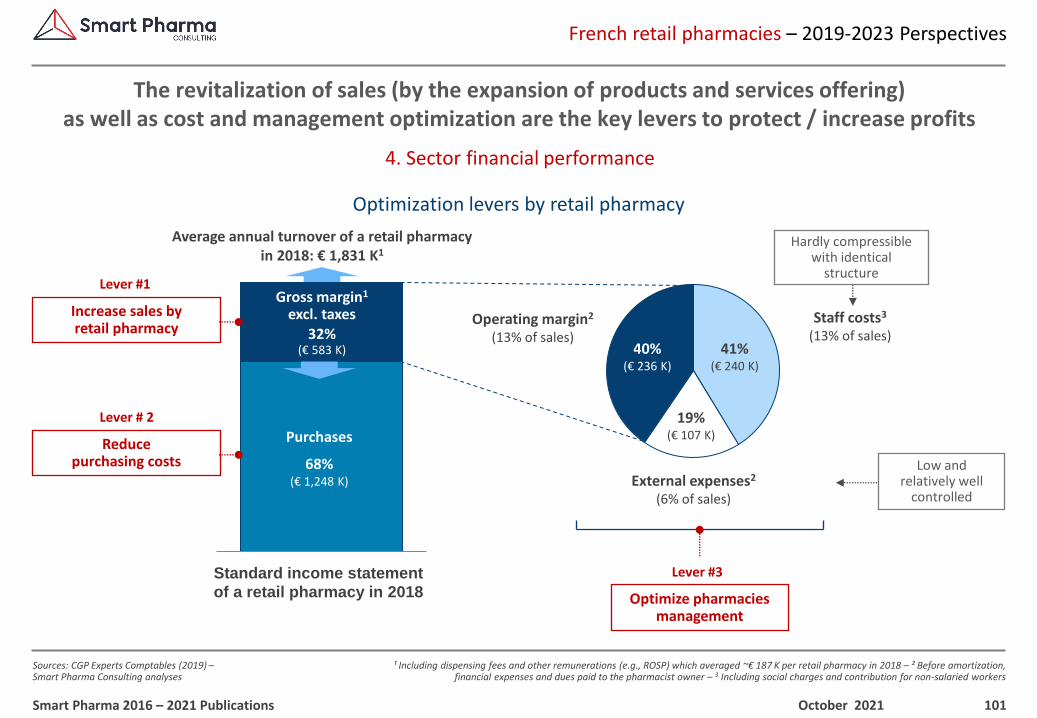
101
¹ Including dispensing fees and other remunerations (e.g., ROSP) which averaged ~€ 187 K per retail pharmacy in 2018 – ² Before amortization, financial expenses and dues paid to the pharmacist owner – 3 Including social charges and contribution for non-salaried workers
French retail pharmacies – 2019-2023 Perspectives
Sources: CGP Experts Comptables (2019) –Smart Pharma Consulting analyses
4. Sector financial performance
The revitalization of sales (by the expansion of products and services offering)as well as cost and management optimization are the key levers to protect / increase profits
October 2021Smart Pharma 2016 – 2021 Publications
Standard income statement
of a retail pharmacy in 2018
Gross margin1
excl. taxes32%
(€ 583 K)
Purchases
68%(€ 1,248 K)
Operating margin2
(13% of sales)40%
(€ 236 K)
41%(€ 240 K)
19%(€ 107 K)
Staff costs3
(13% of sales)
External expenses2
(6% of sales)
Low and relatively well
controlled
Increase sales by retail pharmacy
Lever #1
Reduce purchasing costs
Lever # 2
Optimize pharmacies management
Lever #3
Hardly compressible with identical
structure
Average annual turnover of a retail pharmacyin 2018: € 1,831 K1
Optimization levers by retail pharmacy
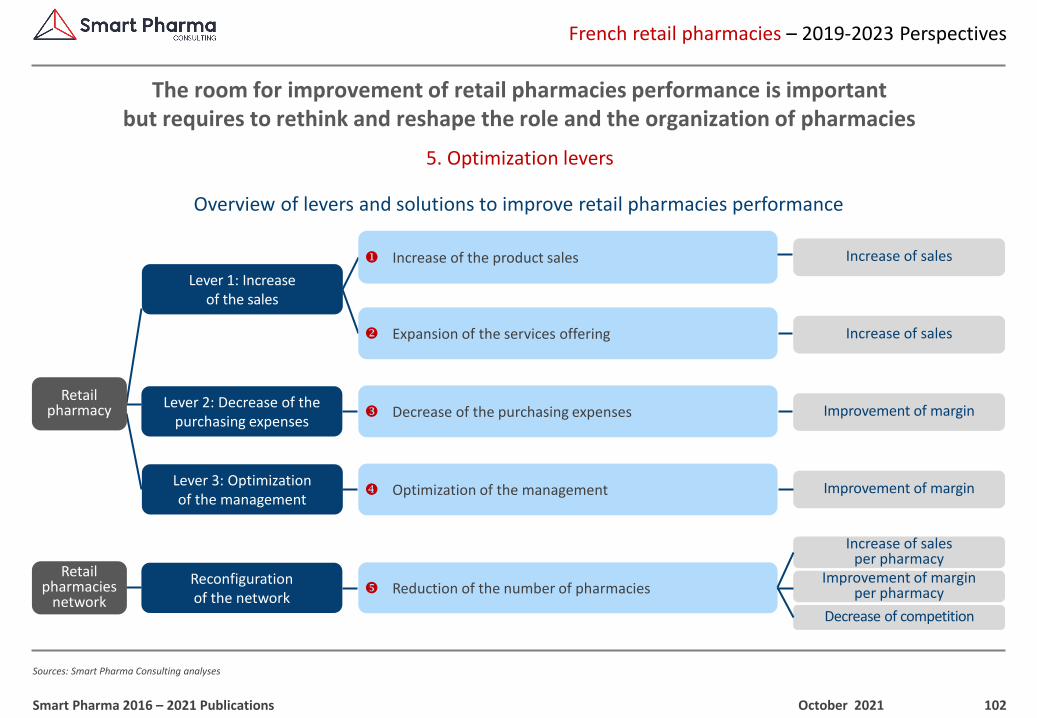
102
French retail pharmacies – 2019-2023 Perspectives
Sources: Smart Pharma Consulting analyses
5. Optimization levers
The room for improvement of retail pharmacies performance is importantbut requires to rethink and reshape the role and the organization of pharmacies
October 2021Smart Pharma 2016 – 2021 Publications
Lever 1: Increaseof the sales
Increase of sales Increase of the product sales
Expansion of the services offering Increase of sales
Retail pharmacy Lever 2: Decrease of the
purchasing expenses Decrease of the purchasing expenses Improvement of margin
Lever 3: Optimizationof the management
Optimization of the management Improvement of margin
Reconfiguration of the network
Retail pharmacies
network Reduction of the number of pharmacies
Decrease of competition
Improvement of marginper pharmacy
Increase of salesper pharmacy
Overview of levers and solutions to improve retail pharmacies performance
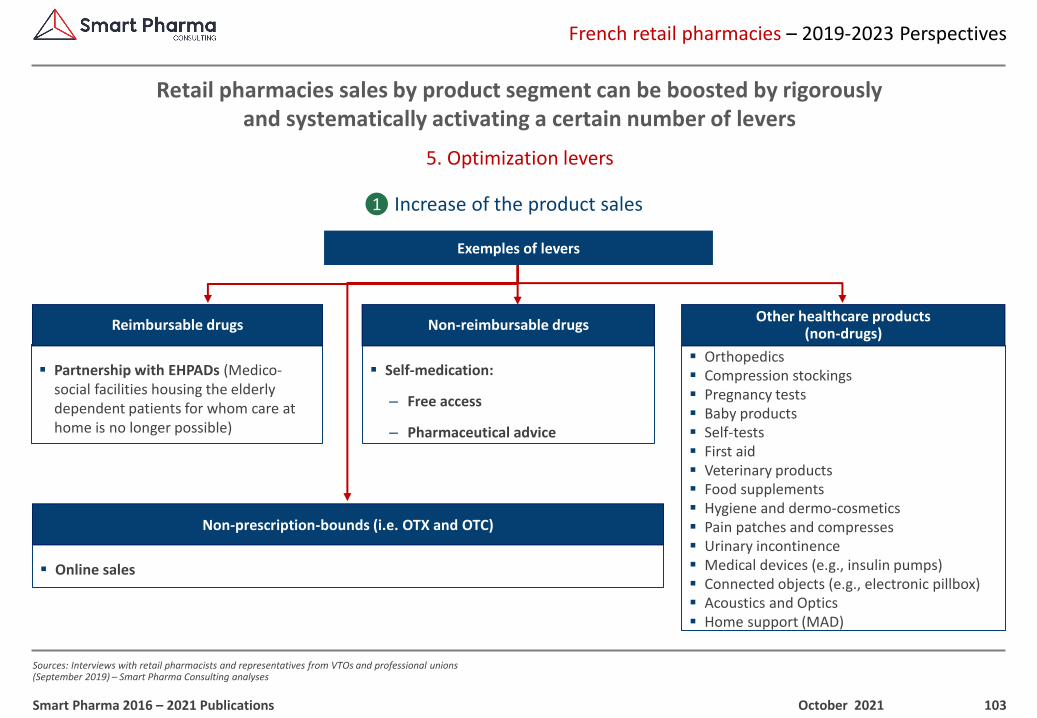
103
French retail pharmacies – 2019-2023 Perspectives
Sources: Interviews with retail pharmacists and representatives from VTOs and professional unions (September 2019) – Smart Pharma Consulting analyses
5. Optimization levers
Retail pharmacies sales by product segment can be boosted by rigorouslyand systematically activating a certain number of levers
October 2021Smart Pharma 2016 – 2021 Publications
▪ Partnership with EHPADs (Medico-social facilities housing the elderly dependent patients for whom care at home is no longer possible)
▪ Self-medication:
– Free access
– Pharmaceutical advice
▪ Orthopedics▪ Compression stockings▪ Pregnancy tests▪ Baby products▪ Self-tests▪ First aid▪ Veterinary products▪ Food supplements▪ Hygiene and dermo-cosmetics▪ Pain patches and compresses▪ Urinary incontinence▪ Medical devices (e.g., insulin pumps)▪ Connected objects (e.g., electronic pillbox)▪ Acoustics and Optics▪ Home support (MAD)
▪ Online sales
Exemples of levers
Reimbursable drugsOther healthcare products
(non-drugs)Non-reimbursable drugs
Non-prescription-bounds (i.e. OTX and OTC)
Increase of the product sales1
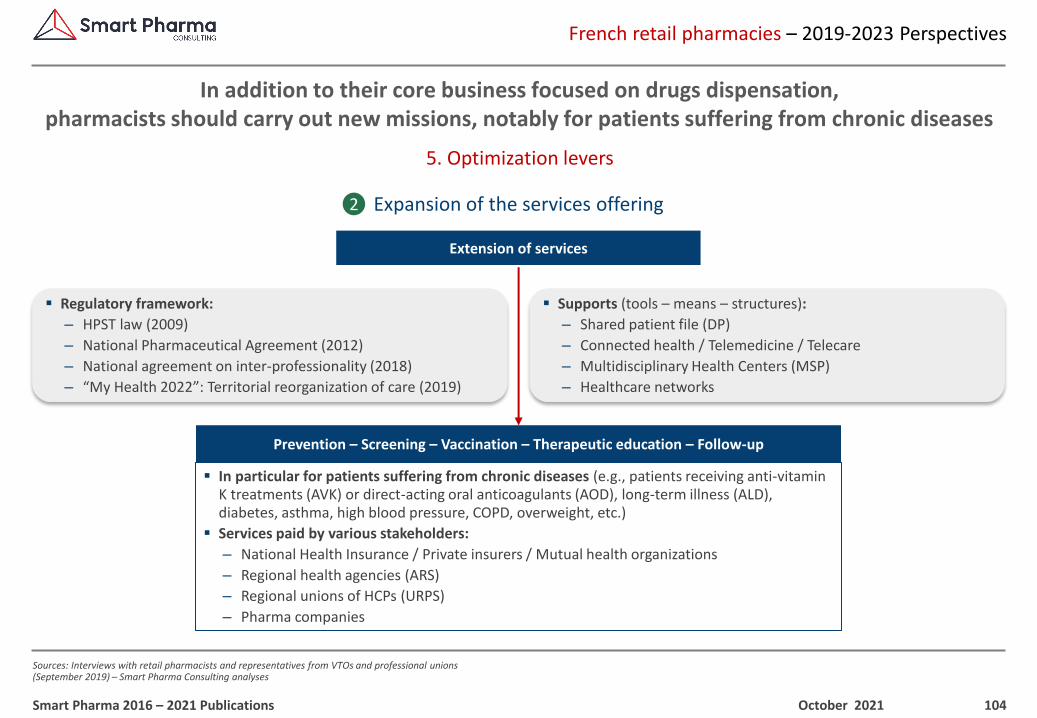
104
French retail pharmacies – 2019-2023 Perspectives
Sources: Interviews with retail pharmacists and representatives from VTOs and professional unions (September 2019) – Smart Pharma Consulting analyses
5. Optimization levers
In addition to their core business focused on drugs dispensation,pharmacists should carry out new missions, notably for patients suffering from chronic diseases
October 2021Smart Pharma 2016 – 2021 Publications
Extension of services
Prevention – Screening – Vaccination – Therapeutic education – Follow-up
▪ In particular for patients suffering from chronic diseases (e.g., patients receiving anti-vitamin K treatments (AVK) or direct-acting oral anticoagulants (AOD), long-term illness (ALD), diabetes, asthma, high blood pressure, COPD, overweight, etc.)
▪ Services paid by various stakeholders:
– National Health Insurance / Private insurers / Mutual health organizations
– Regional health agencies (ARS)
– Regional unions of HCPs (URPS)
– Pharma companies
▪ Regulatory framework:
– HPST law (2009)
– National Pharmaceutical Agreement (2012)
– National agreement on inter-professionality (2018)
– “My Health 2022”: Territorial reorganization of care (2019)
▪ Supports (tools – means – structures):
– Shared patient file (DP)
– Connected health / Telemedicine / Telecare
– Multidisciplinary Health Centers (MSP)
– Healthcare networks
Expansion of the services offering2
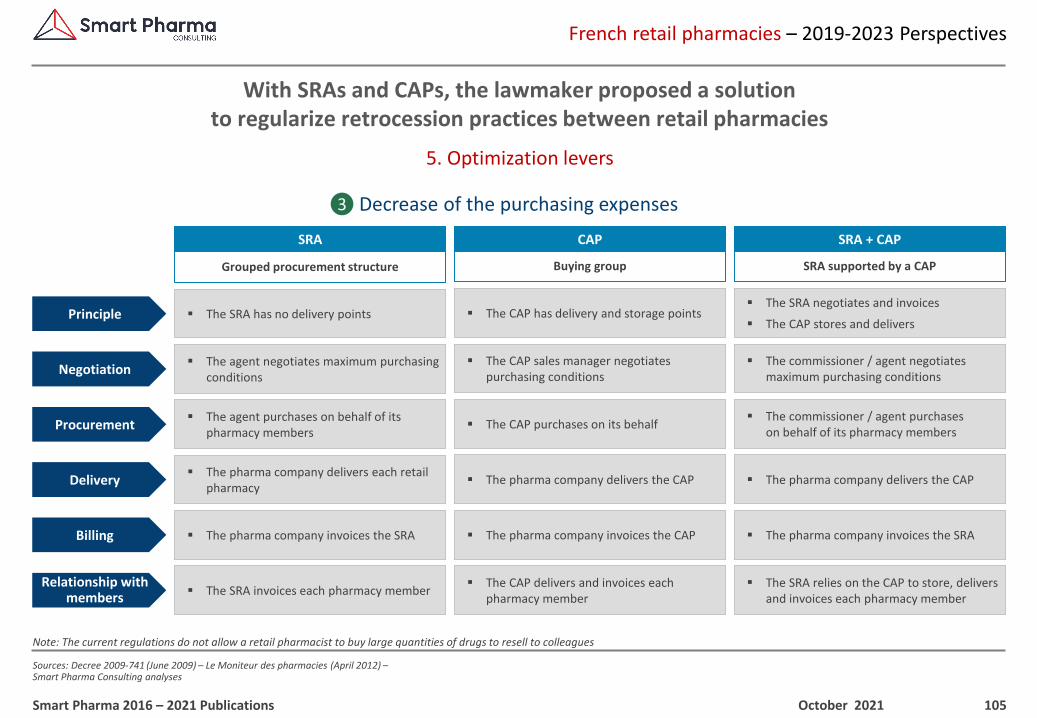
105
French retail pharmacies – 2019-2023 Perspectives
Sources: Decree 2009-741 (June 2009) – Le Moniteur des pharmacies (April 2012) –Smart Pharma Consulting analyses
5. Optimization levers
With SRAs and CAPs, the lawmaker proposed a solution to regularize retrocession practices between retail pharmacies
October 2021Smart Pharma 2016 – 2021 Publications
Decrease of the purchasing expenses
Negotiation
Procurement
Delivery
Billing
Relationship with members
Principle
SRA
Grouped procurement structure
▪ The agent negotiates maximum purchasing conditions
▪ The agent purchases on behalf of its pharmacy members
▪ The pharma company delivers each retail pharmacy
▪ The pharma company invoices the SRA
▪ The SRA invoices each pharmacy member
▪ The SRA has no delivery points
▪ The CAP delivers and invoices each pharmacy member
CAP
Buying group
▪ The CAP sales manager negotiates purchasing conditions
▪ The CAP purchases on its behalf
▪ The pharma company delivers the CAP
▪ The pharma company invoices the CAP
▪ The CAP has delivery and storage points
SRA + CAP
SRA supported by a CAP
▪ The commissioner / agent negotiates maximum purchasing conditions
▪ The commissioner / agent purchases on behalf of its pharmacy members
▪ The pharma company delivers the CAP
▪ The pharma company invoices the SRA
▪ The SRA relies on the CAP to store, deliversand invoices each pharmacy member
▪ The SRA negotiates and invoices
▪ The CAP stores and delivers
Note: The current regulations do not allow a retail pharmacist to buy large quantities of drugs to resell to colleagues
3
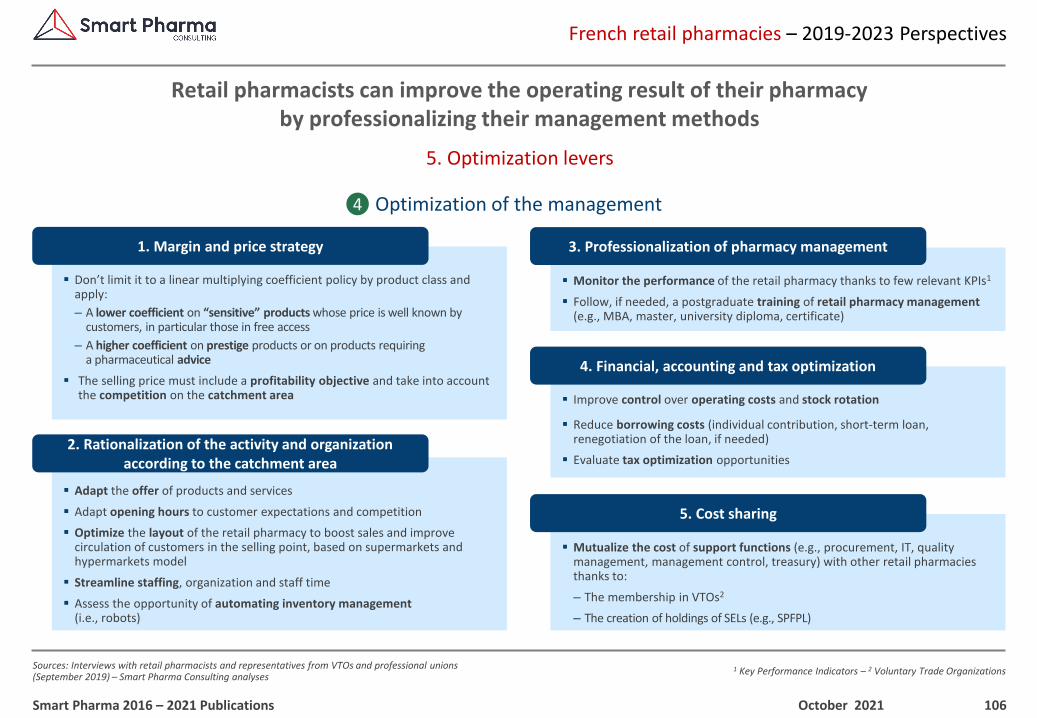
106
1 Key Performance Indicators – 2 Voluntary Trade Organizations
French retail pharmacies – 2019-2023 Perspectives
Sources: Interviews with retail pharmacists and representatives from VTOs and professional unions (September 2019) – Smart Pharma Consulting analyses
5. Optimization levers
Retail pharmacists can improve the operating result of their pharmacyby professionalizing their management methods
October 2021Smart Pharma 2016 – 2021 Publications
▪ Monitor the performance of the retail pharmacy thanks to few relevant KPIs1
▪ Follow, if needed, a postgraduate training of retail pharmacy management (e.g., MBA, master, university diploma, certificate)
3. Professionalization of pharmacy management
▪ Don’t limit it to a linear multiplying coefficient policy by product class and apply:
– A lower coefficient on “sensitive” products whose price is well known by customers, in particular those in free access
– A higher coefficient on prestige products or on products requiring a pharmaceutical advice
▪ The selling price must include a profitability objective and take into account the competition on the catchment area
1. Margin and price strategy
▪ Improve control over operating costs and stock rotation
▪ Reduce borrowing costs (individual contribution, short-term loan, renegotiation of the loan, if needed)
▪ Evaluate tax optimization opportunities
4. Financial, accounting and tax optimization
▪ Adapt the offer of products and services
▪ Adapt opening hours to customer expectations and competition
▪ Optimize the layout of the retail pharmacy to boost sales and improve circulation of customers in the selling point, based on supermarkets and hypermarkets model
▪ Streamline staffing, organization and staff time
▪ Assess the opportunity of automating inventory management (i.e., robots)
2. Rationalization of the activity and organization according to the catchment area
▪ Mutualize the cost of support functions (e.g., procurement, IT, quality management, management control, treasury) with other retail pharmacies thanks to:
– The membership in VTOs2
– The creation of holdings of SELs (e.g., SPFPL)
5. Cost sharing
Optimization of the management4
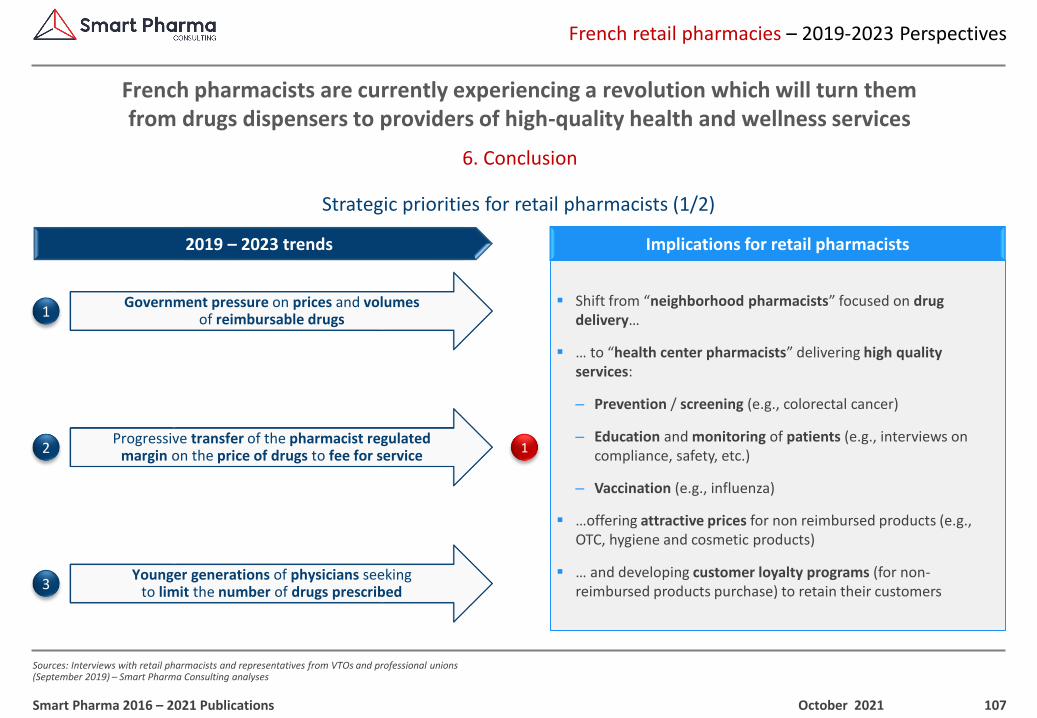
107
French retail pharmacies – 2019-2023 Perspectives
Sources: Interviews with retail pharmacists and representatives from VTOs and professional unions (September 2019) – Smart Pharma Consulting analyses
6. Conclusion
French pharmacists are currently experiencing a revolution which will turn themfrom drugs dispensers to providers of high-quality health and wellness services
October 2021Smart Pharma 2016 – 2021 Publications
▪ Shift from “neighborhood pharmacists” focused on drug delivery…
▪ … to “health center pharmacists” delivering high quality services:
– Prevention / screening (e.g., colorectal cancer)
– Education and monitoring of patients (e.g., interviews on compliance, safety, etc.)
– Vaccination (e.g., influenza)
▪ …offering attractive prices for non reimbursed products (e.g., OTC, hygiene and cosmetic products)
▪ … and developing customer loyalty programs (for non-reimbursed products purchase) to retain their customers
1
Implications for retail pharmacists2019 – 2023 trends
1Government pressure on prices and volumes
of reimbursable drugs
2Progressive transfer of the pharmacist regulated
margin on the price of drugs to fee for service
3Younger generations of physicians seeking
to limit the number of drugs prescribed
Strategic priorities for retail pharmacists (1/2)
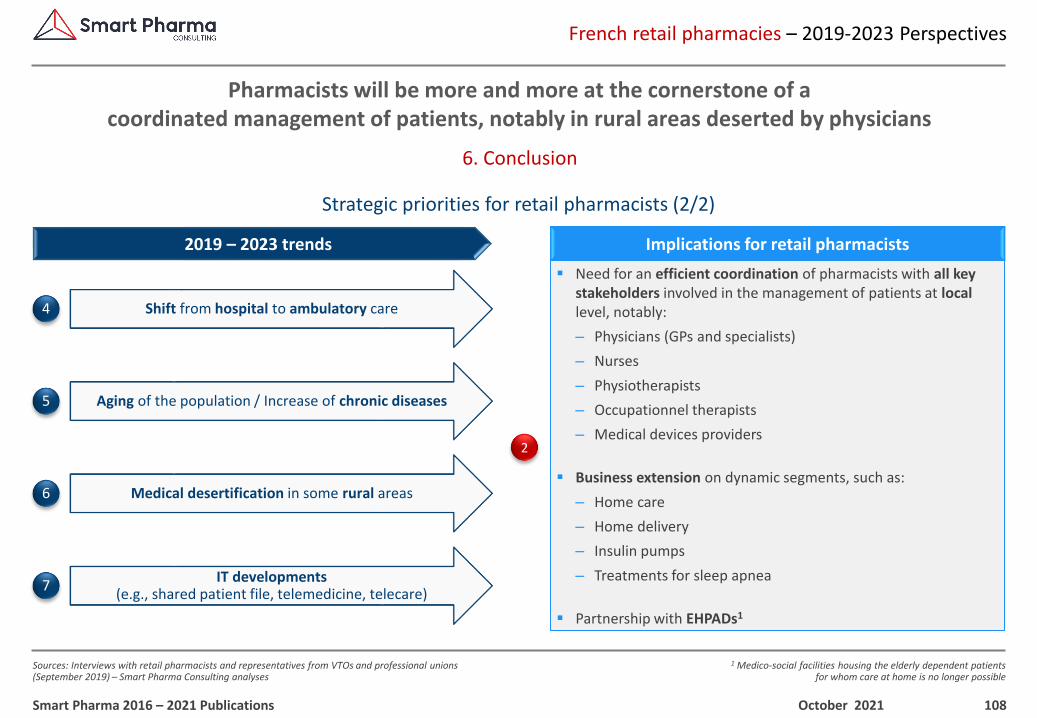
108
1 Medico-social facilities housing the elderly dependent patientsfor whom care at home is no longer possible
French retail pharmacies – 2019-2023 Perspectives
Sources: Interviews with retail pharmacists and representatives from VTOs and professional unions (September 2019) – Smart Pharma Consulting analyses
6. Conclusion
Pharmacists will be more and more at the cornerstone of a coordinated management of patients, notably in rural areas deserted by physicians
October 2021Smart Pharma 2016 – 2021 Publications
▪ Need for an efficient coordination of pharmacists with all key stakeholders involved in the management of patients at locallevel, notably:
– Physicians (GPs and specialists)
– Nurses
– Physiotherapists
– Occupationnel therapists
– Medical devices providers
▪ Business extension on dynamic segments, such as:
– Home care
– Home delivery
– Insulin pumps
– Treatments for sleep apnea
▪ Partnership with EHPADs1
2
Implications for retail pharmacists2019 – 2023 trends
4 Shift from hospital to ambulatory care
5 Aging of the population / Increase of chronic diseases
7IT developments
(e.g., shared patient file, telemedicine, telecare)
6 Medical desertification in some rural areas
Strategic priorities for retail pharmacists (2/2)

1, rue Houdart de Lamotte – 75015 Paris – FranceTel. +33 6 11 96 33 78
Email : [email protected] – Website : www.smart-pharma.com
FrenchBiosimilars Market
POSITION PAPER
Key Success Factors
MARKET INSIGHTS
June 2019
Serving & Sharing with Passion
110
Succeeding on the French Biosimilars Market
Sources: Smart Pharma Consulting
Context & objectives
This position paper provides key information and analyses to evaluate the French biosimilars market dynamics and the key success factors for pharma companies
October 2021Smart Pharma 2016 – 2021 Publications
Masterclass
▪ Sandoz, Teva or Hospira (Pfizer), which have pioneered the biosimilars market in France, have placed great hopes in its development
▪ However, 12 years down the road, the achievement of these precursors and of the followers can be regarded as somewhat below expectations
▪ Smart Pharma Consulting, which has developed a robust experience at analyzing and advising pharma companies on the biosimilars market, proposes to:
1. Analyze the biosimilars market structure and dynamics
2. Review the French regulatory environment
3. Share insights regarding customers behaviors
4. Evaluate the competitive landscape and the key success factors
5. Estimate 2018 – 2023 market growth
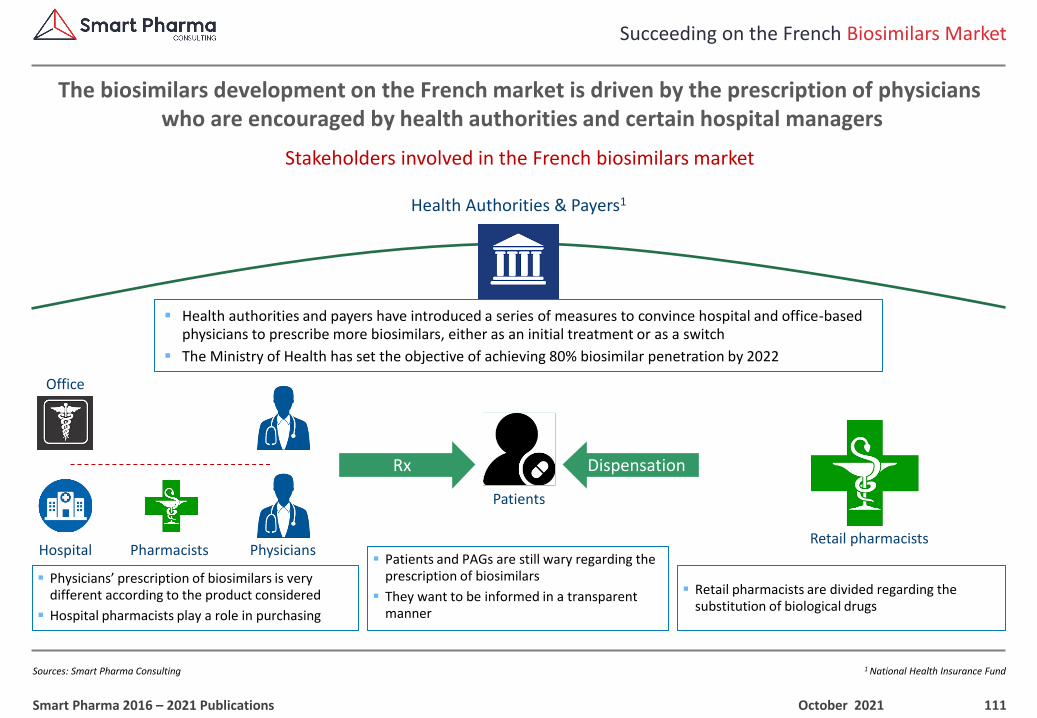
111
1 National Health Insurance Fund
Succeeding on the French Biosimilars Market
Sources: Smart Pharma Consulting
Stakeholders involved in the French biosimilars market
The biosimilars development on the French market is driven by the prescription of physicianswho are encouraged by health authorities and certain hospital managers
October 2021Smart Pharma 2016 – 2021 Publications
Rx Dispensation
Physicians
Patients
Retail pharmacists
Health Authorities & Payers1
Hospital
Office
▪ Patients and PAGs are still wary regarding the prescription of biosimilars
▪ They want to be informed in a transparent manner
▪ Health authorities and payers have introduced a series of measures to convince hospital and office-based physicians to prescribe more biosimilars, either as an initial treatment or as a switch
▪ The Ministry of Health has set the objective of achieving 80% biosimilar penetration by 2022
▪ Retail pharmacists are divided regarding the substitution of biological drugs
▪ Physicians’ prescription of biosimilars is very different according to the product considered
▪ Hospital pharmacists play a role in purchasing
Pharmacists
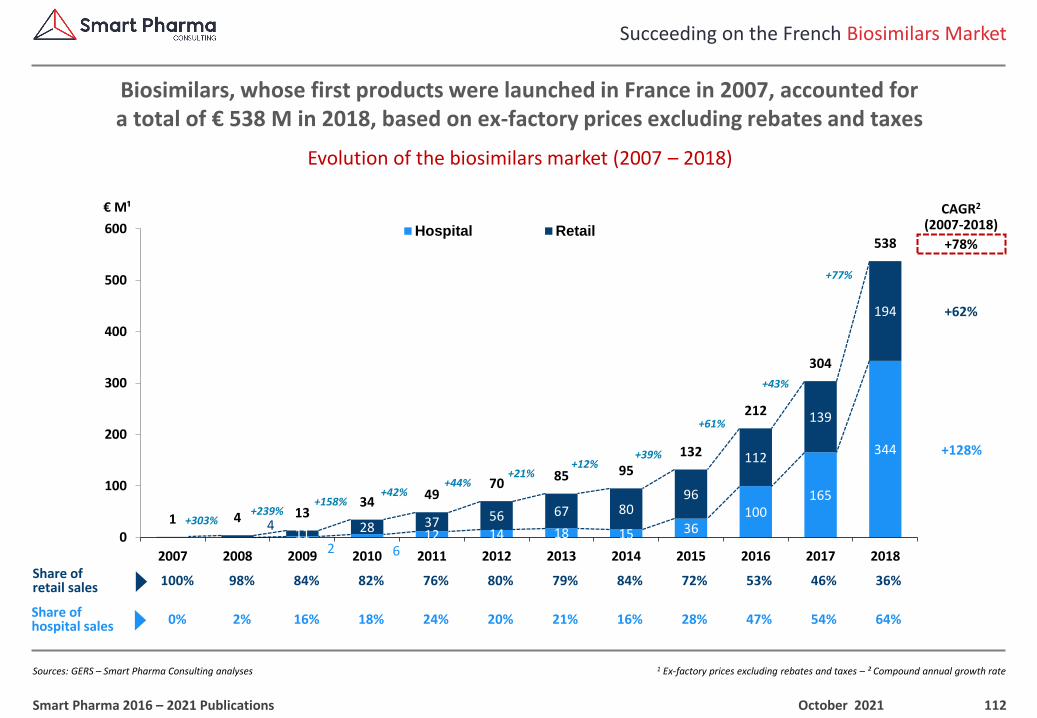
112
1 Ex-factory prices excluding rebates and taxes – ² Compound annual growth rate
Succeeding on the French Biosimilars Market
Sources: GERS – Smart Pharma Consulting analyses
Evolution of the biosimilars market (2007 – 2018)
Biosimilars, whose first products were launched in France in 2007, accounted fora total of € 538 M in 2018, based on ex-factory prices excluding rebates and taxes
October 2021Smart Pharma 2016 – 2021 Publications
2 612 14 18 15 36
100165
344
411 28 37 56 67 80
96
112
139
194
1 4 1334
4970
85 95
132
212
304
538
0
100
200
300
400
500
600
2007 2008 2009 2010 2011 2012 2013 2014 2015 2016 2017 2018
Hospital Retail
€ M¹
+303%
CAGR2
(2007-2018)
+62%
+128%
+78%
Share ofretail sales
Share ofhospital sales
+239%+158%
+42%+44%
+21%+12%
+39%
+61%
+43%
+77%
100% 98% 84% 82% 76% 80% 79% 84% 72% 53% 46% 36%
0% 2% 16% 18% 24% 20% 21% 16% 28% 47% 54% 64%
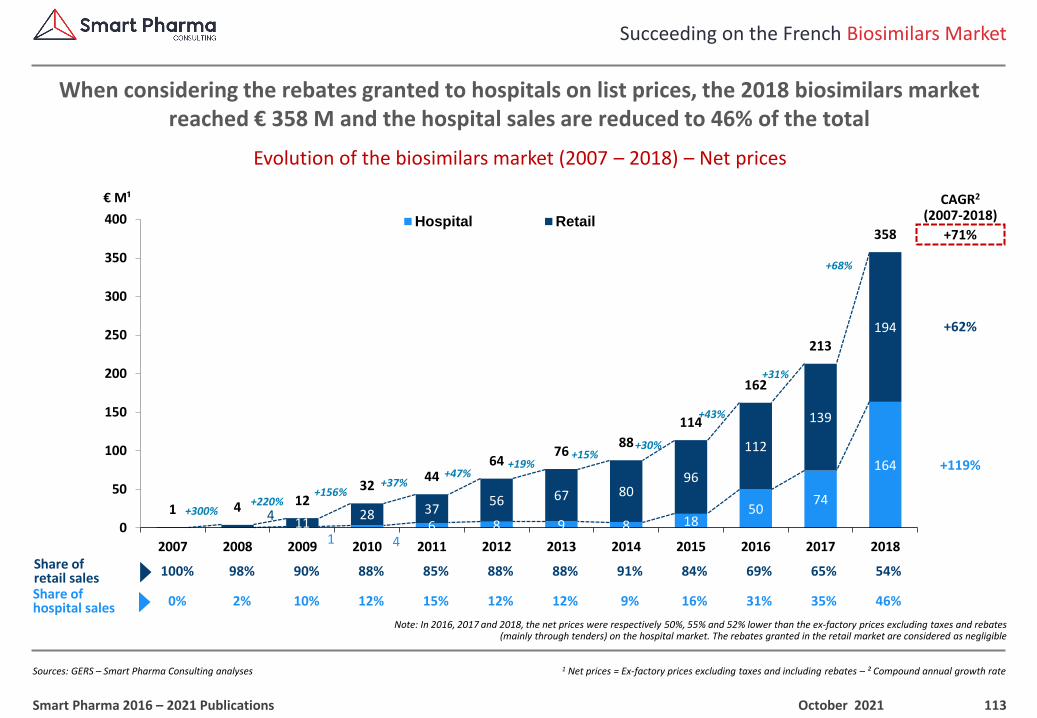
113
1 Net prices = Ex-factory prices excluding taxes and including rebates – ² Compound annual growth rate
Succeeding on the French Biosimilars Market
Sources: GERS – Smart Pharma Consulting analyses
Evolution of the biosimilars market (2007 – 2018) – Net prices
When considering the rebates granted to hospitals on list prices, the 2018 biosimilars market reached € 358 M and the hospital sales are reduced to 46% of the total
October 2021Smart Pharma 2016 – 2021 Publications
1 46 8 9 8 18
5074
164
411
28 3756 67 80
96
112
139
194
1 4 1232
4464
7688
114
162
213
358
0
50
100
150
200
250
300
350
400
2007 2008 2009 2010 2011 2012 2013 2014 2015 2016 2017 2018
Hospital Retail
€ M¹
+300%
CAGR2
(2007-2018)
+62%
+119%
+71%
Share ofretail salesShare ofhospital sales
+220%+156%
+37%+47%
+19%+15%
+30%
+43%
+31%
+68%
100% 98% 90% 88% 85% 88% 88% 91% 84% 69% 65% 54%
0% 2% 10% 12% 15% 12% 12% 9% 16% 31% 35% 46%
Note: In 2016, 2017 and 2018, the net prices were respectively 50%, 55% and 52% lower than the ex-factory prices excluding taxes and rebates (mainly through tenders) on the hospital market. The rebates granted in the retail market are considered as negligible
114
1 Ex-factory prices excluding rebates and taxes – ² Compound annual growth rate – 3 Enoxaparin sodium – 4 Follitropin alfa – 5 Insulin glargine –6 Somatropin – 7 Epoetin – 8 Filgrastim and pegfilgrastim – 9 Rituximab and trastuzumab – 10 Adalimumab, etanercept and infliximab
Succeeding on the French Biosimilars Market
Sources: GERS – Smart Pharma Consulting analyses
Distribution of the biosimilars market by therapeutic class (2013 – 2018)
In terms of therapeutic classes, anti-TNFs dominate the French biosimilars market, followed by monoclonal antibody antineoplastics and colony-stimulating factors
October 2021Smart Pharma 2016 – 2021 Publications
€ M1
Anti-TNFs10
Monoclonal antibody antineoplastics9
Colony-stimulating factors8
Erythropoiesis-stimulating agents7
Market share2013 2018
0.0% 36.8%
0.0% 25.5%
50.0% 15.0%
32.4% 11.3%
CAGR2
2013-20182017-2018
growth
+44.5%
N/A
+76.9%
+43.3%
N/A N/A
+13.7% +21.5%
+17.1% +29.0%
16
76
138
198
11
137
43 5161
67
67
81
28 27
33
39
47
61
15 18
21
23
25
25
1
7
18
2
6
9
13 4
85 95
132
212
304
538
0
100
200
300
400
500
600
2013 2014 2015 2016 2017 2018
Total market
Growth hormones6 17.6% 4.7%+11.2% +1.9%Human insulins5 0.0% 3.3%N/A +161.9%Gonadotrophins4 0.0% 2.5%N/A +39.6%Fractionated heparins3 0.0% 0.8%N/A N/A
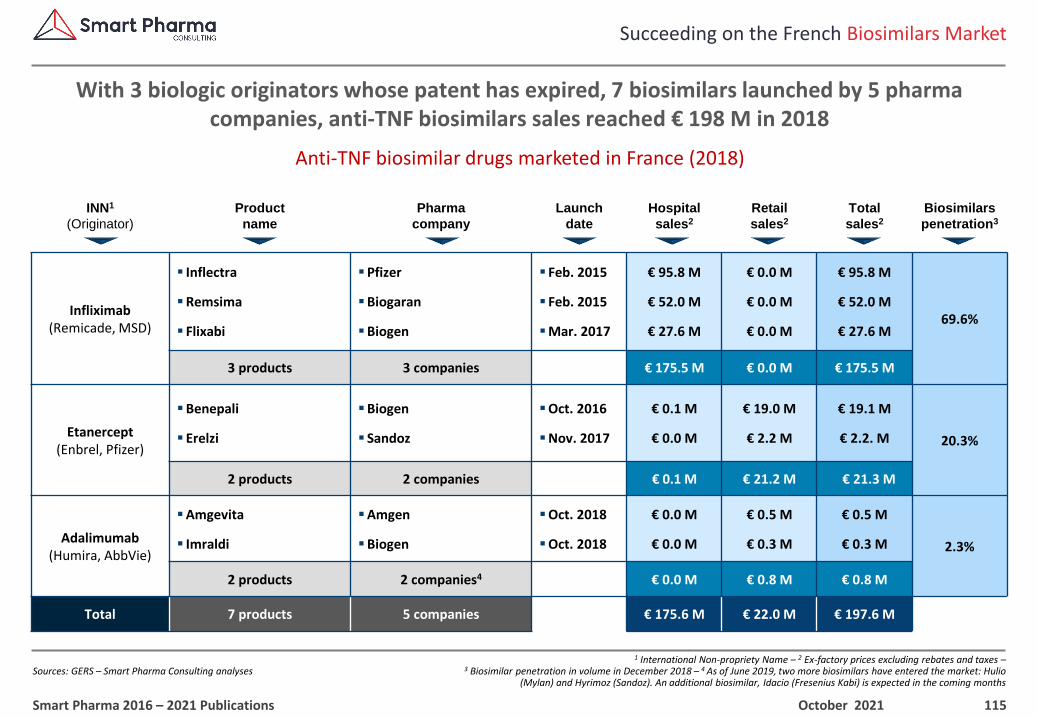
115
1 International Non-propriety Name – 2 Ex-factory prices excluding rebates and taxes –3 Biosimilar penetration in volume in December 2018 – 4 As of June 2019, two more biosimilars have entered the market: Hulio
(Mylan) and Hyrimoz (Sandoz). An additional biosimilar, Idacio (Fresenius Kabi) is expected in the coming months
Succeeding on the French Biosimilars Market
Sources: GERS – Smart Pharma Consulting analyses
Anti-TNF biosimilar drugs marketed in France (2018)
With 3 biologic originators whose patent has expired, 7 biosimilars launched by 5 pharma companies, anti-TNF biosimilars sales reached € 198 M in 2018
October 2021Smart Pharma 2016 – 2021 Publications
INN1
(Originator)
Product
name
Pharma
company
Launch
date
Hospital
sales2
Retail
sales2
Total
sales2
Biosimilars
penetration3
Infliximab(Remicade, MSD)
▪ Inflectra
▪Remsima
▪ Flixabi
▪Pfizer
▪Biogaran
▪Biogen
▪ Feb. 2015
▪ Feb. 2015
▪Mar. 2017
€ 95.8 M
€ 52.0 M
€ 27.6 M
€ 0.0 M
€ 0.0 M
€ 0.0 M
€ 95.8 M
€ 52.0 M
€ 27.6 M69.6%
3 products 3 companies € 175.5 M € 0.0 M € 175.5 M
Etanercept(Enbrel, Pfizer)
▪Benepali
▪ Erelzi
▪Biogen
▪ Sandoz
▪Oct. 2016
▪Nov. 2017
€ 0.1 M
€ 0.0 M
€ 19.0 M
€ 2.2 M
€ 19.1 M
€ 2.2. M 20.3%
2 products 2 companies € 0.1 M € 21.2 M € 21.3 M
Adalimumab(Humira, AbbVie)
▪Amgevita
▪ Imraldi
▪Amgen
▪Biogen
▪Oct. 2018
▪Oct. 2018
€ 0.0 M
€ 0.0 M
€ 0.5 M
€ 0.3 M
€ 0.5 M
€ 0.3 M 2.3%
2 products 2 companies4 € 0.0 M € 0.8 M € 0.8 M
Total 7 products 5 companies € 175.6 M € 22.0 M € 197.6 M

116
1 International Non-propriety Name – 2 Ex-factory prices excluding rebates and taxes –3 Biosimilar penetration in volume in December 2018
Succeeding on the French Biosimilars Market
Sources: GERS – Smart Pharma Consulting analyses
Monoclonal antibody antineoplastics biosimilar drugs marketed in France (2018)
With 2 biologic drugs from Roche whose patent has expired, 5 biosimilars launched by 4 companies, rituximab & trastuzumab biosimilars sales reached € 137 M in 2018
October 2021Smart Pharma 2016 – 2021 Publications
INN1
(Originator)
Product
name
Pharma
company
Launch
date
Hospital
sales2
Retail
sales2
Total
sales2
Biosimilars
penetration3
Rituximab(MabThera, Roche)
▪ Truxima
▪Rixathon
▪Biogaran
▪ Sandoz
▪ Sep. 2017
▪ Jan. 2018
€ 104.8 M
€ 18.1 M
€ 0.0 M
€ 0.0 M
€ 104.8 M
€ 18.1 M 82.2%
2 products 2 companies € 122.8 M € 0.0. M € 122.8 M
Trastuzumab(Herceptin, Roche)
▪Herzuma
▪Ontruzant
▪Kanjinti
▪Biogaran
▪MSD
▪Amgen
▪ Jul. 2018
▪ Sep. 2018
▪Aug. 2018
€ 10.7 M
€ 2.4 M
€ 1.4 M
€ 0.0 M
€ 0.0 M
€ 0.0 M
€ 10.7 M
€ 2.4 M
€ 1.4 M62.3%
3 products 3 companies € 14.5 M € 0.0 M € 14.5 M
Total 5 products 4 companies € 137.3 M € 0.0 M € 137.3 M
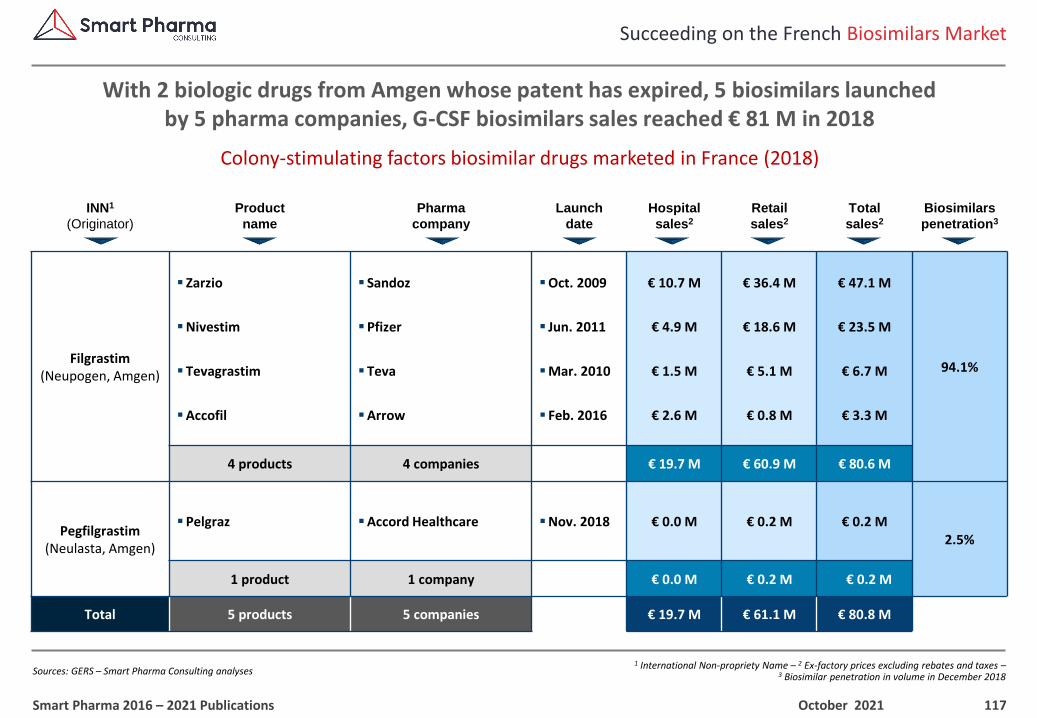
117
1 International Non-propriety Name – 2 Ex-factory prices excluding rebates and taxes –3 Biosimilar penetration in volume in December 2018
Succeeding on the French Biosimilars Market
Sources: GERS – Smart Pharma Consulting analyses
Colony-stimulating factors biosimilar drugs marketed in France (2018)
With 2 biologic drugs from Amgen whose patent has expired, 5 biosimilars launchedby 5 pharma companies, G-CSF biosimilars sales reached € 81 M in 2018
October 2021Smart Pharma 2016 – 2021 Publications
INN1
(Originator)
Product
name
Pharma
company
Launch
date
Hospital
sales2
Retail
sales2
Total
sales2
Biosimilars
penetration3
Filgrastim(Neupogen, Amgen)
▪ Zarzio
▪Nivestim
▪ Tevagrastim
▪Accofil
▪ Sandoz
▪Pfizer
▪ Teva
▪Arrow
▪Oct. 2009
▪ Jun. 2011
▪Mar. 2010
▪ Feb. 2016
€ 10.7 M
€ 4.9 M
€ 1.5 M
€ 2.6 M
€ 36.4 M
€ 18.6 M
€ 5.1 M
€ 0.8 M
€ 47.1 M
€ 23.5 M
€ 6.7 M
€ 3.3 M
94.1%
4 products 4 companies € 19.7 M € 60.9 M € 80.6 M
Pegfilgrastim(Neulasta, Amgen)
▪Pelgraz ▪Accord Healthcare ▪Nov. 2018 € 0.0 M € 0.2 M € 0.2 M2.5%
1 product 1 company € 0.0 M € 0.2 M € 0.2 M
Total 5 products 5 companies € 19.7 M € 61.1 M € 80.8 M
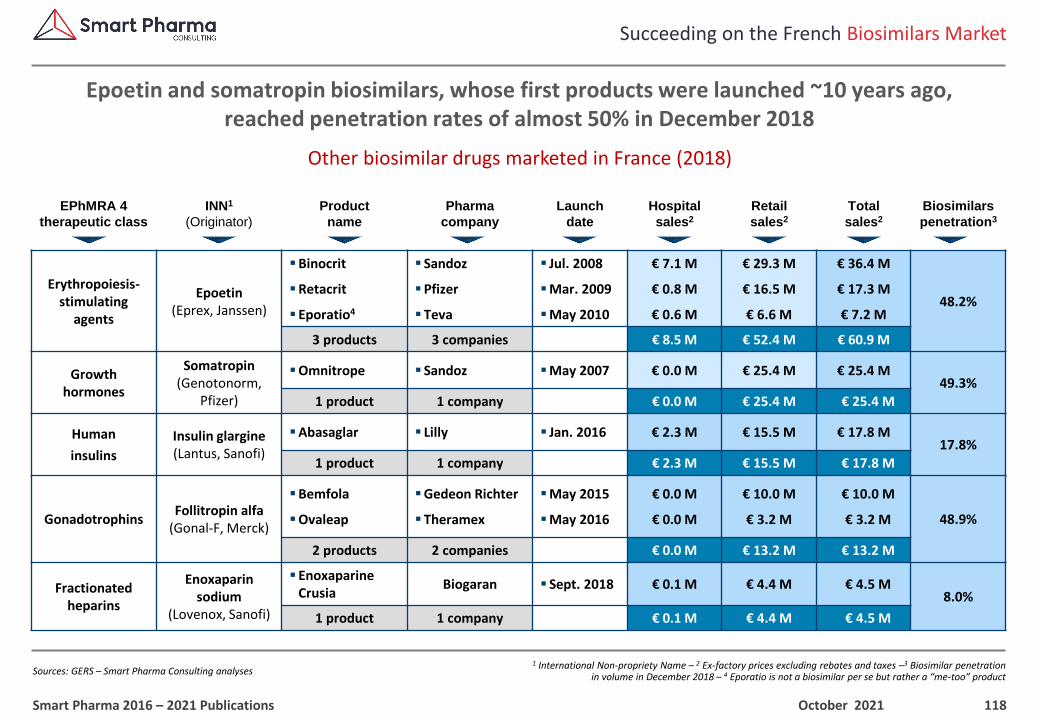
118
1 International Non-propriety Name – 2 Ex-factory prices excluding rebates and taxes –3 Biosimilar penetrationin volume in December 2018 – 4 Eporatio is not a biosimilar per se but rather a “me-too” product
Succeeding on the French Biosimilars Market
Sources: GERS – Smart Pharma Consulting analyses
Other biosimilar drugs marketed in France (2018)
Epoetin and somatropin biosimilars, whose first products were launched ~10 years ago, reached penetration rates of almost 50% in December 2018
October 2021Smart Pharma 2016 – 2021 Publications
EPhMRA 4
therapeutic class
INN1
(Originator)
Product
name
Pharma
company
Launch
date
Hospital
sales2
Retail
sales2
Total
sales2
Biosimilars
penetration3
Erythropoiesis-stimulating
agents
Epoetin(Eprex, Janssen)
▪Binocrit
▪Retacrit
▪ Eporatio4
▪ Sandoz
▪Pfizer
▪ Teva
▪ Jul. 2008
▪Mar. 2009
▪May 2010
€ 7.1 M
€ 0.8 M
€ 0.6 M
€ 29.3 M
€ 16.5 M
€ 6.6 M
€ 36.4 M
€ 17.3 M
€ 7.2 M48.2%
3 products 3 companies € 8.5 M € 52.4 M € 60.9 M
Growth hormones
Somatropin(Genotonorm,
Pfizer)
▪Omnitrope ▪ Sandoz ▪May 2007 € 0.0 M € 25.4 M € 25.4 M49.3%
1 product 1 company € 0.0 M € 25.4 M € 25.4 M
Human
insulins
Insulin glargine(Lantus, Sanofi)
▪Abasaglar ▪ Lilly ▪ Jan. 2016 € 2.3 M € 15.5 M € 17.8 M17.8%
1 product 1 company € 2.3 M € 15.5 M € 17.8 M
GonadotrophinsFollitropin alfa
(Gonal-F, Merck)
▪Bemfola
▪Ovaleap
▪Gedeon Richter
▪ Theramex
▪May 2015
▪May 2016
€ 0.0 M
€ 0.0 M
€ 10.0 M
€ 3.2 M
€ 10.0 M
€ 3.2 M 48.9%
2 products 2 companies € 0.0 M € 13.2 M € 13.2 M
Fractionated heparins
Enoxaparin sodium
(Lovenox, Sanofi)
▪ Enoxaparine Crusia
Biogaran ▪ Sept. 2018 € 0.1 M € 4.4 M € 4.5 M8.0%
1 product 1 company € 0.1 M € 4.4 M € 4.5 M
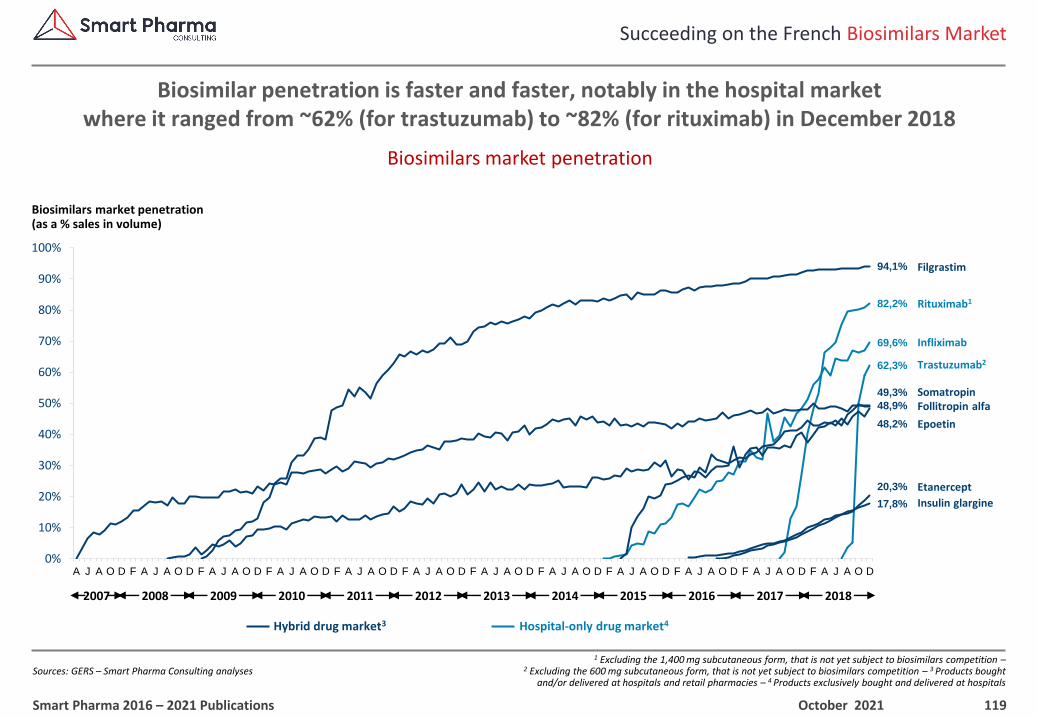
119
1 Excluding the 1,400 mg subcutaneous form, that is not yet subject to biosimilars competition –2 Excluding the 600 mg subcutaneous form, that is not yet subject to biosimilars competition – 3 Products bought
and/or delivered at hospitals and retail pharmacies – 4 Products exclusively bought and delivered at hospitals
Succeeding on the French Biosimilars Market
Sources: GERS – Smart Pharma Consulting analyses
Biosimilars market penetration
Biosimilar penetration is faster and faster, notably in the hospital marketwhere it ranged from ~62% (for trastuzumab) to ~82% (for rituximab) in December 2018
October 2021Smart Pharma 2016 – 2021 Publications
Biosimilars market penetration (as a % sales in volume)
Filgrastim
Infliximab
Etanercept
Rituximab1
Hybrid drug market3 Hospital-only drug market4
Trastuzumab2
Epoetin
94,1%
82,2%
69,6%
62,3%
48,2%
49,3%
17,8%
48,9%
20,3%
0%
10%
20%
30%
40%
50%
60%
70%
80%
90%
100%
A J A O D F A J A O D F A J A O D F A J A O D F A J A O D F A J A O D F A J A O D F A J A O D F A J A O D F A J A O D F A J A O D F A J A O D
2016201520142013201220112010 2017 20182008 20092007
Somatropin
Insulin glargine
Follitropin alfa
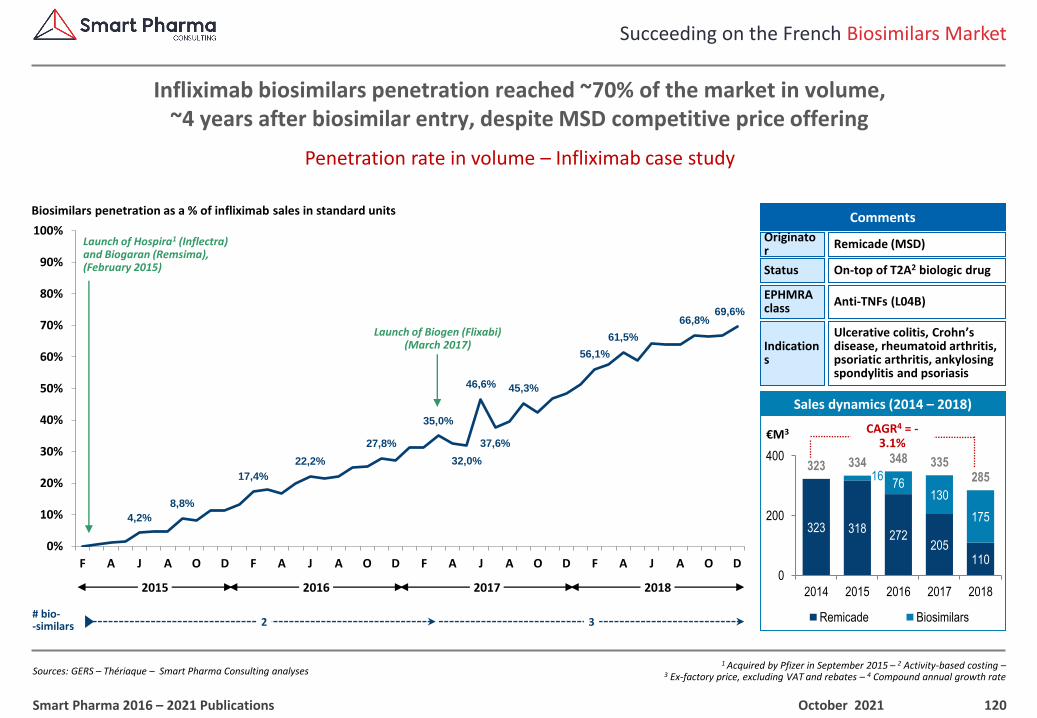
120
1 Acquired by Pfizer in September 2015 – 2 Activity-based costing –3 Ex-factory price, excluding VAT and rebates – 4 Compound annual growth rate
Succeeding on the French Biosimilars Market
Sources: GERS – Thériaque – Smart Pharma Consulting analyses
Penetration rate in volume – Infliximab case study
Infliximab biosimilars penetration reached ~70% of the market in volume, ~4 years after biosimilar entry, despite MSD competitive price offering
October 2021Smart Pharma 2016 – 2021 Publications
4,2%
8,8%
17,4%
22,2%
27,8%
35,0%
32,0%
46,6%
37,6%
45,3%
56,1%
61,5%
66,8%69,6%
0%
10%
20%
30%
40%
50%
60%
70%
80%
90%
100%
F A J A O D F A J A O D F A J A O D F A J A O D
Launch of Biogen (Flixabi)(March 2017)
Launch of Hospira1 (Inflectra) and Biogaran (Remsima), (February 2015)
# bio--similars
Biosimilars penetration as a % of infliximab sales in standard unitsComments
Status
Indications
On-top of T2A2 biologic drug
Ulcerative colitis, Crohn’s disease, rheumatoid arthritis, psoriatic arthritis, ankylosing spondylitis and psoriasis
Originator
Remicade (MSD)
EPHMRA class
Anti-TNFs (L04B)
323 318272
205110
16 76
130
175
323 334 348 335285
0
200
400
2014 2015 2016 2017 2018
Remicade Biosimilars
Sales dynamics (2014 – 2018)
€M3 CAGR4 = -3.1%
3
20182015 2016 2017
2
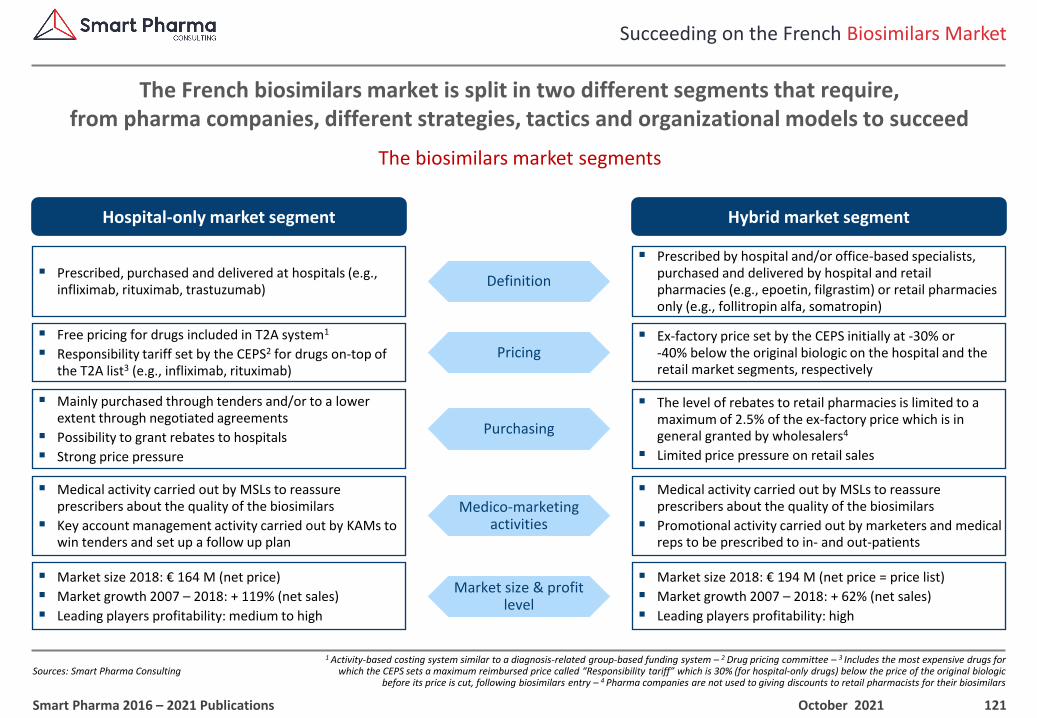
121
1 Activity-based costing system similar to a diagnosis-related group-based funding system – 2 Drug pricing committee – 3 Includes the most expensive drugs for which the CEPS sets a maximum reimbursed price called “Responsibility tariff” which is 30% (for hospital-only drugs) below the price of the original biologic
before its price is cut, following biosimilars entry – 4 Pharma companies are not used to giving discounts to retail pharmacists for their biosimilars
Succeeding on the French Biosimilars Market
Sources: Smart Pharma Consulting
The biosimilars market segments
The French biosimilars market is split in two different segments that require,from pharma companies, different strategies, tactics and organizational models to succeed
October 2021Smart Pharma 2016 – 2021 Publications
Hospital-only market segment Hybrid market segment
▪ Free pricing for drugs included in T2A system1
▪ Responsibility tariff set by the CEPS2 for drugs on-top of the T2A list3 (e.g., infliximab, rituximab)
Pricing▪ Ex-factory price set by the CEPS initially at -30% or
-40% below the original biologic on the hospital and the retail market segments, respectively
Purchasing
▪ Mainly purchased through tenders and/or to a lower extent through negotiated agreements
▪ Possibility to grant rebates to hospitals
▪ Strong price pressure
▪ The level of rebates to retail pharmacies is limited to a maximum of 2.5% of the ex-factory price which is in general granted by wholesalers4
▪ Limited price pressure on retail sales
Medico-marketing activities
▪ Medical activity carried out by MSLs to reassure prescribers about the quality of the biosimilars
▪ Key account management activity carried out by KAMs to win tenders and set up a follow up plan
▪ Medical activity carried out by MSLs to reassure prescribers about the quality of the biosimilars
▪ Promotional activity carried out by marketers and medical reps to be prescribed to in- and out-patients
▪ Prescribed, purchased and delivered at hospitals (e.g., infliximab, rituximab, trastuzumab)
Definition
▪ Prescribed by hospital and/or office-based specialists, purchased and delivered by hospital and retail pharmacies (e.g., epoetin, filgrastim) or retail pharmacies only (e.g., follitropin alfa, somatropin)
▪ Market size 2018: € 164 M (net price)
▪ Market growth 2007 – 2018: + 119% (net sales)
▪ Leading players profitability: medium to high
▪ Market size 2018: € 194 M (net price = price list)
▪ Market growth 2007 – 2018: + 62% (net sales)
▪ Leading players profitability: high
Market size & profit level
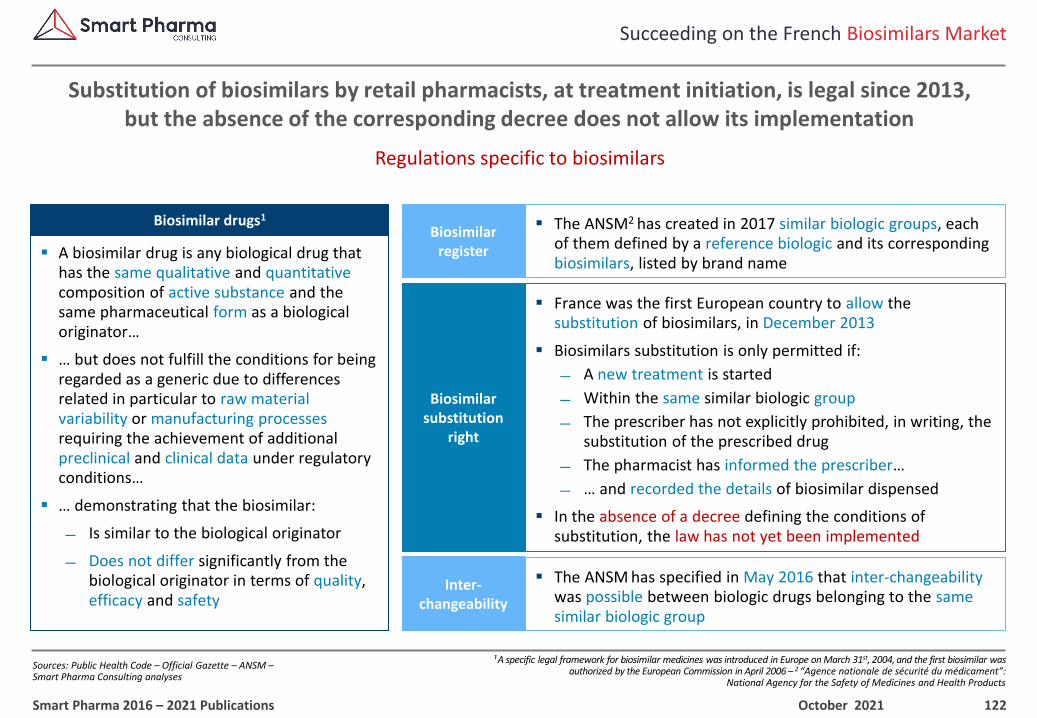
122
¹ A specific legal framework for biosimilar medicines was introduced in Europe on March 31st, 2004, and the first biosimilar was authorized by the European Commission in April 2006 – 2 “Agence nationale de sécurité du médicament”:
National Agency for the Safety of Medicines and Health Products
Succeeding on the French Biosimilars Market
Sources: Public Health Code – Official Gazette – ANSM –Smart Pharma Consulting analyses
Regulations specific to biosimilars
Substitution of biosimilars by retail pharmacists, at treatment initiation, is legal since 2013,but the absence of the corresponding decree does not allow its implementation
October 2021Smart Pharma 2016 – 2021 Publications
Biosimilar drugs1
▪ A biosimilar drug is any biological drug that has the same qualitative and quantitativecomposition of active substance and the same pharmaceutical form as a biological originator…
▪ … but does not fulfill the conditions for being regarded as a generic due to differences related in particular to raw material variability or manufacturing processesrequiring the achievement of additional preclinical and clinical data under regulatory conditions…
▪ … demonstrating that the biosimilar:
Is similar to the biological originator
Does not differ significantly from the biological originator in terms of quality, efficacy and safety
Biosimilar register
▪ The ANSM2 has created in 2017 similar biologic groups, each of them defined by a reference biologic and its corresponding biosimilars, listed by brand name
Biosimilarsubstitution
right
▪ France was the first European country to allow the substitution of biosimilars, in December 2013
▪ Biosimilars substitution is only permitted if:
A new treatment is started
Within the same similar biologic group
The prescriber has not explicitly prohibited, in writing, the substitution of the prescribed drug
The pharmacist has informed the prescriber…
… and recorded the details of biosimilar dispensed
▪ In the absence of a decree defining the conditions of substitution, the law has not yet been implemented
Inter-changeability
▪ The ANSM has specified in May 2016 that inter-changeabilitywas possible between biologic drugs belonging to the same similar biologic group
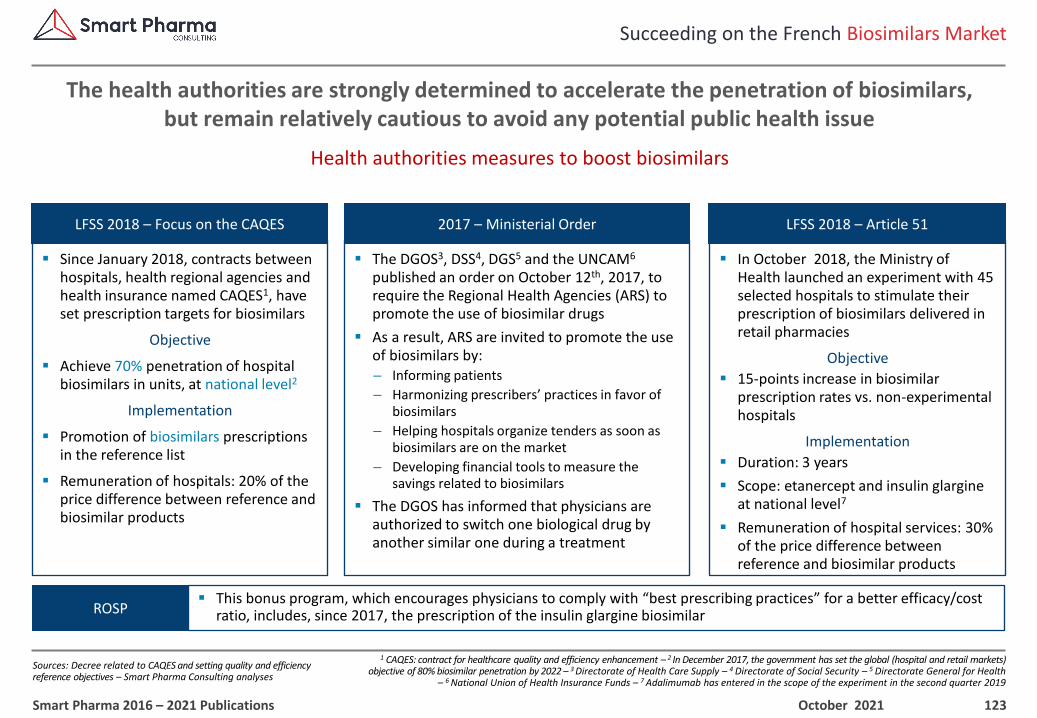
123
1 CAQES: contract for healthcare quality and efficiency enhancement – 2 In December 2017, the government has set the global (hospital and retail markets) objective of 80% biosimilar penetration by 2022 – 3 Directorate of Health Care Supply – 4 Directorate of Social Security – 5 Directorate General for Health
– 6 National Union of Health Insurance Funds – 7 Adalimumab has entered in the scope of the experiment in the second quarter 2019
Succeeding on the French Biosimilars Market
Sources: Decree related to CAQES and setting quality and efficiency reference objectives – Smart Pharma Consulting analyses
Health authorities measures to boost biosimilars
The health authorities are strongly determined to accelerate the penetration of biosimilars,but remain relatively cautious to avoid any potential public health issue
October 2021Smart Pharma 2016 – 2021 Publications
LFSS 2018 – Focus on the CAQES
▪ Since January 2018, contracts between hospitals, health regional agencies and health insurance named CAQES1, have set prescription targets for biosimilars
Objective
▪ Achieve 70% penetration of hospital biosimilars in units, at national level2
Implementation
▪ Promotion of biosimilars prescriptions in the reference list
▪ Remuneration of hospitals: 20% of the price difference between reference and biosimilar products
2017 – Ministerial Order
▪ The DGOS3, DSS4, DGS5 and the UNCAM6
published an order on October 12th, 2017, to require the Regional Health Agencies (ARS) to promote the use of biosimilar drugs
▪ As a result, ARS are invited to promote the use of biosimilars by:– Informing patients
– Harmonizing prescribers’ practices in favor of biosimilars
– Helping hospitals organize tenders as soon as biosimilars are on the market
– Developing financial tools to measure the savings related to biosimilars
▪ The DGOS has informed that physicians are authorized to switch one biological drug by another similar one during a treatment
LFSS 2018 – Article 51
▪ In October 2018, the Ministry of Health launched an experiment with 45 selected hospitals to stimulate their prescription of biosimilars delivered in retail pharmacies
Objective
▪ 15-points increase in biosimilar prescription rates vs. non-experimental hospitals
Implementation
▪ Duration: 3 years
▪ Scope: etanercept and insulin glargine at national level7
▪ Remuneration of hospital services: 30% of the price difference between reference and biosimilar products
ROSP▪ This bonus program, which encourages physicians to comply with “best prescribing practices” for a better efficacy/cost
ratio, includes, since 2017, the prescription of the insulin glargine biosimilar
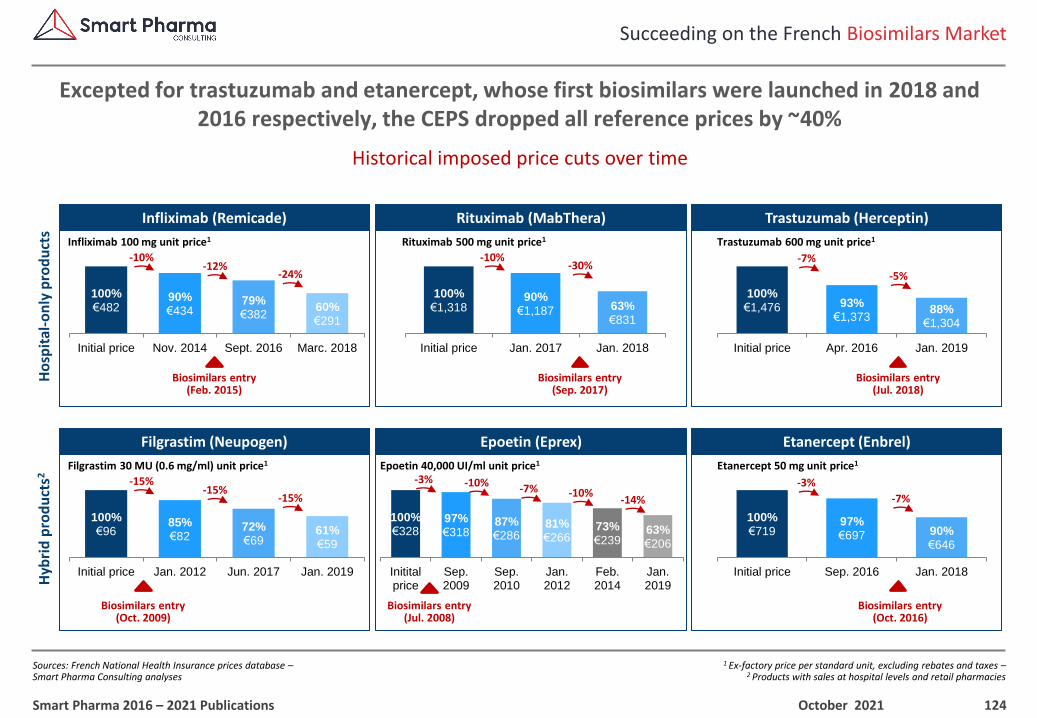
124
1 Ex-factory price per standard unit, excluding rebates and taxes –2 Products with sales at hospital levels and retail pharmacies
Succeeding on the French Biosimilars Market
Sources: French National Health Insurance prices database –Smart Pharma Consulting analyses
Historical imposed price cuts over time
Excepted for trastuzumab and etanercept, whose first biosimilars were launched in 2018 and 2016 respectively, the CEPS dropped all reference prices by ~40%
October 2021Smart Pharma 2016 – 2021 Publications
100%€328
97%€318
87%€286
81%€266
73%€239
63%€206
Inititalprice
Sep.2009
Sep.2010
Jan.2012
Feb.2014
Jan.2019
Biosimilars entry(Feb. 2015)
Infliximab (Remicade)
100%€482
90%€434
79%€382
60%€291
Initial price Nov. 2014 Sept. 2016 Marc. 2018
-10%-12%
-24%
Infliximab 100 mg unit price1
Biosimilars entry(Oct. 2009)
Filgrastim (Neupogen)
100%€96
85%€82
72%€69
61%€59
Initial price Jan. 2012 Jun. 2017 Jan. 2019
-15%-15%
-15%
Filgrastim 30 MU (0.6 mg/ml) unit price1
Biosimilars entry(Jul. 2018)
Trastuzumab (Herceptin)
100%€1,476 93%
€1,37388%
€1,304
Initial price Apr. 2016 Jan. 2019
-7%
-5%
Trastuzumab 600 mg unit price1
Biosimilars entry(Oct. 2016)
Etanercept (Enbrel)
100%€719
97%€697 90%
€646
Initial price Sep. 2016 Jan. 2018
-3%
Etanercept 50 mg unit price1
Rituximab (MabThera)
Rituximab 500 mg unit price1
Biosimilars entry(Sep. 2017)
100%€1,318
90%€1,187 63%
€831
Initial price Jan. 2017 Jan. 2018
-10%-30%
Epoetin (Eprex)
Epoetin 40,000 UI/ml unit price1
Biosimilars entry(Jul. 2008)
-3% -10% -7% -10%-14% -7%
Ho
spit
al-o
nly
pro
du
cts
Hyb
rid
pro
du
cts2
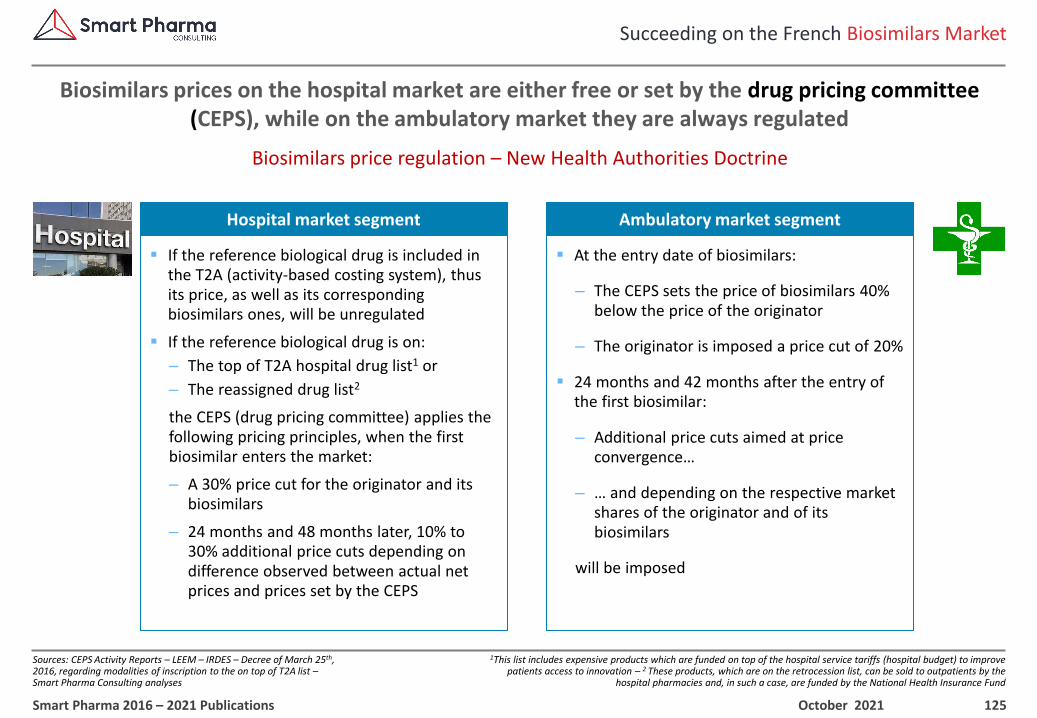
125
1This list includes expensive products which are funded on top of the hospital service tariffs (hospital budget) to improve patients access to innovation – 2 These products, which are on the retrocession list, can be sold to outpatients by the
hospital pharmacies and, in such a case, are funded by the National Health Insurance Fund
Succeeding on the French Biosimilars Market
Sources: CEPS Activity Reports – LEEM – IRDES – Decree of March 25th, 2016, regarding modalities of inscription to the on top of T2A list –Smart Pharma Consulting analyses
Biosimilars price regulation – New Health Authorities Doctrine
Biosimilars prices on the hospital market are either free or set by the drug pricing committee (CEPS), while on the ambulatory market they are always regulated
October 2021Smart Pharma 2016 – 2021 Publications
Hospital market segment Ambulatory market segment
▪ At the entry date of biosimilars:
– The CEPS sets the price of biosimilars 40% below the price of the originator
– The originator is imposed a price cut of 20%
▪ 24 months and 42 months after the entry of the first biosimilar:
– Additional price cuts aimed at price convergence…
– … and depending on the respective market shares of the originator and of its biosimilars
will be imposed
▪ If the reference biological drug is included in the T2A (activity-based costing system), thus its price, as well as its corresponding biosimilars ones, will be unregulated
▪ If the reference biological drug is on:
– The top of T2A hospital drug list1 or
– The reassigned drug list2
the CEPS (drug pricing committee) applies the following pricing principles, when the first biosimilar enters the market:
– A 30% price cut for the originator and its biosimilars
– 24 months and 48 months later, 10% to 30% additional price cuts depending on difference observed between actual net prices and prices set by the CEPS
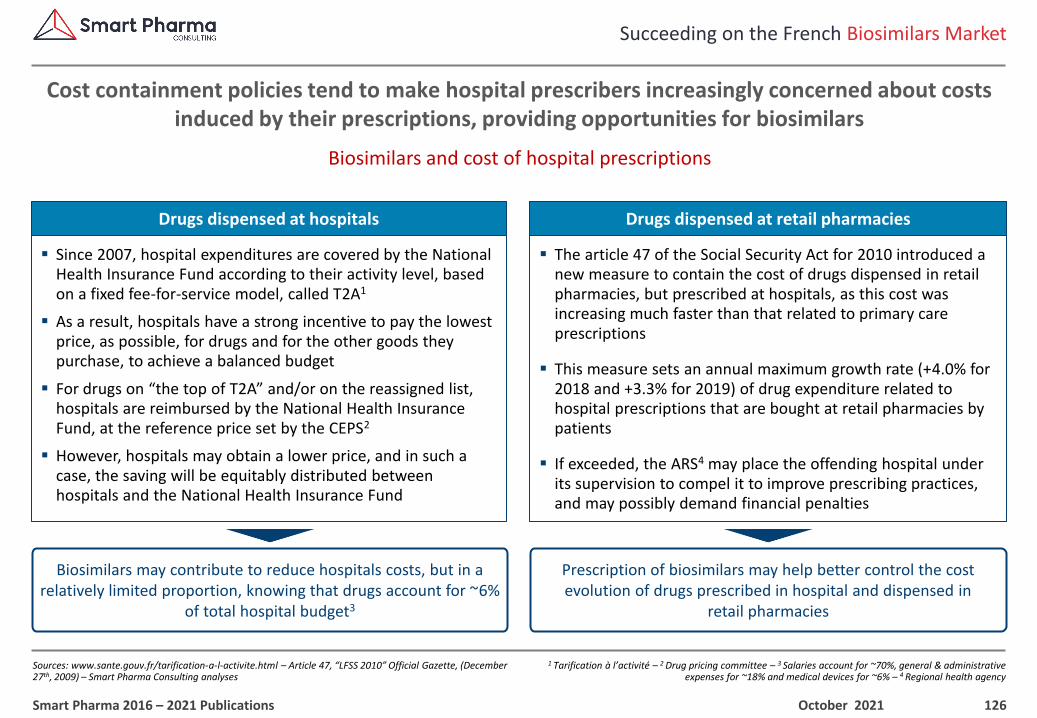
126
1 Tarification à l’activité – 2 Drug pricing committee – 3 Salaries account for ~70%, general & administrative expenses for ~18% and medical devices for ~6% – 4 Regional health agency
Succeeding on the French Biosimilars Market
Sources: www.sante.gouv.fr/tarification-a-l-activite.html – Article 47, “LFSS 2010” Official Gazette, (December 27th, 2009) – Smart Pharma Consulting analyses
Biosimilars and cost of hospital prescriptions
Cost containment policies tend to make hospital prescribers increasingly concerned about costs induced by their prescriptions, providing opportunities for biosimilars
October 2021Smart Pharma 2016 – 2021 Publications
Drugs dispensed at hospitals Drugs dispensed at retail pharmacies
Biosimilars may contribute to reduce hospitals costs, but in a relatively limited proportion, knowing that drugs account for ~6%
of total hospital budget3
Prescription of biosimilars may help better control the cost evolution of drugs prescribed in hospital and dispensed in
retail pharmacies
▪ Since 2007, hospital expenditures are covered by the National Health Insurance Fund according to their activity level, based on a fixed fee-for-service model, called T2A1
▪ As a result, hospitals have a strong incentive to pay the lowest price, as possible, for drugs and for the other goods they purchase, to achieve a balanced budget
▪ For drugs on “the top of T2A” and/or on the reassigned list, hospitals are reimbursed by the National Health Insurance Fund, at the reference price set by the CEPS2
▪ However, hospitals may obtain a lower price, and in such a case, the saving will be equitably distributed between hospitals and the National Health Insurance Fund
▪ The article 47 of the Social Security Act for 2010 introduced a new measure to contain the cost of drugs dispensed in retail pharmacies, but prescribed at hospitals, as this cost was increasing much faster than that related to primary care prescriptions
▪ This measure sets an annual maximum growth rate (+4.0% for 2018 and +3.3% for 2019) of drug expenditure related to hospital prescriptions that are bought at retail pharmacies by patients
▪ If exceeded, the ARS4 may place the offending hospital under its supervision to compel it to improve prescribing practices, and may possibly demand financial penalties
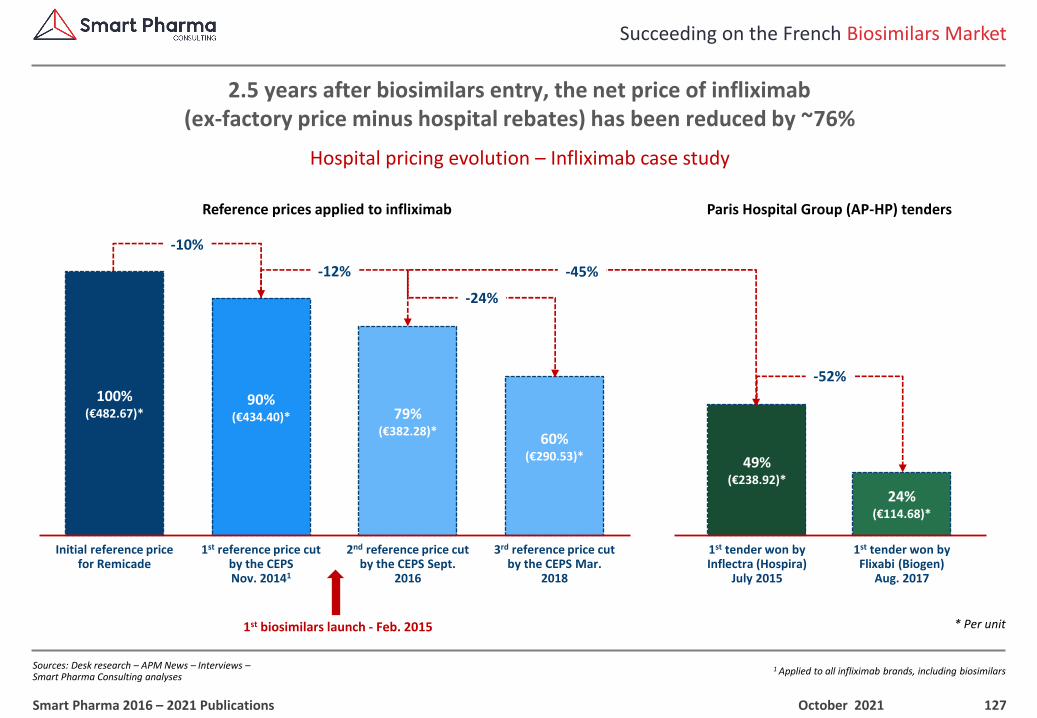
127
1 Applied to all infliximab brands, including biosimilars
Succeeding on the French Biosimilars Market
Sources: Desk research – APM News – Interviews –Smart Pharma Consulting analyses
Hospital pricing evolution – Infliximab case study
2.5 years after biosimilars entry, the net price of infliximab (ex-factory price minus hospital rebates) has been reduced by ~76%
October 2021Smart Pharma 2016 – 2021 Publications
49%(€238.92)*
24%(€114.68)*
60%(€290.53)*
-10%
Initial reference price for Remicade
100%(€482.67)*
1st reference price cut by the CEPSNov. 20141
90%(€434.40)*
2nd reference price cut by the CEPS Sept.
2016
79%(€382.28)*
Reference prices applied to infliximab
1st biosimilars launch - Feb. 2015
Paris Hospital Group (AP-HP) tenders
1st tender won by Inflectra (Hospira)
July 2015
1st tender won by Flixabi (Biogen)
Aug. 2017
-52%
-45%-12%
3rd reference price cut by the CEPS Mar.
2018
-24%
* Per unit
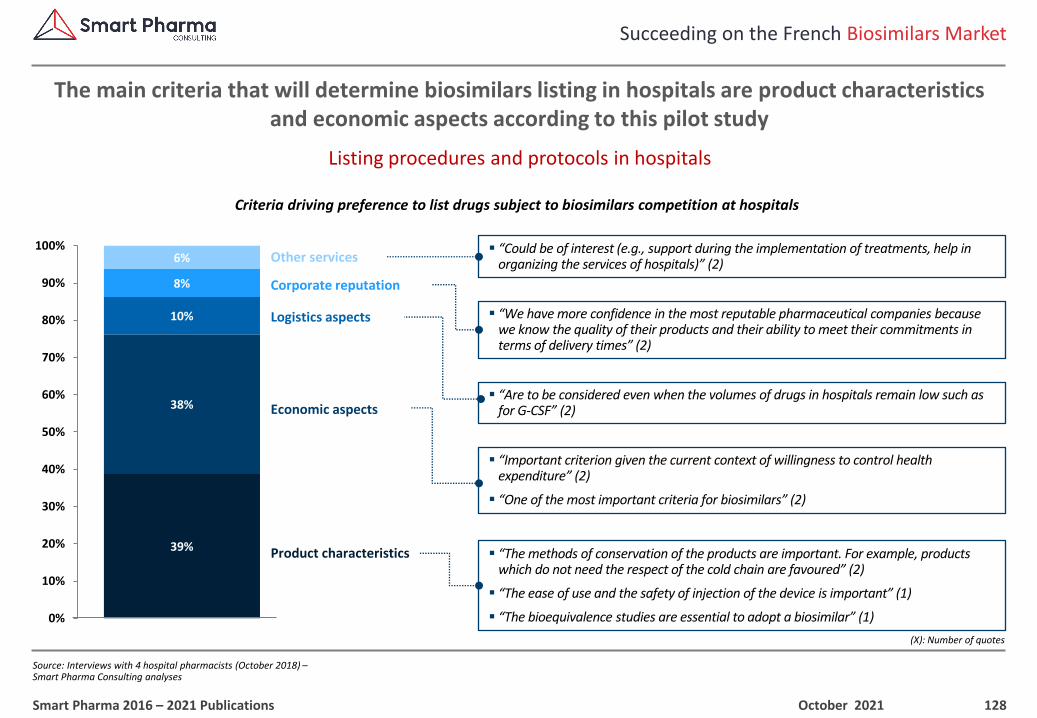
128
Succeeding on the French Biosimilars Market
Source: Interviews with 4 hospital pharmacists (October 2018) –Smart Pharma Consulting analyses
Listing procedures and protocols in hospitals
The main criteria that will determine biosimilars listing in hospitals are product characteristics and economic aspects according to this pilot study
October 2021Smart Pharma 2016 – 2021 Publications
Criteria driving preference to list drugs subject to biosimilars competition at hospitals
39%
38%
10%
8%
6%
0%
10%
20%
30%
40%
50%
60%
70%
80%
90%
100%
Product characteristics
Economic aspects
Corporate reputation
Other services
▪ “The methods of conservation of the products are important. For example, products which do not need the respect of the cold chain are favoured” (2)
▪ “The ease of use and the safety of injection of the device is important” (1)
▪ “The bioequivalence studies are essential to adopt a biosimilar” (1)
▪ “Important criterion given the current context of willingness to control health expenditure” (2)
▪ “One of the most important criteria for biosimilars” (2)
▪ “Are to be considered even when the volumes of drugs in hospitals remain low such as for G-CSF” (2)
▪ “We have more confidence in the most reputable pharmaceutical companies because we know the quality of their products and their ability to meet their commitments in terms of delivery times” (2)
▪ “Could be of interest (e.g., support during the implementation of treatments, help in organizing the services of hospitals)” (2)
(X): Number of quotes
Logistics aspects
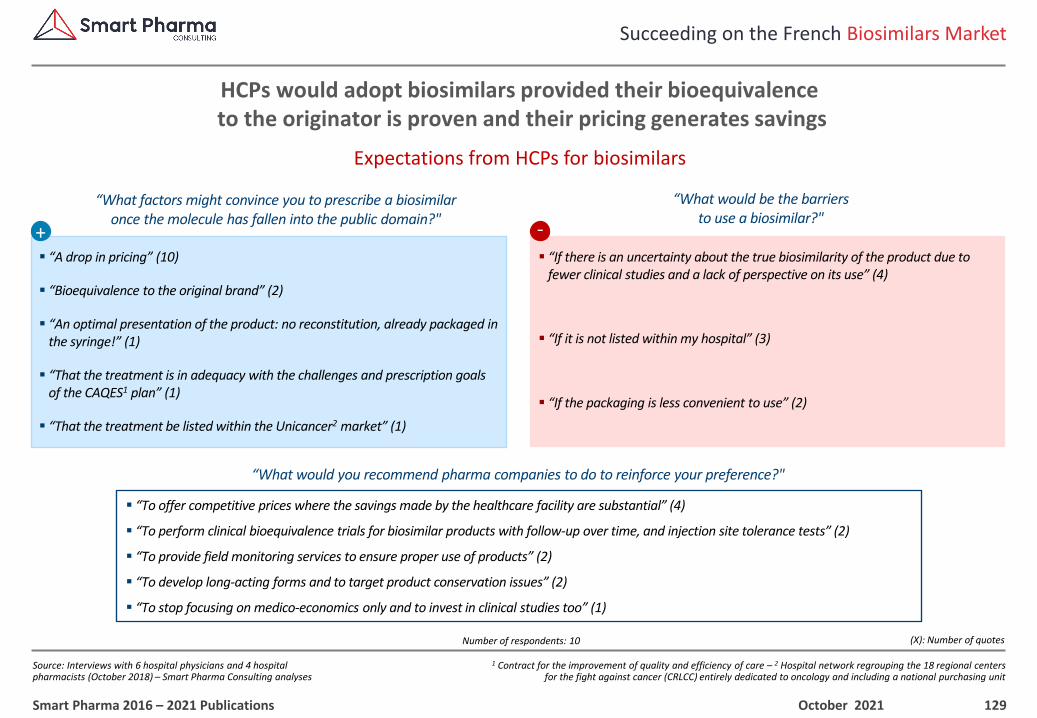
129
1 Contract for the improvement of quality and efficiency of care – 2 Hospital network regrouping the 18 regional centers for the fight against cancer (CRLCC) entirely dedicated to oncology and including a national purchasing unit
Succeeding on the French Biosimilars Market
Source: Interviews with 6 hospital physicians and 4 hospital pharmacists (October 2018) – Smart Pharma Consulting analyses
Expectations from HCPs for biosimilars
HCPs would adopt biosimilars provided their bioequivalenceto the originator is proven and their pricing generates savings
October 2021Smart Pharma 2016 – 2021 Publications
“What factors might convince you to prescribe a biosimilar once the molecule has fallen into the public domain?"
“What would be the barriers to use a biosimilar?"
▪ “A drop in pricing” (10)
▪ “Bioequivalence to the original brand” (2)
▪ “An optimal presentation of the product: no reconstitution, already packaged in the syringe!” (1)
▪ “That the treatment is in adequacy with the challenges and prescription goals of the CAQES1 plan” (1)
▪ “That the treatment be listed within the Unicancer2 market” (1)
▪ “If there is an uncertainty about the true biosimilarity of the product due to fewer clinical studies and a lack of perspective on its use” (4)
▪ “If it is not listed within my hospital” (3)
▪ “If the packaging is less convenient to use” (2)
“What would you recommend pharma companies to do to reinforce your preference?"
▪ “To offer competitive prices where the savings made by the healthcare facility are substantial” (4)
▪ “To perform clinical bioequivalence trials for biosimilar products with follow-up over time, and injection site tolerance tests” (2)
▪ “To provide field monitoring services to ensure proper use of products” (2)
▪ “To develop long-acting forms and to target product conservation issues” (2)
▪ “To stop focusing on medico-economics only and to invest in clinical studies too” (1)
+ -
Number of respondents: 10 (X): Number of quotes
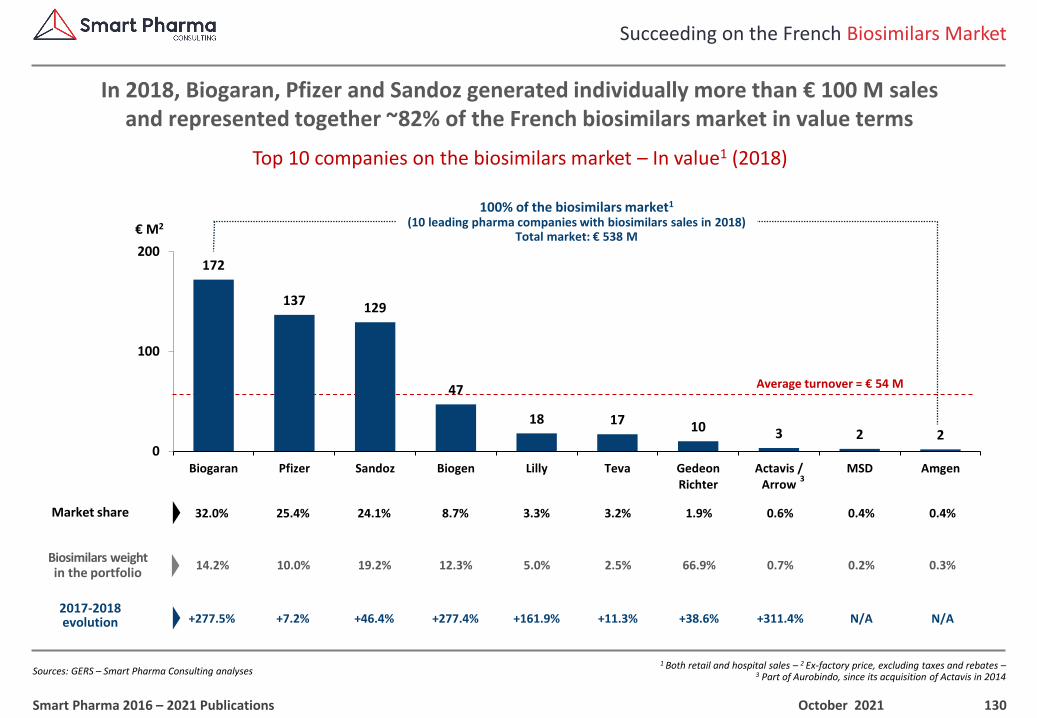
130
1 Both retail and hospital sales – 2 Ex-factory price, excluding taxes and rebates –3 Part of Aurobindo, since its acquisition of Actavis in 2014
Succeeding on the French Biosimilars Market
Sources: GERS – Smart Pharma Consulting analyses
Top 10 companies on the biosimilars market – In value1 (2018)
In 2018, Biogaran, Pfizer and Sandoz generated individually more than € 100 M sales and represented together ~82% of the French biosimilars market in value terms
October 2021Smart Pharma 2016 – 2021 Publications
172
137 129
47
18 17 10 3 2 20
100
200
Biogaran Pfizer Sandoz Biogen Lilly Teva GedeonRichter
Actavis /Arrow
MSD Amgen
Average turnover = € 54 M
€ M2
100% of the biosimilars market1
(10 leading pharma companies with biosimilars sales in 2018)Total market: € 538 M
25.4%32.0% 0.4%1.9%24.1% 3.3% 3.2% 0.6% 0.4%8.7%Market share
10.0%14.2% 0.3%66.9%19.2% 5.0% 2.5% 0.7% 0.2%12.3%Biosimilars weight in the portfolio
+7.2%+277.5% N/A+38.6%+46.4% +161.9% +11.3% +311.4% N/A+277.4%2017-2018evolution
3
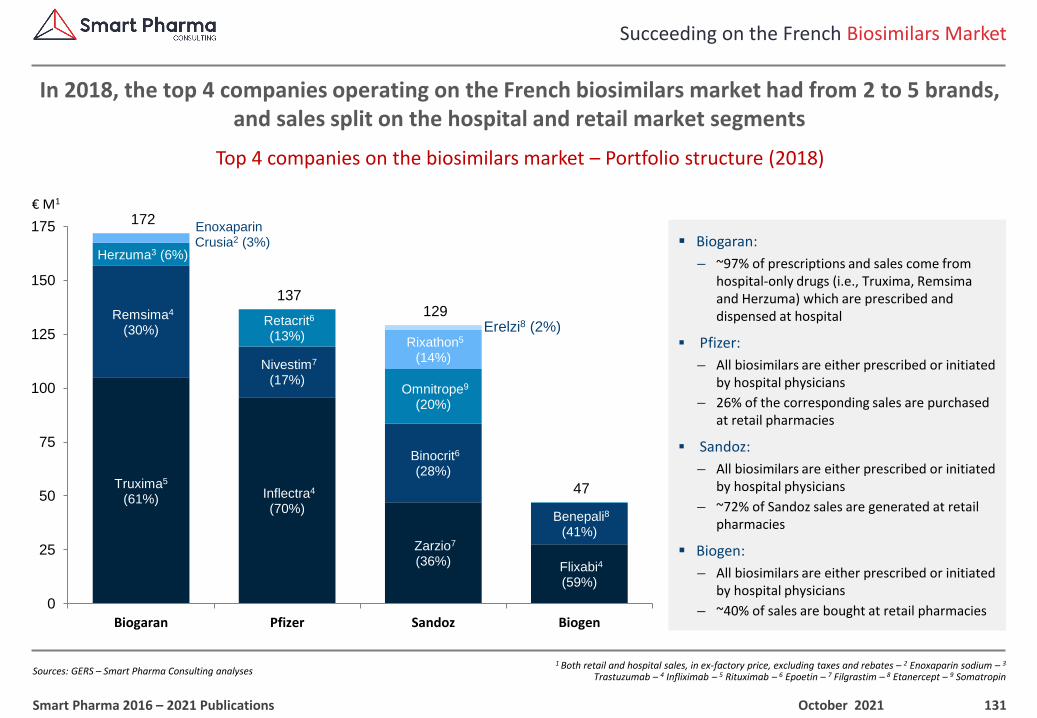
131
1 Both retail and hospital sales, in ex-factory price, excluding taxes and rebates – 2 Enoxaparin sodium – 3
Trastuzumab – 4 Infliximab – 5 Rituximab – 6 Epoetin – 7 Filgrastim – 8 Etanercept – 9 Somatropin
Succeeding on the French Biosimilars Market
Sources: GERS – Smart Pharma Consulting analyses
Top 4 companies on the biosimilars market – Portfolio structure (2018)
In 2018, the top 4 companies operating on the French biosimilars market had from 2 to 5 brands, and sales split on the hospital and retail market segments
October 2021Smart Pharma 2016 – 2021 Publications
€ M1
Truxima5
(61%) Inflectra4
(70%)
Zarzio7
(36%) Flixabi4
(59%)
Remsima4
(30%)
Nivestim7
(17%)
Binocrit6
(28%)
Benepali8
(41%)
Herzuma3 (6%)
Retacrit6
(13%)
Omnitrope9
(20%)
EnoxaparinCrusia2 (3%)
Rixathon5
(14%)
Erelzi8 (2%)
172
137 129
47
0
25
50
75
100
125
150
175
Biogaran Pfizer Sandoz Biogen
▪ Biogaran:
– ~97% of prescriptions and sales come from hospital-only drugs (i.e., Truxima, Remsima and Herzuma) which are prescribed and dispensed at hospital
▪ Pfizer:
– All biosimilars are either prescribed or initiated by hospital physicians
– 26% of the corresponding sales are purchased at retail pharmacies
▪ Sandoz:
– All biosimilars are either prescribed or initiated by hospital physicians
– ~72% of Sandoz sales are generated at retail pharmacies
▪ Biogen:
– All biosimilars are either prescribed or initiated by hospital physicians
– ~40% of sales are bought at retail pharmacies
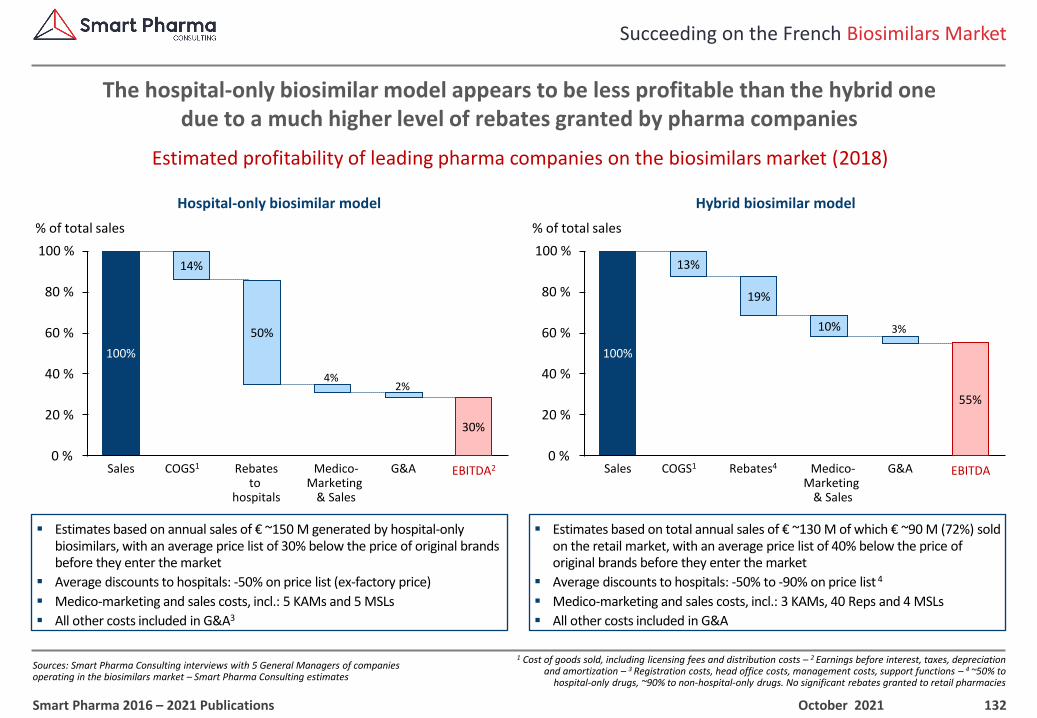
132
1 Cost of goods sold, including licensing fees and distribution costs – 2 Earnings before interest, taxes, depreciation and amortization – 3 Registration costs, head office costs, management costs, support functions – 4 ~50% to
hospital-only drugs, ~90% to non-hospital-only drugs. No significant rebates granted to retail pharmacies
Succeeding on the French Biosimilars Market
Sources: Smart Pharma Consulting interviews with 5 General Managers of companies operating in the biosimilars market – Smart Pharma Consulting estimates
Estimated profitability of leading pharma companies on the biosimilars market (2018)
The hospital-only biosimilar model appears to be less profitable than the hybrid onedue to a much higher level of rebates granted by pharma companies
October 2021Smart Pharma 2016 – 2021 Publications
% of total sales
Rebatesto
hospitals
Sales COGS1 Medico-Marketing
& Sales
G&A0 %
40 %
100 %
20 %
80 %
60 %
EBITDA2
100%
50%
Hospital-only biosimilar model Hybrid biosimilar model
▪ Estimates based on annual sales of € ~150 M generated by hospital-only biosimilars, with an average price list of 30% below the price of original brands before they enter the market
▪ Average discounts to hospitals: -50% on price list (ex-factory price)
▪ Medico-marketing and sales costs, incl.: 5 KAMs and 5 MSLs
▪ All other costs included in G&A3
▪ Estimates based on total annual sales of € ~130 M of which € ~90 M (72%) sold on the retail market, with an average price list of 40% below the price of original brands before they enter the market
▪ Average discounts to hospitals: -50% to -90% on price list 4
▪ Medico-marketing and sales costs, incl.: 3 KAMs, 40 Reps and 4 MSLs
▪ All other costs included in G&A
% of total sales
Rebates4Sales COGS1 Medico-Marketing
& Sales
G&A0 %
40 %
100 %
20 %
80 %
60 %
EBITDA
13%
100%
10%
19%
14%
55%
30%
4%2%
3%
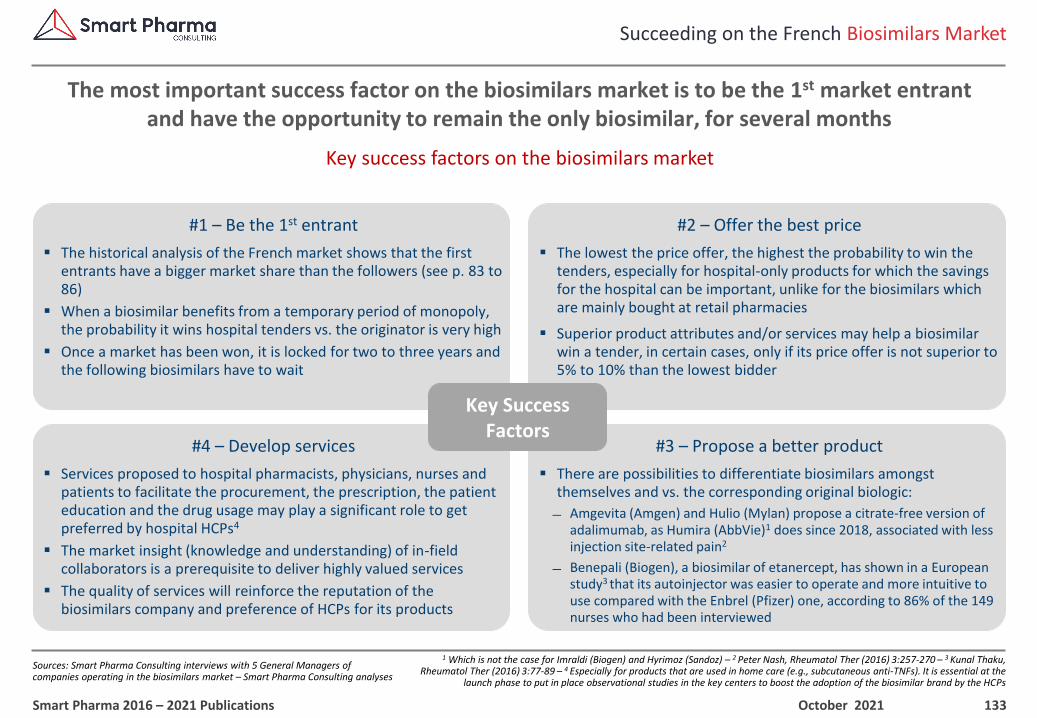
133
1 Which is not the case for Imraldi (Biogen) and Hyrimoz (Sandoz) – 2 Peter Nash, Rheumatol Ther (2016) 3:257-270 – 3 Kunal Thaku, Rheumatol Ther (2016) 3:77-89 – 4 Especially for products that are used in home care (e.g., subcutaneous anti-TNFs). It is essential at the
launch phase to put in place observational studies in the key centers to boost the adoption of the biosimilar brand by the HCPs
Succeeding on the French Biosimilars Market
Sources: Smart Pharma Consulting interviews with 5 General Managers of companies operating in the biosimilars market – Smart Pharma Consulting analyses
Key success factors on the biosimilars market
The most important success factor on the biosimilars market is to be the 1st market entrantand have the opportunity to remain the only biosimilar, for several months
October 2021Smart Pharma 2016 – 2021 Publications
#1 – Be the 1st entrant
▪ The historical analysis of the French market shows that the first entrants have a bigger market share than the followers (see p. 83 to 86)
▪ When a biosimilar benefits from a temporary period of monopoly, the probability it wins hospital tenders vs. the originator is very high
▪ Once a market has been won, it is locked for two to three years and the following biosimilars have to wait
#2 – Offer the best price
▪ The lowest the price offer, the highest the probability to win the tenders, especially for hospital-only products for which the savings for the hospital can be important, unlike for the biosimilars which are mainly bought at retail pharmacies
▪ Superior product attributes and/or services may help a biosimilar win a tender, in certain cases, only if its price offer is not superior to 5% to 10% than the lowest bidder
#4 – Develop services
▪ Services proposed to hospital pharmacists, physicians, nurses and patients to facilitate the procurement, the prescription, the patient education and the drug usage may play a significant role to get preferred by hospital HCPs4
▪ The market insight (knowledge and understanding) of in-field collaborators is a prerequisite to deliver highly valued services
▪ The quality of services will reinforce the reputation of the biosimilars company and preference of HCPs for its products
#3 – Propose a better product
▪ There are possibilities to differentiate biosimilars amongst themselves and vs. the corresponding original biologic:
Amgevita (Amgen) and Hulio (Mylan) propose a citrate-free version of adalimumab, as Humira (AbbVie)1 does since 2018, associated with less injection site-related pain2
Benepali (Biogen), a biosimilar of etanercept, has shown in a European study3 that its autoinjector was easier to operate and more intuitive to use compared with the Enbrel (Pfizer) one, according to 86% of the 149 nurses who had been interviewed
Key Success Factors
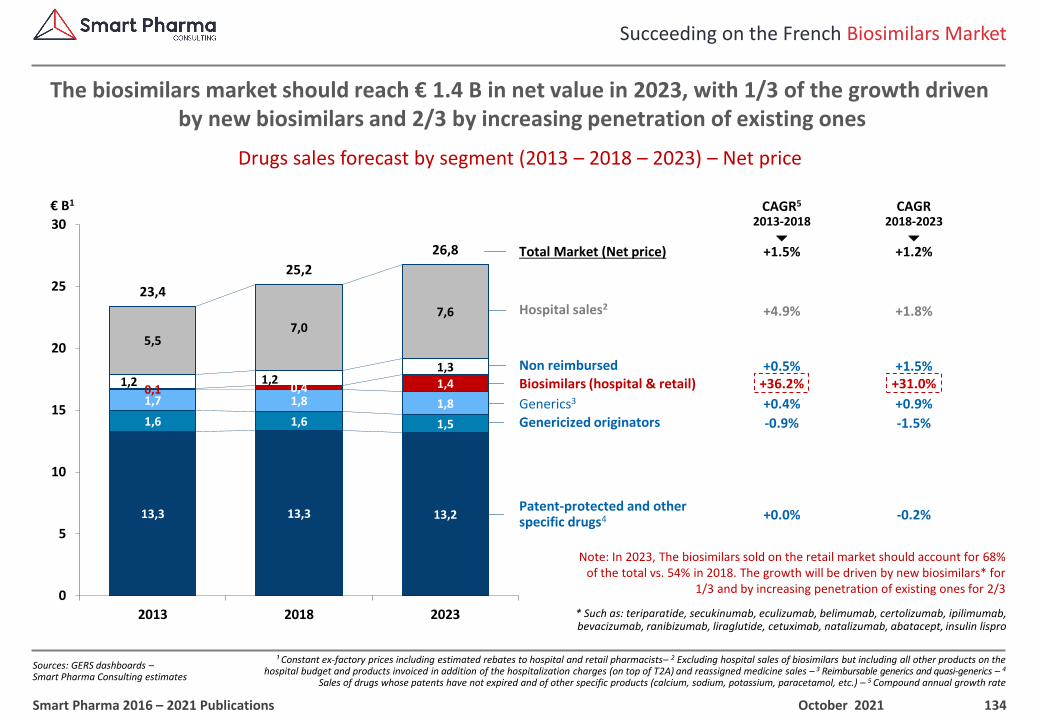
134
¹ Constant ex-factory prices including estimated rebates to hospital and retail pharmacists– 2 Excluding hospital sales of biosimilars but including all other products on the hospital budget and products invoiced in addition of the hospitalization charges (on top of T2A) and reassigned medicine sales – 3 Reimbursable generics and quasi-generics – 4
Sales of drugs whose patents have not expired and of other specific products (calcium, sodium, potassium, paracetamol, etc.) – 5 Compound annual growth rate
Succeeding on the French Biosimilars Market
Sources: GERS dashboards –Smart Pharma Consulting estimates
Drugs sales forecast by segment (2013 – 2018 – 2023) – Net price
The biosimilars market should reach € 1.4 B in net value in 2023, with 1/3 of the growth drivenby new biosimilars and 2/3 by increasing penetration of existing ones
October 2021Smart Pharma 2016 – 2021 Publications
* Such as: teriparatide, secukinumab, eculizumab, belimumab, certolizumab, ipilimumab, bevacizumab, ranibizumab, liraglutide, cetuximab, natalizumab, abatacept, insulin lispro
+1.8%
+1.5%
-1.5%
+31.0%
-0.2%
CAGR2018-2023
Total Market (Net price)
€ B1 CAGR5
2013-2018
Hospital sales2
Genericized originators
Patent-protected and otherspecific drugs4
Non reimbursed
Biosimilars (hospital & retail)
+4.9%
+0.5%
-0.9%
+36.2%
+0.0%13,3 13,3 13,2
1,6 1,6 1,5
1,7 1,8 1,80,1 0,4 1,41,2 1,2
1,3
5,57,0
7,6
23,4
25,2
26,8
0
5
10
15
20
25
30
2013 2018 2023
+0.9%Generics3 +0.4%
Note: In 2023, The biosimilars sold on the retail market should account for 68% of the total vs. 54% in 2018. The growth will be driven by new biosimilars* for
1/3 and by increasing penetration of existing ones for 2/3
+1.2%+1.5%
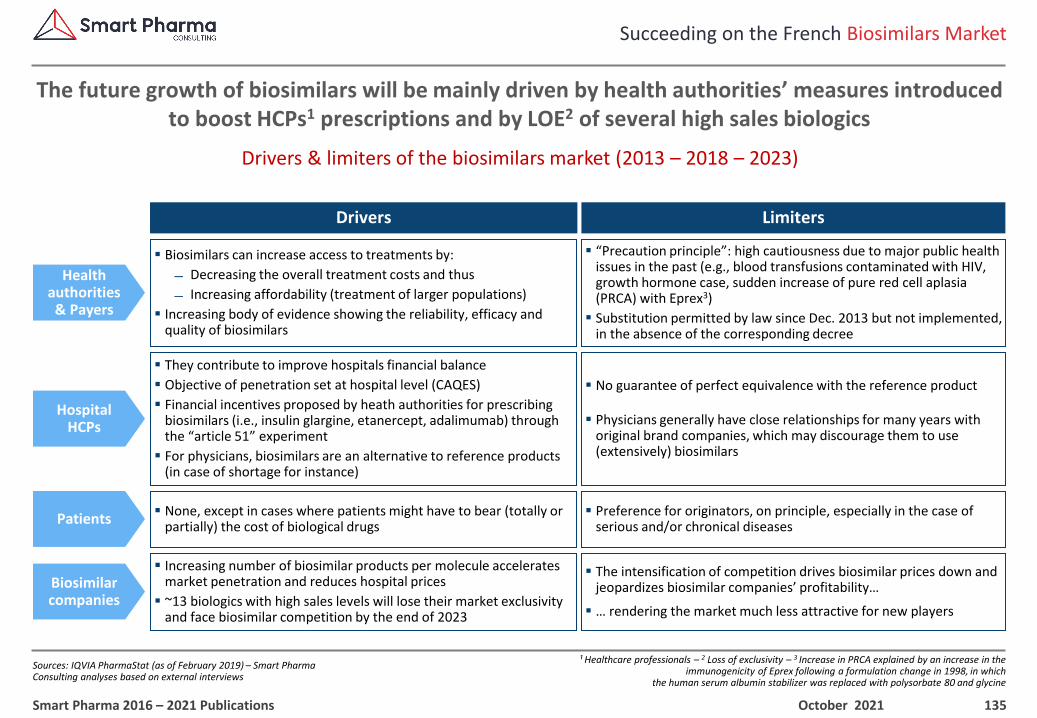
135
¹ Healthcare professionals – 2 Loss of exclusivity – 3 Increase in PRCA explained by an increase in the immunogenicity of Eprex following a formulation change in 1998, in which
the human serum albumin stabilizer was replaced with polysorbate 80 and glycine
Succeeding on the French Biosimilars Market
Sources: IQVIA PharmaStat (as of February 2019) – Smart Pharma Consulting analyses based on external interviews
Drivers & limiters of the biosimilars market (2013 – 2018 – 2023)
The future growth of biosimilars will be mainly driven by health authorities’ measures introduced to boost HCPs1 prescriptions and by LOE2 of several high sales biologics
October 2021Smart Pharma 2016 – 2021 Publications
Drivers Limiters
Health authorities & Payers
▪ “Precaution principle”: high cautiousness due to major public health issues in the past (e.g., blood transfusions contaminated with HIV, growth hormone case, sudden increase of pure red cell aplasia (PRCA) with Eprex3)
▪ Substitution permitted by law since Dec. 2013 but not implemented, in the absence of the corresponding decree
▪ Biosimilars can increase access to treatments by:
Decreasing the overall treatment costs and thus
Increasing affordability (treatment of larger populations)
▪ Increasing body of evidence showing the reliability, efficacy and quality of biosimilars
Patients▪ Preference for originators, on principle, especially in the case of
serious and/or chronical diseases▪ None, except in cases where patients might have to bear (totally or
partially) the cost of biological drugs
Hospital HCPs
▪ They contribute to improve hospitals financial balance
▪ Objective of penetration set at hospital level (CAQES)
▪ Financial incentives proposed by heath authorities for prescribing biosimilars (i.e., insulin glargine, etanercept, adalimumab) through the “article 51” experiment
▪ For physicians, biosimilars are an alternative to reference products (in case of shortage for instance)
▪ No guarantee of perfect equivalence with the reference product
▪ Physicians generally have close relationships for many years with original brand companies, which may discourage them to use (extensively) biosimilars
Biosimilar companies
▪ The intensification of competition drives biosimilar prices down and jeopardizes biosimilar companies’ profitability…
▪ … rendering the market much less attractive for new players
▪ Increasing number of biosimilar products per molecule accelerates market penetration and reduces hospital prices
▪ ~13 biologics with high sales levels will lose their market exclusivity and face biosimilar competition by the end of 2023
136
1 In net value – 2 The implementation decree which is required to apply the law voted in December 2013 is still pending. No change is expected in the short term. The health authorities are not in favor of substitution at retail level for public health security and responsibility
Succeeding on the French Biosimilars Market
Sources: Smart Pharma Consulting analyses
Executive summary
The market of biosimilars will benefit from the launch of new productsin existing classes and in new classes by 2023
October 2021Smart Pharma 2016 – 2021 Publications
Executive summary
1. The market structure and dynamics
▪ Since 2014, the market has increased four-fold1
▪ The penetration of hospital-only biosimilars is must higher than the one of biosimilars which are also delivered on the retail market
2. The French regulatory environment
▪ Since 2017, health authorities have multiplied the initiatives to boost the biosimilars market
▪ They have also developed a doctrine defining the decrease of biosimilars price over time
3. The customers behaviors
▪ Hospital listing and prescribing depend mainly on product attributes and price
▪ The absence of authorization for retail pharmacists to substitute biosimilars2
makes physicians the main driver
4. The competitive landscape
▪ The top 3 leading players3 have generated more than € 100 M gross sales in 2018, accounting for ~82% of the market in value
▪ They have generated EBITDA4 rates ranging from 30% to 60% of gross sales
6. The 2018 – 2023 market growth
▪ The market should increase by € 1 B, thanks to the LOE of blockbusters (e.g., Avastin, Lucentis) and the increasing market penetration of recent biosimilars (e.g., Humira, Herceptin)
5. The key success factors
▪ Enter first the market
▪ Be the lowest-priced bidder…
▪ … and/or offer superior services
▪ Offer a better product than competitors
Consulting firm dedicated to the pharmaceutical sector operating in the complementary domains of strategy, management and organization
Smart Pharma Consulting Editions
▪ Besides our consulting activities which take 85% of our time, we are strongly engaged in sharing our knowledge and thoughts through:
– Our teaching and training activities
– The publication of articles, booklets, books and expert reports
▪ More than 80 publications, in free access, can be downloaded from our website, of which:
– 19 business reports (e.g., The French Pharma Market)
– 12 position papers in the “Best-in-Class Series”
– 18 position papers in the “Market Insights Series”
– 10 position papers in the “Smart Tool Series”
– 10 position papers in the “Smart Manager Series”
▪ Our research activities in pharma business management and our consulting activities have shown to be highly synergistic
▪ We hope that this new publication will be useful for you
▪ We remain at your disposal to carry out consulting projects or training seminars to help you improve your operations
Best regards
Jean-Michel Peny
The Collection 2021▪ The “Collection 2021” which includes Smart Pharma Consulting
best position papers, is published on its 20th anniversary
▪ This e-book proposes effective and practical solutions to help pharma companies improve their performance
▪ Its content will be released in six parts, overt the 4th quarter 2021:
Part 1Market Insights
Concepts – Methods – Tools
▪ This 1st part of Smart Pharma Consulting’s best position papers, covers the following topics:
‒ Pharma Market Insight Studies
‒ French Pharma Market 2020 – 2025
‒ Global Pharma Market & Covid-19 Impact
‒ French Retail Pharmacies
‒ French Biosimilars Market
1. Market Insights
2. Strategy & Market Access
3. Medical Affairs & Marketing
4. Sales Force Effectiveness
5. Management
6. Training Programs