setting goals and choosing metrics for recommender system ...ceur-ws.org/vol-811/paper12.pdf ·...
TRANSCRIPT
Setting Goals and Choosing Metrics for Recommender
System Evaluations
Gunnar SchröderT-Systems Multimedia Solutions GmbH
Riesaer Straße 501129 Dresden, Germany
Maik Thiele, Wolfgang LehnerDresden University of Technology
Faculty of Computer Science, DatabaseTechnology Group
01062 Dresden, Germany{maik.thiele,wolfgang.lehner}
@tu-dresden.de
ABSTRACTRecommender systems have become an important person-alization technique on the web and are widely used espe-cially in e-commerce applications. However, operators ofweb shops and other platforms are challenged by the largevariety of available algorithms and the multitude of theirpossible parameterizations. Since the quality of the recom-mendations that are given can have a significant businessimpact, the selection of a recommender system should bemade based on well-founded evaluation data. The literatureon recommender system evaluation o↵ers a large variety ofevaluation metrics but provides little guidance on how tochoose among them. This paper focuses on the often ne-glected aspect of clearly defining the goal of an evaluationand how this goal relates to the selection of an appropriatemetric. We discuss several well-known accuracy metrics andanalyze how these reflect di↵erent evaluation goals. Further-more we present some less well-known metrics as well as avariation of the area under the curve measure that are par-ticularly suitable for the evaluation of recommender systemsin e-commerce applications.
Categories and Subject DescriptorsH.4 [Information Systems Applications]: Miscellaneous;D.2.8 [Software Engineering]: Metrics—complexity mea-sures, performance measures
General TermsTheory
Keywordsrecommender systems, e-commerce, evaluation, metrics, mea-sure, area under the curve, auc, informedness, markedness,matthews correlation, precision, recall, roc
1. INTRODUCTIONThere is a large variety of algorithms for recommender
systems that were published in research and have been im-plemented by the industry. Almost every author claims thata particular algorithm or implementation is superior to an-other in a certain respect, which makes it di�cult to chooseamong them. Currently a comprehensive and objective com-parison of existing recommender systems is hard to find and
the available results are sometimes contradictory for di↵er-ent data sets or metrics. How e�cient and successful a spe-cific recommender system is also depends on the specificpurpose of a recommender system and the characteristics ofthe domain it is applied to. It is very unlikely that there is asingle best solution for any domain and context. If we wantto increase the e↵ectiveness of recommendations we have todetermine the best fit for a given scenario through thoroughevaluation of available algorithms and parameterizations.This is particularly important for the usage of recommendersystems in e-commerce applications where the choice of al-gorithms can have a significant business impact. In a webshop a better recommender system can have a direct e↵ecton the company’s revenue since the recommendations cansignificantly influence the users’ buying decisions [15].The research that is presented in this paper is derived froman evaluation of various recommendation algorithms that weconducted for a large German e-commerce portal. In orderto achieve meaningful evaluation results we developed anevaluation methodology and went through a wide range ofliterature on the evaluation of recommender systems and in-formation retrieval systems and developed a framework forthe evaluation of recommender systems.In this paper we will focus on the specific evaluation de-mands of recommender systems in e-commerce applications.We discuss the importance of defining a su�ciently detailedgoal and analyze which aspects of the recommender’s userinterface and the used preference data influence a reasonablechoice of metrics. We give an overview of applicable accu-racy metrics, explain how to choose among the large varietyand highlight some metrics that are particularly well-suitedto the evaluation of recommender systems. In order to dis-cuss accuracy metrics in detail a discussion of non-accuracymeasures has to be omitted due to space constraints.
2. RELATED WORKOver time numerous quantitative metrics and qualitative
techniques for o✏ine and online evaluations of recommendersystems have been published in research. We will start bygiving a short overview of some of the most important pub-lications that are relevant to this paper.Herlocker et al. provide a comprehensive overview of the ex-isting methods for evaluating collaborative filtering systems[9]. Although they focus on collaborative filtering meth-ods, many of the presented evaluation approaches, metricsand techniques are applicable to other types of recommender
78
systems as well. They conducted an insightful study on thecorrelation of di↵erent metrics and concluded that the ana-lyzed metrics can be subdivided in three major classes.Olmo and Gaudioso build on this survey and derive a frame-work for recommender systems that divides recommendersystems into a filter and a guide component [4]. Their aimis to separate the calculation of recommendations from theirpresentation. They propose to use metrics that focus on thefact whether the recommendations presented by the systemare actually followed by the users of the recommender sys-tem and suggest to pay more attention to the presentationof recommendations as well as the respective objective ofrecommender systems.Cremonesi and Lentini present an evaluation methodologyfor collaborative filtering recommender systems [2]. Theyuse mean squared error, root mean squared error (RMSE)and mean absolute error (MAE) as well as the classifica-tion accuracy metrics precision, recall, f-measure and ROCgraphs to compare two collaborative filtering algorithms us-ing the MovieLens1 data set and a further movie data setobtained from an IPTV service provider.Konstan et al. summarize findings about the usage of auto-mated recommender systems for information-seeking tasks[12]. They list many problems and challenges in evaluat-ing recommender systems and emphasize the importanceof standardized evaluation methodologies, metrics and testdata sets for progress in research.Kohavi et al. provide a survey and practical guide for con-ducting controlled experiments on the web [11]. In a follow-up paper Crook et al. describe common pitfalls they experi-enced and emphasize the importance of choosing an overallevaluation criterion that truly reflects business goals [3].Jannach et al. provide a chapter on evaluating recommendersystems in their book [10]. They review the current stateof research and survey the approaches taken in publishedpapers on the evaluation of recommender systems.Shani and Gunawardana contributed a chapter on evaluat-ing recommender systems to the handbook by Ricci et al.[14] and describe the most important aspects in conductingo✏ine and online experiments as well as user studies. Theyoutline basic approaches for all three types of evaluations,some important accuracy metrics and discuss various otherproperties of recommenders that should be considered whenevaluating recommenders.A further valuable source for metrics and measures is theliterature on information retrieval. It is, by its very nature,concerned with the quality of search results and providesinsight into evaluation methodologies and metrics (e.g.[5]).
The evaluation of recommender systems has emerged asan important topic as more and more algorithms and tech-niques for recommenders systems are presented. Many dif-ferent evaluation metrics can be applied in evaluations, al-though some (e.g. RMSE, MAE and precision) are morefrequently used than others. However, authors rarely justifytheir particular choice and little guidance is o↵ered on howto choose a metric for a specific purpose. Some notable ex-ceptions are the comparison of metrics given by Herlocker etal. [9] and the overview by Jannach et al. [10]. In this pa-per we try to provide the reader with a better understandingof the existing accuracy metrics and how to apply them inorder to evaluate recommenders for specific goals.
1
http://www.grouplens.org/node/73
3. SETTING THE EVALUATION GOALThe first step of an evaluation should be to define its goal
as precisely as possible. Although this seems rather obvious,we would like to emphasize this step since it is often not ex-ecuted with su�cient care in evaluations in general. We canonly choose one or several adequate metrics and interprettheir results, if we have set the purpose of our evaluationbeforehand. The results of popular evaluation metrics suchas RMSE, precision or F
1
-measure do not necessarily lead usto the best algorithm for our purpose, as we try to illustratelater on. Only if the set of metrics accurately reflects thespecific objectives that are connected to the recommendersystem in our evaluation and the concrete usage scenario,can we be sure that the obtained results are useful [11, 3].Moreover, the specific interface choice for the recommendersystem and the usage patterns that are to be expected shouldbe taken into account. Such a precise evaluation goal couldbe: Find the recommendation algorithm and parameteri-zation that leads to the highest overall turnover on a spe-cific e-commerce web site, if four product recommendationsare displayed as a vertical list below the currently displayedproduct.
3.1 Objectives for Recommender UsageHaving a clear conception of the objectives we want to
achieve by designing, implementing or applying a recom-mender system is a worthwhile e↵ort, even if we recognizethat it may be too di�cult or expensive to measure themaccurately. In many cases we may discover that only theresults of a large scale field study would accurately reflectour evaluation goal. Nevertheless a defined goal will helpus in selecting the most appropriate metric or set of metricsthat allows us to obtain the most precise measurement ofthe recommender’s suitability for the usage scenario whichcan be achieved with a reasonable e↵ort.Common reasons for implementing a recommender systemare the desire to improve user satisfaction and to increasethe economic success of a platform. Although both goalsare interrelated they may be competing in some scenarios.As an example, in e-commerce a recommender may eitherdetermine the top recommendations based on the best price-performance ratio for the customer but it may also show theproducts that are likely to lead to the highest revenue forthe business. For this purpose commercial recommendersfor web shops often consider a reward attribute for itemsthat models how much the company profits from a sale of acertain item. This information can be used e.g. in combina-tion with classification accuracy metrics (see Section 4.2).A recommender system in a live environment usually hasto be optimized with regard to various other objectives thatare related to the technical performance and the system’s lifecycle such as responsiveness, scalability, peak load, reliabil-ity, ramp-up e↵orts, maintainability, extensibility and costof ownership [10]. These aspects have a strong influence onthe decision among a set of algorithms and implementationsand put further constraints on a choice. Further aspectsthat extend beyond the accuracy of a recommender are cov-erage, novelty, serendipity, confidence, persuasiveness, trust,robustness, security and many more (cf. [9, 14]). Measuringthese diverse qualities of a recommender system is a largefield that is beyond the scope of the presented work. Wewill confine our analysis to accuracy metrics and attempt toanalyze how di↵erent measures reflect varying objectives.
79
3.2 Analyzing the Recommender System andits Data
In order to further specify our evaluation goal we have totake a closer look at the recommender’s task, its interfaceand the utilized data.What is the recommender’s task and how does thesystem interact with the user? In our opinion themost common usage scenarios for recommender systems areprediction, ranking and classification tasks which manifestthemselves in di↵erent types of user interfaces.In a prediction task the focus lies on predicting ratings forunrated items (e.g. movies, music or news articles) of a userand showing these predictions to him. For example, a movierental company might show predicted ratings to users in or-der to aid them in their decision making.In a ranking task the recommender tries to determine an or-der of items, often with the purpose of creating a top-k listof items. This task is particularly common in e-commerceapplications, where a top-k or unlimited ordered list of rec-ommended products is shown in a sidebar or on a dedicatedpage. But also web portals for news, content and multi-media make heavy use of top-k lists. A further interestingranking task for a recommender is to order a limited set ofsearch results according the user’s predicted preference.In a classification task the recommender determines a setwith a limited (often fixed) number of recommended itemswith no particular order among them implied. E.g. articlesor products that are predicted to be of interest to a user arehighlighted or annotated on a web page. A top-k list of rec-ommended items can be seen as a classification task as well,especially if the number of items is very small and the orderis less prominent e.g. recommended items are arranged in agrid or scrollable in two directions in a circular fashion (cf.Amazon).Recommender systems are further used to determine simi-lar items or similar users. E.g. in web shops on a productdetail page usually a list of similar products is shown or anews web site often lists articles similar to the one currentlyshown. Recommending similar users is of particular interestfor social web applications such as Facebook. These taskswhich focus on the items and users themselves instead of theuser’s ratings, can be seen as ranking or classification tasksdepending on the chosen interface.Realizing for which of these tasks the recommender systemis used and what the user interface looks like is important forchoosing the most appropriate metric. The number of dis-played recommendations and their visual arrangement (Towhich extent does it convey a ranking?) should also be con-sidered before choosing a metric. In many usage scenariosmore than one of these tasks has to be fulfilled by a rec-ommender system. Therefore it may be sensible to applyone accuracy metric for each of the usage scenarios to finda reasonable compromise or to even consider using di↵erentrecommendation algorithms for each task.What kind of user preference data is used by therecommender? The preferences of a user can be gatheredeither through explicit or implicit ratings. While an explicitrating is made as a deliberate statement by a user who hasthe intention to express his or her opinion, an implicit rat-ing is deducted from actions of the user that had a di↵erentprimary goal. If, for example, a user rates a movie on a website, this is a direct expression of his or her opinion and pref-erences, so we consider it an explicit rating. Purchasing a
product or clicking on a link to display an article usually hasa di↵erent primary goal than expressing a positive rating, sothese actions are considered an implicit rating.
The user ratings are usually collected using either a nu-merical, a binary or a unary rating scale. Although otherpreference models such as textual reviews are conceivablethey are rarely used in today’s recommender systems.A numerical rating is represented by a number from eithera discrete or a continuous rating scale, in most cases witha limited range. Typical examples of a discrete rating scaleare ratings on a scale from zero to five stars or Likert re-sponse scales that are commonly used in questionnaires. Tobe precise, these rating scales are actually ordinal scales, afact which is ignored by predictive accuracy metrics (cf. 4.1)that make intensive use of ratios. An example of a contin-uous rating scale could be a slider that is set by a user andtranslated to a real value.A binary rating scale allows users to assign items to two dif-ferent classes (like/dislike). YouTube, for example, allowsusers to rate movies with either thumb up or thumb down.A unary rating, by contrast, allows users to assign items onlyto a single class, which is in most cases positive (e.g. like).A prominent example of an explicit unary rating is Face-book’s “Like”-button. Implicit unary ratings can be pur-chased products in a web shop or clicked links on a newspage.The important di↵erence between binary and unary rat-ings is that unary ratings o↵er no distinction between dis-liked and unrated items. With unary ratings we cannot tellwhether a user actually dislikes an item or simply does notknow the item or does not bother to rate it. In a largeweb shop, such as Amazon, a customer will only be awareof a small portion of the product catalog. Furthermore,other factors such as limited budget, limited time, externalconstraints, and products the user already owns determinewhether a customer will actually buy a product he or shelikes. Being aware of this di↵erence and the implied biases isimportant when conducting an evaluation and interpretingthe results of various metrics.
4. OVERVIEW OF EVALUATION METRICSEvaluation metrics for recommender systems can be di-
vided into four major classes [9, 4]: 1) Predictive accuracymetrics, 2) Classification accuracy metrics, 3) Rank accu-racy metrics and 4) Non-accuracy metrics. Since we confineour analysis to accuracy metrics we will omit the discus-sion of this class and suggest to consult the literature (e.g.[9, 14]).
4.1 Predictive Accuracy MetricsPredictive accuracy or rating prediction metrics embark on
the question of how close the ratings estimated by a recom-mender are to the true user ratings. This type of measuresis very popular for the evaluation of non-binary ratings. Itis most appropriate for usage scenarios in which an accurateprediction of the ratings for all items is of high importance.The most important representatives of this class are meanabsolute error (MAE),mean squared error (MSE), root meansquared error (RMSE) and normalized mean absolute error(NMAE) (cf. [9, 8]). MSE and RMSE use the squared de-viations and thus emphasize larger errors in comparison tothe MAE metric. MAE and RMSE describe the error inthe same units as the computed values, while MSE yields
80
squared units. NMAE normalizes the MAE metric to therange of the respective rating scale in order to make resultscomparable among recommenders with varying rating scales.The RMSE metric has been used in the Netflix competitionin order to determine the improvement in comparison to theCinematch algorithm as well as the prize winner. This wasa significant source of discussion over the course of the com-petition.These predictive accuracy error metrics are frequently usedfor the evaluation of recommender systems since they areeasy to compute and understand. They are well-studied andare also applied in many contexts other than recommendersystems. However, they do not necessarily correspond di-rectly to the most popular usage scenarios for recommendersystems. There are few cases where users are in fact in-terested in the overall prediction accuracy. Recommendersystems are more commonly used to display a limited listof top ranked items or the set of all items that have beenrated above a certain threshold. Many recommendation al-gorithms are able to provide more accurate statements abouta limited set of items that the user either likes or dislikes.The estimations for many other items are rather inaccuratebut often also significantly less important to users.This applies in particular to e-commerce applications wherewe are usually more concerned with suggesting some prod-ucts to customers that they will like in comparison to es-timating the most accurate ratings for the large amount ofitems that customers would never purchase.
4.2 Classification Accuracy MetricsClassification accuracy metrics try to assess the successful
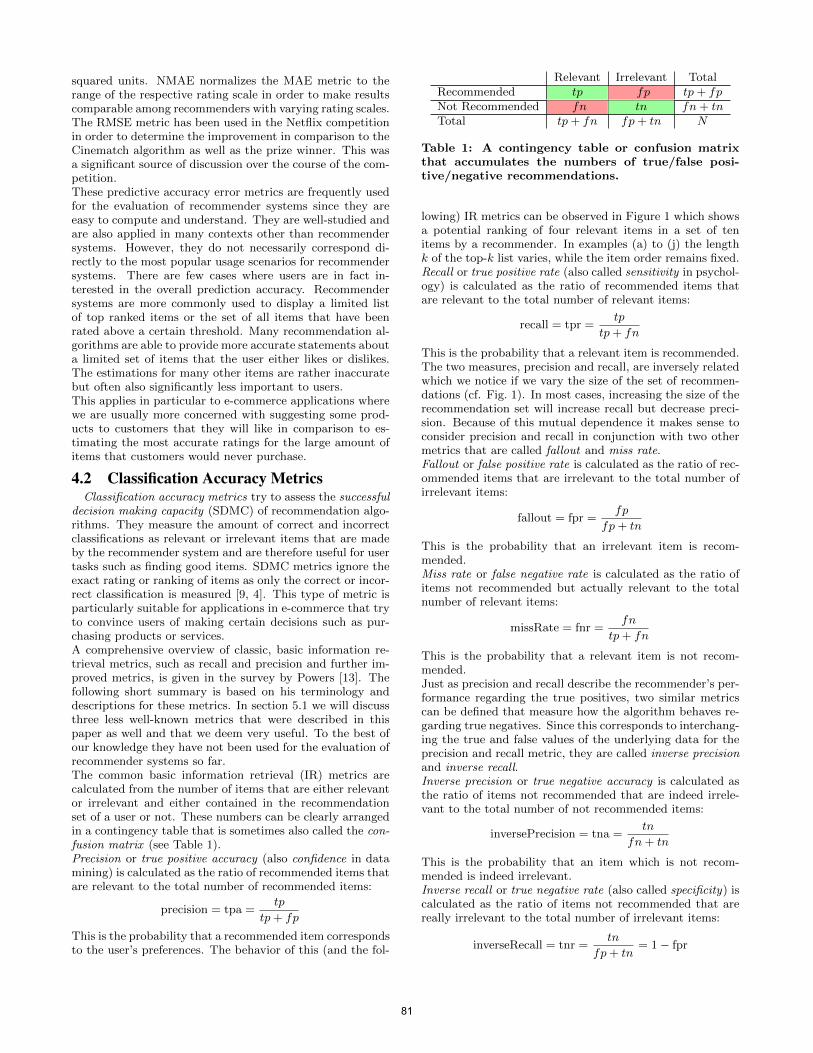
decision making capacity (SDMC) of recommendation algo-rithms. They measure the amount of correct and incorrectclassifications as relevant or irrelevant items that are madeby the recommender system and are therefore useful for usertasks such as finding good items. SDMC metrics ignore theexact rating or ranking of items as only the correct or incor-rect classification is measured [9, 4]. This type of metric isparticularly suitable for applications in e-commerce that tryto convince users of making certain decisions such as pur-chasing products or services.A comprehensive overview of classic, basic information re-trieval metrics, such as recall and precision and further im-proved metrics, is given in the survey by Powers [13]. Thefollowing short summary is based on his terminology anddescriptions for these metrics. In section 5.1 we will discussthree less well-known metrics that were described in thispaper as well and that we deem very useful. To the best ofour knowledge they have not been used for the evaluation ofrecommender systems so far.The common basic information retrieval (IR) metrics arecalculated from the number of items that are either relevantor irrelevant and either contained in the recommendationset of a user or not. These numbers can be clearly arrangedin a contingency table that is sometimes also called the con-fusion matrix (see Table 1).Precision or true positive accuracy (also confidence in datamining) is calculated as the ratio of recommended items thatare relevant to the total number of recommended items:
precision = tpa =tp
tp+ fp
This is the probability that a recommended item correspondsto the user’s preferences. The behavior of this (and the fol-
Relevant Irrelevant TotalRecommended tp fp tp+ fpNot Recommended fn tn fn+ tnTotal tp+ fn fp+ tn N
Table 1: A contingency table or confusion matrixthat accumulates the numbers of true/false posi-tive/negative recommendations.
lowing) IR metrics can be observed in Figure 1 which showsa potential ranking of four relevant items in a set of tenitems by a recommender. In examples (a) to (j) the lengthk of the top-k list varies, while the item order remains fixed.Recall or true positive rate (also called sensitivity in psychol-ogy) is calculated as the ratio of recommended items thatare relevant to the total number of relevant items:
recall = tpr =tp
tp+ fn
This is the probability that a relevant item is recommended.The two measures, precision and recall, are inversely relatedwhich we notice if we vary the size of the set of recommen-dations (cf. Fig. 1). In most cases, increasing the size of therecommendation set will increase recall but decrease preci-sion. Because of this mutual dependence it makes sense toconsider precision and recall in conjunction with two othermetrics that are called fallout and miss rate.Fallout or false positive rate is calculated as the ratio of rec-ommended items that are irrelevant to the total number ofirrelevant items:
fallout = fpr =fp
fp+ tn
This is the probability that an irrelevant item is recom-mended.Miss rate or false negative rate is calculated as the ratio ofitems not recommended but actually relevant to the totalnumber of relevant items:
missRate = fnr =fn
tp+ fn
This is the probability that a relevant item is not recom-mended.Just as precision and recall describe the recommender’s per-formance regarding the true positives, two similar metricscan be defined that measure how the algorithm behaves re-garding true negatives. Since this corresponds to interchang-ing the true and false values of the underlying data for theprecision and recall metric, they are called inverse precisionand inverse recall.Inverse precision or true negative accuracy is calculated asthe ratio of items not recommended that are indeed irrele-vant to the total number of not recommended items:
inversePrecision = tna =tn
fn+ tn
This is the probability that an item which is not recom-mended is indeed irrelevant.Inverse recall or true negative rate (also called specificity) iscalculated as the ratio of items not recommended that arereally irrelevant to the total number of irrelevant items:
inverseRecall = tnr =tn
fp+ tn= 1� fpr
81
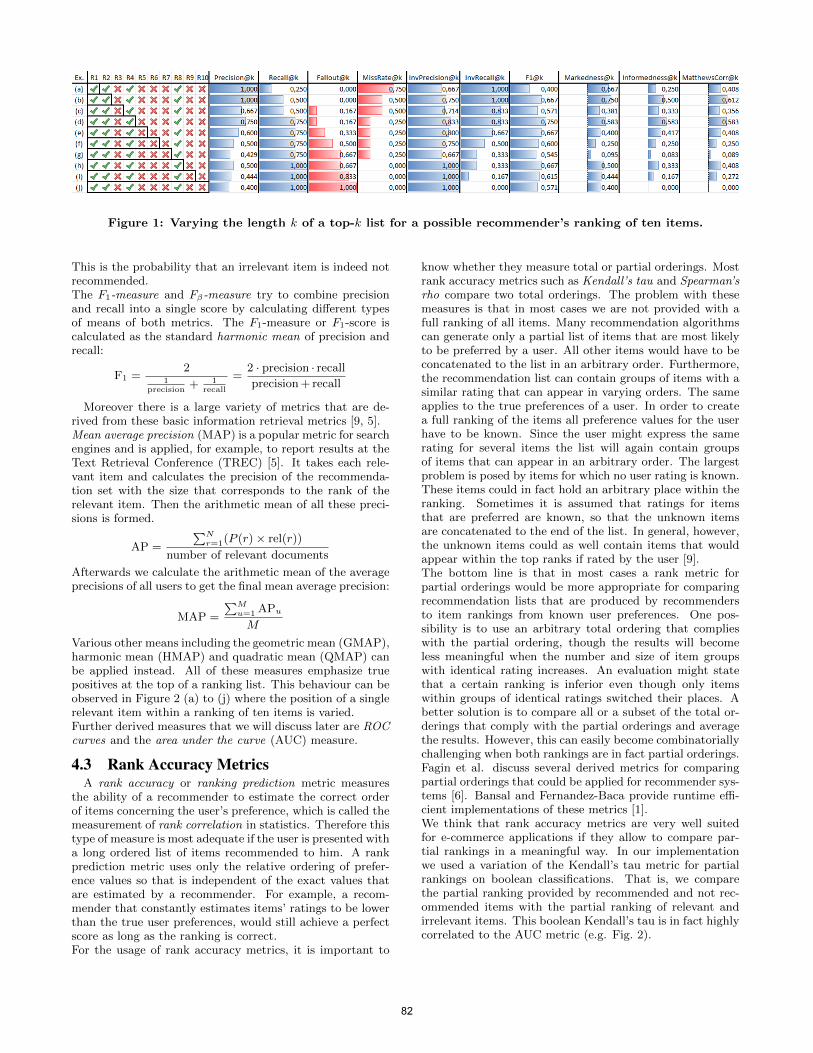
Figure 1: Varying the length k of a top-k list for a possible recommender’s ranking of ten items.
This is the probability that an irrelevant item is indeed notrecommended.The F
1
-measure and F�-measure try to combine precisionand recall into a single score by calculating di↵erent typesof means of both metrics. The F
1
-measure or F1
-score iscalculated as the standard harmonic mean of precision andrecall:
F1
=2
1
precision
+ 1
recall
=2 · precision · recallprecision+ recall
Moreover there is a large variety of metrics that are de-rived from these basic information retrieval metrics [9, 5].Mean average precision (MAP) is a popular metric for searchengines and is applied, for example, to report results at theText Retrieval Conference (TREC) [5]. It takes each rele-vant item and calculates the precision of the recommenda-tion set with the size that corresponds to the rank of therelevant item. Then the arithmetic mean of all these preci-sions is formed.
AP =
PNr=1
(P (r)⇥ rel(r))
number of relevant documents
Afterwards we calculate the arithmetic mean of the averageprecisions of all users to get the final mean average precision:
MAP =
PMu=1
APu
M
Various other means including the geometric mean (GMAP),harmonic mean (HMAP) and quadratic mean (QMAP) canbe applied instead. All of these measures emphasize truepositives at the top of a ranking list. This behaviour can beobserved in Figure 2 (a) to (j) where the position of a singlerelevant item within a ranking of ten items is varied.Further derived measures that we will discuss later are ROCcurves and the area under the curve (AUC) measure.
4.3 Rank Accuracy MetricsA rank accuracy or ranking prediction metric measures
the ability of a recommender to estimate the correct orderof items concerning the user’s preference, which is called themeasurement of rank correlation in statistics. Therefore thistype of measure is most adequate if the user is presented witha long ordered list of items recommended to him. A rankprediction metric uses only the relative ordering of prefer-ence values so that is independent of the exact values thatare estimated by a recommender. For example, a recom-mender that constantly estimates items’ ratings to be lowerthan the true user preferences, would still achieve a perfectscore as long as the ranking is correct.For the usage of rank accuracy metrics, it is important to
know whether they measure total or partial orderings. Mostrank accuracy metrics such as Kendall’s tau and Spearman’srho compare two total orderings. The problem with thesemeasures is that in most cases we are not provided with afull ranking of all items. Many recommendation algorithmscan generate only a partial list of items that are most likelyto be preferred by a user. All other items would have to beconcatenated to the list in an arbitrary order. Furthermore,the recommendation list can contain groups of items with asimilar rating that can appear in varying orders. The sameapplies to the true preferences of a user. In order to createa full ranking of the items all preference values for the userhave to be known. Since the user might express the samerating for several items the list will again contain groupsof items that can appear in an arbitrary order. The largestproblem is posed by items for which no user rating is known.These items could in fact hold an arbitrary place within theranking. Sometimes it is assumed that ratings for itemsthat are preferred are known, so that the unknown itemsare concatenated to the end of the list. In general, however,the unknown items could as well contain items that wouldappear within the top ranks if rated by the user [9].The bottom line is that in most cases a rank metric forpartial orderings would be more appropriate for comparingrecommendation lists that are produced by recommendersto item rankings from known user preferences. One pos-sibility is to use an arbitrary total ordering that complieswith the partial ordering, though the results will becomeless meaningful when the number and size of item groupswith identical rating increases. An evaluation might statethat a certain ranking is inferior even though only itemswithin groups of identical ratings switched their places. Abetter solution is to compare all or a subset of the total or-derings that comply with the partial orderings and averagethe results. However, this can easily become combinatoriallychallenging when both rankings are in fact partial orderings.Fagin et al. discuss several derived metrics for comparingpartial orderings that could be applied for recommender sys-tems [6]. Bansal and Fernandez-Baca provide runtime e�-cient implementations of these metrics [1].We think that rank accuracy metrics are very well suitedfor e-commerce applications if they allow to compare par-tial rankings in a meaningful way. In our implementationwe used a variation of the Kendall’s tau metric for partialrankings on boolean classifications. That is, we comparethe partial ranking provided by recommended and not rec-ommended items with the partial ranking of relevant andirrelevant items. This boolean Kendall’s tau is in fact highlycorrelated to the AUC metric (e.g. Fig. 2).
82
5. IMPROVED METRICS FORRECOMMENDER SYSTEMS
5.1 Informedness, Markedness and MatthewsCorrelation
A major problem with the frequently used metrics preci-sion, recall and F
1
-measure is that they su↵er from severebiases. The outcome of these measures not only depends onthe accuracy of the recommender (or classifier) but also verymuch on the ratio of relevant items. In order to illustratethis we imagine an ideal recommender and its inverse andapply them to generate top-k lists of four items for varyingratios of relevant items (see Fig. 3). The examples showthat the informatory value of all three measures varies. Inextreme cases with a highly skewed ratio its value can beeven misleading (cf. Fig. 3 e – h).To solve this problem Powers [13] introduced three new met-rics that try avoid these biases by integrating the inverseprecision and inverse recall respectively.Markedness combines precision and inverse precision into asingle measure and expresses how marked the classificationsof a recommender are in comparison to chance:
markedness = precision+ inversePrecision�1
=tp
tp+ fp+
tnfn+ tn
� 1
Informedness combines recall and inverse recall into a singlemeasure and expresses how informed the classifications of arecommender are in comparison to chance:
informedness = recall + inverseRecall�1
=tp
tp+ fn+
tnfp+ tn
� 1
Both markedness and informedness return values in the range[�1, 1].The Matthews Correlation combines the informedness andmarkedness measures into a single metric by calculatingtheir geometric mean:
correlation =(tp · tn)� (fp · fn)p
(tp+ fn) · (fp+ tn) · (tp+ fp) · (fn+ tn)
= ±pinformedness ·markedness
The range of the Matthews Correlation is [�1, 1], so the signin the second representation of the formula actually dependson the respective signs for markedness and informedness.We propose to replace the measures precision and recall bymarkedness and informedness for most evaluation purposesin order to avoid being misled by underlying biases. Aswe can see in Figures 1 and 3, markedness, informednessand Matthews Correlation are significantly more helpful inchoosing an adequate size for a top-k recommendation list.Furthermore derived metrics such as mean average precision(MAP) could as well be replaced by their respective equiv-alents (e.g. mean average markedness).
5.2 Limited Area Under the CurveROC curves provide a graphical representation for the
performance of a recommender system, an information re-trieval system or any other type of binary classifier. A ROCcurve plots recall (true positive rate) against fallout (falsepositive rate) for increasing recommendation set size. An
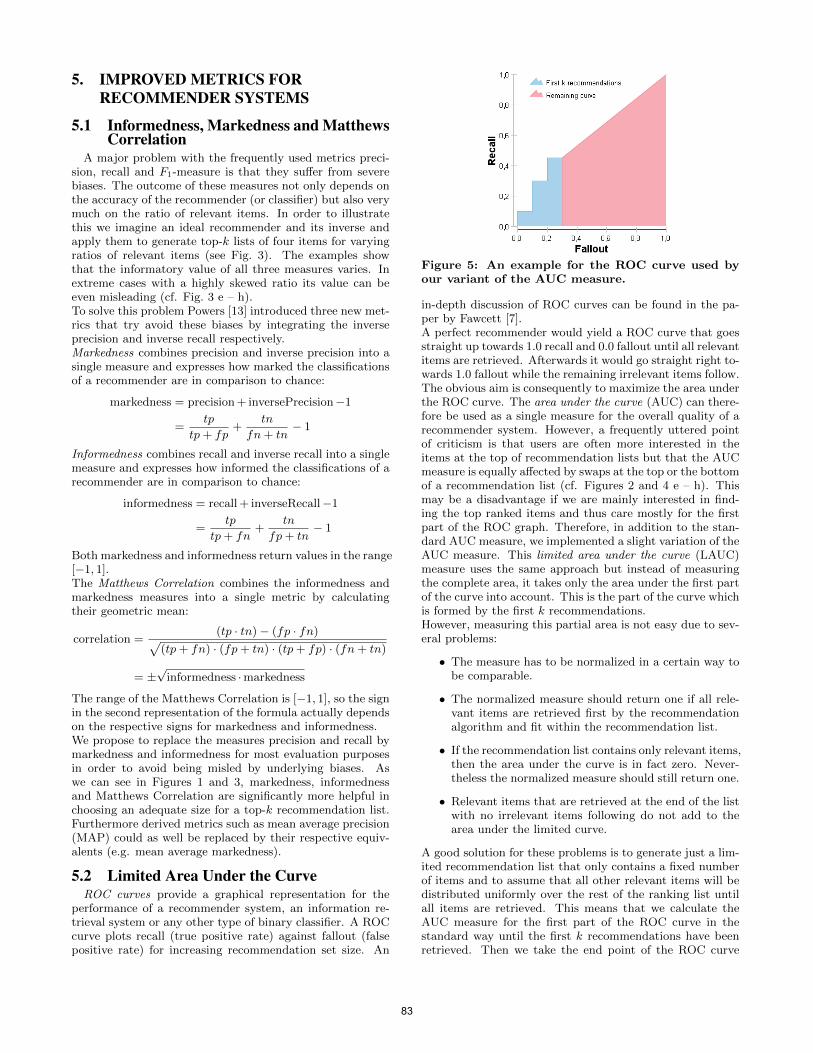
Figure 5: An example for the ROC curve used byour variant of the AUC measure.
in-depth discussion of ROC curves can be found in the pa-per by Fawcett [7].A perfect recommender would yield a ROC curve that goesstraight up towards 1.0 recall and 0.0 fallout until all relevantitems are retrieved. Afterwards it would go straight right to-wards 1.0 fallout while the remaining irrelevant items follow.The obvious aim is consequently to maximize the area underthe ROC curve. The area under the curve (AUC) can there-fore be used as a single measure for the overall quality of arecommender system. However, a frequently uttered pointof criticism is that users are often more interested in theitems at the top of recommendation lists but that the AUCmeasure is equally a↵ected by swaps at the top or the bottomof a recommendation list (cf. Figures 2 and 4 e – h). Thismay be a disadvantage if we are mainly interested in find-ing the top ranked items and thus care mostly for the firstpart of the ROC graph. Therefore, in addition to the stan-dard AUC measure, we implemented a slight variation of theAUC measure. This limited area under the curve (LAUC)measure uses the same approach but instead of measuringthe complete area, it takes only the area under the first partof the curve into account. This is the part of the curve whichis formed by the first k recommendations.However, measuring this partial area is not easy due to sev-eral problems:
• The measure has to be normalized in a certain way tobe comparable.
• The normalized measure should return one if all rele-vant items are retrieved first by the recommendationalgorithm and fit within the recommendation list.
• If the recommendation list contains only relevant items,then the area under the curve is in fact zero. Never-theless the normalized measure should still return one.
• Relevant items that are retrieved at the end of the listwith no irrelevant items following do not add to thearea under the limited curve.
A good solution for these problems is to generate just a lim-ited recommendation list that only contains a fixed numberof items and to assume that all other relevant items will bedistributed uniformly over the rest of the ranking list untilall items are retrieved. This means that we calculate theAUC measure for the first part of the ROC curve in thestandard way until the first k recommendations have beenretrieved. Then we take the end point of the ROC curve
83
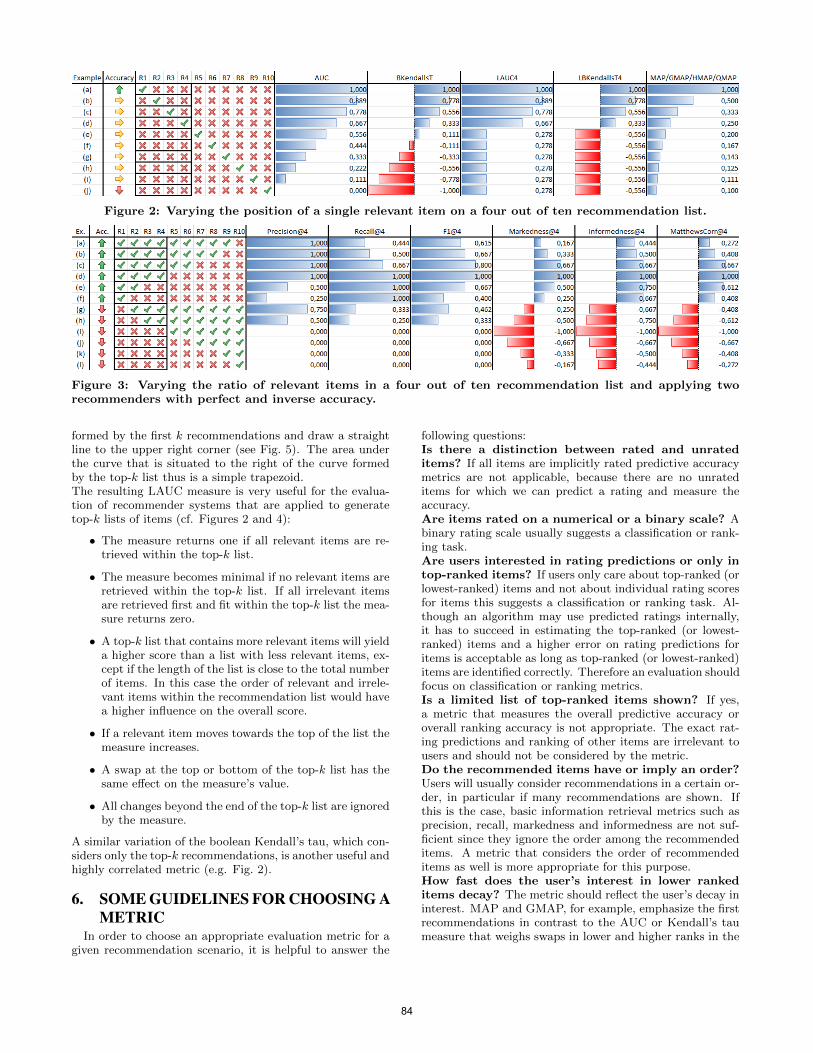
Figure 2: Varying the position of a single relevant item on a four out of ten recommendation list.
Figure 3: Varying the ratio of relevant items in a four out of ten recommendation list and applying tworecommenders with perfect and inverse accuracy.
formed by the first k recommendations and draw a straightline to the upper right corner (see Fig. 5). The area underthe curve that is situated to the right of the curve formedby the top-k list thus is a simple trapezoid.The resulting LAUC measure is very useful for the evalua-tion of recommender systems that are applied to generatetop-k lists of items (cf. Figures 2 and 4):
• The measure returns one if all relevant items are re-trieved within the top-k list.
• The measure becomes minimal if no relevant items areretrieved within the top-k list. If all irrelevant itemsare retrieved first and fit within the top-k list the mea-sure returns zero.
• A top-k list that contains more relevant items will yielda higher score than a list with less relevant items, ex-cept if the length of the list is close to the total numberof items. In this case the order of relevant and irrele-vant items within the recommendation list would havea higher influence on the overall score.
• If a relevant item moves towards the top of the list themeasure increases.
• A swap at the top or bottom of the top-k list has thesame e↵ect on the measure’s value.
• All changes beyond the end of the top-k list are ignoredby the measure.
A similar variation of the boolean Kendall’s tau, which con-siders only the top-k recommendations, is another useful andhighly correlated metric (e.g. Fig. 2).
6. SOME GUIDELINES FOR CHOOSING AMETRIC
In order to choose an appropriate evaluation metric for agiven recommendation scenario, it is helpful to answer the
following questions:Is there a distinction between rated and unrateditems? If all items are implicitly rated predictive accuracymetrics are not applicable, because there are no unrateditems for which we can predict a rating and measure theaccuracy.Are items rated on a numerical or a binary scale? Abinary rating scale usually suggests a classification or rank-ing task.Are users interested in rating predictions or only intop-ranked items? If users only care about top-ranked (orlowest-ranked) items and not about individual rating scoresfor items this suggests a classification or ranking task. Al-though an algorithm may use predicted ratings internally,it has to succeed in estimating the top-ranked (or lowest-ranked) items and a higher error on rating predictions foritems is acceptable as long as top-ranked (or lowest-ranked)items are identified correctly. Therefore an evaluation shouldfocus on classification or ranking metrics.Is a limited list of top-ranked items shown? If yes,a metric that measures the overall predictive accuracy oroverall ranking accuracy is not appropriate. The exact rat-ing predictions and ranking of other items are irrelevant tousers and should not be considered by the metric.Do the recommended items have or imply an order?Users will usually consider recommendations in a certain or-der, in particular if many recommendations are shown. Ifthis is the case, basic information retrieval metrics such asprecision, recall, markedness and informedness are not suf-ficient since they ignore the order among the recommendeditems. A metric that considers the order of recommendeditems as well is more appropriate for this purpose.How fast does the user’s interest in lower rankeditems decay? The metric should reflect the user’s decay ininterest. MAP and GMAP, for example, emphasize the firstrecommendations in contrast to the AUC or Kendall’s taumeasure that weighs swaps in lower and higher ranks in the
84
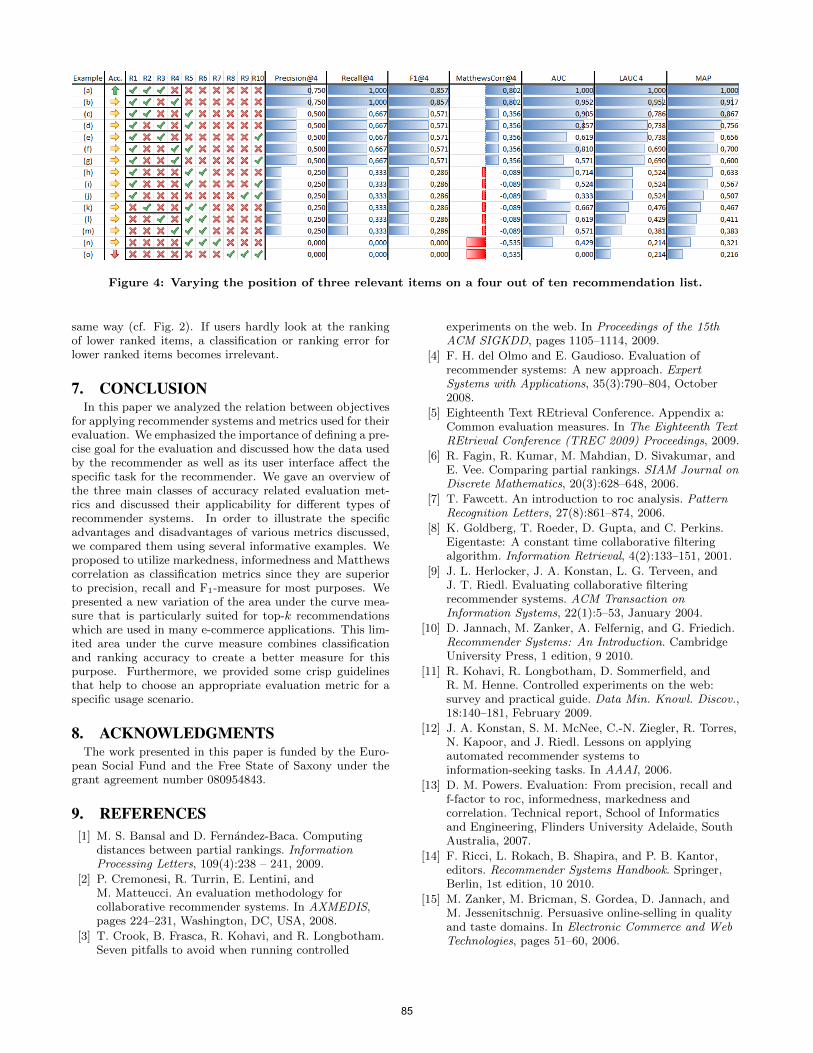
Figure 4: Varying the position of three relevant items on a four out of ten recommendation list.
same way (cf. Fig. 2). If users hardly look at the rankingof lower ranked items, a classification or ranking error forlower ranked items becomes irrelevant.
7. CONCLUSIONIn this paper we analyzed the relation between objectives
for applying recommender systems and metrics used for theirevaluation. We emphasized the importance of defining a pre-cise goal for the evaluation and discussed how the data usedby the recommender as well as its user interface a↵ect thespecific task for the recommender. We gave an overview ofthe three main classes of accuracy related evaluation met-rics and discussed their applicability for di↵erent types ofrecommender systems. In order to illustrate the specificadvantages and disadvantages of various metrics discussed,we compared them using several informative examples. Weproposed to utilize markedness, informedness and Matthewscorrelation as classification metrics since they are superiorto precision, recall and F
1
-measure for most purposes. Wepresented a new variation of the area under the curve mea-sure that is particularly suited for top-k recommendationswhich are used in many e-commerce applications. This lim-ited area under the curve measure combines classificationand ranking accuracy to create a better measure for thispurpose. Furthermore, we provided some crisp guidelinesthat help to choose an appropriate evaluation metric for aspecific usage scenario.
8. ACKNOWLEDGMENTSThe work presented in this paper is funded by the Euro-
pean Social Fund and the Free State of Saxony under thegrant agreement number 080954843.
9. REFERENCES[1] M. S. Bansal and D. Fernandez-Baca. Computing
distances between partial rankings. InformationProcessing Letters, 109(4):238 – 241, 2009.
[2] P. Cremonesi, R. Turrin, E. Lentini, andM. Matteucci. An evaluation methodology forcollaborative recommender systems. In AXMEDIS,pages 224–231, Washington, DC, USA, 2008.
[3] T. Crook, B. Frasca, R. Kohavi, and R. Longbotham.Seven pitfalls to avoid when running controlled
experiments on the web. In Proceedings of the 15thACM SIGKDD, pages 1105–1114, 2009.
[4] F. H. del Olmo and E. Gaudioso. Evaluation ofrecommender systems: A new approach. ExpertSystems with Applications, 35(3):790–804, October2008.
[5] Eighteenth Text REtrieval Conference. Appendix a:Common evaluation measures. In The Eighteenth TextREtrieval Conference (TREC 2009) Proceedings, 2009.
[6] R. Fagin, R. Kumar, M. Mahdian, D. Sivakumar, andE. Vee. Comparing partial rankings. SIAM Journal onDiscrete Mathematics, 20(3):628–648, 2006.
[7] T. Fawcett. An introduction to roc analysis. PatternRecognition Letters, 27(8):861–874, 2006.
[8] K. Goldberg, T. Roeder, D. Gupta, and C. Perkins.Eigentaste: A constant time collaborative filteringalgorithm. Information Retrieval, 4(2):133–151, 2001.
[9] J. L. Herlocker, J. A. Konstan, L. G. Terveen, andJ. T. Riedl. Evaluating collaborative filteringrecommender systems. ACM Transaction onInformation Systems, 22(1):5–53, January 2004.
[10] D. Jannach, M. Zanker, A. Felfernig, and G. Friedich.Recommender Systems: An Introduction. CambridgeUniversity Press, 1 edition, 9 2010.
[11] R. Kohavi, R. Longbotham, D. Sommerfield, andR. M. Henne. Controlled experiments on the web:survey and practical guide. Data Min. Knowl. Discov.,18:140–181, February 2009.
[12] J. A. Konstan, S. M. McNee, C.-N. Ziegler, R. Torres,N. Kapoor, and J. Riedl. Lessons on applyingautomated recommender systems toinformation-seeking tasks. In AAAI, 2006.
[13] D. M. Powers. Evaluation: From precision, recall andf-factor to roc, informedness, markedness andcorrelation. Technical report, School of Informaticsand Engineering, Flinders University Adelaide, SouthAustralia, 2007.
[14] F. Ricci, L. Rokach, B. Shapira, and P. B. Kantor,editors. Recommender Systems Handbook. Springer,Berlin, 1st edition, 10 2010.
[15] M. Zanker, M. Bricman, S. Gordea, D. Jannach, andM. Jessenitschnig. Persuasive online-selling in qualityand taste domains. In Electronic Commerce and WebTechnologies, pages 51–60, 2006.
85