ship’s log reader navigation and
TRANSCRIPT

Navigation andShip’s log reader
15th edition
October 12 – 17, 2021
Navigation and Ship’s Log Reader 2021Race of the Classics for Young Professionals
TABLE OF CONTENT
1. Introduction p. 3
2. The earth p. 4
A layout of the earth p. 4
Latitude and longitude p. 4
3. The sea chart p. 6
Determining latitude and longitude of a position on the chart p. 6
Plotting a position on the chart of a given latitude and longitude p. 6
Determining a course between two positions p. 6
Plotting a course from a given position p. 7
Measuring distances p. 7
4. Drift, current and course calculations p. 9
Drift p. 9
Current p. 9
Course p. 10
5. Log entry / filling out the log p. 12
6. Units, terms and abbreviations p. 13
2
Navigation and Ship’s Log Reader 2021Race of the Classics for Young Professionals
INTRODUCTION
In front of you is the navigational reader that is meant as background information to be used while filling out thelog. The log is an important part of the race. Information from the log will be used for determining the results of amatch. Therefore it is very important that the log is filled out correctly and accurately.
This reader contains information about the earth and how it is displayed on maritime charts. It explains severalaspects of the ship, the effects of wind, tide and the resulting calculations. Should you have any questions afterreading this reader you can contact the Race Officials.
Good luck in the Race of the Classics for Young Professionals!
The Race Officials ROTC YP 2019
Thomas Cornelis (06 16 93 61 91)Alex van de Loo (06 13 73 55 00)Hugo van Basten Batenburg (06 17 26 04 37)
During the ROTC the Race Officials can be reached at 06 16 93 61 91 at times of sailing.
3
Navigation and Ship’s Log Reader 2021Race of the Classics for Young Professionals
THE EARTH
A layout of the earth
The earth has the shape of a flattened sphere. To determine a position on this globe, a system of lines has beenconstructed called meridians and parallels.
A meridian is a line running from pole to pole. One of the special meridians is the Greenwich meridian at 0°.
A parallel runs parallel to the equator. A number of special parallels:● The Equator 0 °;● The Tropic of Cancer 23.5 ° North latitude;● The Tropic of Capricorn 23.5 ° South latitude;● The polar circles 66.5 ° North and South latitude.
If a ship sails from A to B, the position of B should be indicated in relation to the position of A. After all, the shipneeds to set a certain course to arrive at B. This course is an angle measured to a predetermined referencedirection. As a reference one uses a meridian, since it runs from pole to pole. The point where all meridiansconverge on top of the earth is called the North.
The course is the angle the ship has compared to the meridian at its position.
Directions and courses are always given in degrees and in three digits. These three figures are also expressedseparately (also verbal!), eg.:
Course 150 ° (one - five - zero)Course 063 ° (zero - six - three)
Latitude and Longitude
To create a uniform system for determining any position on earth, the earth has been divided into severalsegments. The equator divides the earth horizontally into two parts: the Northern Hemisphere and SouthernHemisphere. To the North are the parallels 0 ° to 90 °, these are designated as North latitude (N). South of theequator are the parallels 0 ° to 90 °, these are designated as South latitude (S).
To divide the earth in the vertical plane into two halves one has taken a specific meridian. The meridian betweennorth and south pole that runs across the English town of Greenwich (East of London), has been called the primemeridian (0 °). If we extend this same line to the other side of the earth, between south and north pole, one hasthe 180 ° meridian. East of the prime meridian are the meridians 0 ° to 180 °, designated East longitude (E). West ofthe prime meridian are the meridians 0 ° to 180 °, designated West longitude (W).
Because a position solely given in whole degrees is not accurate enough, one has to further divide a degree into 60minutes. For even more accuracy a minute has been divided into hundredths of a minute. In some situationsseconds are used. Keep in mind that a minute can consist of 60 seconds (”) or out of 100 hundredths of a minute(’). The difference can be seen in the notation: 52°22,50’ = 52°22’30”. We use the notation that is most commonnowadays, that of minutes and hundredths of a minute. The latitude of a position determines how many degrees, minutes and hundredths this position lies North or Southof the equator. (max = 90 °)
The longitude of a position determines how many degrees, minutes and hundredths this position lies East or Westof the prime meridian. (max = 180 °)
4

Navigation and Ship’s Log Reader 2021Race of the Classics for Young Professionals
In this way one can give any place on earth an exact position. In thisexample, the location of the Westerkerk in Amsterdam is described asfollows:
0 52°22,50’ N004°53,03’ E
If we look at figure 1 we see:A lies on North latitude and East longitude.B lies on North latitude and West longitude.C lies on South latitude and East longitude.D lies on South latitude and West longitude.G lies on North latitude and en 0° longitude.P lies on 0° latitude and East longitude
5

Navigation and Ship’s Log Reader 2021Race of the Classics for Young Professionals
THE SEA CHART
An actual spherical globe would be the truest representation of the Earth, but this would not be useful fornavigation. In order to make a nautical mile equal 1 millimeter, a globe of 7 meters in diameter would be needed.Instead of a globe, charts are used that depict the earth (or parts thereof) as a flat surface. Working with thesemaps / sea charts is called “chart plotting”
In “chart plotting” we distinguish the following main operations:• Determining the latitude and longitude of a position on the chart• Plotting a position on the chart of which latitude and longitude are given• Determining a course between two positions• Plotting a course or bearing line from a given position• Measuring distances
Determining latitude and longitude of aposition on the chartIf we have to determine the latitude of aplace on the chart, we place the draftingcompass/caliper with one point on theposition (please do not pierce the chart)and the other point on the nearest parallel(see Figure 2). Then we move the draftingcompass to the vertical edge of the chartwhere we can read out the latitude.For determining the longitude, we use thenearest meridian (see Figure 3), and wemove the caliper to the horizontal edge of the chart and read out the longitude there.
Plotting a position on the chart of a given latitude and longitude
When we need to plot a position on the chart of which latitude and longitude are known, then we work in theexact opposite sequence to the method described above. We start out by measuring the latitude at the verticaledge of the chart and we plot it from the parallel along a meridian (to keep it straight). We place a navigationaltriangle on the correct latitude and remove the compass for the moment. Now we measure out the longitude atthe horizontal edge of the chart and place the compass along the triangle. With one leg on the meridian, the otherleg of the compass now points to the geographical position.
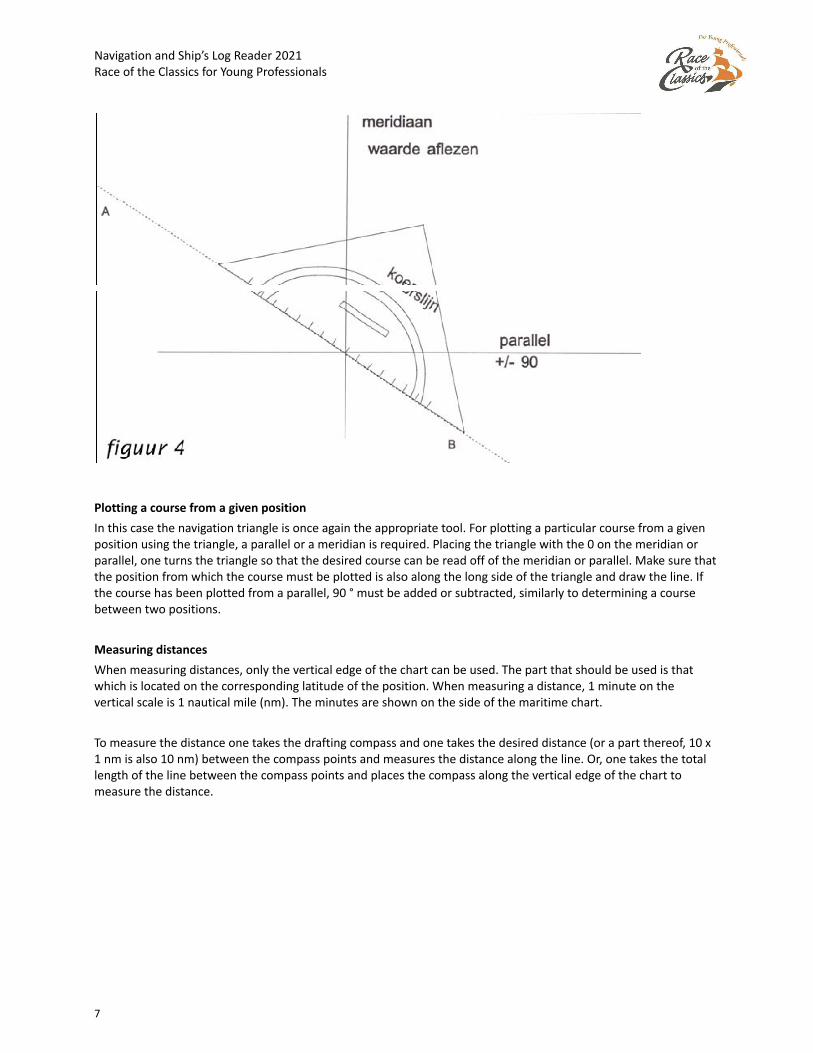
Determining a course between two positionsTo determine the course between two positions, we use a navigation triangle. The navigation triangle is placedalong the course line between positions A and B (see Figure 4) with 0 (center of the triangle) on the meridian. Thecourse from A to B can be read from the protractor on the triangle at the meridian. If no meridian is present, thenplace the triangle with the 0 on a parallel and read the course off the parallel. From a course read-off of a parallel,one needs to add or subtract 90° depending in which direction one has placed the navigation triangle.
6
Navigation and Ship’s Log Reader 2021Race of the Classics for Young Professionals
Plotting a course from a given position
In this case the navigation triangle is once again the appropriate tool. For plotting a particular course from a givenposition using the triangle, a parallel or a meridian is required. Placing the triangle with the 0 on the meridian orparallel, one turns the triangle so that the desired course can be read off of the meridian or parallel. Make sure thatthe position from which the course must be plotted is also along the long side of the triangle and draw the line. Ifthe course has been plotted from a parallel, 90 ° must be added or subtracted, similarly to determining a coursebetween two positions.
Measuring distances
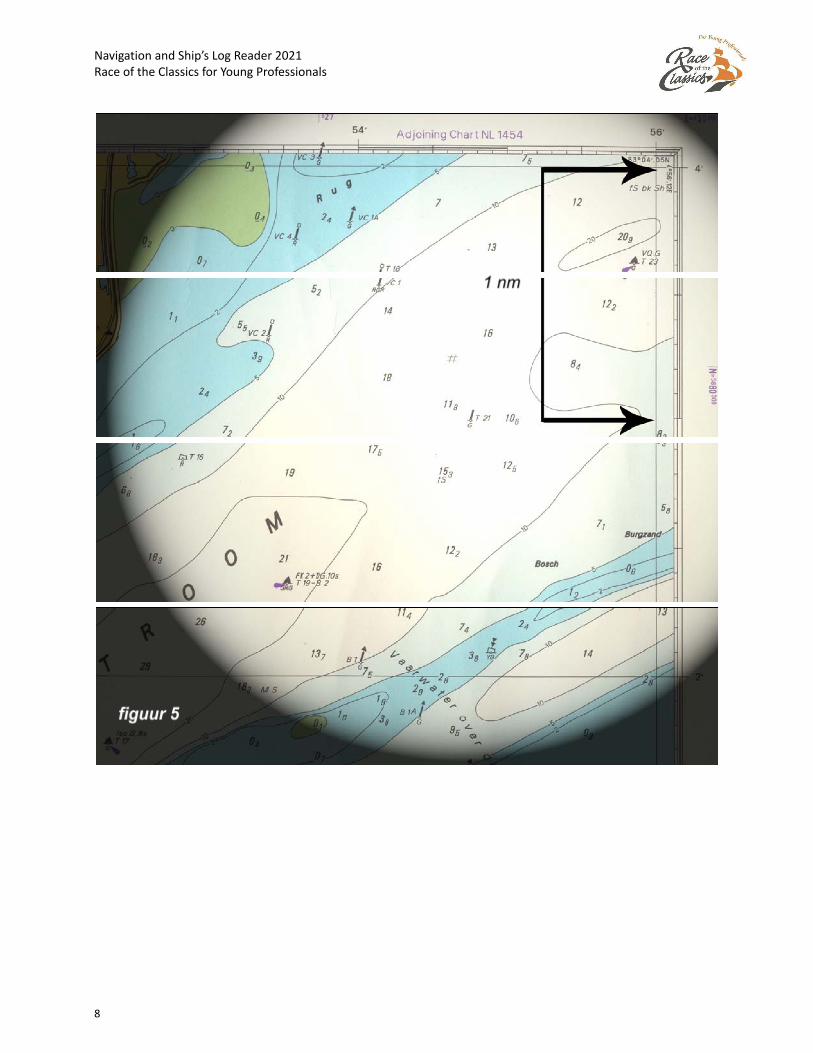
When measuring distances, only the vertical edge of the chart can be used. The part that should be used is thatwhich is located on the corresponding latitude of the position. When measuring a distance, 1 minute on thevertical scale is 1 nautical mile (nm). The minutes are shown on the side of the maritime chart.
To measure the distance one takes the drafting compass and one takes the desired distance (or a part thereof, 10 x1 nm is also 10 nm) between the compass points and measures the distance along the line. Or, one takes the totallength of the line between the compass points and places the compass along the vertical edge of the chart tomeasure the distance.
7
Navigation and Ship’s Log Reader 2021Race of the Classics for Young Professionals
8
Navigation and Ship’s Log Reader 2021Race of the Classics for Young Professionals
DRIFT, CURRENT AND COURSE CALCULATION
To navigate correctly it is important to know which factors have an influence on the ship. This is because thecompass heading and log speed may differ from the actual course and speed caused by these factors. This chapterwill discuss the influence of wind and tide.
Drift
Drift is caused by the pressure of the wind on the part of the ship that is above the water. Drift gives the ship acertain movement through the water. The combination of magnetic heading, speed and drift gives us the courseand speed through the water. If the ship's drift is unknown, one can estimate the influence of drift by observing theangle between the wake of the ship and the heading.
Current
Drift aside, a vessel is also under influence from tide, also referred to as currents. The speed and direction of theflow of water is called tide. Tide is described as a vector and thus consists of two parts: power (in knots) and adirection. Other than a Northerly wind, a tide with direction North does indeed travel in the Northern direction.The direction of a Northerly wind and a Northerly tide can be remembered as follows:
Wind comes from… current goes to…
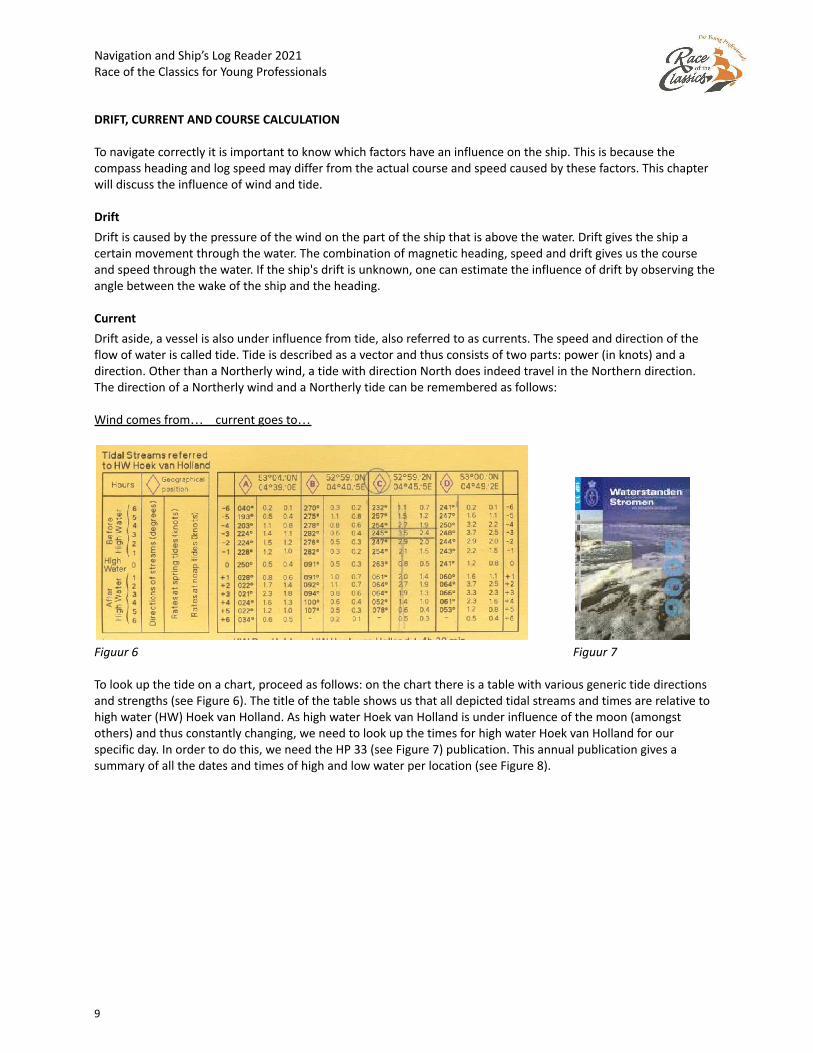
Figuur 6 Figuur 7
To look up the tide on a chart, proceed as follows: on the chart there is a table with various generic tide directionsand strengths (see Figure 6). The title of the table shows us that all depicted tidal streams and times are relative tohigh water (HW) Hoek van Holland. As high water Hoek van Holland is under influence of the moon (amongstothers) and thus constantly changing, we need to look up the times for high water Hoek van Holland for ourspecific day. In order to do this, we need the HP 33 (see Figure 7) publication. This annual publication gives asummary of all the dates and times of high and low water per location (see Figure 8).
9
Navigation and Ship’s Log Reader 2021Race of the Classics for Young Professionals
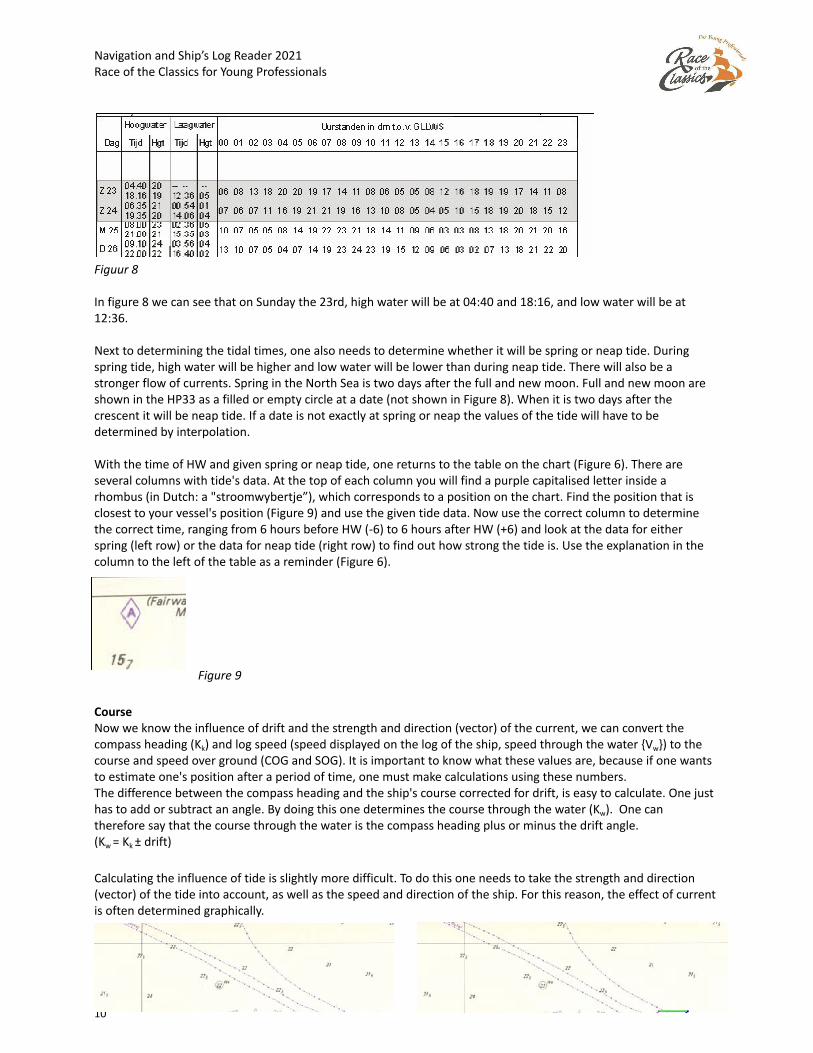
Figuur 8
In figure 8 we can see that on Sunday the 23rd, high water will be at 04:40 and 18:16, and low water will be at12:36.
Next to determining the tidal times, one also needs to determine whether it will be spring or neap tide. Duringspring tide, high water will be higher and low water will be lower than during neap tide. There will also be astronger flow of currents. Spring in the North Sea is two days after the full and new moon. Full and new moon areshown in the HP33 as a filled or empty circle at a date (not shown in Figure 8). When it is two days after thecrescent it will be neap tide. If a date is not exactly at spring or neap the values of the tide will have to bedetermined by interpolation.
With the time of HW and given spring or neap tide, one returns to the table on the chart (Figure 6). There areseveral columns with tide's data. At the top of each column you will find a purple capitalised letter inside arhombus (in Dutch: a "stroomwybertje”), which corresponds to a position on the chart. Find the position that isclosest to your vessel's position (Figure 9) and use the given tide data. Now use the correct column to determinethe correct time, ranging from 6 hours before HW (-6) to 6 hours after HW (+6) and look at the data for eitherspring (left row) or the data for neap tide (right row) to find out how strong the tide is. Use the explanation in thecolumn to the left of the table as a reminder (Figure 6).
Figure 9
CourseNow we know the influence of drift and the strength and direction (vector) of the current, we can convert thecompass heading (Kk) and log speed (speed displayed on the log of the ship, speed through the water {Vw}) to thecourse and speed over ground (COG and SOG). It is important to know what these values are, because if one wantsto estimate one's position after a period of time, one must make calculations using these numbers.The difference between the compass heading and the ship's course corrected for drift, is easy to calculate. One justhas to add or subtract an angle. By doing this one determines the course through the water (Kw). One cantherefore say that the course through the water is the compass heading plus or minus the drift angle.(Kw = Kk ± drift)
Calculating the influence of tide is slightly more difficult. To do this one needs to take the strength and direction(vector) of the tide into account, as well as the speed and direction of the ship. For this reason, the effect of currentis often determined graphically.
10
Navigation and Ship’s Log Reader 2021Race of the Classics for Young Professionals
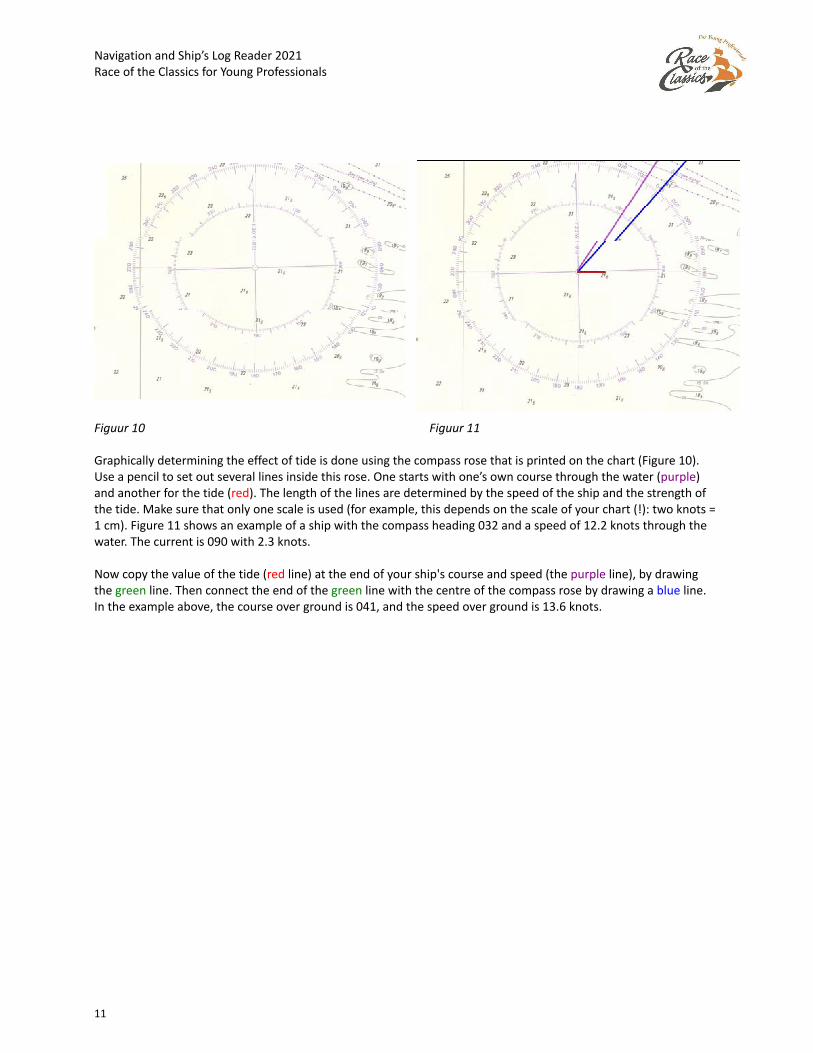
Figuur 10 Figuur 11
Graphically determining the effect of tide is done using the compass rose that is printed on the chart (Figure 10).Use a pencil to set out several lines inside this rose. One starts with one’s own course through the water (purple)and another for the tide (red). The length of the lines are determined by the speed of the ship and the strength ofthe tide. Make sure that only one scale is used (for example, this depends on the scale of your chart (!): two knots =1 cm). Figure 11 shows an example of a ship with the compass heading 032 and a speed of 12.2 knots through thewater. The current is 090 with 2.3 knots.
Now copy the value of the tide (red line) at the end of your ship's course and speed (the purple line), by drawingthe green line. Then connect the end of the green line with the centre of the compass rose by drawing a blue line.In the example above, the course over ground is 041, and the speed over ground is 13.6 knots.
11

Navigation and Ship’s Log Reader 2021Race of the Classics for Young Professionals
LOG ENTRY / FILLING OUT THE LOG
During the race, the log is the main way for teams to document their actions and thus gives themselves and therace officials insight into their actions.
All teams are expected to fill out a complete line in the log every hour. In addition, all teams are expected to enterevery "event" into the log, thereby noting date, time and the new nautical details.
With “event” we mean - besides start, finish and intermediate finish - also changes of course, tacks, gybes, use ofthe engines, setting and lowering the sails, any conflicts with an opponent, sudden weather changes, etc.
The log must be submitted to the Race Officials on the ship of the Organizing committee within one hour uponarriving in port. Late or non-submission of a log may lead to a time penalty or even disqualification from the race.
Example LOG (to be filled out in Dutch):TIJD LATITUDE
(N)LONGITUDE
(E)GRONDKOERS
(GK)KOMPASKOERS
(KK)SNELHEID LOGSTAND DTF WINDKRACHT WINDRICHTING BIJZONDERHEDEN
16.00
51°10” 068N
002° 12”871 E
069 040 7.8 1 8.8nm
16 kts NNW Start
17.00
52°11” 361N
002° 19”426 E
069 031 1.1 5.8 3nm 7 kts ZW
18.00
52°22” 418N
002° 26”941 E
107 115 4.3 8.8 0nm 11 kts ZW Tussentijdse finish
TERM MEANING
Tijd Netherlands time (Central European Time; during event GMT+2)
Bijzonderheden Event, for example strong tide, passing finish, use of the engine, etc.
Latitude (N) Latitudinal position
Longitude (E) Longitudinal position
GK COG, Course Over Ground
KK Compass Course
Snelheid True speed (speed over ground, SOG) in knots (consult GPS)
Logstand Distance passed through the water
DTF Distance to finish
Windkracht Wind Speed in knots
Windrichting In compass direction: Southwest = ZW or South South West = ZZW
12
Navigation and Ship’s Log Reader 2021Race of the Classics for Young Professionals
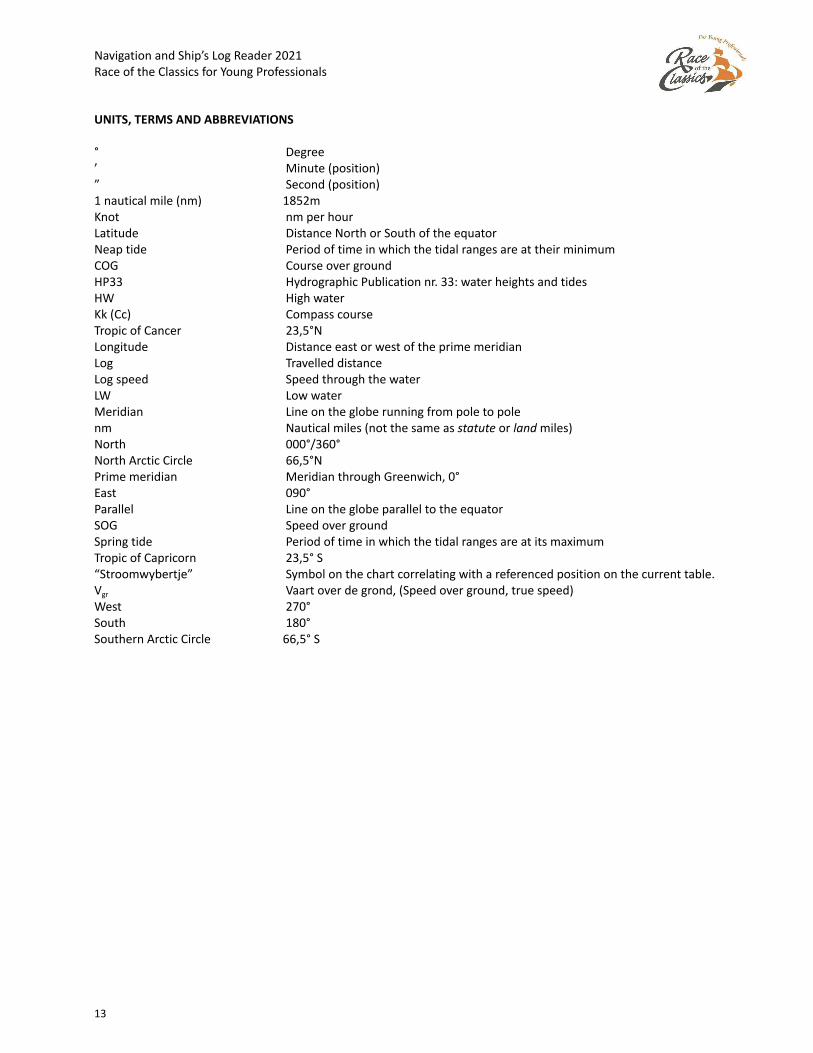
UNITS, TERMS AND ABBREVIATIONS
° Degree’ Minute (position)” Second (position)1 nautical mile (nm) 1852mKnot nm per hourLatitude Distance North or South of the equatorNeap tide Period of time in which the tidal ranges are at their minimumCOG Course over groundHP33 Hydrographic Publication nr. 33: water heights and tidesHW High waterKk (Cc) Compass courseTropic of Cancer 23,5°NLongitude Distance east or west of the prime meridianLog Travelled distanceLog speed Speed through the waterLW Low waterMeridian Line on the globe running from pole to polenm Nautical miles (not the same as statute or land miles)North 000°/360°North Arctic Circle 66,5°NPrime meridian Meridian through Greenwich, 0°East 090°Parallel Line on the globe parallel to the equatorSOG Speed over groundSpring tide Period of time in which the tidal ranges are at its maximumTropic of Capricorn 23,5° S“Stroomwybertje” Symbol on the chart correlating with a referenced position on the current table.Vgr Vaart over de grond, (Speed over ground, true speed)West 270°South 180°Southern Arctic Circle 66,5° S
13