shriro holdings limited annual report 2016 …2017/03/16 · ceo’s report shriro holdings limited...
TRANSCRIPT

SHRIRO HOLDINGS LIMITEDAnnual Report 2016
For
per
sona
l use
onl
y

Highlights NPAT ($13.2m)
Net Debt($5.5m)
6.5% 42%
‘everdure by heston blumenthal’ BBQ launch
ifc Highlights
1 Notice of AGM
2 At a Glance
4 Chairman’s Report
5 CEO’s Report
6 Business at a Glance
8 Business Review – Kitchen appliances
10 Business Review – Consumer products
12 Board of Directors
13 Financial Report
64 Corporate Directory
SHRIRO HOLDINGS LIMITED ACN 605 279 329
For
per
sona
l use
onl
y
Notice of Annual General Meeting
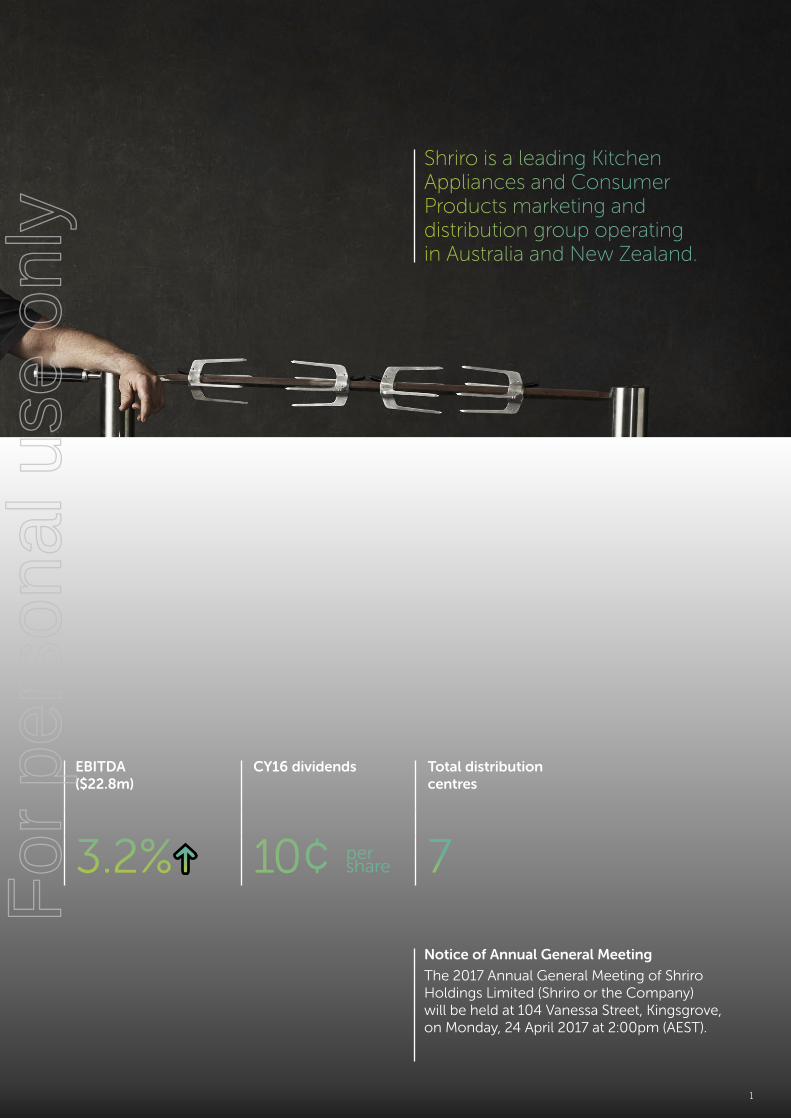
The 2017 Annual General Meeting of Shriro Holdings Limited (Shriro or the Company) will be held at 104 Vanessa Street, Kingsgrove, on Monday, 24 April 2017 at 2:00pm (AEST).
Shriro is a leading Kitchen Appliances and Consumer Products marketing and distribution group operating in Australia and New Zealand.
EBITDA ($22.8m)
CY16 dividends Total distribution centres
3.2% 10¢ per share 7
1
For
per
sona
l use
onl
y

PROJECTORS AUSTRALIA ECR & POS
At a glance
2 SHRIRO HOLDINGS LIMITED ANNUAL REPORT 2016
For
per
sona
l use
onl
y

Strength in diversity
CASIO EDU AustraliaSupporting Australian Teachers
3
For
per
sona
l use
onl
y

Chairman’s Report
It is with pleasure that I report a successful year for your Company in 2016, which was the first full financial year following the listing of Shriro Holdings Limited on the Australian Securities Exchange in June 2015.
It is with pleasure that I report a successful year for your Company in 2016, which was the first full financial year following the listing of Shriro Holdings Limited on the Australian Securities Exchange in June 2015. Net profit after tax increased 6.5% on normalised 2015 net profit and this was in line with our earlier guidance to the market.
Revenue for the year decreased by 1.5% on the previous corresponding period, mainly due to a change of sales channel for the Blanco brand, however, allowing for this, other like for like sales increased by 2.1%.
The business performed well in an environment where consumers remained cautious with their spending and this environment continues. The Company’s ability to hold gross margin and continuing vigilance in cost control has delivered the sound profit result for 2016.
On 14 February 2017, the Directors declared a fully franked final dividend of 7.0 cents per share, relating to the period 1st July 2016 to 31st December 2016. The final dividend was paid on the 9th of March 2017. Combined with the interim dividend of 3 cents per share, the dividend payout ratio for 2016 was approximately 72%.
In an exciting development, the ‘everdure by heston blumenthal’ range of barbeques was launched to the global market during the last quarter of the year, with the first export sales made in December 2016. The initial response from customers has been very positive.
The Company continues to develop and leverage its strength in product development and there was no let-up on this in 2016. This focus, and the successful introduction of new and innovative products to the market in the future, will underpin the continued growth of your Company.
The year ended 31 December 2016 has been another positive year for the Company and its people, and the Directors take this opportunity to thank all employees for their efforts towards achieving the strong results and for their commitment to the Company. The Directors also thank shareholders for their continued support.
Yours sincerely,
John Ingram Non-Executive Chairman
4 SHRIRO HOLDINGS LIMITED ANNUAL REPORT 2016
For
per
sona
l use
onl
y

CEO’s Report
Shriro Holdings Limited limited achieved a net profit after tax of $13.2 million in 2016, an increase of 6.5% over the previous year. The year was essentially one of consolidation and investment for the future. During 2016 a number of development costs relating to the recently released ‘everdure by heston blumenthal’ barbeques were expensed, which impacted the year’s profit but will generate sales growth in the future. The creation of this new and innovative range of barbeques was independently recognised by its receipt of a global prestigious iF Design Award, a highly sought after prize.
SALES AND GPOmega Retail Appliances had a steady year, and in addition, the ‘Neil Perry Kitchen by Omega’ range was rolled out where initial sales are meeting expectations. Casio G Shock sales in Australia were flat, however continued to grow in New Zealand with consolidated watches growth of 1.9% on the prior year. Casio Japan is planning a ‘Shock the World’ promotion to be held in New York, in November, which will include a range of new products that are expected to re-energise the G-Shock category. Appliance sales in the commercial sector grew, and the pipeline indicates further growth in 2017.
Shriro benefitted from higher calculator sales in its Consumer Products segment which likely resulted from the higher birth rate in 2004 resulting from the then Howard Government’s introduction of a baby bonus.
Sales were on the lower side for Omega Altise Cooling as the summer season’s heat arrived very late in the year. There was also a change in the sales channel for Blanco appliances which slowed growth in 2016 but will benefit 2017, whilst Blanco sinks and taps sales revenue continued to grow well. This has ensured that our relationship with Blanco Germany remains particularly strong.
The Australian dollar weakened against Shriro’s three main trading currencies, the EURO, USD and the YEN. Effective hedging, factory negotiations, selective price increases and product range adjustments, managed together, produced an improved gross margin result. As a percentage of sales, gross margin was the same as the prior year.
EXPENSESOperating Expenses were again well controlled during the year, declining 3.3% compared to a Revenue decline of 1.5%. This was very satisfying considering the one-off costs included in the figure.
Warranty expenses continue to track downwards as a percentage of sales. This has resulted from continued refinement of the warranty processes, better packaging, deeper analysis of failure reasons and other initiatives.
Freight as a percentage of sales reduced as a result of a full year of consolidated orders to and from customers, and a more favourable product mix.
BALANCE SHEET AND CASH FLOWSContinued focus on working capital management has been a major factor in the Company reducing its debt levels during the year. Net debt reduced to $5.5 million at 31 December 2016 and indeed to a net cash position post balance date, at 31 January 2017, partly impacted by seasonal factors. Shriro’s working capital is now at normal levels, and in the future, movements should reflect changes in activity levels, although any increase in offshore sales may impact.
The Company’s gearing is low with a Net Debt to EBITDA multiple of only 0.2 times. The strength of the balance sheet is underpinned by the low debt level and the absence of Intangibles. As a result, the Company is very well placed to fund appropriate growth opportunities in the future.
STRATEGYShriro’s growth strategy remains unchanged and includes the following:
• Grow existing brands via investment in sales and marketing, range expansion and innovative new product development;
• Increase Shriro’s presence in overseas markets, leveraging the Company’s product development and brand equity; and
• Identify potential acquisitions in consumer product categories that are consistent with Shriro’s core competencies.
OUTLOOKSeasonal influences result in the Company’s financial performance being heavily biased toward the second half of the calendar year and so visibility on the likely results for 2017 is unclear this early in the calendar year. It is currently expected that growth in local customer demand will continue to be modest with some consumer confidence uncertainty. However export sales of BBQs should begin to benefit the Company later in 2017, and further in 2018.
As a result of the current environment and the expected returns from the global expansion, the Directors currently believe that net profit after tax will be higher in CY17 with the amount of growth influenced by the uptake of the ‘everdure by heston blumenthal’ products in the Northern Hemisphere.
Yours sincerely,
Mike Westrup Chief Executive Officer
Shriro Holdings Limited achieved a net profit after tax of $13.2 million in 2016, an increase of 6.5% over the previous year. The year was essentially one of consolidation and investment for the future.
5
For
per
sona
l use
onl
y

Business at a glance
Outdoor Cooking
Barbeques
Kitchen AppliancesOvens, cooktops,
rangehoods, dishwashers, sinks,
tapware, ironing systems, laundry tubs,
waste disposal and ducting solutions
Shriro markets and distributes a diverse portfolio of Kitchen Appliances and Consumer Products under well-known company-owned and third-party brands.
6 SHRIRO HOLDINGS LIMITED ANNUAL REPORT 2016
For
per
sona
l use
onl
y

Heating/CoolingFans, heaters, air purifiers/ dehumidifiers
PERSONALWatches, cameras
OfficeCalculators, projectors, point of sale
AudioElectronic musical instruments, car audio, amplifiers professional DJ equipment, Hi‑Fi products and speakers
7
For
per
sona
l use
onl
y

Kitchen appliances
The Kitchen Appliances segment generated revenue of $81.5 million, which was a decrease of 5.4% on the prior year. Whilst Blanco sinks performed strongly for the second successive year, the segment performance was adversely impacted by a change in sales channel for Blanco kitchen appliances. The benefit of this channel switch was previously expected to be realised in the second half of 2016, however due to unavoidable delays by a major customer, the rollout was delayed until towards the end of that year, with the majority of the benefit now to be received in 2017.
Omega appliances performed well during the year and there is also a new product range planned for release towards the end of 2017. The premium “Neil Perry by Omega” range was rolled out throughout 2016, and sales are meeting management’s expectations. The Robinhood range of mainly laundry products, performed well in New Zealand.
Sales of Blanco sinks were up 13% on the prior year, with an improved gross profit, heavily influenced by the success of the Blanco Silgranit sinks range. Blanco taps also had another strong year.
The Commercial Appliances division produced a solid result, with sales up 4%, and the sales pipeline looking promising for CY17.
Kitchen Appliance EBITDA increased by 17.8% to $6.6 million, assisted by cost restructuring of the Blanco division. These costs will be held during the rollout of the new Blanco sales channel, providing some economies of scale benefits.
Kitchen Appliance EBITDA increased by 17.8% to $6.6 million, assisted by cost restructuring of the Blanco division.
8 SHRIRO HOLDINGS LIMITED ANNUAL REPORT 2016
For
per
sona
l use
onl
y

9
Diversity of brands and appliances that can cater for any kitchen, at any budget
9
For
per
sona
l use
onl
y

Consumer products
The Consumer Products segment performed well, with revenue growing by 1.8% to $101.9 million. Calculators performed strongly, likely as a result of the Howard Government’s introduction of a baby bonus in 2004 increasing birth rates and these children now entering high school. Casio watches grew by 1.9%, which was a slowing of the high growth rate of the prior years. A G-Shock watch relaunch and a product category refresh is due before Christmas 2017, which should see its sales growth pick up towards the end 2017. Sales of Omega Altise cooling products were down as a result of the late summer heat in most states. The heat did arrive just before Christmas, which resulted in the earlier lost sales being partially recovered in January 2017, with good customer sell-through and this should assist calendar year 2017’s cooling products’ sales.
The new collaboration (CASIO / BECHSTEIN) “Grand Hybrid” piano range is performing well, however the core business was slightly down in the 2016 calendar year.
Barbeques performed very well in calendar year 2016, and were the best growth category in terms of gross profit. This was largely due to the new ‘everdure by heston blumenthal’ barbeque range. The investment in this product was significant, with approximately $700,000 of one-off costs absorbed. A further $1,700,000 marketing expense was incurred, mainly relating to the global launch of the range. Thus 2016 was largely a year of investment for the future for this product and export sales orders have commenced.
Locally, the new barbeque range performed well with Harvey Norman, Bunnings and other specialist barbeque retailers, however the new range is expected to lead to higher export sales in 2017.
Shriro has a number of exciting new products expected to launch in 2017, particularly further products in the barbeque range and some new products in the laundry category.
EBITDA for the Consumer Product Divisions was down just 3.8% despite the large investment in the barbeque range.
Shriro has a number of exciting new products expected to launch in 2017.
10 SHRIRO HOLDINGS LIMITED ANNUAL REPORT 2016
For
per
sona
l use
onl
y

Global design awards, with a globally recognised celebrity chef
1111
For
per
sona
l use
onl
y

Board Member
John Weir IngramIndependent Non-Executive Chairman
Member of the Audit, Risk and Compliance Committee
Member of the Remuneration and Nomination Committee
• Director since 14 April 2015.
• Currently serves as Chairman of ASX listed Nick Scali Limited and is a Trustee Director of Australian Super.
• Previously John was a Non-Executive Director of United Group Limited.
• Mr Ingram is an Emeritus Councillor of the Australian Industry Group and a past National President.
Michael WestrupChief Executive Officer
• Director since 14 April 2015.
• Mike joined Shriro Australia Pty Limited (“Shriro”) as a Divisional Manager in 1991 and his outstanding performance and passion for Shriro saw him progress to the Chief Executive Officer role. Since 1995, Mike has been responsible for the transformation and development of the Group.
• Prior to joining Shriro, Mike held sales and marketing roles with Estee Lauder, Breville and Myer.
• Mike holds a Bachelor of Business.
Greg LaurieIndependent Non-Executive Director
Chairman of the Audit, Risk and Compliance Committee
Chairman of the Remuneration and Nomination Committee
• Director since 14 April 2015.
• Greg has extensive experience in a number of manufacturing and distribution industries.
• He is currently an independent Non-Executive Director of Bradken Limited and Nick Scali Limited. He is Chairman of the audit and risk committees of both Bradken and Nick Scali.
• Greg holds a Bachelor of Commerce Degree from the University of New South Wales and an advanced management qualification from the University of Pittsburgh.
Vasco FungNon-Executive Director
Member of the Audit, Risk and Compliance Committee
Member of the Remuneration and Nomination Committee
• Director since 14 April 2015.
• Vasco has been a director of Shriro since 30 December 1997 and has over 30 years’ experience in various industries.
• Vasco is the Group Chief Executive Officer of Shriro Pacific Ltd, an international investment group with distribution, manufacturing and retail businesses in Asia Pacific, North America and Europe.
• Vasco is a member of the Institute of Chartered Accountants in England and Wales and the Hong Kong Institute of Certified Public Accountants
Company Secretary
Shane BoothChief Financial Officer & Company Secretary
• Shane Booth joined Shriro in March 2010.
• Prior to joining Shriro, Shane was a Senior Executive of Allomak Limited for two years and Senior Executive of Objective Corporation Limited for three years. In these roles, Shane undertook restructuring activities and drove efficiencies.
• Shane prior to this worked at PKF Australia in their corporate services segment (Audit).
• Shane is a Chartered Accountant (CA) and holds a Bachelor of Business in Accounting.
Board of Directors
12 SHRIRO HOLDINGS LIMITED ANNUAL REPORT 2016
For
per
sona
l use
onl
y

Financial Report For the financial year ended 31 December 2016
Shriro Holdings Limited ACN 605 279 329
14 Corporate Governance Statement
14 Directors’ Report
24 Auditor’s Independence Declaration
25 Independent Auditor’s Report
30 Directors’ Declaration
31 Consolidated Statement of Profit or Loss
32 Consolidated Statement of Profit or Loss and Other Comprehensive Income
33 Consolidated Statement of Financial Position
34 Consolidated Statement of Changes in Equity
35 Consolidated Statement of Cash Flows
36 Notes to the Financial Statements
13
For
per
sona
l use
onl
y

Corporate Governance Statement
Shriro Holdings Limited aims to follow best practice recommendations as set out by the ASX Corporate Governance Council.
Where the company has not followed best practice for any recommendation, further clarification through all current corporate governance policies can be found on the company’s website at http://www.shriro.com.au/investor/corporate_governance.
All policies and practices remain under ongoing review.
Directors’ Report
The Directors present their report in compliance with the provisions of the Corporations Act 2001 on the consolidated entity (referred to hereafter as the “Group”) consisting of Shriro Holdings Limited (“Shriro” or the “Company”) and the entities it controlled at the end of, or during, the year ended 31 December 2016.
DIRECTORSDirectors of Shriro Holdings Limited during and since the year ended 31 December 2016 unless otherwise stated below are:
John Ingram – Chairman
Mike Westrup – Executive Director
Vasco Fung – Non-executive Director
Greg Laurie – Non-executive Director
Stuart Nash – Alternate Director for Vasco Fung (resigned 2 May 2016)
COMPANY SECRETARYShane Booth is Company Secretary.
PRINCIPAL ACTIVITIESThe Group is a leading kitchen appliances and consumer products marketing and distribution Group operating in Australia and New Zealand.
The Group markets and distributes an extensive range of company-owned brands (including Omega, Neil Perry Kitchen by Omega, Everdure including ‘everdure by heston blumenthal’, Robinhood and Omega Altise) and third party owned brands (such as Casio, Blanco and Pioneer). Products include calculators, watches, cash registers, musical instruments, audio products, kitchen appliances, sinks & taps, laundry products, consumer electronics, car audio, amplifiers, professional DJ, Hi-Fi / speakers, fashion, lighting, gas heaters and gas barbeques, electric heaters and cooling products.
REVIEW OF OPERATIONSA summary of the revenues and results is as follows:
Normalised results summary
Statutory 2016$ million
Normalised 2015$ million
Change%
Revenue 183.5 186.3 (1.5%)
Gross Margin 42.6% 42.6%
Operating Expenses (55.4) (57.3) (3.3%) EBITDA 22.8 22.1 3.2% Depreciation (3.6) (3.4) 5.9%
Interest (1.0) (1.4) (28.6%)
Profit Before Tax 18.2 17.4 4.6%
Profit After Tax 13.2 12.4 6.5%
14 SHRIRO HOLDINGS LIMITED ANNUAL REPORT 2016
For
per
sona
l use
onl
y
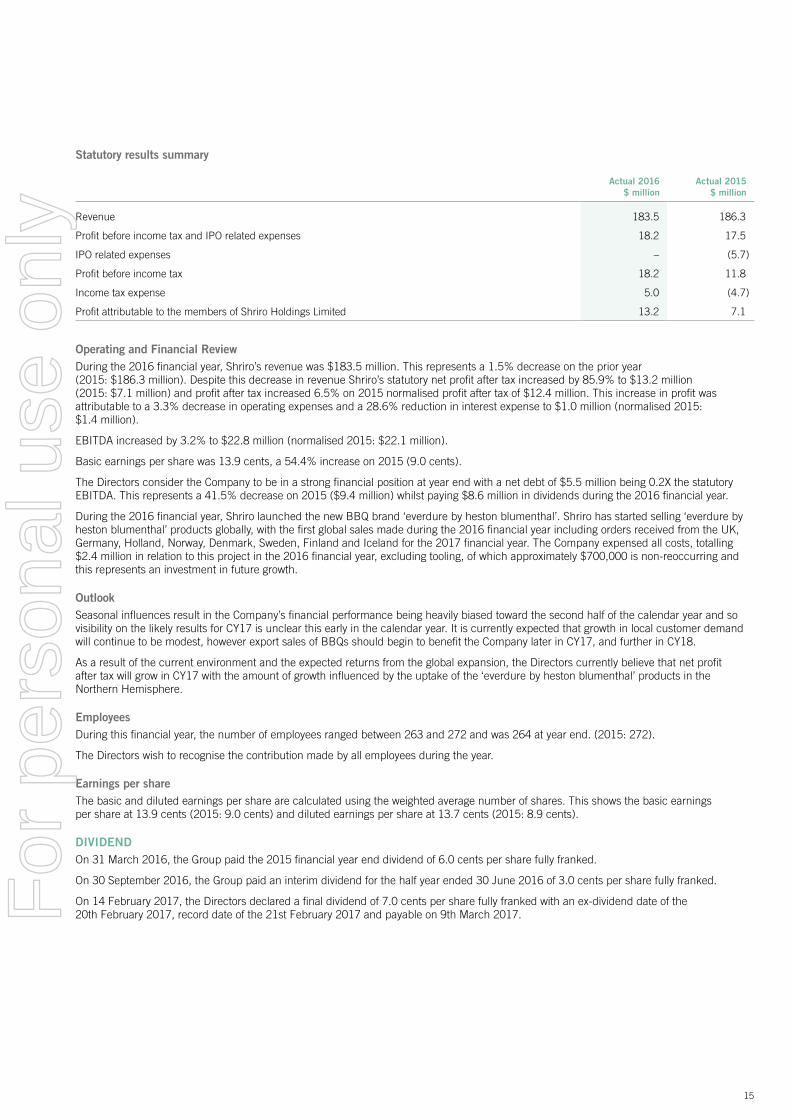
Statutory results summary
Actual 2016 $ million
Actual 2015$ million
Revenue 183.5 186.3
Profit before income tax and IPO related expenses 18.2 17.5
IPO related expenses – (5.7)
Profit before income tax 18.2 11.8
Income tax expense 5.0 (4.7)
Profit attributable to the members of Shriro Holdings Limited 13.2 7.1
Operating and Financial ReviewDuring the 2016 financial year, Shriro’s revenue was $183.5 million. This represents a 1.5% decrease on the prior year (2015: $186.3 million). Despite this decrease in revenue Shriro’s statutory net profit after tax increased by 85.9% to $13.2 million (2015: $7.1 million) and profit after tax increased 6.5% on 2015 normalised profit after tax of $12.4 million. This increase in profit was attributable to a 3.3% decrease in operating expenses and a 28.6% reduction in interest expense to $1.0 million (normalised 2015: $1.4 million).
EBITDA increased by 3.2% to $22.8 million (normalised 2015: $22.1 million).
Basic earnings per share was 13.9 cents, a 54.4% increase on 2015 (9.0 cents).
The Directors consider the Company to be in a strong financial position at year end with a net debt of $5.5 million being 0.2X the statutory EBITDA. This represents a 41.5% decrease on 2015 ($9.4 million) whilst paying $8.6 million in dividends during the 2016 financial year.
During the 2016 financial year, Shriro launched the new BBQ brand ‘everdure by heston blumenthal’. Shriro has started selling ‘everdure by heston blumenthal’ products globally, with the first global sales made during the 2016 financial year including orders received from the UK, Germany, Holland, Norway, Denmark, Sweden, Finland and Iceland for the 2017 financial year. The Company expensed all costs, totalling $2.4 million in relation to this project in the 2016 financial year, excluding tooling, of which approximately $700,000 is non-reoccurring and this represents an investment in future growth.
OutlookSeasonal influences result in the Company’s financial performance being heavily biased toward the second half of the calendar year and so visibility on the likely results for CY17 is unclear this early in the calendar year. It is currently expected that growth in local customer demand will continue to be modest, however export sales of BBQs should begin to benefit the Company later in CY17, and further in CY18.
As a result of the current environment and the expected returns from the global expansion, the Directors currently believe that net profit after tax will grow in CY17 with the amount of growth influenced by the uptake of the ‘everdure by heston blumenthal’ products in the Northern Hemisphere.
EmployeesDuring this financial year, the number of employees ranged between 263 and 272 and was 264 at year end. (2015: 272).
The Directors wish to recognise the contribution made by all employees during the year.
Earnings per shareThe basic and diluted earnings per share are calculated using the weighted average number of shares. This shows the basic earnings per share at 13.9 cents (2015: 9.0 cents) and diluted earnings per share at 13.7 cents (2015: 8.9 cents).
DIVIDENDOn 31 March 2016, the Group paid the 2015 financial year end dividend of 6.0 cents per share fully franked.
On 30 September 2016, the Group paid an interim dividend for the half year ended 30 June 2016 of 3.0 cents per share fully franked.
On 14 February 2017, the Directors declared a final dividend of 7.0 cents per share fully franked with an ex-dividend date of the 20th February 2017, record date of the 21st February 2017 and payable on 9th March 2017.
15
For
per
sona
l use
onl
y
DIRECTORS’ REPORT (CONT’D)
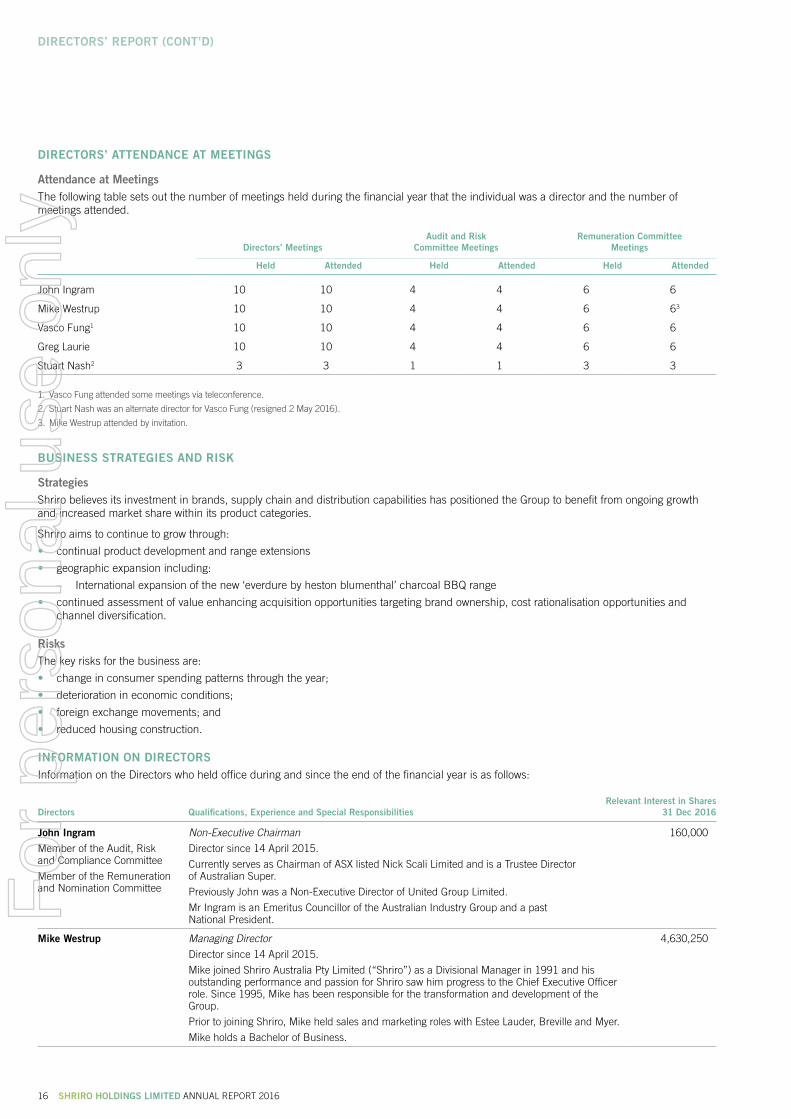
DIRECTORS’ ATTENDANCE AT MEETINGS
Attendance at MeetingsThe following table sets out the number of meetings held during the financial year that the individual was a director and the number of meetings attended.
Directors’ MeetingsAudit and Risk
Committee MeetingsRemuneration Committee
Meetings
Held Attended Held Attended Held Attended
John Ingram 10 10 4 4 6 6
Mike Westrup 10 10 4 4 6 63
Vasco Fung1 10 10 4 4 6 6
Greg Laurie 10 10 4 4 6 6
Stuart Nash2 3 3 1 1 3 3
1. Vasco Fung attended some meetings via teleconference.
2. Stuart Nash was an alternate director for Vasco Fung (resigned 2 May 2016).
3. Mike Westrup attended by invitation.
BUSINESS STRATEGIES AND RISK
StrategiesShriro believes its investment in brands, supply chain and distribution capabilities has positioned the Group to benefit from ongoing growth and increased market share within its product categories.
Shriro aims to continue to grow through:
• continual product development and range extensions
• geographic expansion including:
– International expansion of the new ‘everdure by heston blumenthal’ charcoal BBQ range
• continued assessment of value enhancing acquisition opportunities targeting brand ownership, cost rationalisation opportunities and channel diversification.
RisksThe key risks for the business are:
• change in consumer spending patterns through the year;
• deterioration in economic conditions;
• foreign exchange movements; and
• reduced housing construction.
INFORMATION ON DIRECTORSInformation on the Directors who held office during and since the end of the financial year is as follows:
Directors Qualifications, Experience and Special ResponsibilitiesRelevant Interest in Shares
31 Dec 2016
John IngramMember of the Audit, Risk and Compliance Committee
Member of the Remuneration and Nomination Committee
Non-Executive Chairman
Director since 14 April 2015.
Currently serves as Chairman of ASX listed Nick Scali Limited and is a Trustee Director of Australian Super.
Previously John was a Non-Executive Director of United Group Limited.
Mr Ingram is an Emeritus Councillor of the Australian Industry Group and a past National President.
160,000
Mike Westrup Managing Director
Director since 14 April 2015.
Mike joined Shriro Australia Pty Limited (“Shriro”) as a Divisional Manager in 1991 and his outstanding performance and passion for Shriro saw him progress to the Chief Executive Officer role. Since 1995, Mike has been responsible for the transformation and development of the Group.
Prior to joining Shriro, Mike held sales and marketing roles with Estee Lauder, Breville and Myer.
Mike holds a Bachelor of Business.
4,630,250
16 SHRIRO HOLDINGS LIMITED ANNUAL REPORT 2016
For
per
sona
l use
onl
y

Directors Qualifications, Experience and Special ResponsibilitiesRelevant Interest in Shares
31 Dec 2016
Vasco Fung
Member of the Audit, Risk and Compliance Committee
Member of the Remuneration and Nomination Committee
Non-Executive Director
Director since 14 April 2015.
Vasco has been a director of Shriro since 30 December 1997 and has over 30 years’ experience in various industries.
Vasco is the Group Chief Executive Officer of Shriro Pacific Ltd, an international investment group with distribution, manufacturing and retail businesses in Asia Pacific, North America and Europe.
Vasco is a member of the Institute of Chartered Accountants in England and Wales and the Hong Kong Institute of Certified Public Accountants.
3,321,937
Greg Laurie
Chairman of the Audit, Risk and Compliance Committee
Chairman of the Remuneration and Nomination Committee
Non-Executive Director
Director since 14 April 2015.
Greg has extensive experience in a number of manufacturing and distribution industries.
He is currently an independent Non-Executive Director of Bradken Limited and Nick Scali Limited. He is Chairman of the audit and risk committees of both Bradken and Nick Scali.
Greg holds a Bachelor of Commerce Degree from the University of New South Wales and an advanced management qualification from the University of Pittsburgh.
20,000
Stuart Nash Alternate Non-Executive Director
Joined the Board as an alternate director on 28 April 2015, resigning 2 May 2016.
Stuart Nash held the following qualifications, experience and special responsibilities until his resignation:
Stuart is a professional non-executive director and independent corporate advisor, assisting clients in relation to strategy, M&A, financing (debt and equity) and risk management.
Stuart was a Non-Executive Director of Greens Foods Holdings Pty Ltd and Chairman of Australian Affordable Housing Securities Limited.
Stuart is a finance professional with over 20 years’ experience in chartered accounting and investment banking. Stuart holds a Bachelor of Arts (Honours) from Cambridge University, is qualified as a Chartered Accountant with the Institute of Chartered Accountants in England and Wales, holds a post Graduate Diploma in Applied Finance and Investment from the Securities Institute of Australia and is a member of the Australian Institute of Company Directors.
30,000
AUDITED REMUNERATION REPORTThis remuneration report, which forms part of the Directors’ report, details the key management personnel remuneration arrangements for the Company, in accordance with the requirements of the Corporations Act 2001 and its Regulations.
Principles used to determine the nature and amount of remunerationThe objective of the Company’s remuneration framework is to ensure reward for performance whilst maintaining competitiveness with the market and appropriateness for the results delivered. The framework aligns executive reward with achievement of strategic objectives and the creation of value for shareholders, and conforms to market best practice for delivery of reward.
Remuneration and Nomination CommitteeTo assist the Board in the remuneration framework objective, a Remuneration and Nomination Committee has been established as a Committee of the Board. The main responsibilities of the Committee, in relation to remuneration, include:
• Reviewing remuneration arrangements for the CEO, CFO and other senior executives.
• Reviewing Non-Executive Director fees.
• Reviewing and making recommendations on the over-arching executive remuneration framework and incentive plans.
Its objective is to ensure that remuneration policies and structures are fair and competitive and aligned with the long term interests of the Company. In doing this, the Remuneration and Nomination Committee seeks advice from independent remuneration consultants.
Key Management PersonnelThe Key Management Personnel of Shriro Holdings Limited are the non-executive Directors of the Company and:
Mike Westrup Chief Executive Officer, and
Shane Booth Company Secretary, Chief Financial Officer
17
For
per
sona
l use
onl
y

DIRECTORS’ REPORT (CONT’D)
Non-Executive Director RemunerationThe non-executive Directors at the date of this Report are:
John Ingram Chairman
Vasco Fung
Greg Laurie
Non-executive Directors are paid an annual fee which is reviewed annually by the Remuneration and Nomination Committee and the Board. The Board uses the advice of independent remuneration consultants, as appropriate, to ensure non-executive director fees are appropriate and in line with the market. Non-executive director fees include, where applicable, compulsory superannuation contributions.
The non-executive Directors do not participate in the Company’s Long Term Incentive Plan or in the employee gift offer.
Total aggregate remuneration for all non-executive Directors, in accordance with the Prospectus dated 27 May 2015, is not to exceed $600,000. Non-executive director’s base fees are presently $90,000 per annum. The Chairman’s fee is presently $140,000 per annum. Committee fees are:
Chair of Audit, Risk and Compliance Committee $10,000 p.a.
Chair of Remuneration and Nomination Committee $5,000 p.a.
Member of Audit, Risk and Compliance Committee $5,000 p.a.
Member of Remuneration and Nomination Committee $3,000 p.a.
The Chairman does not receive Committee fees.
Executive RemunerationThe remuneration of the Chief Executive Officer (CEO) and Chief Financial Officer (CFO) comprise base pay, at-risk short term bonus (STI) and participation in the Company’s Long Term Incentive Plan (LTIP). Details of each executive’s remuneration is set out below.
Chief Executive Officer (CEO) and Chief Financial Officer (CFO)The CEO and CFO are remunerated on a salary package basis which is a component of a formal employment contract. The salary package is considered to be appropriate for the experience and expertise needed for the position and is comparable to other similar sized companies and business units of larger companies. The salary package contains a fixed component and a short term incentive (STI) component. The STI is determined by the Board annually, based on performance against a range of targets. The CEO and CFO are also participants in the Company’s long term incentive plan (LTIP).
Short Term IncentiveA short term incentive (STI) forms a component of the remuneration of executive Directors and key management personnel in addition to their base remuneration. The STI for 2016 was structured on the following basis:
In 2016, Mike Westrup is entitled to an STI award of up to $395,850 for target performance or $791,700 for stretch performance and Shane Booth is entitled to an STI award of up to $142,100 for target performance or $284,200 for stretch performance, measured against the CY2016 financial year’s budgeted profit before tax.
STI targets are expected to be set by the Board for the 2017 year for both Mike Westrup and Shane Booth. STI awards are expected to be paid in cash following the Board’s approval of the Company’s financial statements for the relevant year.
Long Term IncentiveA Long Term Incentive Plan (LTIP) has been implemented in accordance with the outline included in the Prospectus dated 27 May 2015. The LTIP provides for participants to be issued with Performance Rights (Rights) which have associated performance hurdles that are tested at the end of three years from the date of issue to determine vesting. Subsequent to vesting, each Right can be exercised and converted to an equivalent number of shares of the Company.
Mike Westrup was issued with 900,000 Rights in 2015, that are in respect of the 2015, 2016 and 2017 years and testing for achievement of the performance hurdle will occur following Board approval of the Company’s financial statements for the year ending 31 December 2017.
Shane Booth has been issued with 130,319 Rights in respect of the 2016 year (2015: 87,500). Testing for achievement of the performance hurdle will occur following Board approval of the Company’s financial statements three years after the Rights effective issue date. It is expected that Shane Booth will be invited, at the Director’s discretion, to apply for Rights in respect of the 2017 financial year.
The performance hurdle relating to the Rights issued to both Mike Westrup and Shane Booth is for the compound annual growth rate (CAGR) of the Company’s earnings per share (EPS) to be no less than 5% for the three years for 50% of the Rights to vest (threshold performance) and 10% or higher for 100% of Rights to vest (target performance). EPS performance between 5% and 10% will result in a straight line proportion of Rights to vest between 50% and 100%. The Board has determined that achieving the Prospectus Normalised forecast net profit after tax for the 2015 year is deemed the achievement of the 10% EPS growth for the 2015 financial year.
As of the date of this report, the CEO and CFO also own a substantial number of shares in the Company. The breadth and depth of share ownership fosters an alignment of objectives between shareholders and Directors and management of the Company.
AUDITED REMUNERATION REPORT (CONT’D)
18 SHRIRO HOLDINGS LIMITED ANNUAL REPORT 2016
For
per
sona
l use
onl
y

Key Terms of Employment Contracts
CEO
The Company entered into a new executive service agreement with Mike Westrup as Managing Director and CEO effective 23 June 2015. The remuneration component of the new agreement is considered to be appropriate and in line with relevant industry comparables. The short term variable component (STI) can range between 0% and 120% of the fixed component, based on performance measured against a profit before tax target, set annually by the Directors. The long term variable component (LTIP) can range between 0% and 46.15% of the fixed component based on performance measured against an EPS target, set by the Directors over a three year period.
Term: Fixed term expiring on 31st May 2018
Annual Salary: Total fixed remuneration of $659,750, subject to annual adjustment
Notice Period: 12 months’ notice by either party at any time
CFO
The Company entered into a new executive service agreement with Shane Booth as Company Secretary and CFO effective 23 June 2015. The remuneration component of the new agreement is considered to be appropriate and in line with relevant industry comparables. For the 2015 year, the short term variable component (STI) can range between 0% and 80% of the fixed component, based on performance measured against a profit before tax target. Based on the initial issue of Rights, The long term variable component (LTIP) can range between 0% and 30% of the fixed component based on the achievement of a performance hurdle that is measured after three years, as determined by the Board and included in any invitation to apply for participation in the LTIP.
Term: No fixed term
Annual Salary: Total fixed remuneration of $355,250, subject to annual adjustment
Notice Period: Six months’ notice by either party
Relationship between Remuneration Policy and Company Performance
The remuneration of executive officers includes an annual short term incentive (STI). The total STI paid in a year is discretionary, and is closely related to and determined mainly by the current Normalised profit levels of the Company but can also include a component of non-financial targets.
Executive officers remuneration is further aligned with the long term Company performance via the long term incentive plan (LTIP) and the current shareholdings certain executives retain in the Company.
The tables below set out summary information about the Group’s earnings for 31 December 2016.
Statutory31 December
2016$’000
Pro forma (non-IFRS1)
31 December 2015
$’000
Revenue 183,464 186,263
Net profit before tax 18,184 17,403
Net profit after tax 13,162 12,413
1. The “non-IFRS” information is unaudited.
31 December2016cents
31 December2015cents
Share price at start of year 92.5 N / A
Share price at end of year 122 92.5
Basic earnings per share 13.9 9.0
Diluted earnings per share 13.7 8.9
Note: Basic and diluted earnings per share is calculated on profit after taxation attributable to members of Shriro Holdings Limited and the weighted average number of shares on issue during the period. The proportional number of shares prior to listing used in the weighted average calculation was 62,009,500.
19
For
per
sona
l use
onl
y

DIRECTORS’ REPORT (CONT’D)
Particulars of Key Management Personnel interests during the year ended 31 December 2016
Fully paid ordinary shares
31 December 2015
Number
Fully paid ordinary shares purchased
during 2016Number
Fully paid ordinary shares
31 December 2016
Number
Non-executive Directors
John Ingram 100,000 60,000 160,000
Vasco Fung 3,321,937 – 3,321,937
Greg Laurie 20,000 – 20,000
Stuart Nash1 30,000 – 30,000
TOTAL 3,471,937 60,000 3,531,937
Executive Officers
Mike Westrup 4,630,250 – 4,630,250
Shane Booth 2,215,625 – 2,215,625
TOTAL 6,845,875 – 6,845,875
1. Stuart Nash was the alternate director for Vasco Fung.
Remuneration of Executive Officers and Key Management Personnel
Short-term Benefits
Post-employment
Benefits Long-term Benefits Percentage of remuneration
related to performance
CashFees/
SalaryCash
Bonus
Non-monetary
BenefitSuper-
annuation
Long service
leave
Non-monetary
Benefit Share rights1 Total
2016 $ $ $ $ $ $ $ $ %
Non-executive Directors
John Ingram 127,854 – – 12,146 – – – 140,000 –
Vasco Fung 98,000 – – – – – – 98,000 –
Greg Laurie 95,890 – – 9,110 – – – 105,000 –
Stuart Nash – – – – – – – – –
TOTAL 321,744 – – 21,256 – – – 343,000 –
Executive Officers
Mike Westrup 624,750 495,209 – 35,000 11,217 – 232,753 1,398,929 52.0%
Shane Booth 335,788 177,767 – 19,462 4,245 – 37,590 574,852 37.5%
TOTAL 960,538 672,976 – 54,462 15,462 – 270,343 1,973,781 47.8%
1. Performance rights as an LTIP award in respect of the 2016 financial year is recognised in accordance with AASB 2. These rights will vest subject to the satisfaction of performance conditions.
AUDITED REMUNERATION REPORT (CONT’D)
20 SHRIRO HOLDINGS LIMITED ANNUAL REPORT 2016
For
per
sona
l use
onl
y

Short-term Benefits
Post-employment
Benefits Long-term Benefits Percentage of remuneration
related to performance
CashFees/
SalaryCash
Bonus
Non-monetary
BenefitSuper-
annuation
Long service
leave
Non- monetary Benefit2
Share rights3 Total
2015 $ $ $ $ $ $ $ $ %
Non-executive Directors
John Ingram1 82,192 – – 7,808 – – – 90,000 –
Vasco Fung 49,000 – – – – 105,060 – 154,060 –
Greg Laurie1 66,210 – – 6,290 – – – 72,500 –
Stuart Nash – – – – – – – – –
TOTAL 197,402 – – 14,098 – 105,060 – 316,560 –
Executive Officers
Mike Westrup 595,310 2,280,000 – 35,000 50,791 140,081 286,320 3,387,502 75.8%
Shane Booth 304,558 530,000 – 19,987 16,497 70,040 27,837 968,919 57.6%
TOTAL 899,868 2,810,000 – 54,987 67,288 210,121 314,157 4,356,421 71.7%
1. These amounts include remuneration paid to John Ingram and Greg Laurie of $20,000 each for the work performed by them on behalf of the Company in the period prior to the Listing of the Company on the ASX.
2. Relates to the remaining amortisation of the in substance options issued under the historical management equity plan which vested upon the IPO.
3. Performance rights as an LTIP award in respect of the 2015 financial year is recognised in accordance with AASB 2. These rights will vest subject to the satisfaction of performance conditions.
No director or senior management person appointed during the year received a payment as part of his remuneration for agreeing to hold the position.
Non-executive Directors have no further entitlement to cash bonus or non-monetary benefits. Non-monetary benefits received during the 2015 financial year relates to an ‘in-substance’ option per AASB2, which was the non-cash option value of the historical management equity plan.
Bonuses and share-based payments granted as compensation for the current financial year
Cash Bonuses
Both Mike Westrup and Shane Booth achieved 63% of their 2016 structured short term incentives. Mike Westrup was granted $495,209 for stretch performance and Shane Booth was granted $177,767 for stretch performance in relation to the 2016 financial year profit.
Employee Long Term Incentive plan
The Company established the employee long term incentive plan (LTIP) to assist in the motivation, retention and reward of senior management. The Plan is designed to align the interests of employees and senior management (including the CEO) with the interests of Shareholders by providing an opportunity for employees to receive an equity interest in the Company. From time to time the Board will approve invitations to certain executives and employees to participate in the LTIP on conditions and performance hurdles determined by the Board.
The Plan Rules provide flexibility for the Company to grant performance rights, options and / or restricted shares, subject to the terms of individual offers.
Performance rights have been granted to the CEO, CFO and other members of senior management of the Company. In accordance with the CEO’s fixed term employment agreement, the CEO’s LTIP award has been made in respect of the 2015, 2016 and 2017 financial years. Performance Rights have also been issued to the CFO in respect of the 2016 year in accordance with the Prospectus dated 27 May 2015. It is expected that an invitation for the CFO to apply for performance rights in respect of the 2017 year will be approved by the Board.
Shane Booth was granted 130,319 performance rights, under the LTIP during the financial year ended 31 December 2016. (2015: 87,500).
Mike Westrup was granted 900,000 performance rights in respect of the 2015, 2016 and 2017 financial years during the financial year ended 31 December 2015.
No non-executive director received any shares under the employee gift offer in the current or previous years and no non-executive director can participate in the LTIP.
Shriro Holdings Limited has not issued any options.
21
For
per
sona
l use
onl
y

DIRECTORS’ REPORT (CONT’D)
The key terms of the initial awards under the Plan are summarised in the table below.
Performance conditions, performance period and vesting
Performance rights will vest subject to the satisfaction of performance conditions.
The performance period for LTIP awards will generally be 3 years. The initial grants have a performance period ending on 31 December 2017.
The initial grants of performance rights are subject to a performance condition (hurdle) based on the achievement of a target EPS growth over the three years to 31 December 2017. The target is calculated as the achievement of the Prospectus Normalised 2015 forecast net profit after tax (deemed by the Board to be achievement of 10% growth in EPS for that year), or the prior years actual results, plus subsequent compound annual growth rate (CAGR) of 10% per annum for three years.
The percentage of performance rights that vest, if any, will be determined by reference to the following vesting schedule, subject to any adjustments for abnormal or unusual profit items considered appropriate by the Board:
Target CAGR of the Company’s EPS over the three year period % of performance rights that vest
Less than threshold performance (less than 5%) Nil
Threshold performance (5%) 50%
Between threshold and target performance (5%-10%) 50% - 100% on a straight line pro rata
Target performance (10% or above) 100%
Any performance rights that remain unvested at the end of the performance period will lapse immediately.
Rights associated with performance rights
The performance rights do not carry dividends or voting rights prior to vesting.
Restrictions on dealing The participant must not sell, transfer, encumber, hedge or otherwise deal with performance rights.
The participant will be free to deal with the Shares allocated on vesting of the performance rights, subject to the requirements of the Company’s Policy for Dealing in Securities.
Cessation of employment If the participant’s employment is terminated for cause or the participant resigns, unless the Board determines otherwise, any unvested performance rights will automatically lapse. In addition, if the CFO ceases employment within 1 year of the grant, the Board has the discretion to lapse the performance rights.
Where the participant ceases employment in any other circumstances, unless the Board determines otherwise:
• a pro-rata portion of the performance rights (calculated by reference to the portion of the performance period that has elapsed up to the date of cessation) will remain on foot and will vest or lapse in due course, as though the participant had not ceased employment; and
• the remaining portion of the performance rights will automatically lapse.
NameNumber Granted Financial Year
Commencement date of performance measurement period Grant date
Percentage of grant Vested
%
Percentage of grant forfeited
%
Future financial years that
Grant will be payable
Grant date fair value
$
Mike Westrup 900,000 2015 01/01/2015 23/06/2015 Nil Nil 2018 858,960
Shane Booth 87,500 2015 01/01/2015 23/06/2015 Nil Nil 2018 83,510
Shane Booth 130,319 2016 01/01/2016 26/05/2016 Nil Nil 2019 89,768
Total 1,032,238
AUDITED REMUNERATION REPORT (CONT’D)
22 SHRIRO HOLDINGS LIMITED ANNUAL REPORT 2016
For
per
sona
l use
onl
y
CHANGES IN STATE OF AFFAIRSDuring the financial year the Group deregistered Shriro Pty Limited which was only a holding company within the group. Shriro Pty Limited was a legacy of the 2015 restructure that occurred prior to the IPO.
There were no other significant changes in the state of affairs of the Group during the financial year.
SUBSEQUENT EVENTSThere has not been any matter or circumstance, not already disclosed, occurring subsequent to the end of the financial year that has significantly affected, or may significantly affect, the operations of the Group, the results of those operations, or the state of affairs of the Group in future financial years.
FUTURE DEVELOPMENTSDisclosure of other information regarding likely developments in the operations of the Group in future financial years and the expected results of those operations is likely to result in unreasonable prejudice to the Group. Accordingly, this information has not been disclosed in this report.
During the financial year, the Group paid a premium in respect of a contract insuring Directors of the Group, the Group secretary, and all executive officers of the Group and of any related body corporate against a liability incurred as such a director, secretary or executive officer to the extent permitted by the Corporations Act 2001. The contract of insurance prohibits disclosure of the nature of the liability and the amount of the premium.
The Group has not otherwise, during or since the end of the financial year, except to the extent permitted by law, indemnified or agreed to indemnify an officer or auditor of the company or of any related body corporate against a liability incurred as such an officer or auditor.
NON-AUDIT SERVICESDetails of amounts paid or payable to the auditor for non-audit services in the prior year are outlined in note 4 to the financial statements.
The directors are satisfied that the provision of non-audit services by the auditor (or by another person or firm on the auditor’s behalf) is compatible with the general standard of independence for auditors imposed by the Corporations Act 2001.
The directors are of the opinion that the services as disclosed in note 4 to the financial statements do not compromise the external auditor’s independence, based on advice received from the Audit Committee, for the following reasons:
• all non-audit services have been reviewed and approved to ensure that they do not impact the integrity and objectivity of the auditor; and
• none of the services undermine the general principles relating to auditor independence as set out in APES 110 ‘Code of Ethics for Professional Accountants’ issued by the Accounting Professional & Ethical Standards Board, including reviewing or auditing the auditor’s own work, acting in a management or decision-making capacity for the company, acting as advocate for the company or jointly sharing economic risks and rewards.
AUDITOR’S INDEPENDENCE DECLARATIONThe auditor’s independence declaration is included on page 24 of the annual report.
ROUNDING OFF OF AMOUNTSThe Company is a company of the kind referred to in ASIC Corporations (Rounding in Financials / Directors’ Reports) Instrument 2016/191, dated 24 March 2016, and in accordance with that Corporations Instrument amounts in the directors’ report and the financial statements are rounded off to the nearest thousand dollars, unless otherwise indicated.
This Directors’ report is signed in accordance with a resolution of Directors made pursuant to s298(2) of the Corporations Act 2001.
On behalf of the Directors
John Ingram Mike WestrupDirector Director
Sydney, 14th of February 2017 Sydney, 14th of February 2017
23
For
per
sona
l use
onl
y

Auditor’s Independence Declaration
Liability limited by a scheme approved under Professional Standards Legislation. Member of Deloitte Touche Tohmatsu Limited
14 February 2017
Dear Board Members
Shriro Holdings Limited
In accordance with section 307C of the Corporations Act 2001, I am pleased to provide the following declaration of independence to the directors of Shriro Holdings Limited.
As lead audit partner for the audit of the financial statements of Shriro Holdings Limited for the year ended 31 December 2016, I declare that to the best of my knowledge and belief, there have been no contraventions of:
(i) the auditor independence requirements of the Corporations Act 2001 in relation to the audit; and
(ii) any applicable code of professional conduct in relation to the audit.
Yours sincerely
DELOITTE TOUCHE TOHMATSU
X Delaney Partner Chartered Accountants
The Board of Directors Shriro Holdings Limited 104 Vanessa Street KINGSGROVE NSW 2208
Deloitte Touche Tohmatsu A.B.N. 74 490 121 060
Eclipse Tower 60 Station Street Parramatta Sydney, NSW, 2150 Australia
Phone: +61 2 9840 7000 www.deloitte.com.au
24 SHRIRO HOLDINGS LIMITED ANNUAL REPORT 2016
For
per
sona
l use
onl
y

Independent Auditor’s Report
Liability limited by a scheme approved under Professional Standards Legislation. Member of Deloitte Touche Tohmatsu Limited
Independent Auditor’s Report to the members of Shriro Holdings Limited
Report on the Audit of the Financial Report
Opinion
We have audited the financial report of Shriro Holdings Limited (the Company) and its subsidiaries (the Group), which comprises the consolidated statement of financial position as at 31 December 2016, the consolidated statement of profit or loss, the consolidated statement of profit or loss and other comprehensive income, the consolidated statement of changes in equity and the consolidated statement of cash flows for the year then ended, and notes to the financial statements, including a summary of significant accounting policies, and the directors’ declaration as set out on pages 30 to 63.
In our opinion, the accompanying financial report of the Group is in accordance with the Corporations Act 2001, including:
(i) giving a true and fair view of the Group’s financial position as at 31 December 2016 and of its financialperformance for the year ended; and
(ii) complying with Australian Accounting Standards and the Corporations Regulations 2001.
Basis for Opinion
We conducted our audit in accordance with Australian Auditing Standards. Our responsibilities under those standards are further described in the Auditor’s Responsibilities for the Audit of the Financial Report section of our report. We are independent of the Group in accordance with the auditor independence requirements of the Corporations Act 2001 and the ethical requirements of the Accounting Professional and Ethical Standards Board’s APES 110 Code of Ethics for Professional Accountants (the Code) that are relevant to our audit of the financial report in Australia. We have also fulfilled our other ethical responsibilities in accordance with the Code.
We confirm that the independence declaration required by the Corporations Act 2001, which has been given to the directors of the Company, would be in the same terms if given to the directors as at the time of this auditor’s report.
We believe that the audit evidence we have obtained is sufficient and appropriate to provide a basis for our opinion.
Deloitte Touche Tohmatsu ABN 74 490 121 060
Eclipse Tower 60 Station Street Parramatta Sydney, NSW, 2150 Australia
Phone: +61 2 9840 7000 www.deloitte.com.au
25
For
per
sona
l use
onl
y

INDEPENDENT AUDITOR’S REPORT (CONT’D)
Key Audit Matters
Key audit matters are those matters that, in our professional judgement, were of most significance in our audit of the financial report for the current period. These matters were addressed in the context of our audit of the financial report as a whole, and in forming our opinion thereon, and we do not provide a separate opinion on these matters.
Key Audit Matter How the scope of our audit responded to the Key Audit Matter
Provision for rebates
As at 31 December 2016, the total value of the provision for rebates is $8.9 million (2015: $8.6 million) as discussed in note 1(n) and note 1(t).
Shriro has rebate agreements with certain customers in line with industry practice. The provision for volume and stretch rebates has a direct impact on revenue recognition. Accounting for these rebates is complex and requires judgement, including consideration of the timing of recognition and the presentation thereof.
We evaluated and challenged management’s estimates and judgements in respect of the volume and stretch rebate provision as follows:
• Holding discussions with managementand other company personnel tounderstand the rebate structures in placeand the manner in which the systemprocesses and accounts for the rebates;
• Challenging the appropriateness ofmanagement’s policy in accordance withthe relevant accounting standards;
• Comparing the rates relevant to volumeand stretch rebates within thecomputations to those included in salescontracts and agreements with thirdparties (retail and wholesale customers);
• Reviewing rebate invoices and creditnotes issued subsequent to year-end inorder to assess the accuracy ofmanagement’s forecast sales volumes;
• Recalculating the rebate provision to testthe accuracy of the formula; and
• Performing a retrospective review of thebalance from FY2012 to FY2016 toassess the historical accuracy ofmanagement’s estimation of the rebateprovision.
We also assessed the appropriateness of the related disclosures in Note 1(n), 1(t) and 7 to the financial statements.
26 SHRIRO HOLDINGS LIMITED ANNUAL REPORT 2016
For
per
sona
l use
onl
y
Provision for warranties
Shriro has obligations in respect of statutory warranties on a range of products it sells. The warranty period is generally for 1 to 2 years and the Group does not offer extended warranties. There is significant judgment involved in determining the appropriate level for the warranty provision as disclosed in note 1(s), 1(t) and note 13.
The provision for product warranties of $2.8 million as at 31 December 2016 (2015: $2.9 million) is estimated by management using a cost accrual approach based on historical actual payment experience, historical relationship to gross sales, estimated time to failure and a prediction period.
We evaluated and challenged management’s estimates and judgements in respect of the warranty provision as follows:
• Holding discussions with management toassess whether the warranty provisionwas consistent with the prior year andconsider if there were any changes tostatutory obligations;
• Testing a sample of the inputs in theformula/model used to calculate thewarranty provision to establish theaccuracy of the computation;
• Challenging the appropriateness ofmanagement’s policy in accordance withthe relevant accounting standards andstatutory obligations;
• Developing an independent expectationof the provision utilising historic warrantyclaims settled as a proportion of relatedsales;
• Performing a sensitivity analysis byvarying key inputs and assumptionswithin the formula; and
• Performing a retrospective review of thebalance from FY2013 to FY2016 toassess the historical accuracy ofmanagement’s estimation of thewarranty provision.
We also assessed the appropriateness of the related disclosures in Note 1(s), 1(t) and 13 to the financial statements.
Other Information
The directors are responsible for the other information. The other information comprises the information included in the annual report, but does not include the financial report and our auditor’s report thereon. The annual report is expected to be made available to us after the date of this auditor's report.
Our opinion on the financial report does not cover the other information and we will not express any form of assurance conclusion thereon.
In connection with our audit of the financial report, our responsibility is to read the other information identified above when it becomes available and, in doing so, consider whether the other information is materially inconsistent with the financial report or our knowledge obtained in the audit, or otherwise appears to be materially misstated.
When we read the other information not yet obtained, if we conclude that there is a material misstatement therein, we are required to communicate the matter to the directors and take appropriate action depending on the outcome.
27
For
per
sona
l use
onl
y

INDEPENDENT AUDITOR’S REPORT (CONT’D)
Directors’ Responsibilities for the Financial Report
The directors of the Company are responsible for the preparation of the financial report that gives a true and fair view in accordance with Australian Accounting Standards and the Corporations Act 2001 and for such internal control as the directors determine is necessary to enable the preparation of the financial report that gives a true and fair view and is free from material misstatement, whether due to fraud or error.
In preparing the financial report, the directors are responsible for assessing the Group’s ability to continue as a going concern, disclosing, as applicable, matters related to going concern and using the going concern basis of accounting unless the directors either intend to liquidate the Group or to cease operations, or has no realistic alternative but to do so.
Auditor’s Responsibilities for the Audit of the Financial Report
Our objectives are to obtain reasonable assurance about whether the financial report as a whole is free from material misstatement, whether due to fraud or error, and to issue an auditor’s report that includes our opinion. Reasonable assurance is a high level of assurance, but is not a guarantee that an audit conducted in accordance with the Australian Auditing Standards will always detect a material misstatement when it exists. Misstatements can arise from fraud or error and are considered material if, individually or in the aggregate, they could reasonably be expected to influence the economic decisions of users taken on the basis of this financial report.
As part of an audit in accordance with the Australian Auditing Standards, we exercise professional judgement and maintain professional scepticism throughout the audit. We also:
• Identify and assess the risks of material misstatement of the financial report, whether due to fraud orerror, design and perform audit procedures responsive to those risks, and obtain audit evidence that issufficient and appropriate to provide a basis for our opinion. The risk of not detecting a materialmisstatement resulting from fraud is higher than for one resulting from error, as fraud may involvecollusion, forgery, intentional omissions, misrepresentations, or the override of internal control.
• Obtain an understanding of internal control relevant to the audit in order to design audit proceduresthat are appropriate in the circumstances, but not for the purpose of expressing an opinion on theeffectiveness of the Group’s internal control.
• Evaluate the appropriateness of accounting policies used and the reasonableness of accountingestimates and related disclosures made by the directors.
• Conclude on the appropriateness of the directors’ use of the going concern basis of accounting and,based on the audit evidence obtained, whether a material uncertainty exists related to events orconditions that may cast significant doubt on the Group’s ability to continue as a going concern. If weconclude that a material uncertainty exists, we are required to draw attention in our auditor’s report tothe related disclosures in the financial report or, if such disclosures are inadequate, to modify ouropinion. Our conclusions are based on the audit evidence obtained up to the date of our auditor’sreport. However, future events or conditions may cause the Group to cease to continue as a goingconcern.
• Evaluate the overall presentation, structure and content of the financial report, including thedisclosures, and whether the financial report represents the underlying transactions and events in amanner that achieves fair presentation.
• Obtain sufficient appropriate audit evidence regarding the financial information of the entities orbusiness activities within the Group to express an opinion on the financial report. We are responsible forthe direction, supervision and performance of the Group audit. We remain solely responsible for ouraudit opinion.
28 SHRIRO HOLDINGS LIMITED ANNUAL REPORT 2016
For
per
sona
l use
onl
y
We communicate with the directors regarding, among other matters, the planned scope and timing of the audit and significant audit findings, including any significant deficiencies in internal control that we identify during our audit.
We also provide the directors with a statement that we have complied with relevant ethical requirements regarding independence, and to communicate with them all relationships and other matters that may reasonably be thought to bear on our independence, and where applicable, related safeguards.
From the matters communicated with the directors, we determine those matters that were of most significance in the audit of the financial report of the current period and are therefore the key audit matters. We describe these matters in our auditor’s report unless law or regulation precludes public disclosure about the matter or when, in extremely rare circumstances, we determine that a matter should not be communicated in our report because the adverse consequences of doing so would reasonably be expected to outweigh the public interest benefits of such communication.
Report on the Remuneration Report
Opinion on the Remuneration Report
We have audited the Remuneration Report included in pages 17 to 22 of the directors’ report for the year ended 31 December 2016.
In our opinion, the Remuneration Report of Shriro Holdings Limited, for the year ended 31 December 2016, complies with section 300A of the Corporations Act 2001.
Responsibilities
The directors of the Company are responsible for the preparation and presentation of the Remuneration Report in accordance with section 300A of the Corporations Act 2001. Our responsibility is to express an opinion on the Remuneration Report, based on our audit conducted in accordance with Australian Auditing Standards.
DELOITTE TOUCHE TOHMATSU
X Delaney
Partner
Chartered Accountants
Parramatta, 14 February 2017
29
For
per
sona
l use
onl
y

Directors’ Declaration
The Directors declare that:
a. in the Directors’ opinion, there are reasonable grounds to believe that the company will be able to pay its debts as and when they become due and payable;
b. in the Directors’ opinion the attached financial statements are in compliance with International Financial Reporting Standard, as stated in note 1 to the financial statements;
c. in the Directors’ opinion, the attached financial statements and notes thereto are in accordance with the Corporations Act 2001, including compliance with accounting standards and giving a true and fair view of the financial position and performance of the company, and
d. the Directors have been given the declarations required by s.295A of the Corporations Act 2001.
At the date of this declaration, the company is within the class of companies affected by ASIC Class Order 98/1418. The nature of the deed of cross guarantee is such that each company which is party to the deed guarantees to each creditor payment in full of any debt in accordance with the deed of cross guarantee. In the Directors’ opinion, there are reasonable grounds to believe that the company and the companies to which the ASIC Class Order applies, as detailed in note 26 to the financial statements will, as a group, be able to meet any obligations or liabilities to which they are, or may become, subject by virtue of the deed of cross guarantee.
Signed in accordance with a resolution of the Directors made pursuant to s295(5) of the Corporations Act 2001.
On behalf of the Directors
John Ingram Mike WestrupDirector Director
Sydney, 14th of February 2017 Sydney, 14th of February 2017
30 SHRIRO HOLDINGS LIMITED ANNUAL REPORT 2016
For
per
sona
l use
onl
y

Consolidated Statement of Profit or LossFOR THE FINANCIAL YEAR ENDED 31 DECEMBER 2016
Note2016
$’0002015
$’000
Revenue from ordinary activities 2 183,464 186,300
Changes in inventories of finished goods 15 (6,258)
Raw materials and consumables used – (954)
Cost of purchased distribution inventory (105,277) (99,432)
Employee benefits expense (25,335) (27,123)
Advertising and promotion expenses (5,697) (5,263)
Freight and delivery expenses (7,013) (7,938)
Depreciation and amortisation expenses 3 (3,576) (3,386)
Rental costs (6,247) (5,413)
Finance costs 3 (1,263) (1,876)
Other expenses (10,887) (11,188)
IPO related costs 5 – (5,658)
Profit before tax 18,184 11,811
Income tax expense 6 (5,022) (4,693)
Profit for the year 13,162 7,118
Earnings per share
Basic (cents per share) 17 13.9 9.0
Diluted (cents per share) 17 13.7 8.9
The consolidated statement of profit or loss should be read in conjunction with the Notes to the financial statements.
31
For
per
sona
l use
onl
y

Consolidated Statement of Profit or Loss and Other Comprehensive IncomeFOR THE FINANCIAL YEAR ENDED 31 DECEMBER 2016
2016$’000
2015$’000
Profit for the year 13,162 7,118
Items that may be reclassified subsequently to profit or loss
Net change in the fair value of cash flow hedges taken to equity 308 (493)
Exchange differences on translation of foreign operations 340 (109)
Other comprehensive income for the year, net of tax 648 (602)
Total comprehensive income for the year attributable to the owners of Shriro Holdings Limited 13,810 6,516
The consolidated statement of profit or loss and other comprehensive income should be read in conjunction with the Notes to the financial statements.
32 SHRIRO HOLDINGS LIMITED ANNUAL REPORT 2016
For
per
sona
l use
onl
y

Consolidated Statement of Financial PositionAS AT 31 DECEMBER 2016
Note2016
$’0002015
$’000
Current assets
Cash and cash equivalents 21 15 1,040
Trade and other receivables 7 34,933 31,580
Inventories 8 39,654 39,576
Other assets 9 1,273 886
Derivative receivable 496 234
Total current assets 76,371 73,316
Non-current assets
Property, plant and equipment 10 9,989 10,018
Deferred tax assets 6 5,176 4,718
Total non-current assets 15,165 14,736
Total assets 91,536 88,052
Current liabilities
Trade and other payables 11 20,733 18,738
Borrowings 12 3,535 1,430
Current tax liabilities 1,764 1,204
Provisions 13 6,539 6,462
Derivative payable 674 685
Total current liabilities 33,245 28,519
Non-current liabilities
Borrowings 12 2,000 9,000
Provisions 13 3,026 2,833
Total non-current liabilities 5,026 11,833
Total liabilities 38,271 40,352
Net assets 53,265 47,700
Equity
Issued capital 14 94,541 94,541
Reserves 15 (76,149) (74,990)
Retained earnings 16 34,873 28,149
Total equity 53,265 47,700
The consolidated statement of financial position should be read in conjunction with the Notes to the financial statements.
33
For
per
sona
l use
onl
y
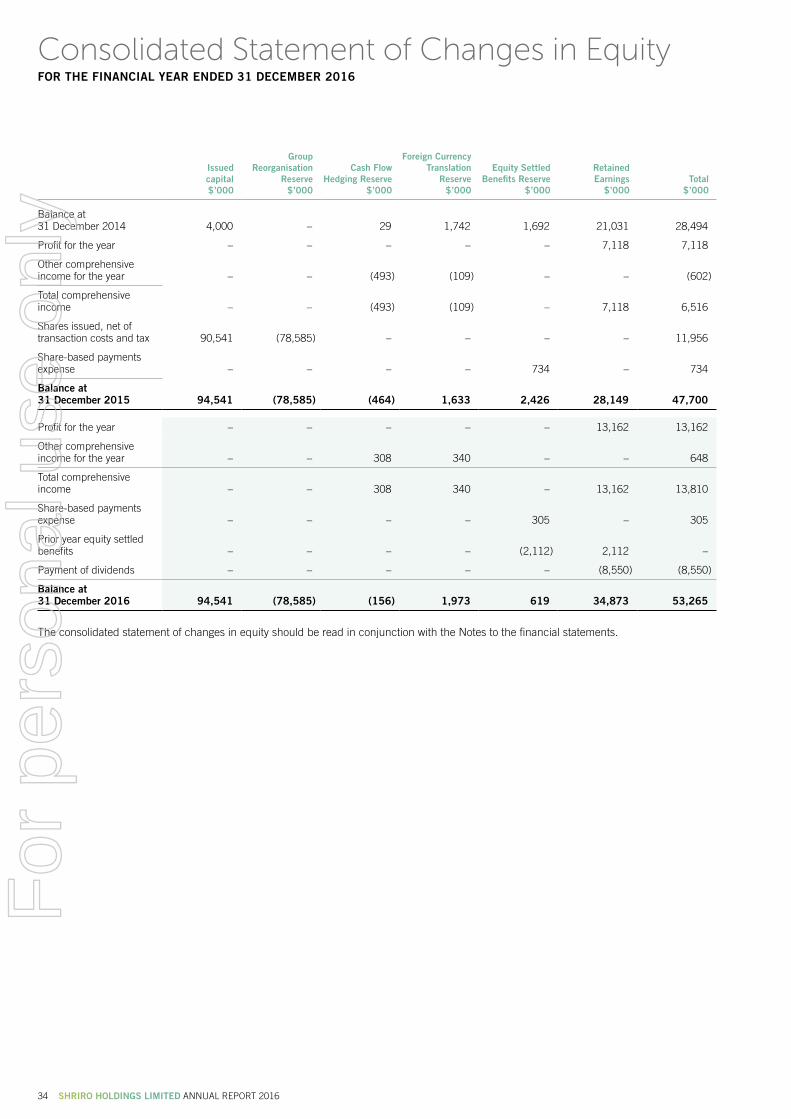
Consolidated Statement of Changes in EquityFOR THE FINANCIAL YEAR ENDED 31 DECEMBER 2016
Issuedcapital$’000
Group Reorganisation
Reserve $’000
Cash Flow Hedging Reserve
$’000
Foreign Currency Translation
Reserve$’000
Equity Settled Benefits Reserve
$’000
Retained Earnings
$’000Total
$’000
Balance at 31 December 2014 4,000 – 29 1,742 1,692 21,031 28,494
Profit for the year – – – – – 7,118 7,118
Other comprehensive income for the year – – (493) (109) – – (602)
Total comprehensive income – – (493) (109) – 7,118 6,516
Shares issued, net of transaction costs and tax 90,541 (78,585) – – – – 11,956
Share-based payments expense – – – – 734 – 734
Balance at 31 December 2015 94,541 (78,585) (464) 1,633 2,426 28,149 47,700
Profit for the year – – – – – 13,162 13,162
Other comprehensive income for the year – – 308 340 – – 648
Total comprehensive income – – 308 340 – 13,162 13,810
Share-based payments expense – – – – 305 – 305
Prior year equity settled benefits – – – – (2,112) 2,112 –
Payment of dividends – – – – – (8,550) (8,550)
Balance at 31 December 2016 94,541 (78,585) (156) 1,973 619 34,873 53,265
The consolidated statement of changes in equity should be read in conjunction with the Notes to the financial statements.
34 SHRIRO HOLDINGS LIMITED ANNUAL REPORT 2016
For
per
sona
l use
onl
y

Consolidated Statement of Cash FlowsFOR THE FINANCIAL YEAR ENDED 31 DECEMBER 2016
Note2016
$’0002015
$’000
Cash flows from operating activities
Receipts from customers 198,457 205,271
Payments to suppliers and employees (176,404) (173,992)
Finance costs paid (1,228) (1,825)
Income taxes paid (4,920) (4,517)
Net cash provided by operating activities 21.2 15,905 24,937
Cash flows from investing activities
Proceeds from sale of property, plant and equipment 151 115
Payment for property, plant and equipment (3,662) (3,854)
Net cash used in investing activities (3,511) (3,739)
Cash flows from financing activities
Repayment of borrowings (4,895) (28,969)
Issue of capital – 6,200
IPO related costs – (5,482)
Settlement of management loan – 6,000
Dividends paid (8,550) –
Net cash used in financing activities (13,445) (22,251)
Net decrease in cash and cash equivalents (1,051) (1,053)
Cash and cash equivalents at the beginning of the financial year 1,040 2,105
Effects of exchange rate changes on cash 26 (12)
Cash and cash equivalents at the end of the financial year 21.1 15 1,040
The consolidated statement of cash flows should be read in conjunction with the Notes to the financial statements.
35
For
per
sona
l use
onl
y
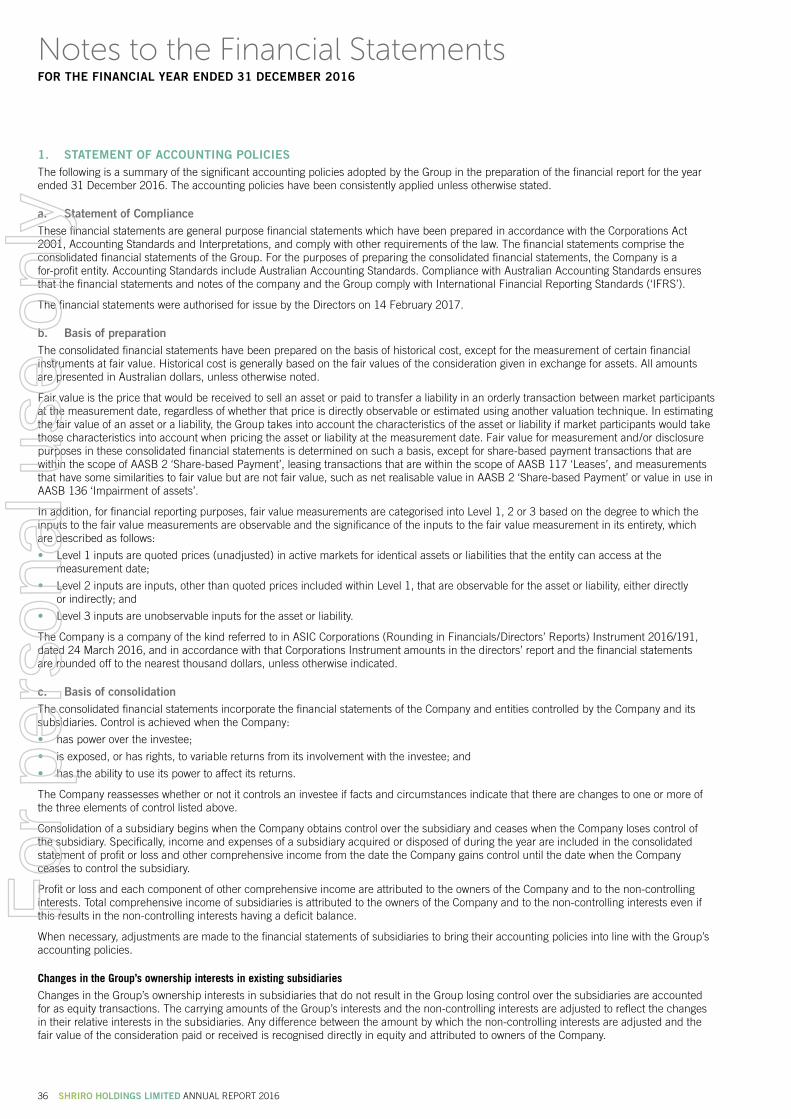
Notes to the Financial Statements FOR THE FINANCIAL YEAR ENDED 31 DECEMBER 2016
1. STATEMENT OF ACCOUNTING POLICIESThe following is a summary of the significant accounting policies adopted by the Group in the preparation of the financial report for the year ended 31 December 2016. The accounting policies have been consistently applied unless otherwise stated.
a. Statement of ComplianceThese financial statements are general purpose financial statements which have been prepared in accordance with the Corporations Act 2001, Accounting Standards and Interpretations, and comply with other requirements of the law. The financial statements comprise the consolidated financial statements of the Group. For the purposes of preparing the consolidated financial statements, the Company is a for-profit entity. Accounting Standards include Australian Accounting Standards. Compliance with Australian Accounting Standards ensures that the financial statements and notes of the company and the Group comply with International Financial Reporting Standards (‘IFRS’).
The financial statements were authorised for issue by the Directors on 14 February 2017.
b. Basis of preparationThe consolidated financial statements have been prepared on the basis of historical cost, except for the measurement of certain financial instruments at fair value. Historical cost is generally based on the fair values of the consideration given in exchange for assets. All amounts are presented in Australian dollars, unless otherwise noted.
Fair value is the price that would be received to sell an asset or paid to transfer a liability in an orderly transaction between market participants at the measurement date, regardless of whether that price is directly observable or estimated using another valuation technique. In estimating the fair value of an asset or a liability, the Group takes into account the characteristics of the asset or liability if market participants would take those characteristics into account when pricing the asset or liability at the measurement date. Fair value for measurement and / or disclosure purposes in these consolidated financial statements is determined on such a basis, except for share-based payment transactions that are within the scope of AASB 2 ‘Share-based Payment’, leasing transactions that are within the scope of AASB 117 ‘Leases’, and measurements that have some similarities to fair value but are not fair value, such as net realisable value in AASB 2 ‘Share-based Payment’ or value in use in AASB 136 ‘Impairment of assets’.
In addition, for financial reporting purposes, fair value measurements are categorised into Level 1, 2 or 3 based on the degree to which the inputs to the fair value measurements are observable and the significance of the inputs to the fair value measurement in its entirety, which are described as follows:
• Level 1 inputs are quoted prices (unadjusted) in active markets for identical assets or liabilities that the entity can access at the measurement date;
• Level 2 inputs are inputs, other than quoted prices included within Level 1, that are observable for the asset or liability, either directly or indirectly; and
• Level 3 inputs are unobservable inputs for the asset or liability.
The Company is a company of the kind referred to in ASIC Corporations (Rounding in Financials / Directors’ Reports) Instrument 2016/191, dated 24 March 2016, and in accordance with that Corporations Instrument amounts in the directors’ report and the financial statements are rounded off to the nearest thousand dollars, unless otherwise indicated.
c. Basis of consolidationThe consolidated financial statements incorporate the financial statements of the Company and entities controlled by the Company and its subsidiaries. Control is achieved when the Company:
• has power over the investee;
• is exposed, or has rights, to variable returns from its involvement with the investee; and
• has the ability to use its power to affect its returns.
The Company reassesses whether or not it controls an investee if facts and circumstances indicate that there are changes to one or more of the three elements of control listed above.
Consolidation of a subsidiary begins when the Company obtains control over the subsidiary and ceases when the Company loses control of the subsidiary. Specifically, income and expenses of a subsidiary acquired or disposed of during the year are included in the consolidated statement of profit or loss and other comprehensive income from the date the Company gains control until the date when the Company ceases to control the subsidiary.
Profit or loss and each component of other comprehensive income are attributed to the owners of the Company and to the non-controlling interests. Total comprehensive income of subsidiaries is attributed to the owners of the Company and to the non-controlling interests even if this results in the non-controlling interests having a deficit balance.
When necessary, adjustments are made to the financial statements of subsidiaries to bring their accounting policies into line with the Group’s accounting policies.
Changes in the Group’s ownership interests in existing subsidiaries
Changes in the Group’s ownership interests in subsidiaries that do not result in the Group losing control over the subsidiaries are accounted for as equity transactions. The carrying amounts of the Group’s interests and the non-controlling interests are adjusted to reflect the changes in their relative interests in the subsidiaries. Any difference between the amount by which the non-controlling interests are adjusted and the fair value of the consideration paid or received is recognised directly in equity and attributed to owners of the Company.
36 SHRIRO HOLDINGS LIMITED ANNUAL REPORT 2016
For
per
sona
l use
onl
y

d. Tax consolidationThe company and its wholly-owned Australian resident entities have formed a tax-consolidated group with effect from 23 June 2015 and are therefore taxed as a single entity from that date. The head entity within the tax-consolidated group is Shriro Holdings Limited. The members of the tax-consolidated group are Shriro Australia Pty Limited and Shriro Pty Limited. This resulted in the closure of the previous multiple entry consolidated group which consisted of Shriro Pty Limited and Shriro Chaplin Drive Lane Cove Pty Ltd.
Tax expense / income, deferred tax liabilities and deferred tax assets arising from temporary differences of the members of the tax-consolidated group are recognised in the separate financial statements of the members of the tax-consolidated group using the ‘separate taxpayer within group’ approach by reference to the carrying amounts in the separate financial statements of each entity and the tax values applying under tax.
Current tax liabilities and assets and deferred tax assets arising from unused tax losses and relevant tax credits of the members of the tax-consolidated group are recognised by the company (as head entity in the tax-consolidated group).
Entities within the tax-consolidated group have entered into a tax funding arrangement and a tax sharing agreement with the head entity. Under the terms of the tax funding arrangement, the company and each of the entities in the tax-consolidated group has agreed to pay a tax equivalent payment to or from the head entity, based on the current tax liability or current tax asset of the entity.
Under the terms of the tax funding arrangement, amounts are recognised as payable to or receivable by the company and each member of the group in relation to the tax contribution amounts paid or payable between the parent entity and the other members of the tax-consolidated group in accordance with the arrangement.
The tax sharing agreement provides for the determination of the allocation of income tax liabilities between the entities should the head entity default on its tax payment obligations or if an entity should leave the tax consolidated group. The effect of the tax sharing agreement is that each member’s liability for tax payable by the tax-consolidated group is limited to the amount payable to the head entity under the tax funding arrangement.
e. Income Tax
Current Tax
The tax currently payable is based on taxable profit for the period. Taxable profit differs from profit before tax as reported in the consolidated statement of profit and loss and other comprehensive income because of items of income or expense that are taxable or deductible in other years and items that are never taxable or deductible. The Group’s liability for current tax is calculated using rates that have been enacted by the end of the reporting period.
Deferred Tax
Deferred tax is recognised on temporary differences between the carrying amounts of assets and liabilities in the financial statements and the corresponding tax bases used in the computation of taxable profit. Deferred tax liabilities are generally recognised for all taxable temporary differences.
Deferred tax assets are generally recognised for all deductible temporary differences to the extent that it is probable that taxable profits will be available against which those deductible temporary differences can be utilised. Such deferred tax assets and liabilities are not recognised if the temporary difference arises from goodwill or from the initial recognition (other than in a business combination) of other assets and liabilities in a transaction that affects neither the taxable profit nor the accounting profit. In addition, deferred tax liabilities are not recognised if the temporary difference arises from the initial recognition of goodwill.
Deferred tax liabilities are recognised for taxable temporary differences associated with investments in subsidiaries and associates, and interests in joint ventures, except where the Company is able to control the reversal of the temporary difference and it is probable that the temporary difference will not reverse in the foreseeable future. Deferred tax assets arising from deductible temporary differences associated with such investments and interests are only recognised to the extent that it is probable that there will be sufficient taxable profits against which to utilise the benefits of the temporary differences and they are expected to reverse in the foreseeable future
The carrying amount of deferred tax assets is reviewed at the end of each reporting period and reduced to the extent that it is no longer probable that sufficient taxable profits will be available to allow all or part of the asset to be recovered.
Deferred tax assets and liabilities are measured at the tax rates that are expected to apply in the period in which the liability is settled or the asset realised, based on tax rates (and tax laws) that have been enacted or substantively enacted by the end of the reporting period. The measurement of deferred tax liabilities and assets reflects the tax consequences that would follow from the manner in which the Group expects, at the end of the reporting period, to recover or settle the carrying amount of its assets and liabilities.
Deferred tax liabilities and assets are offset when there is a legally enforceable right to set off current tax assets against current tax liabilities and when they relate to income taxes levied by the same taxation authority and the Group intends to settle its current tax assets and liabilities on a net basis.
37
For
per
sona
l use
onl
y

NOTES TO THE FINANCIAL STATEMENTS (CONT’D)
f. Foreign currenciesFor the purpose of the financial statements, the results and financial position of the Group are expressed in Australian dollars, which is the functional currency of the company and the presentation currency for the consolidated financial statements.
In preparing the financial statements, transactions in currencies other than the Group’s functional currency (foreign currencies) are recognised at the rates prevailing at the dates of the transactions. At the end of each reporting period, monetary items denominated in foreign currencies are retranslated at the rates prevailing at that date. Non-monetary items carried at fair value that are denominated in foreign currencies are retranslated at the rates prevailing at the date when the fair value was determined. Non-monetary items that are measured in terms of historical cost in a foreign currency are not retranslated.
Exchange differences on monetary items are recognised in profit or loss in the period in which they arise except for:
• exchange differences on transactions entered into in order to hedge certain foreign currency risks (see 1(s) below for hedging accounting policies); and
• exchange differences on monetary items receivable from or payable to a foreign operation for which settlement is neither planned nor likely to occur (therefore forming part of the net investment in the foreign operation), which are recognised initially in other comprehensive income and reclassified from equity to profit or loss on repayment of the monetary items.
For the purpose of presenting the consolidated financial statements, the assets and liabilities of the Company’s foreign operations are translated into Australian dollars using exchange rates prevailing at the end of the reporting period. Income and expense items are translated at the average monthly exchange rates during the period, unless exchange rates fluctuated significantly during that period, in which case the exchange rates at the dates of the transactions are used. Exchange differences arising, if any, are recognised in other comprehensive income and accumulated in equity (attributed to non-controlling interests as appropriate).
g. Borrowing CostsBorrowing costs are recognised in profit or loss in the period in which they are incurred.
h. InventoriesInventory on hand is valued at the lower of cost and net realisable value using the weighted average cost method and includes all costs associated with its acquisition. Inventory in transit is valued at the lower of cost and net realisable value.
Net realisable value represents the estimated selling price for inventories less all estimated costs of completion and costs necessary to make the sale.
i. Plant and EquipmentEach class of plant and equipment is carried at cost less, where applicable, any accumulated depreciation and impairment losses.
Plant and equipment are measured at their cost of acquisition at the date of acquisition, being the fair value of the consideration provided plus incidental costs directly attributed to the acquisition.
The carrying amount of plant and equipment is reviewed annually by Directors to ensure it is not in excess of the recoverable amount from those assets. Refer note 1(j) for impairment of assets.
Depreciation
The depreciable amount of plant and equipment is depreciated on a straight line basis over their estimated useful lives to the Group commencing from the time the asset is held ready for use.
Depreciation is recognised so as to write off the cost or valuation of assets (other than freehold land and properties under construction) less their residual values over their useful lives, using the straight-line method. The estimated useful lives, residual values and depreciation method are reviewed at the end of each reporting period, with the effect of any changes in estimate accounted for on a prospective basis. The following rates of depreciation are used in assessing the depreciation charge:
Furniture and Fittings 4 – 20 years
Motor Vehicles 5 – 8 years
Plant and Equipment 4 – 20 years
Display assets 2 – 3 years
Office Equipment 2 – 20 years
Leasehold improvements 3 – 10 years
An item of property, plant and equipment is derecognised upon disposal or when no future economic benefits are expected to arise from the continued use of the asset. Any gain or loss arising on the disposal or retirement of an item of property, plant and equipment is determined as the difference between the sales proceeds and the carrying amount of the asset and is recognised in profit or loss.
1. STATEMENT OF ACCOUNTING POLICIES (CONT’D)
38 SHRIRO HOLDINGS LIMITED ANNUAL REPORT 2016
For
per
sona
l use
onl
y

j. Impairment of assetsAt the end of each reporting period, the Group reviews the carrying amounts of its tangible assets to determine whether there is any indication that those assets have suffered an impairment loss. If any such indication exists, the recoverable amount of the asset is estimated in order to determine the extent of the impairment loss (if any). When it is not possible to estimate the recoverable amount of an individual asset, the Group estimates the recoverable amount of the cash generating unit to which the asset belongs. When a reasonable and consistent basis of allocation can be identified, corporate assets are also allocated to individual cash-generating units, or otherwise they are allocated to the smallest group of cash-generating units for which a reasonable and consistent allocation basis can be identified.
Recoverable amount is the higher of fair value less costs to sell and value in use. In assessing value in use, the estimated future cash flows are discounted to their present value using a pre-tax discount rate that reflects current market assessments of the time value of money and the risks specific to the asset for which the estimates of future cash flows have not been adjusted.
If the recoverable amount of an asset (or cash-generating unit) is estimated to be less than its carrying amount, the carrying amount of the asset (or cash-generating unit) is reduced to its recoverable amount. An impairment loss is recognised immediately in profit or loss, unless the relevant asset is carried at a revalued amount, in which case the impairment loss is treated as a revaluation decrease.
When an impairment loss subsequently reverses, the carrying amount of the asset (or cash-generating unit) is increased to the revised estimate of its recoverable amount, but so that the increased carrying amount does not exceed the carrying amount that would have been determined had no impairment loss been recognised for the asset (or cash-generating unit) in prior years. A reversal of an impairment loss is recognised immediately in profit or loss, unless the relevant asset is carried at a revalued amount, in which case the reversal of the impairment loss is treated as a revaluation increase.
k. Cash and cash equivalentsCash and cash equivalents includes cash on hand, deposits held at call with banks, other short-term highly liquid investments with original maturities of three months or less.
For the purposes of the statement of cash flows, cash and cash equivalents consist of cash balances. Bank overdrafts and debtor facilities are considered to be financing activities as they are used interchangeably to fund the operations, and are not repayable on demand.
l. Financial instrumentsFinancial assets and financial liabilities are recognised when a Group becomes a party to the contractual provisions of the instrument.
Financial assets and financial liabilities are initially measured at fair value. Transaction costs that are directly attributable to the acquisition or issue of financial assets and financial liabilities (other than financial assets and financial liabilities at fair value through profit or loss) are added to or deducted from the fair value of the financial assets or financial liabilities, as appropriate, on initial recognition. Transaction costs directly attributable to the acquisition of financial assets or financial liabilities at fair value through profit or loss are recognised immediately in profit or loss.
Financial assets
Financial assets are classified into the following specified categories: financial assets ‘at fair value through profit or loss’ (FVTPL), ‘held-to-maturity’ investments, ‘available-for-sale’ (AFS) financial assets and ‘loans and receivables’. The classification depends on the nature and purpose of the financial assets and is determined at the time of initial recognition. All regular way purchases or sales of financial assets are recognised and derecognised on a trade date basis. Regular way purchases or sales are purchases or sales of financial assets that require delivery of assets within the time frame established by regulation or convention in the marketplace.
Effective interest method
The effective interest method is a method of calculating the amortised cost of a debt instrument and of allocating interest income over the relevant period. The effective interest rate is the rate that exactly discounts estimated future cash receipts (including all fees on points paid or received that form an integral part of the effective interest rate, transaction costs and other premiums or discounts) through the expected life of the debt instrument, or (where appropriate) a shorter period, to the net carrying amount on initial recognition.
Income is recognised on an effective interest basis for debt instruments other than those financial assets classified as at FVTPL.
Impairment of financial assets
Financial assets, other than those at FVTPL, are assessed for indicators of impairment at the end of each reporting period. Financial assets are considered to be impaired when there is objective evidence that, as a result of one or more events that occurred after the initial recognition of the financial asset, the estimated future cash flows of the investment have been affected.
For AFS equity instruments, including listed or unlisted shares, objective evidence of impairment includes information about significant changes with an adverse effect that have taken place in the technological, market, economic or legal environment in which the issuer operates, and indicates that the cost of the investment in the equity instrument may not be recovered. A significant or prolonged decline in the fair value of the security below its cost is considered to be objective evidence of impairment for unlisted shares classified as available-for-sale.
39
For
per
sona
l use
onl
y

NOTES TO THE FINANCIAL STATEMENTS (CONT’D)
For financial assets carried at amortised cost, the amount of the impairment loss recognised is the difference between the asset’s carrying amount and the present value of estimated future cash flows, discounted at the financial asset’s original effective interest rate. For financial assets that are carried at cost, the amount of the impairment loss is measured as the difference between the asset’s carrying amount and the present value of the estimated future cash flows discounted at the current market rate of return for a similar financial asset. Such impairment loss will not be reversed in subsequent periods. The carrying amount of the financial asset is reduced by the impairment loss directly for all financial assets.
For certain categories of financial assets, such as trade receivables, assets are assessed for impairment on a collective basis even if they were assessed not to be impaired individually. Objective evidence of impairment for a portfolio of receivables could include the Group’s past experience of collecting payments, an increase in the number of delayed payments in the portfolio past the average credit period, as well as observable changes in national or local economic conditions that correlate with default on receivables.
When an AFS financial asset is considered to be impaired, cumulative gains or losses previously recognised in other comprehensive income are reclassified to profit or loss in the period. For financial assets measured at amortised cost, if, in a subsequent period, the amount of the impairment loss decreases and the decrease can be related objectively to an event occurring after the impairment was recognised, the previously recognised impairment loss is reversed through profit or loss to the extent that the carrying amount of the investment at the date the impairment is reversed does not exceed what the amortised cost would have been had the impairment not been recognised.
Loans and receivables
Trade receivables, loans, and other receivables that have fixed or determinable payments that are not quoted in an active market are classified as ‘loans and receivables’. Loans and receivables are measured at amortised cost using the effective interest method, less any impairment. Interest income is recognised by applying the effective interest rate, except for short-term receivables when the effect of discounting is immaterial.
Derecognition of financial assets
The Group derecognises a financial asset when the contractual rights to the cash flows from the asset expire, or when it transfers the financial asset and substantially all the risks and rewards of ownership of the asset to another party. If the Group neither transfers nor retains substantially all the risks and rewards of ownership and continues to control the transferred asset, the Group recognises its retained interest in the asset and an associated liability for amounts it may have to pay. If the Group retains substantially all the risks and rewards of ownership of a transferred financial asset, the Group continues to recognise the financial asset and also recognises a collateralised borrowing for the proceeds received.
On derecognition of a financial asset in its entirety, the difference between the asset’s carrying amount and the sum of the consideration received and receivable and the cumulative gain or loss that had been recognised in other comprehensive income and accumulated in equity is recognised in profit or loss.
On derecognition of a financial asset other than in its entirety (e.g. when the Group retains an option to repurchase part of a transferred asset), the Group allocates the previous carrying amount of the financial asset between the part it continues to recognise under continuing involvement, and the part it no longer recognises on the basis of the relative fair values of those parts on the date of the transfer. The difference between the carrying amount allocated to the part that is no longer recognised and the sum of the consideration received for the part no longer recognised and any cumulative gain or loss allocated to it that had been recognised in other comprehensive income is recognised in profit or loss. A cumulative gain or loss that had been recognised in other comprehensive income is allocated between the part that continues to be recognised and the part that is no longer recognised on the basis of the relative fair values of those parts.
Financial Liabilities
Financial liabilities are classified as either financial liabilities ‘at FVTPL’ or ‘other financial liabilities’.
m. Employee benefitsA liability is recognised for benefits accruing to employees in respect of wages and salaries, annual leave, long service leave, and sick leave when it is probable that settlement will be required and they are capable of being measured reliably.
Liabilities recognised in respect of short-term employee benefits, are measured at their nominal values using the remuneration rate expected to apply at the time of settlement.
Liabilities recognised in respect of long term employee benefits are measured as the present value of the estimated future cash outflows to be made by the Group in respect of services provided by employees up to reporting date. The discount rate adopted at 31 December 2016 is the High Quality Corporate Bond Rate, previously a risk free bond rate, and the change represents a change in accounting estimates. The impact is not significant.
Sharebased payments transactions of the Company
Equity-settled share-based payments to employees and others providing similar services are measured at the fair value of the equity instruments at the grant date. Fair value is measured by use of a binomial model. The expected life used in the model is adjusted, based on management’s best estimate, for the effects of non-transferability, exercise restrictions, and behavioural considerations.
The fair value determined at the grant date of the equity-settled share-based payments is expensed on a straight-line basis over the vesting period, based on the Company’s estimate of equity instruments that will eventually vest with a corresponding increase in equity.
1. STATEMENT OF ACCOUNTING POLICIES (CONT’D)
40 SHRIRO HOLDINGS LIMITED ANNUAL REPORT 2016
For
per
sona
l use
onl
y
n. Revenue recognitionRevenue is measured at the fair value of the consideration received or receivable. Revenue is reduced for estimated customer returns, rebates and other similar allowances.
Sale of goods
Revenue from the sale of goods is recognised when the goods are delivered and titles have passed, which generally occurs on receipt of goods by the customer.
Rebates
Revenue from the sale of goods is recorded after deducting for any future rebates payable in relation to each sale. Rebates are accrued at a customer and product group level and are settled with customers in line with applicable trading terms. A rebate accrual is maintained for rebates not yet paid to customers, and forms part of the trade and other receivables balance. Based on historical data and analysis the accrual is reviewed at the end of each reporting period.
Interest income
Interest income from a financial asset is recognised when it is probable that the economic benefits will flow to the Group and the amount of revenue can be measured reliably. Interest income is accrued on a time basis, by reference to the principal outstanding and at the effective interest rate applicable, which is the rate that exactly discounts estimated future cash receipts through the expected life of the financial asset to that asset’s net carrying amount on initial recognition.
o. Earnings per shareBasic and diluted earnings per share is calculated on profit after taxation attributable to members of Shriro Holdings Limited and the weighted average number of shares on issue during the year. The number of shares prior to listing used in the weighted average calculation has been based on the issue of shares at the time of the Group’s reorganisation. Refer to note 17 for the calculation of the weighted average number of ordinary shares used in calculating basic and diluted earnings per share.
p. LeasingLeases are classified as finance leases whenever the terms of the lease transfer substantially all the risks and rewards of ownership to the lessee. All other leases are classified as operating leases.
The company as lessor
Rental income from operating leases is recognised on a straight-line basis over the term of the relevant lease. Initial direct costs incurred in negotiating and arranging an operating lease are added to the carrying amount of the leased asset and recognised on a straight-line basis over the lease term.
In the event that lease incentives are provided in order to enter into operating leases, such incentives are recognised as an asset. The aggregate benefit of incentives is recognised as a reduction of rental income on a straight-line basis.
The company as lessee
Operating lease payments are recognised as an expense on a straight-line basis over the lease term, except where another systematic basis is more representative of the time pattern in which economic benefits from the leased asset are consumed. Contingent rentals arising under operating leases are recognised as an expense in the period in which they are incurred.
In the event that lease incentives are received to enter into operating leases, such incentives are recognised as a liability. The aggregate benefit of incentives is recognised as a reduction of rental expense on a straight-line basis, except where another systematic basis is more representative of the time pattern in which economic benefits from the leased asset are consumed.
q. Goods and services tax (GST)Revenues, expenses and assets are recognised net of the amount of GST, except where the amount of GST incurred is not recoverable from the Australian Taxation Office. In these circumstances the GST is recognised as part of the cost of acquisition of the asset or as part of an item of the expense. Receivables and payables in the statement of financial position are shown inclusive of GST.
Cash flows are presented in the statement of cash flows on a gross basis, except for the GST components of investing and financing activities, which are disclosed as operating cash flows.
r. Derivative financial instrumentsThe Group enters into a variety of derivative financial instruments to manage its exposure to foreign exchange rate risk, including forward foreign exchange contracts.
Derivatives are initially recognised at fair value on the date a derivative contract is entered into and are subsequently remeasured to their fair value at each reporting date. The resulting gain or loss is recognised in profit or loss immediately unless the derivative is designated and effective as a hedging instrument, in which event, the timing of the recognition in profit or loss depends on the nature of the hedge relationship.
41
For
per
sona
l use
onl
y
NOTES TO THE FINANCIAL STATEMENTS (CONT’D)
Derivatives are classified as a non-current asset or a non-current liability if the remaining maturity of the hedge relationship is more than 12 months after the reporting period and as a current asset or a current liability if the remaining maturity of the hedge relationship is less than 12 months after the reporting period.
Hedge accounting
Hedges of foreign exchange risk on firm commitments are designated as cash flow hedges. At the inception of the hedge relationship, the Group documents the relationship between the hedging instrument and the hedged item, along with its risk management objectives and its strategy for undertaking various hedge transactions. Furthermore, at the inception of the hedge and on an ongoing basis, the Group documents whether the hedging instrument that is used in a hedging relationship is highly effective in offsetting changes in fair values or cash flows of the hedged item.
Cash flow hedge
The effective portion of changes in the fair value of derivatives that are designated and qualify as cash flow hedges is recognised in other comprehensive income and accumulated under the heading of cash flow hedging reserve. The gain or loss relating to the ineffective portion is recognised immediately in profit or loss as part of other expenses or other income.
Amounts recognised in other comprehensive income and accumulated in equity are reclassified to profit or loss in the periods when the hedged item is recognised in profit or loss in the same line of the income statement as the recognised hedge item. However, when the forecast transaction that is hedged results in the recognition of a non-financial asset or a non-financial liability, the gains and losses previously recognised in other comprehensive income and accumulated in equity are transferred from equity and included in the initial measurement of the cost of the non-financial asset or non-financial liability.
Hedge accounting is discontinued when the hedging instrument expires or is sold, terminated, or exercised, or no longer qualifies for hedge accounting. At that time, any cumulative gain or loss deferred in equity remains in equity and is recognised when the forecast transaction is ultimately recognised in profit or loss. However, if all or a portion of a loss recognised directly in equity is not expected to be recovered in one or more future periods, the amount that is not expected to be recovered is recognised immediately in the profit and loss. When a forecast transaction is no longer expected to occur, the cumulative gain or loss that was deferred in equity is recognised immediately in profit or loss.
s. Provision for Warranty ClaimsThe Group sells goods or services to a client and provides a formal warranty or guarantee that any defects will be repaired or rectified. A provision is recorded for the related liability to an amount of the expected costs to be incurred for repair and rectification.
If the Group has not granted a formal warranty or guarantee to the customer, but by an established pattern of past practice, published policies or specific statements, the Group has created a valid expectation by its customers that it will settle its responsibilities resulting from selling the goods or providing the services, a provision is recorded for this constructive obligation.
The Group provides warranties ranging from one to two years, with the majority being less than two years.
t. Critical accounting estimates and judgmentsIn the preparation of the financial report management is required to make judgments, estimates and assumptions about carrying values of assets and liabilities that are not readily apparent from other sources. The estimates and associated assumptions are based on historical experience and various other factors that are believed to be reasonable under the circumstance, the results of which form the basis of making the judgments. Actual results may differ from these estimates.
The estimates and underlying assumptions are reviewed on an ongoing basis. Revisions to accounting estimates are recognised in the period in which the estimate is revised if the revision affects only that period or in the period of the revision and future periods if the revision affects both current and future periods.
Judgments made by management in the preparation of the financial report that have significant effects on the financial statements and estimates with a significant risk of material adjustments in the next year are disclosed, where applicable, in the relevant notes to the financial statements.
Accounting policies are selected and applied in a manner which ensures that the resulting financial information satisfies the concepts of relevance and reliability, thereby ensuring that the substance of the underlying transactions or other events is reported.
Provision for obsolescence
The provision for obsolescence of inventories assessment requires a degree of estimation and judgment. The level of the provision is assessed by taking into account the recent sales experience, the ageing of inventories and other factors that affect inventory obsolescence.
Warranty provision
In determining the level of provision required for warranties, the Group has made judgments in respect of the products, the number of customers who will actually use the warranty and how often, and the costs of fulfilling the conditions of the warranty. The provision is based on estimates made from historical warranty data associated with similar products and services.
1. STATEMENT OF ACCOUNTING POLICIES (CONT’D)
42 SHRIRO HOLDINGS LIMITED ANNUAL REPORT 2016
For
per
sona
l use
onl
y

Rebates provision
The provision for rebates requires a degree of estimation and judgment in relation to whether the customer will achieve the hurdles required to earn a rebate. The level of the provision is assessed by taking into account past rebates payment history.
u. Application of new and revised accounting standards
Changes in accounting policies and disclosures
In the current year, the Group has applied a number of new and revised AASBs issued by the Australian Accounting Standards Board (AASB). These are:
• AASB 2014-4 ‘Amendments to Australian Accounting Standards – Clarification of Acceptable Methods of Depreciation and Amortisation’
• AASB 2015-1 ‘Amendments to Australian Accounting Standards – Annual Improvements to Australian Accounting Standards 2012-2014 Cycle’
• AASB 2015-2 ‘Amendments to Australian Accounting Standards – Disclosure Initiative: Amendments to AASB 1’
• AASB 2015-3 ‘Amendments to Australian Accounting Standards arising from the withdrawal of AASB 1031 ‘Materiality’’
• AASB 2015-4 ‘Amendments to Australian Accounting Standards – Financial Reporting Requirements for Australian Groups with a Foreign Parent’
Standards and interpretations in issue not yet adopted
At the date of authorisation of these financial statements, the Standards and Interpretations listed below were in issue but not yet effective.
The Group is in the process of assessing the impact of these new and revised standards, and interpretations, and has not yet reached a determination as to the impact on the accounting policies detailed below.
Standard / InterpretationEffective for Annual reporting periods beginning on or after
Expected to be initially applied in the financial year ending
AASB 9 ‘Financial Instruments’, and the relevant amending standards 1 January 2018 31 December 2018
AASB 15 ‘Revenue from Contracts with Customers’ and AASB 2014-5 ‘Amendments to Australian Accounting Standards arising from AASB 15’
1 January 2018 31 December 2018
AASB 16 ‘Leases’ 1 January 2019 31 December 2019
AASB 2016-1 ‘Amendments to Australian Accounting Standards – Recognition of Deferred Tax Assets for Unrealised Losses’
1 January 2017 31 December 2017
AASB 2016-2 ‘Amendments to Australian Accounting Standards – Disclosure initiative: Amendments to AASB 107’
1 January 2017 31 December 2017
AASB 2016-5 Classification and Measurement of Share-based Payment Transactions
1 January 2018 31 December 2018
2. REVENUE
2016$’000
2015$’000
Revenue from continuing operations consisted of the following items:
Sales revenue 181,220 184,629
Interest received – 41
Advertising and marketing contributions 2,244 1,630
183,464 186,300
43
For
per
sona
l use
onl
y

NOTES TO THE FINANCIAL STATEMENTS (CONT’D)
3. PROFIT FOR THE YEAR
2016$’000
2015$’000
Profit before tax has been arrived at after charging the following expenses:
Depreciation of property, plant, equipment 3,576 3,386
Increase / (decrease) in inventory obsolescence provision 142 (496)
Decrease in warranty provision provided (151) (238)
Employee benefits expense:
LTIP share-based payments 305 314
Termination benefits 51 209
Other employee benefits 24,979 26,600
Bad and doubtful debts write back (8) (118)
Operating lease expense 5,907 5,297
Finance costs
Interest on bank overdrafts and loans 994 1,558
Bank charges 269 318
4. REMUNERATION OF AUDITOR
2016$’000
2015$’000
Audit and review 220 210
Other services – IPO related services – 347
220 557
5. IPO EXPENDITUREIPO related costs of $6,117,000 were incurred in 2015 in preparing the Company for IPO, which included primarily investment bank fees, management bonus, professional advisory fees and prospectus printing, preparation and distribution costs, historical management equity plan and employee gift offer expense. In accordance with AASB 132, the proportion of costs that are directly attributable to raising new share capital, amounting to $459,000, have been capitalised against the newly raised equity, with the remaining balance of $5,658,000 being taken up in the consolidated statement of profit or loss and other comprehensive income.
2016$’000
2015$’000
IPO related costs – 5,023
Historical management equity plan expense i – 420
Employee gift offer ii – 215
– 5,658
i. The historical management equity plan expense represents the acceleration of vesting at the date of IPO of the in substance options issued under the historical management equity plan.
ii. Shares were issued to Eligible Employees under the Employee Gift Offer at the time of the IPO, in which eligible Employees were offered the opportunity to apply for up to $1,000 worth of Shares at no cost.
44 SHRIRO HOLDINGS LIMITED ANNUAL REPORT 2016
For
per
sona
l use
onl
y

6. INCOME TAX
Income taxes relating to continuing operations
6.1 Income tax recognised in profit or loss
2016$’000
2015$’000
Current tax
In respect of the current year 5,849 4,365
In respect of prior years (386) (213)
5,463 4,152
Deferred tax
In respect of the current year (489) 539
In respect of prior years 48 –
Tax losses not brought to account – 2
Total tax expense (441) 541
Total income tax expense recognised in the current year relating to continuing operations 5,022 4,693
Total income tax expense for the year can be reconciled to the accounting profit as follows:
Profit before tax from continuing operations 18,184 11,811
Income tax expense calculated at 30% (2015: 30%) 5,455 3,543
Effect of expenses that are not deductible in determining taxable profit 359 1,866
Effect of different tax rates of subsidiaries operating in other jurisdictions (115) (102)
Other (291) (401)
Total tax expense 5,408 4,906
Adjustments recognised in the current year in relation to the current tax of prior years (386) (213)
Income tax attributable to profit 5,022 4,693
6.2 Deferred Tax BalancesThe deferred tax expense above is itemised as follows:
2016Opening balance
$’000
Recognised in total comprehensive
income$’000
Closing balance$’000
Deferred tax assets
Property, plant and equipment 12 (32) (20)
Leases (96) 81 (15)
Superannuation payable 75 (18) 57
Provisions 4,669 429 5,098
Allowance for doubtful debts 58 (2) 56
Net deferred tax assets 4,718 458 5,176
45
For
per
sona
l use
onl
y

NOTES TO THE FINANCIAL STATEMENTS (CONT’D)
6. INCOME TAX (CONT’D)
2015Opening balance
$’000
Recognised in total comprehensive
income$’000
Closing balance$’000
Deferred tax assets
Property, plant and equipment 45 (33) 12
Leases (14) (82) (96)
Superannuation payable 66 9 75
Provisions 4,965 (296) 4,669
Allowance for doubtful debts 89 (31) 58
Exchange difference on foreign operations 120 (120) –
Net deferred tax assets 5,271 (553) 4,718
The Deferred tax asset has been accounted for as it is probable that sufficient taxable profits will be available against which deductible temporary differences can be utilised.
7. TRADE AND OTHER RECEIVABLES
2016$’000
2015$’000
Trade receivables 34,972 31,775
Allowance for doubtful debts (198) (206)
34,774 31,569
Other debtors 159 11
Trade receivables 34,933 31,580
The average credit period on sales of goods is 45 days. No interest is charged on trade receivables. Allowances for doubtful debts are estimated on debts deemed irrecoverable, determined by reference to past default experience of the counterparty and an analysis of the counterparty’s current financial position. The Group holds an active credit insurance policy which, as at the reporting date, provided coverage for 90% of debtors, including all debtors with a balance owing equal to or greater than $35,000. The maximum exposure under this policy is 10% of the irrecoverable amount.
Age of receivables that are past due but not impaired
60 – 90 days 102 290
90 – 120 days 88 124
Total 190 414
Movement in the allowance for doubtful debts
Balance at beginning of the year (206) (324)
Impairment (gain) / loss recognised (45) 100
Amounts w / o during year as uncollectable 55 16
Amounts recovered during the year – –
Other debtors (2) 2
Balance at the end of the year (198) (206)
46 SHRIRO HOLDINGS LIMITED ANNUAL REPORT 2016
For
per
sona
l use
onl
y
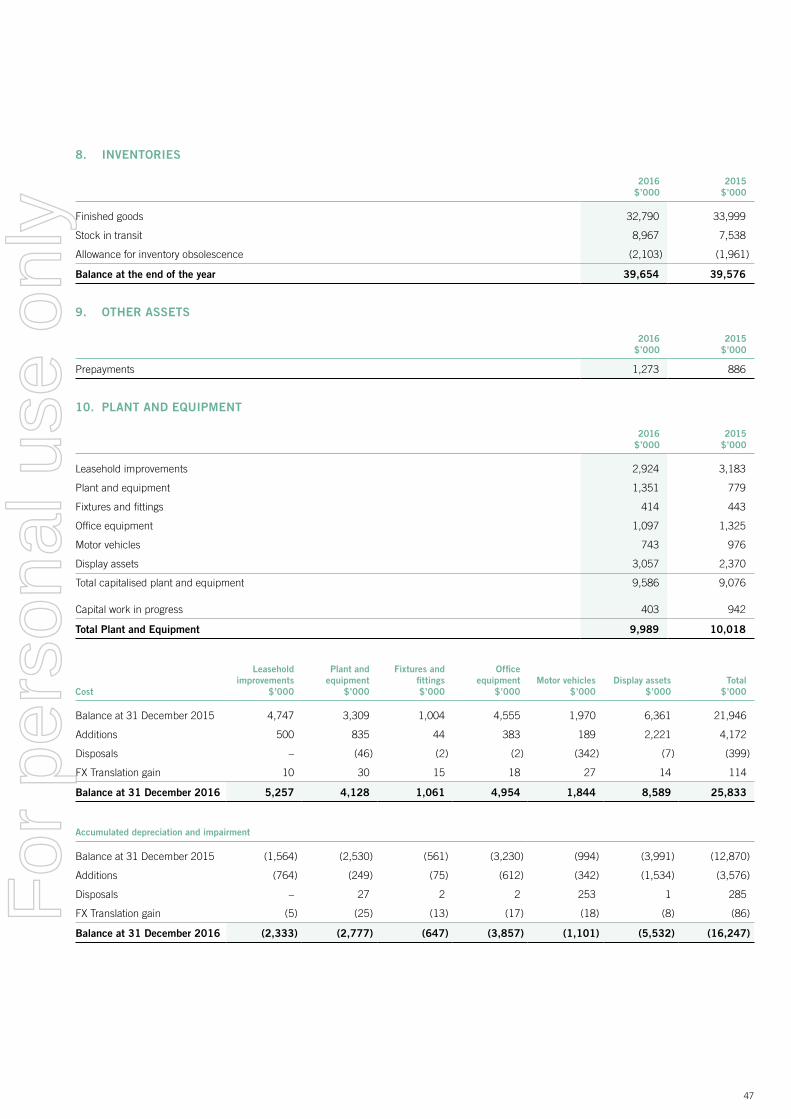
8. INVENTORIES
2016$’000
2015$’000
Finished goods 32,790 33,999
Stock in transit 8,967 7,538
Allowance for inventory obsolescence (2,103) (1,961)
Balance at the end of the year 39,654 39,576
9. OTHER ASSETS
2016$’000
2015$’000
Prepayments 1,273 886
10. PLANT AND EQUIPMENT
2016$’000
2015$’000
Leasehold improvements 2,924 3,183
Plant and equipment 1,351 779
Fixtures and fittings 414 443
Office equipment 1,097 1,325
Motor vehicles 743 976
Display assets 3,057 2,370
Total capitalised plant and equipment 9,586 9,076
Capital work in progress 403 942
Total Plant and Equipment 9,989 10,018
Cost
Leasehold improvements
$’000
Plant and equipment
$’000
Fixtures and fittings$’000
Office equipment
$’000Motor vehicles
$’000Display assets
$’000Total
$’000
Balance at 31 December 2015 4,747 3,309 1,004 4,555 1,970 6,361 21,946
Additions 500 835 44 383 189 2,221 4,172
Disposals – (46) (2) (2) (342) (7) (399)
FX Translation gain 10 30 15 18 27 14 114
Balance at 31 December 2016 5,257 4,128 1,061 4,954 1,844 8,589 25,833
Accumulated depreciation and impairment
Balance at 31 December 2015 (1,564) (2,530) (561) (3,230) (994) (3,991) (12,870)
Additions (764) (249) (75) (612) (342) (1,534) (3,576)
Disposals – 27 2 2 253 1 285
FX Translation gain (5) (25) (13) (17) (18) (8) (86)
Balance at 31 December 2016 (2,333) (2,777) (647) (3,857) (1,101) (5,532) (16,247)
47
For
per
sona
l use
onl
y

NOTES TO THE FINANCIAL STATEMENTS (CONT’D)
10. PLANT AND EQUIPMENT (CONT’D)
The following useful lives are used in the calculation of depreciation :
Leasehold improvements 3 – 10 years
Plant and equipment 4 – 20 years
Fixtures and fittings 4 – 20 years
Office equipment 2 – 20 years
Motor vehicles 5 – 8 years
Display assets 2 – 3 years
Assets pledged as securityAs detailed in note 12, all property, plant and equipment, along with all other assets of the Group, have been pledged to secure the borrowings of the Group with ANZ. The Group is not allowed to pledge these assets as security for other borrowings or to sell them to another entity.
11. TRADE AND OTHER PAYABLES
2016$’000
2015$’000
Current
Trade payables 14,442 12,934
GST Payable 1,109 1,247
Employee related payables 1,511 2,254
Sundry creditors 3,671 2,303
20,733 18,738
The majority of trade payables relate to purchases of inventory from Asia and Europe. The average credit period on purchases from Asia is 45 days. The average credit period for purchases from Europe is 90 days. The Group has financial risk management policies in place to ensure that all payables are paid within the pre-agreed credit terms.
12. BORROWINGS
Secured – at amortised cost2016
$’0002015
$’000
Overdraft facility i 3,535 1,430
Trade finance facility i 2,000 9,000
5,535 10,430
Current 3,535 1,430
Non-current 2,000 9,000
5,535 10,430
i. The Group has a trade finance facility available to meet working capital requirements. To account for seasonality in working capital requirements, on the 1st July each year, the facility limit for the combination of the overdraft facility and trade finance facility increases to $44,000,000 and reduces back to $39,000,000 between 1 February and 30 June each year.
ii. The Group has a non-cash guarantees facility of $13,000,000. Under the terms of this facility, financial institutions provide guarantees to the Group’s suppliers and property owners in the form of Letters of Credit and Bank Guarantees. These Letters of Credit and Bank Guarantees act like insurance and provide assurance to suppliers and property owners that payment up to the amount of the guarantees will be made if certain documentary conditions are met. The Group has no obligation to make any payments under this non-cash facility.
48 SHRIRO HOLDINGS LIMITED ANNUAL REPORT 2016
For
per
sona
l use
onl
y

The Group’s facilities are denominated in Australian dollars and variable interest rates apply.
The facilities have financial covenants relating to fixed charge cover ratio, borrowing base cover ratio and financial indebtness to EBITDA ratio.
2016$’000
2015$’000
Borrowing facility
Overdraft facility i 15,000 15,000
Trade finance facility i 29,000 29,000
Total borrowing facility 44,000 44,000
Non-cash guarantees facility ii 13,000 13,000
Total Group facility 57,000 57,000
Usage of borrowing facility
Drawn – cash 5,535 10,430
Less cash and bank balances (15) (1,040)
Undrawn limit available for use 38,480 34,610
Total borrowing facility 44,000 44,000
Utilisation of non-cash guarantees facility
Utilised – non-cash 8,162 8,534
Unutilised limit available for use 4,838 4,466
Total non-cash guarantees facility 13,000 13,000
Total borrowing facility 57,000 57,000
i. The Group has a trade finance facility available to meet working capital requirements. To account for seasonality in working capital requirements, on the 1st July each year, the facility limit for the combination of the overdraft facility and trade finance facility increases to $44,000,000 and reduces back to $39,000,000 between 1 February and 30 June each year.
ii. The Group has a non-cash guarantees facility of $13,000,000. Under the terms of this facility, financial institutions provide guarantees to the Group’s suppliers and property owners in the form of Letters of Credit and Bank Guarantees. These Letters of Credit and Bank Guarantees act like insurance and provide assurance to suppliers and property owners that payment up to the amount of the guarantees will be made if certain documentary conditions are met. The Group has no obligation to make any payments under this non-cash facility.
49
For
per
sona
l use
onl
y

NOTES TO THE FINANCIAL STATEMENTS (CONT’D)
13. PROVISIONS
2016$’000
2015$’000
Employee entitlements i 4,126 3,852
Other provisions (see below) 5,439 5,443
9,565 9,295
Current 6,539 6,462
Non-current 3,026 2,833
9,565 9,295
Other Provisions
Provision for warranty ii
$’000
Lease incentives and make good iii, iv
$’000Total
$’000
Balance as at 1 January 2016 2,906 2,537 5,443
Reductions arising from payments / other sacrifices of future economic benefits (151) – (151)
Additional provisions recognised – 147 147
2,755 2,684 5,439
i. The provision for employee benefits represents annual leave and long service leave entitlements accrued. The discount rate adopted at 31 December 2016 is the High Quality Corporate Bond Rate, previously a risk free bond rate, and the change represents a change in accounting estimates. The impact is not significant.
ii. The provision for warranty claims represents the present value of the Directors’ best estimate of the future sacrifice of economic benefits that will be required under the Group’s warranty program as outlined in note 1(s). The estimate has been made on the basis of historical warranty trends and other events affecting product quality discounted to present value with the exclusion of net margin on spares sold.
iii. The lease incentives provision arises when incentives are received from landlords as part of the Group’s operating leases. The aggregate benefit of incentives is recognised as a reduction of rental expense on a straight-line basis, except where another systematic basis is more representative of the time pattern in which economic benefits from the leased asset are consumed.
iv. The provision for make-good represents management’s best estimate of future cash outlays required to refit leased premises in line with the requirements of each operating lease agreement.
14. ISSUED CAPITAL
2016$’000
2015$’000
95,000,000 fully paid ordinary shares (2015: 95,000,000) 94,541 94,541
Date DetailsValue of Shares
$Number
of Shares
1 January 2016 Opening balance 94,540,929 95,000,000
31 December 2016 Closing Balance 94,540,929 95,000,000
50 SHRIRO HOLDINGS LIMITED ANNUAL REPORT 2016
For
per
sona
l use
onl
y

15. RESERVES
2016$’000
2015$’000
Cash flow hedging reserve (156) (464)
Foreign currency translation reserve 1,973 1,633
Equity settled employee benefits reserve 619 2,426
Group reorganisation reserve (78,585) (78,585)
Balance at end of financial year (76,149) (74,990)
15.1 Cash flow hedging reserve
Balance at the beginning of the period (464) 29
Forward exchange contracts 308 (493)
Balance at end of financial year (156) (464)
The cash flow hedging reserve represents the cumulative effective portion of gains or losses arising on changes in fair value of hedging instruments entered into for cash flow hedges. The cumulative gain or loss arising on changes in fair value of the hedging instruments that are recognised and accumulated under the heading of cash flow hedging reserve will be reclassified to profit or loss only when the hedged transaction affects the profit or loss, or is included as a basis adjustment to the nonfinancial hedged item, consistent with the relevant accounting policy.
15.2 Foreign currency translation reserve
Balance at the beginning of the period 1,633 1,742
Exchange differences arising on translating the foreign operation 340 (109)
Balance at end of financial year 1,973 1,633
Exchange differences relating to the translation of the results and net assets of the Group’s foreign operations from their functional currencies to the Group’s presentation currency (i.e. Australian dollars) are recognised directly in other comprehensive income and accumulated in the foreign currency translation reserve. Exchange differences previously accumulated in the foreign currency translation reserve (in respect of translating both the net assets of foreign operations and hedges of foreign operations) are reclassified to profit or loss on the disposal of the foreign operation.
15.3 Equity settled employee benefits reserve
Balance at the beginning of the period 2,426 1,692
Prior year equity settled benefits (2,112)
Arising on share-based payments 305 734
Balance at end of financial year 619 2,426
15.4 Group reorganisation reserve
Balance at beginning of financial year (78,585) –
Arising on 2015 Group reorganisation – (78,585)
Balance at end of financial year (78,585) (78,585)
51
For
per
sona
l use
onl
y

NOTES TO THE FINANCIAL STATEMENTS (CONT’D)
16. RETAINED EARNINGS
2016$’000
2015$’000
Balance at beginning of financial year 28,149 21,031
Prior year equity settled benefits 2,112 –
Profit for the year 13,162 7,118
Dividends paid (8,550) –
Balance at end of financial year 34,873 28,149
17. EARNINGS PER SHARE
2016Cents per share
2015Cents per share
Basic earnings per share 13.9 9.0
Diluted earnings per share 13.7 8.9
Reconciliation of earnings used in calculating earnings per share2016
$’0002015
$’000
Net profit 13,162 7,118
Reconciliation of shares used in calculating earnings per share
2016No.
2015No.
Opening balance of shares for the period 95,000,000 62,009,500
Shares issued during the period:
23 June 2015 – 32,990,500
Closing balance of shares for the period 95,000,000 95,000,000
Weighted average number of ordinary shares used in the calculation of basic earnings per share 95,000,000 79,273,022
Shares deemed to be issued for no consideration in respect of:
Employee performance options 1,416,200 987,500
Closing number of shares deemed to be issued for the period 96,416,200 95,987,500
Weighted average number of ordinary shares used in the calculation of diluted earnings per share 96,416,200 79,789,768
AASB 113.64 requires that where a share split occurs the calculation of basic and diluted EPS for all periods presented shall be adjusted retrospectively. 62,009,500 shares represents the proportion of shares at listing that were on hand at the opening of the previous period.
18. DIVIDENDSOn 14 February 2017, the Directors declared a final dividend of 7.0 cents per share fully franked with an ex-dividend date of the 20 February 2017, record date of the 21st February 2017 and payable on 9th March 2017.
2016$’000
2015$’000
Franking account balance 8,238 4,566
Note that further to the above balance, there are an additional $14,012,747 franking credits which are quarantined as a result of the restructure and can only be used to frank dividends to Shriro Pacific as a consequence of the Historical management equity plan.
52 SHRIRO HOLDINGS LIMITED ANNUAL REPORT 2016
For
per
sona
l use
onl
y

19. SEGMENT INFORMATIONOperating segments are reported in a manner which is consistent with the internal reporting provided to the chief operating decision makers. The chief operating decision makers have been identified as the Board of Directors for the Group.
The internal reports reviewed by the Board, which are used to make strategic decisions, are separated into the Group’s key market segments Kitchen Appliances and Consumer Products:
• Kitchen Appliances – ovens, cooktops, rangehoods, dishwashers, sinks, taps, ironing systems, laundry tubs, waste disposal and ducting solutions.
• Consumer Products – watches, calculators, electronic musical instruments, projectors, point of sale terminals, cameras, barbeques, heaters, fans, air purifiers / dehumidifiers, fashion, car audio, professional DJ, amplifiers and Hi Fi products and speakers.
The information regarding these segments is presented below. The accounting policies of the reportable segments are the same as Group’s accounting policies.
Full year ended 31 December 2016
KitchenAppliances
$’000
Consumer Products
$’000Total
$’000
Revenue from external customers 81,451 99,763 181,214
Other revenue / income 65 2,185 2,250
Total revenue from ordinary activities 81,516 101,948 183,464
Earnings before Interest, Tax, Depreciation and Amortisation 6,634 16,120 22,754
Depreciation and amortisation expense (3,576)
Segments result 19,178
Interest expense (994)
Segment profit before income tax 18,184
Income tax expense (5,022)
Net profit after income tax 13,162
Full year ended 31 December 2015
Revenue from external customers 86,077 98,593 184,670
Other revenue / income 83 1,547 1,630
Total revenue from ordinary activities 86,160 100,140 186,300
Earnings before Interest, Tax, Depreciation and Amortisation 5,652 16,761 22,413
Depreciation and amortisation expense (3,386)
Segments result 19,027
Interest expense (1,558)
IPO costs (5,658)
Segment profit before income tax 11,811
Income tax expense (4,693)
Net profit after income tax 7,118
The Group’s assets are not split by reportable operating segment as the chief operating decision maker does not utilise this information for the purposes of resource allocation and assessment of segment performance.
53
For
per
sona
l use
onl
y

NOTES TO THE FINANCIAL STATEMENTS (CONT’D)
19. SEGMENT INFORMATION (CONT’D)
19.1 Geographical informationThe Group operates in two principal geographical areas – Australia (country of domicile), and New Zealand. The Group’s revenue from continuing operations from external customers by location of operations are detailed below.
2016$’000
2015$’000
Revenue from external customers
Australia 142,600 149,472
New Zealand 39,392 36,056
Other 1,472 772
183,464 186,300
During the 2016 financial year, Shriro released the new product line ‘everdure by heston blumenthal’. In line with the new brand strategy to create a worldwide Barbeque brand Shriro has started selling ‘everdure by heston blumenthal’ products globally, with the first global sales made during the 2016 financial year.
19.2 Information about major customersIncluded in kitchen appliances revenue from ordinary activities are revenues of approximately $20 million (2015: $19 million) which arose from sales to the Group’s largest customer. No other single customer contributed 10% or more to the Group’s revenue for both 2016 and 2015.
20. OPERATING LEASE ARRANGEMENTS
20.1 The Group as lesseeOperating leases relate to the leasing of premises with lease terms of between 1 and 10 years. The Group does not have an option to purchase the leased land or buildings at the expiry of the lease periods.
20.2 Payments recognised as an expense
2016$’000
2015$’000
Lease and sub-lease payments recognised as an expense 5,907 5,285
20.3 Non-cancellable operating lease commitments
Not later than 1 year 5,050 5,183
Later than 1 year and not later than 5 years 15,783 13,681
Later than 5 years 7,304 6,822
28,137 25,686
20.4 Liabilities recognised in respect of non-cancellable leases
Make good provisions
Current – –
Non-current (2,684) (2,537)
(2,684) (2,537)
(2,684) (2,537)
Operating lease commitmentsThe Group is not party to any finance lease liabilities. As at 31 December 2016 there were no other material liabilities.
54 SHRIRO HOLDINGS LIMITED ANNUAL REPORT 2016
For
per
sona
l use
onl
y
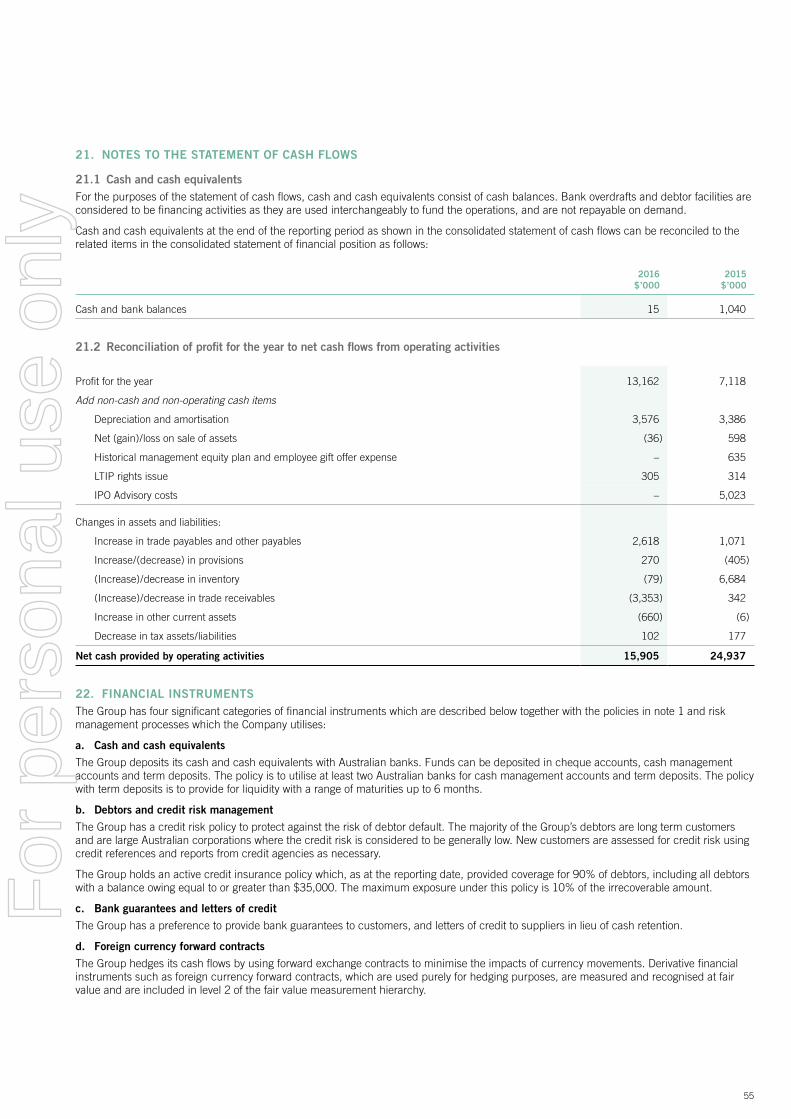
21. NOTES TO THE STATEMENT OF CASH FLOWS
21.1 Cash and cash equivalentsFor the purposes of the statement of cash flows, cash and cash equivalents consist of cash balances. Bank overdrafts and debtor facilities are considered to be financing activities as they are used interchangeably to fund the operations, and are not repayable on demand.
Cash and cash equivalents at the end of the reporting period as shown in the consolidated statement of cash flows can be reconciled to the related items in the consolidated statement of financial position as follows:
2016$’000
2015$’000
Cash and bank balances 15 1,040
21.2 Reconciliation of profit for the year to net cash flows from operating activities
Profit for the year 13,162 7,118
Add non-cash and non-operating cash items
Depreciation and amortisation 3,576 3,386
Net (gain) / loss on sale of assets (36) 598
Historical management equity plan and employee gift offer expense – 635
LTIP rights issue 305 314
IPO Advisory costs – 5,023
Changes in assets and liabilities:
Increase in trade payables and other payables 2,618 1,071
Increase / (decrease) in provisions 270 (405)
(Increase) / decrease in inventory (79) 6,684
(Increase) / decrease in trade receivables (3,353) 342
Increase in other current assets (660) (6)
Decrease in tax assets / liabilities 102 177
Net cash provided by operating activities 15,905 24,937
22. FINANCIAL INSTRUMENTSThe Group has four significant categories of financial instruments which are described below together with the policies in note 1 and risk management processes which the Company utilises:
a. Cash and cash equivalents
The Group deposits its cash and cash equivalents with Australian banks. Funds can be deposited in cheque accounts, cash management accounts and term deposits. The policy is to utilise at least two Australian banks for cash management accounts and term deposits. The policy with term deposits is to provide for liquidity with a range of maturities up to 6 months.
b. Debtors and credit risk management
The Group has a credit risk policy to protect against the risk of debtor default. The majority of the Group’s debtors are long term customers and are large Australian corporations where the credit risk is considered to be generally low. New customers are assessed for credit risk using credit references and reports from credit agencies as necessary.
The Group holds an active credit insurance policy which, as at the reporting date, provided coverage for 90% of debtors, including all debtors with a balance owing equal to or greater than $35,000. The maximum exposure under this policy is 10% of the irrecoverable amount.
c. Bank guarantees and letters of credit
The Group has a preference to provide bank guarantees to customers, and letters of credit to suppliers in lieu of cash retention.
d. Foreign currency forward contracts
The Group hedges its cash flows by using forward exchange contracts to minimise the impacts of currency movements. Derivative financial instruments such as foreign currency forward contracts, which are used purely for hedging purposes, are measured and recognised at fair value and are included in level 2 of the fair value measurement hierarchy.
55
For
per
sona
l use
onl
y

NOTES TO THE FINANCIAL STATEMENTS (CONT’D)
22. FINANCIAL INSTRUMENTS (CONT’D)
Categories of financial instruments
2016$’000
2015$’000
Financial assets
Cash and cash equivalents 15 1,040
Trade and other receivables 34,933 31,580
Forward exchange contracts receivable 496 234
Financial liabilities
Trade payables and other payables 20,733 18,738
Bank loans 5,535 10,430
Forward exchange contracts payable 674 685
Current Tax Liabilities 1,764 1,204
The Directors consider the fair value of the financial assets and financials liabilities to approximate their carrying amounts.
Loans and receivablesTrade receivables, loans, and other receivables that have fixed or determinable payments that are not quoted in an active market are classified as ‘loans and receivables’. Loans and receivables are measured at amortised cost using the effective interest method, less any impairment. Interest income is recognised by applying the effective interest rate, except for short-term receivables when the effect of discounting is immaterial.
Financial risk management objectivesThe company’s exposure to market risk is mainly arising from interest rate risk, foreign currency risk, operating expenditure risk and price risk (sales and margin).
Key sensitivities
Impact on NPAT$’000
Impact on NPAT%
Sales (+/- 1%) 307 2.3%
Gross profit margin (+/- 1%) 1,312 10.0%
Other operating costs (+/- 1%) 418 3.2%
Interest expense (+/- 1%) 7 0.1%
*AUD / NZD (+/- 5%) 210 1.6%
Foreign currency risk managementThe group undertakes transactions denominated in foreign currencies; consequently, exposures to exchange rate fluctuations arise. Exchange rate exposures are managed within approved policy parameters utilising forward foreign exchange contracts.
It is the policy of the Group to enter into forward foreign exchange contracts to cover specific foreign currency payments and receipts to 100% of the exposure generated. The Group also enters into forward foreign exchange contracts to manage the risk associated with anticipated purchase transactions out to 9 months with 80% of the expected exposure hedged.
56 SHRIRO HOLDINGS LIMITED ANNUAL REPORT 2016
For
per
sona
l use
onl
y
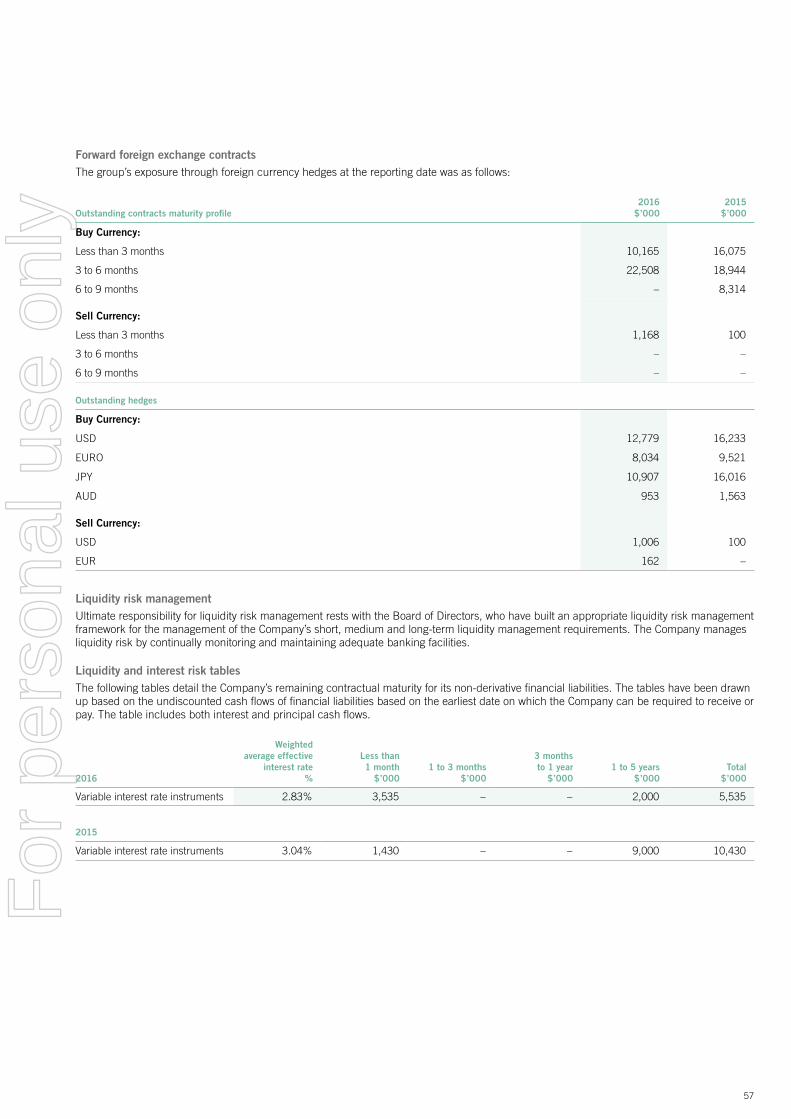
Forward foreign exchange contractsThe group’s exposure through foreign currency hedges at the reporting date was as follows:
Outstanding contracts maturity profile2016
$’0002015
$’000
Buy Currency:
Less than 3 months 10,165 16,075
3 to 6 months 22,508 18,944
6 to 9 months – 8,314
Sell Currency:
Less than 3 months 1,168 100
3 to 6 months – –
6 to 9 months – –
Outstanding hedges
Buy Currency:
USD 12,779 16,233
EURO 8,034 9,521
JPY 10,907 16,016
AUD 953 1,563
Sell Currency:
USD 1,006 100
EUR 162 –
Liquidity risk managementUltimate responsibility for liquidity risk management rests with the Board of Directors, who have built an appropriate liquidity risk management framework for the management of the Company’s short, medium and long-term liquidity management requirements. The Company manages liquidity risk by continually monitoring and maintaining adequate banking facilities.
Liquidity and interest risk tablesThe following tables detail the Company’s remaining contractual maturity for its non-derivative financial liabilities. The tables have been drawn up based on the undiscounted cash flows of financial liabilities based on the earliest date on which the Company can be required to receive or pay. The table includes both interest and principal cash flows.
2016
Weighted average effective
interest rate%
Less than1 month
$’0001 to 3 months
$’000
3 months to 1 year
$’0001 to 5 years
$’000Total
$’000
Variable interest rate instruments 2.83% 3,535 – – 2,000 5,535
2015
Variable interest rate instruments 3.04% 1,430 – – 9,000 10,430
57
For
per
sona
l use
onl
y
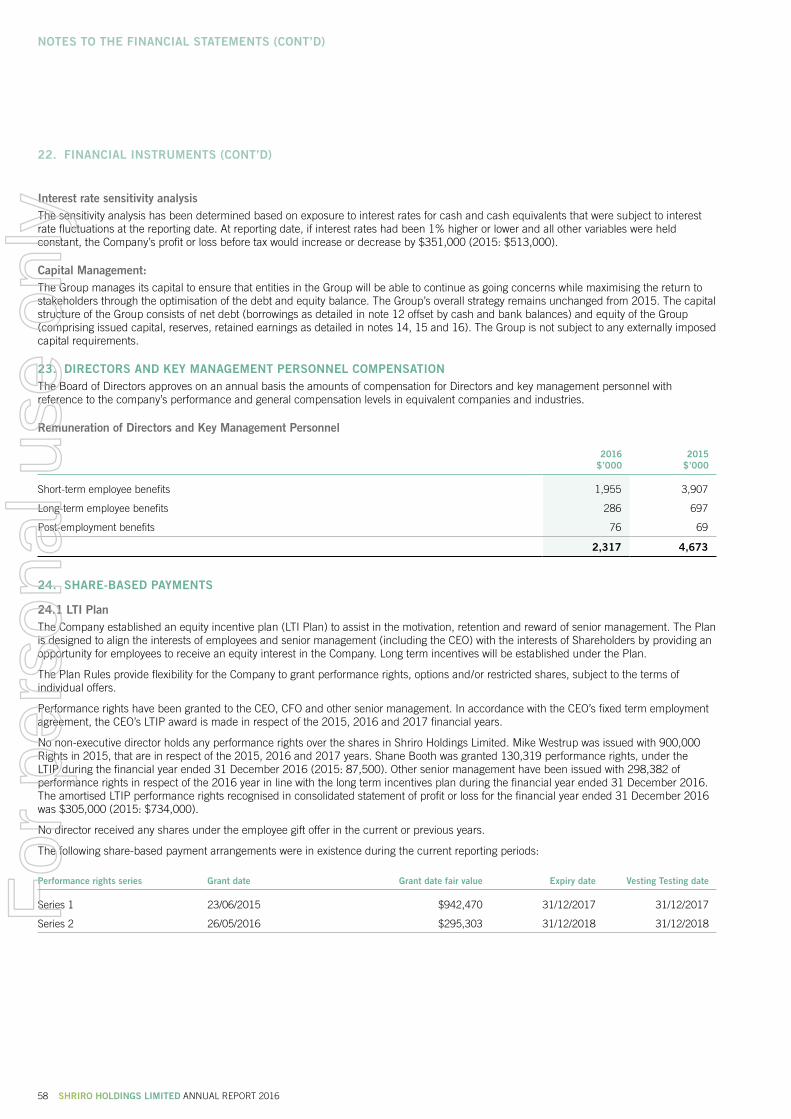
NOTES TO THE FINANCIAL STATEMENTS (CONT’D)
22. FINANCIAL INSTRUMENTS (CONT’D)
Interest rate sensitivity analysisThe sensitivity analysis has been determined based on exposure to interest rates for cash and cash equivalents that were subject to interest rate fluctuations at the reporting date. At reporting date, if interest rates had been 1% higher or lower and all other variables were held constant, the Company’s profit or loss before tax would increase or decrease by $351,000 (2015: $513,000).
Capital Management:The Group manages its capital to ensure that entities in the Group will be able to continue as going concerns while maximising the return to stakeholders through the optimisation of the debt and equity balance. The Group’s overall strategy remains unchanged from 2015. The capital structure of the Group consists of net debt (borrowings as detailed in note 12 offset by cash and bank balances) and equity of the Group (comprising issued capital, reserves, retained earnings as detailed in notes 14, 15 and 16). The Group is not subject to any externally imposed capital requirements.
23. DIRECTORS AND KEY MANAGEMENT PERSONNEL COMPENSATIONThe Board of Directors approves on an annual basis the amounts of compensation for Directors and key management personnel with reference to the company’s performance and general compensation levels in equivalent companies and industries.
Remuneration of Directors and Key Management Personnel
2016$’000
2015$’000
Short-term employee benefits 1,955 3,907
Long-term employee benefits 286 697
Post-employment benefits 76 69
2,317 4,673
24. SHARE-BASED PAYMENTS
24.1 LTI PlanThe Company established an equity incentive plan (LTI Plan) to assist in the motivation, retention and reward of senior management. The Plan is designed to align the interests of employees and senior management (including the CEO) with the interests of Shareholders by providing an opportunity for employees to receive an equity interest in the Company. Long term incentives will be established under the Plan.
The Plan Rules provide flexibility for the Company to grant performance rights, options and / or restricted shares, subject to the terms of individual offers.
Performance rights have been granted to the CEO, CFO and other senior management. In accordance with the CEO’s fixed term employment agreement, the CEO’s LTIP award is made in respect of the 2015, 2016 and 2017 financial years.
No non-executive director holds any performance rights over the shares in Shriro Holdings Limited. Mike Westrup was issued with 900,000 Rights in 2015, that are in respect of the 2015, 2016 and 2017 years. Shane Booth was granted 130,319 performance rights, under the LTIP during the financial year ended 31 December 2016 (2015: 87,500). Other senior management have been issued with 298,382 of performance rights in respect of the 2016 year in line with the long term incentives plan during the financial year ended 31 December 2016. The amortised LTIP performance rights recognised in consolidated statement of profit or loss for the financial year ended 31 December 2016 was $305,000 (2015: $734,000).
No director received any shares under the employee gift offer in the current or previous years.
The following share-based payment arrangements were in existence during the current reporting periods:
Performance rights series Grant date Grant date fair value Expiry date Vesting Testing date
Series 1 23/06/2015 $942,470 31/12/2017 31/12/2017
Series 2 26/05/2016 $295,303 31/12/2018 31/12/2018
58 SHRIRO HOLDINGS LIMITED ANNUAL REPORT 2016
For
per
sona
l use
onl
y

24.2 Fair value of performance rights grantedWhere relevant, the expected life used in the model has been adjusted based on management’s best estimate for the effects of non-transferability, performance hurdles (including the probability of meeting market conditions attached to the rights), and behavioural considerations.
Performance rights series Grant date fair value Rights life Dividend yield Risk-free interest rate
Series 1 $1.00 3 years 4.56% 3.23%
Series 2 $0.82 3 years 8.65% 3.05%
24.3 Performance rights outstanding at the end of the yearThe performance rights outstanding at the end of the year had no exercise price and a weighted average remaining contractual life of 1.26 years.
25. DEREGISTRATION OF A SUBSIDIARYThe Group closed down and deregistered Shriro Pty Limited effective 15 September 2016 to simplify the Group’s structure.
Shriro Pty Limited was only a holding company for Shriro Australia Pty Limited after the 2015 group reorganisation leading up to the IPO.
In 2016, Shriro Pty Limited transferred ownership of Shriro Australia Pty Limited to Shriro Holdings Limited.
Shriro Holdings Limited now directly owns 100% of Shriro Australia Pty Limited as opposed to indirect 100% ownership via Shriro Pty Limited owning 100% of Shriro Australia Pty Limited.
26. SUBSIDIARIES
Name of subsidiary Principal activityPlace of incorporation and operation
Proportion of ownership interest and voting power held by the Group
2016$’000
2015$’000
Shriro Pty Limited 2 Holding company Australia Nil 1 100%
Shriro Australia Pty Limited 3 Wholesaler of consumer goods and appliances Australia 100% 100%
Monaco Corporation Limited Wholesaler of consumer goods and appliances New Zealand 100% 100%
1. During the financial year the non-transactional holding company Shriro Pty Limited was deregistered. Refer to note 25 for additional information.
2. Prior to its deregistration effective 15 September 2016, Shriro Pty Limited was a member of the tax-consolidated group and was party to the deed of cross guarantee with Shriro Holdings Limited pursuant to ASIC Class Order 98/1418 and are relieved from the requirement to prepare and lodge an audited financial report.
3. This wholly-owned subsidiary is a member of the tax-consolidated group and has entered into a deed of cross guarantee with Shriro Holdings Limited pursuant to ASIC Class Order 98/1418 and are relieved from the requirement to prepare and lodge an audited financial report.
59
For
per
sona
l use
onl
y

NOTES TO THE FINANCIAL STATEMENTS (CONT’D)
26. SUBSIDIARIES (CONT’D)
The consolidated income statement and consolidated statement of financial position of entities party to the deed of cross guarantee are:
Statement of Profit or Loss and Other Comprehensive Income2016
$’0002015
$’000
Revenue from ordinary activities 147,263 152,343
Changes in inventories of finished goods (491) (6,884)
Raw materials and consumables used – (953)
Cost of purchased distribution inventory (81,546) (76,753)
Employee benefits expense (20,156) (22,084)
Advertising and promotion expenses (4,852) (4,335)
Freight and delivery expenses (5,458) (6,542)
Depreciation and amortisation expenses (2,871) (2,677)
Rental costs (5,341) (4,535)
Finance costs (1,188) (1,796)
Other expenses (9,162) (9,529)
IPO related costs – (5,023)
Historical management equity plan expense – (635)
Profit before tax 16,198 10,597
Income tax expense (3,456) (3,109)
Profit for the year 12,742 7,488
Other comprehensive income, net of income tax
Items that may be reclassified subsequently to profit or loss
Net change in the fair value of cash flow hedges taken to equity 25 (342)
Other comprehensive income for the year, net of tax 25 (342)
Total comprehensive income for the year attributable to the owners of Shriro Holdings Limited 12,767 7,146
60 SHRIRO HOLDINGS LIMITED ANNUAL REPORT 2016
For
per
sona
l use
onl
y
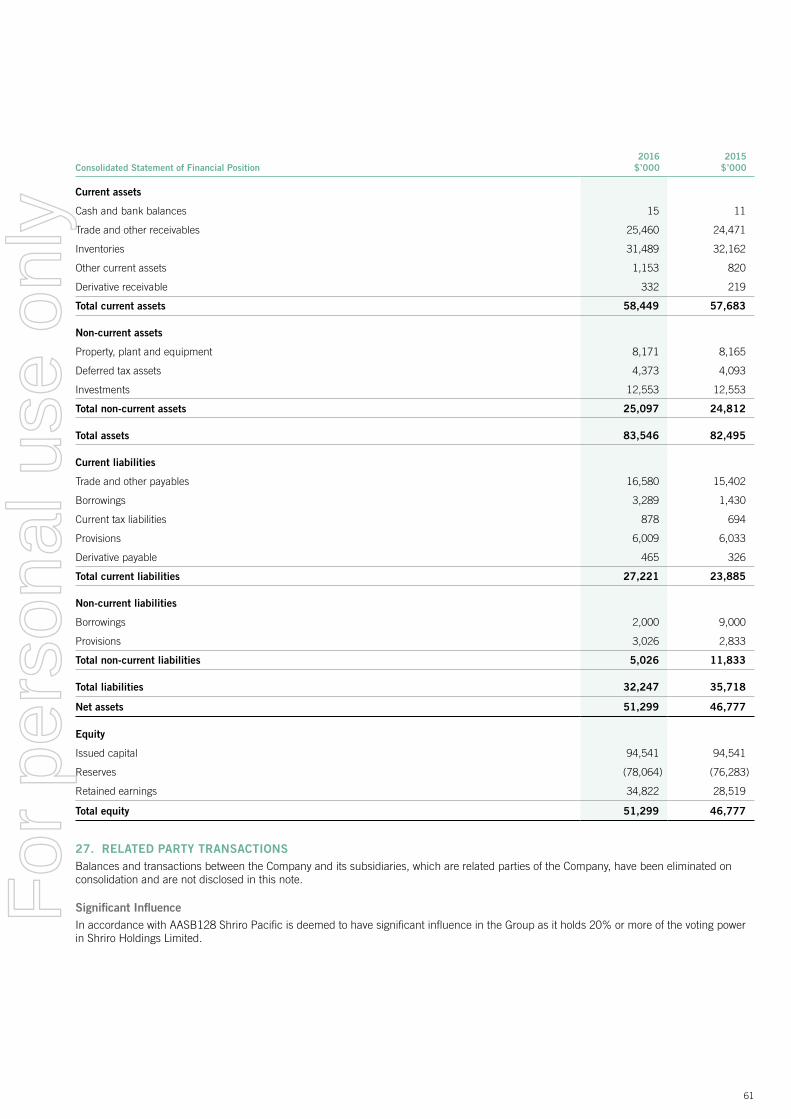
Consolidated Statement of Financial Position2016
$’0002015
$’000
Current assets
Cash and bank balances 15 11
Trade and other receivables 25,460 24,471
Inventories 31,489 32,162
Other current assets 1,153 820
Derivative receivable 332 219
Total current assets 58,449 57,683
Non-current assets
Property, plant and equipment 8,171 8,165
Deferred tax assets 4,373 4,093
Investments 12,553 12,553
Total non-current assets 25,097 24,812
Total assets 83,546 82,495
Current liabilities
Trade and other payables 16,580 15,402
Borrowings 3,289 1,430
Current tax liabilities 878 694
Provisions 6,009 6,033
Derivative payable 465 326
Total current liabilities 27,221 23,885
Non-current liabilities
Borrowings 2,000 9,000
Provisions 3,026 2,833
Total non-current liabilities 5,026 11,833
Total liabilities 32,247 35,718
Net assets 51,299 46,777
Equity
Issued capital 94,541 94,541
Reserves (78,064) (76,283)
Retained earnings 34,822 28,519
Total equity 51,299 46,777
27. RELATED PARTY TRANSACTIONSBalances and transactions between the Company and its subsidiaries, which are related parties of the Company, have been eliminated on consolidation and are not disclosed in this note.
Significant InfluenceIn accordance with AASB128 Shriro Pacific is deemed to have significant influence in the Group as it holds 20% or more of the voting power in Shriro Holdings Limited.
61
For
per
sona
l use
onl
y

NOTES TO THE FINANCIAL STATEMENTS (CONT’D)
28. PARENT ENTITY INFORMATION
Financial Position2016
$’0002015
$’000
Assets
Current Assets – 6,175
Non-current assets 88,585 88,585
Total assets 88,585 94,760
Liabilities
Current liabilities 4,565 2,379
Non-current liabilities – –
Total liabilities 4,565 2,379
Net assets 84,020 92,381
Equity
Issued capital 94,541 94,541
Reserves 619 314
Retained earnings (11,140) (2,474)
Total equity 84,020 92,381
Financial Performance
Loss for the year (116) (2,474)
Total comprehensive income (189) (2,474)
29. EVENTS AFTER THE REPORTING DATENo material events have arisen after the reporting date.
30. ADDITIONAL COMPANY INFORMATION
Principal activitiesThe Group is a leading kitchen appliances and consumer products marketing and distribution group operating in Australia and New Zealand.
The Group markets and distributes an extensive range of company-owned brands (including Omega, Robinhood, Everdure including ‘everdure by heston blumenthal’ and Omega Altise) and third party owned brands (such as Casio, Blanco and Pioneer). Products include calculators, watches, cash registers, musical instruments, audio products, kitchen appliances, sinks & taps, laundry products, consumer electronics, car audio, amplifiers, professional DJ, Hi-Fi / speakers, fashion, lighting, gas heaters, gas and charcoal barbeques, electric heaters and cooling products.
General InformationShriro Holdings Limited is incorporated and operating in Australia.
Shriro Holdings Limited’s registered office and its principal place of business is as follows:
Registered office and Principal place of business
104 Vanessa Street
Kingsgrove NSW 2208
Tel: 9415 5000
Shriro Holdings Limited’s Annual General Meeting will be held on the 24th of April 2017.
62 SHRIRO HOLDINGS LIMITED ANNUAL REPORT 2016
For
per
sona
l use
onl
y

31. ADDITIONAL ASX INFORMATION
Number of holders of equity securities There are 95,000,000 fully paid ordinary shares are held by 1,862 individual shareholders.
Substantial shareholders Fully Paid Ordinary Shares
Shriro Pacific Limited 31,004,750
Twenty largest holders of quoted equity securities
Fully Paid Ordinary Shares
Number Percentage
Shriro Pacific Limited 31,004,750 32.64%
National Nominees Limited 6,695,603 7.05%
Michael Westrup 4,630,250 4.87%
J P Morgan Nominees Australia Limited 4,190,252 4.41%
Vasco Fung 3,321,937 3.50%
ACK Pty Ltd 2,300,000 2.42%
Shane Booth 2,215,625 2.33%
Citicorp Nominees Pty Limited 1,870,775 1.97%
HSBC Custody Nominees (Australia) Limited 1,589,361 1.67%
Horrie Pty Ltd 1,273,426 1.34%
Mr Dermot Francis McGarry & Mrs Christine McGarry 766,425 0.81%
Mr Ivan Tanner & Mrs Felicity Tanner 755,741 0.80%
HSBC Custody Nominees (Australia) Limited 721,860 0.76%
Aust Executor Trustees Ltd 703,785 0.74%
Asia Union Investments Pty Ltd 700,000 0.74%
Rapaki Pty Ltd 600,000 0.63%
Anacacia Pty Ltd 600,000 0.63%
TMPA Holdings Pty Ltd 591,168 0.62%
Hillmorton Custodians Pty Ltd 540,000 0.57%
Beta Gamma Pty Ltd 500,000 0.53%
Gwynvill Trading Pty Ltd 500,000 0.53%
66,070,958 69.56%
Company secretaryShane Booth
Share registryLink Market Services Limited
Level 12
680 George Street
Sydney NSW 2000
63
For
per
sona
l use
onl
y

Corporate Directory
64 SHRIRO HOLDINGS LIMITED ANNUAL REPORT 2016
DIRECTORSJohn Weir Ingram
Independent Non-Executive Chairman
Michael Westrup
Chief Executive Officer
Greg Laurie
Independent Non-Executive Director
Vasco Fung
Non-Executive Director
COMPANY SECRETARYShane Booth
Chief Financial Officer & Company Secretary
REGISTERED OFFICE AND PRINCIPAL PLACE OF BUSINESS104 Vanessa StreetKingsgrove NSW 2208
Tel: (02) 9415 5000
AUDITORSDeloitte Touche Tohmatsu
SHARE REGISTRYLink Market Services LimitedLevel 12680 George StreetSydney NSW 2000
For
per
sona
l use
onl
y

RM-17029
For
per
sona
l use
onl
y

For
per
sona
l use
onl
y