sick leave and overtime metrics report … · sick leave and overtime metrics report 2009 q4 –...
TRANSCRIPT

SICK LEAVE AND OVERTIME METRICS REPORT
2009 Q4 – 2013 Q4 NOVEMBER 2014
General Notes: Source: HSCIS 2009 to 2013 - Data is annualized to a 365-day reporting period. - Providence Health Care (PHC) data is included with the health authorities (HAs). - Worksite Service type, includes long term care, home support, mental health and child develop-ment centre, is based on HEABC Membership database. - Figures on FTEs per bargaining unit are presented as reported. No normalization has been madefor the consolidation of LPNs from Facilities and Community to Nurses in 2013. Calculation & Methods FTE: Straight-time Hours divided by the annual standard work hours for a full-time employee ac-cording to bargaining unit and year (Nurses- 1879.2 before 2013 and 1950 since 2013, Health Sci-ences- 1879.2 hours, Community & Facilities- 1950 hours). Sick leave and overtime (OT) hours are reported in different methods by source of data. Payroll Extract: - HAs and PHC sick leave and OT hours are as reported. - Affiliates worksites do not provide data on hours. Estimated hours are calculated by dividing sickleave and OT paid amounts by the wage rate per employee record. Web Entry: - Affiliate worksites submit through web entry do not provide data on hours and costs are re-ported at a designated group level. Estimated hours are calculated by dividing sick leave and OTpaid amounts by the weighted average wage rate per bargaining unit. Sick leave paid days: Sick leave hours divided by the standard work hours per day for each respec-tive bargaining unit for each reported year. We welcome your comments and feedback on this report. If you have any questions or comments,please contact HEABC's Knowledge Management department at: Phone: 604.714.2255 Email: [email protected]
Contents 1 Long Term Care2 Home Support Agency3 Mental Health4 Child Development Centre Appendix
..
..
16111621
Section 1 Long Term Care - FTEs by Job Status - 2013 - FTEs by Job Status - Trend - Sick Leave Comparison - Overtime Comparison
..
..
2014 Q4
Prepared by HEABC
E&OE
Page 1 of 29
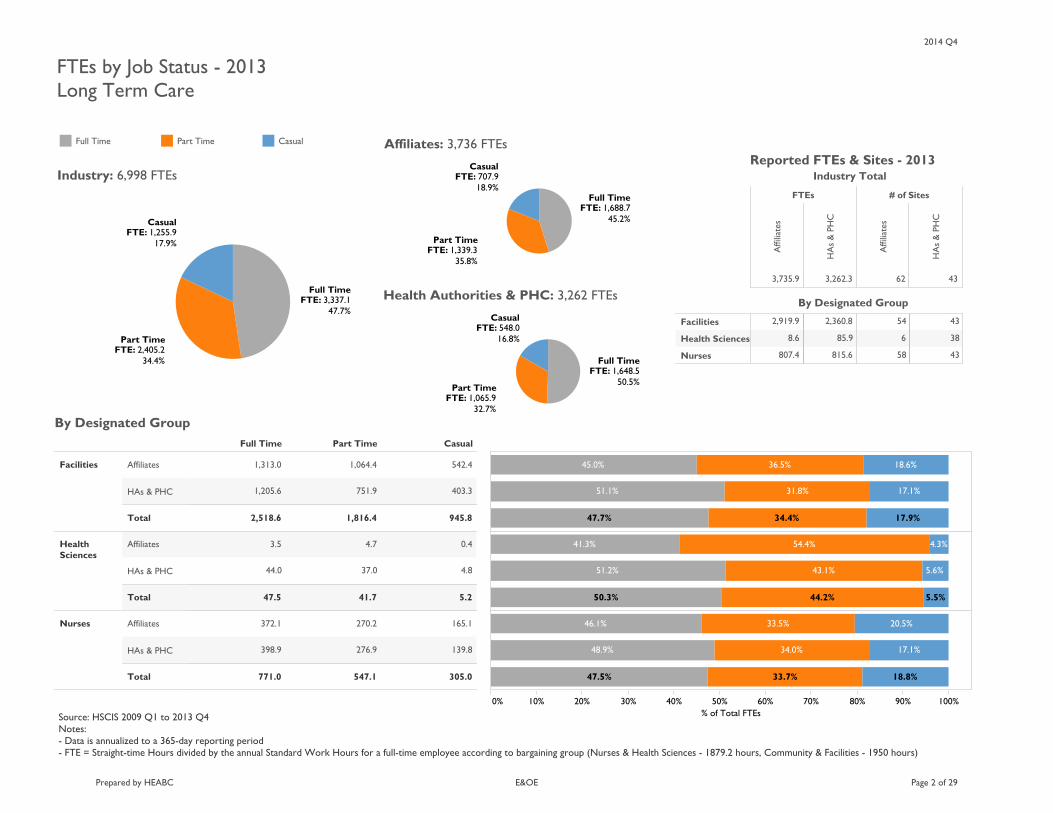
FTEs by Job Status - 2013Long Term Care
17.9%
34.4%
47.7%
Part TimeFTE: 2,405.2
34.4%
Full TimeFTE: 3,337.1
47.7%
CasualFTE: 1,255.9
17.9%
Industry: 6,998 FTEs
Full Time Part Time Casual
Service TypeLong Term Care
18.9%
35.8%
45.2%
Part TimeFTE: 1,339.3
35.8%
Full TimeFTE: 1,688.7
45.2%
CasualFTE: 707.9
18.9%
Affiliates: 3,736 FTEs
16.8%
32.7%
50.5% Part TimeFTE: 1,065.9
32.7%
Full TimeFTE: 1,648.5
50.5%
CasualFTE: 548.0
16.8%
Health Authorities & PHC: 3,262 FTEs
Full Time Part Time Casual
Facilities Affiliates
HAs & PHC
Total
HealthSciences
Affiliates
HAs & PHC
Total
Nurses Affiliates
HAs & PHC
Total
945.8
403.3
542.4
1,816.4
751.9
1,064.4
2,518.6
1,205.6
1,313.0
5.2
4.8
0.4
41.7
37.0
4.7
47.5
44.0
3.5
305.0
139.8
165.1
547.1
276.9
270.2
771.0
398.9
372.1
By Designated Group
0% 10% 20% 30% 40% 50% 60% 70% 80% 90% 100%% of Total FTEs
17.9%34.4%47.7%
18.6%
17.1%
36.5%
31.8%
45.0%
51.1%
44.2%50.3%
54.4%
43.1%
41.3%
51.2%
5.5%
4.3%
5.6%
18.8%33.7%47.5%
20.5%
17.1%
33.5%
34.0%
46.1%
48.9%
By DG - Bar
Source: HSCIS 2009 Q1 to 2013 Q4Notes:- Data is annualized to a 365-day reporting period- FTE = Straight-time Hours divided by the annual Standard Work Hours for a full-time employee according to bargaining group (Nurses & Health Sciences - 1879.2 hours, Community & Facilities - 1950 hours)
FTEs
Affiliates
HAs & PHC
# of Sites
Affiliates
HAs & PHC
3,262.33,735.9 4362
Reported FTEs & Sites - 2013 Industry Total
Facilities
Health Sciences
Nurses 815.6
85.9
2,360.8
807.4
8.6
2,919.9
43
38
43
58
6
54
By Designated Group
2014 Q4
Prepared by HEABC
E&OE
Page 2 of 29

YEAR
FTEs
Affiliates
HAs & PHC
# of Sites
Affiliates
HAs & PHC
2009
2010
2011
2012
2013 3,262.3
3,210.9
3,129.2
2,908.9
3,055.1
3,735.9
4,055.2
4,495.9
5,374.5
4,897.0
43
43
43
49
49
62
68
73
93
82
Reported FTEs & Sites Industry Total
Source: HSCIS 2009 Q1 to 2013 Q4Notes:- Data is annualized to a 365-day reporting period- FTE: Straight-time Hours divided by the annual standard work hours for a full-time employee according to bargaining group and year (Nurses - 1879.2 before 2013 and 1950 since 2013, Health Sciences - 1879.2 hours,Community & Facilities - 1950 hours).
Service TypeLong Term Care
Facilities 2009
2010
2011
2012
2013
HealthSciences
2009
2010
2011
2012
2013
Nurses 2009
2010
2011
2012
2013
2,360.8
2,791.4
2,702.3
2,507.2
2,656.5
2,919.9
3,561.1
3,930.4
4,674.1
4,234.5
43
43
43
44
45
54
58
65
85
74
85.9
79.3
65.7
58.2
54.8
8.6
10.6
11.8
13.0
13.5
38
38
36
32
34
6
7
9
10
11
815.6
340.3
361.2
343.5
343.7
807.4
483.4
553.7
687.4
649.0
43
42
42
43
48
58
59
66
82
70
By Designated Group
Affiliates HAs & PHC
2009 2010 2011 2012 2013 2009 2010 2011 2012 20130
1,000
2,000
3,000
4,000
5,000
FTEs
2,127.9
2,358.6
1,984.2
1,835.31,688.7
1,814.22,009.1
1,703.11,486.8 1,339.3
1,006.8954.9 808.6 733.0 707.9
(43.5%)
(43.9%)
(44.1%)
(45.3%)(45.2%)
(37.0%)(37.4%)
(37.9%)(36.7%) (35.8%)
(19.5%) (18.7%) (18.0%) (18.1%) (18.9%)
4,897.0
5,374.5
4,495.9
4,055.23,735.9
4,897.0
5,374.5
4,495.9
4,055.23,735.9
1,525.0 1,460.31,559.2 1,589.8 1,648.5
1,040.8 1,067.1 1,065.9965.7 913.9
564.4 534.7 529.3 554.0 548.0
(49.9%) (50.2%)(49.8%) (49.5%) (50.5%)
(31.6%) (31.4%) (33.3%) (33.2%) (32.7%)
(18.5%) (18.4%) (16.9%) (17.3%) (16.8%)
3,055.12,908.9
3,129.2 3,210.9 3,262.33,055.1
2,908.93,129.2 3,210.9 3,262.3
Full Time Part Time Casual
FTEs by Job Status - Trend Long Term Care
Facilities Health Sciences Nurses
2009 2010 2011 2012 2013 2009 2010 2011 2012 2013 2009 2010 2011 2012 20130
2,000
4,000
6,000
FTEs
By Designated Group
2014 Q4
Prepared by HEABC
E&OE
Page 3 of 29
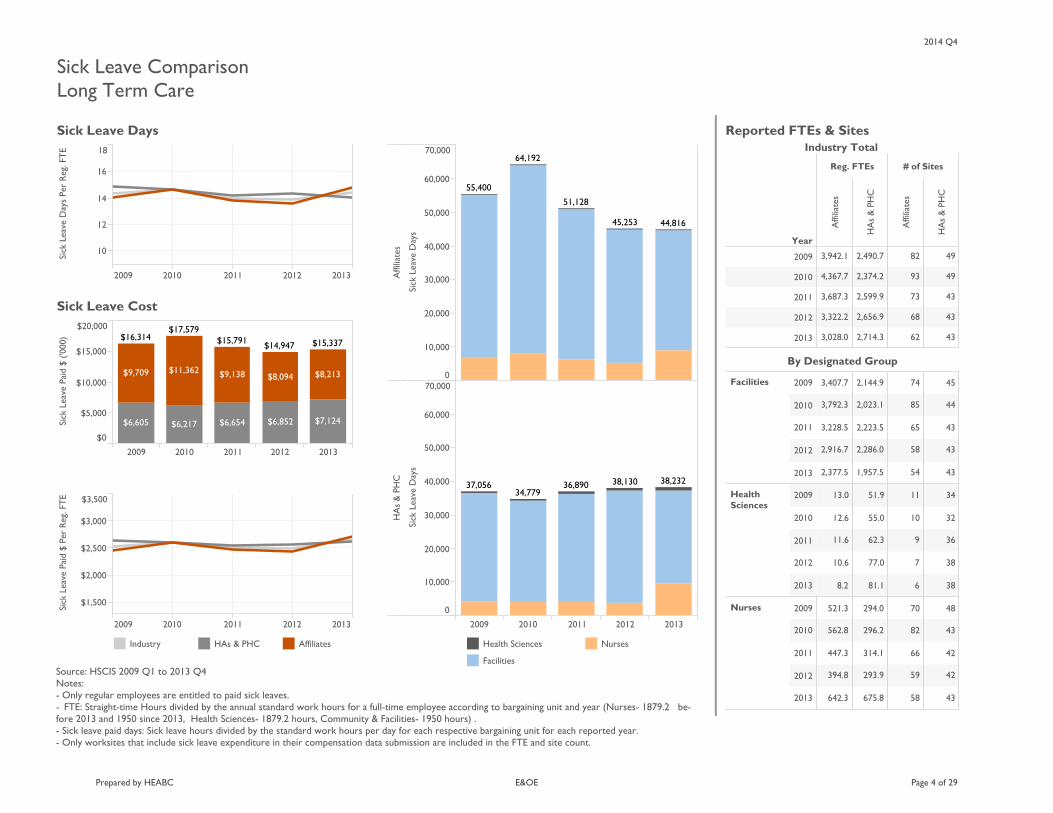
Sick Leave ComparisonLong Term Care
2009 2010 2011 2012 2013$0
$5,000
$10,000
$15,000
$20,000
Sick Leave Paid $ ('000)
$11,362
$6,217
$8,094
$6,654 $7,124
$9,138
$6,852
$9,709
$6,605
$8,213
$16,314$17,579
$15,791 $14,947 $15,337
2009 2010 2011 2012 2013
10
12
14
16
18
Sick Leave Days Per Reg. FTE
2009 2010 2011 2012 2013
$1,500
$2,000
$2,500
$3,000
$3,500
Sick Leave Paid $ Per Reg. FTE
Sick Leave Cost
2009 2010 2011 2012 2013
Affiliates
HAs & PHC
0
10,000
20,000
30,000
40,000
50,000
60,000
70,000
Sick Leave Days
0
10,000
20,000
30,000
40,000
50,000
60,000
70,000
Sick Leave Days
55,400
64,192
51,128
45,253 44,816
37,05634,779
36,890 38,130 38,232
Sick Leave Days
Long Term Care
Source: HSCIS 2009 Q1 to 2013 Q4Notes:- Only regular employees are entitled to paid sick leaves.- FTE: Straight-time Hours divided by the annual standard work hours for a full-time employee according to bargaining unit and year (Nurses- 1879.2 be-fore 2013 and 1950 since 2013, Health Sciences- 1879.2 hours, Community & Facilities- 1950 hours) .- Sick leave paid days: Sick leave hours divided by the standard work hours per day for each respective bargaining unit for each reported year.- Only worksites that include sick leave expenditure in their compensation data submission are included in the FTE and site count.
Year
Reg. FTEs
Affiliates
HAs & PHC
# of Sites
Affiliates
HAs & PHC
2009
2010
2011
2012
2013 2,714.3
2,656.9
2,599.9
2,374.2
2,490.7
3,028.0
3,322.2
3,687.3
4,367.7
3,942.1
43
43
43
49
49
62
68
73
93
82
Reported FTEs & Sites-
Facilities 2009
2010
2011
2012
2013
HealthSciences
2009
2010
2011
2012
2013
Nurses 2009
2010
2011
2012
2013
1,957.5
2,286.0
2,223.5
2,023.1
2,144.9
2,377.5
2,916.7
3,228.5
3,792.3
3,407.7
43
43
43
44
45
54
58
65
85
74
81.1
77.0
62.3
55.0
51.9
8.2
10.6
11.6
12.6
13.0
38
38
36
32
34
6
7
9
10
11
675.8
293.9
314.1
296.2
294.0
642.3
394.8
447.3
562.8
521.3
43
42
42
43
48
58
59
66
82
70
By Designated Group
Industry Total
Industry HAs & PHC Affiliates Health Sciences
Facilities
Nurses
2014 Q4
Prepared by HEABC
E&OE
Page 4 of 29
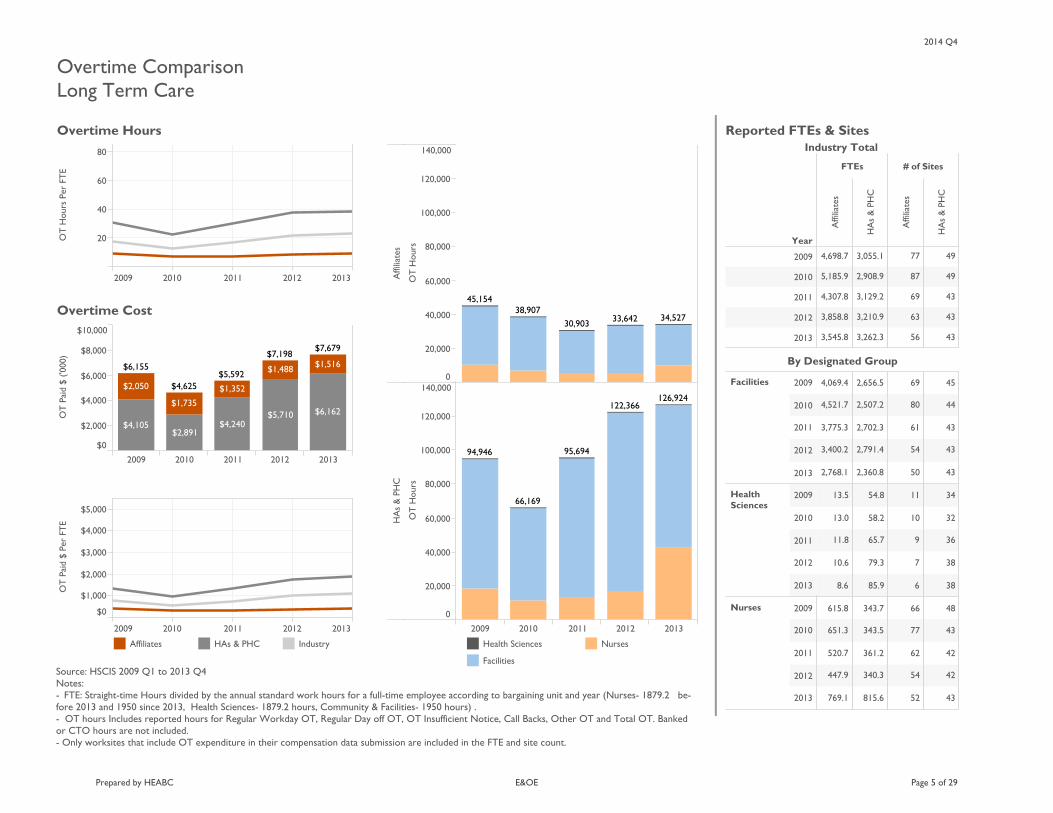
Overtime ComparisonLong Term Care
2009 2010 2011 2012 2013$0
$2,000
$4,000
$6,000
$8,000
$10,000
OT Paid $ ('000)
$2,050
$4,240$5,710
$1,488
$1,352
$1,516
$6,162$1,735
$4,105$2,891
$6,155
$4,625$5,592
$7,198$7,679
2009 2010 2011 2012 2013
20
40
60
80
OT Hours Per FTE
2009 2010 2011 2012 2013
$0
$1,000
$2,000
$3,000
$4,000
$5,000
OT Paid $ Per FTE
Overtime Cost
2009 2010 2011 2012 2013
Affiliates
HAs & PHC
0
20,000
40,000
60,000
80,000
100,000
120,000
140,000
OT Hours
0
20,000
40,000
60,000
80,000
100,000
120,000
140,000
OT Hours
45,15438,907
30,903 33,642 34,527
94,946
66,169
95,694
122,366126,924
Overtime Hours
Long Term Care
Source: HSCIS 2009 Q1 to 2013 Q4Notes:- FTE: Straight-time Hours divided by the annual standard work hours for a full-time employee according to bargaining unit and year (Nurses- 1879.2 be-fore 2013 and 1950 since 2013, Health Sciences- 1879.2 hours, Community & Facilities- 1950 hours) .- OT hours Includes reported hours for Regular Workday OT, Regular Day off OT, OT Insufficient Notice, Call Backs, Other OT and Total OT. Bankedor CTO hours are not included. - Only worksites that include OT expenditure in their compensation data submission are included in the FTE and site count.
Year
FTEs
Affiliates
HAs & PHC
# of Sites
Affiliates
HAs & PHC
2009
2010
2011
2012
2013 3,262.3
3,210.9
3,129.2
2,908.9
3,055.1
3,545.8
3,858.8
4,307.8
5,185.9
4,698.7
43
43
43
49
49
56
63
69
87
77
Reported FTEs & Sites- Industry Total
Facilities 2009
2010
2011
2012
2013
HealthSciences
2009
2010
2011
2012
2013
Nurses 2009
2010
2011
2012
2013
2,360.8
2,791.4
2,702.3
2,507.2
2,656.5
2,768.1
3,400.2
3,775.3
4,521.7
4,069.4
43
43
43
44
45
50
54
61
80
69
85.9
79.3
65.7
58.2
54.8
8.6
10.6
11.8
13.0
13.5
38
38
36
32
34
6
7
9
10
11
815.6
340.3
361.2
343.5
343.7
769.1
447.9
520.7
651.3
615.8
43
42
42
43
48
52
54
62
77
66
By Designated Group
Affiliates HAs & PHC Industry Health Sciences
Facilities
Nurses
2014 Q4
Prepared by HEABC
E&OE
Page 5 of 29
Section 2 Home Support Agency - FTEs by Job Status - 2013 - FTEs by Job Status - Trend - Sick Leave Comparison - Overtime Comparison
..
..
2014 Q4
Prepared by HEABC
E&OE
Page 6 of 29

FTEs by Job Status - 2013Home Support Agency
32.1%
25.1%
42.8%
Part TimeFTE: 1,296.8
25.1%
Full TimeFTE: 2,206.8
42.8%
CasualFTE: 1,655.9
32.1%
Industry: 5,159 FTEs
Full Time Part Time Casual
Service TypeHome Support Agency
48.7% 43.4%
7.9% Part TimeFTE: 206.1
7.9%
Full TimeFTE: 1,126.1
43.4%
CasualFTE: 1,263.4
48.7%
Affiliates: 2,596 FTEs
15.3%
42.5%
42.2%
Part TimeFTE: 1,090.8
42.5%
Full TimeFTE: 1,080.7
42.2%
CasualFTE: 392.4
15.3%
Health Authorities & PHC: 2,564 FTEs
Full Time Part Time Casual
Community Affiliates
HAs & PHC
Total
HealthSciences
Affiliates
HAs & PHC
Total
Nurses Affiliates
HAs & PHC
Total
1,555.0
301.2
1,253.7
927.2
725.4
201.9
1,608.2
511.7
1,096.5
12.2
12.0
0.2
125.6
125.6
212.2
211.8
0.4
88.7
79.2
9.5
244.0
239.8
4.2
386.5
357.3
29.2
By Designated Group
0% 10% 20% 30% 40% 50% 60% 70% 80% 90% 100%% of Total FTEs
38.0%22.7%39.3%
49.1%
19.6%47.2%
43.0%
33.3%
7.9%
35.9%60.6%
32.6%
35.9%
67.4%
60.6%
12.3%33.9%53.7%
22.1%
11.7%35.5%
68.1%
52.8%
9.8%
By DG - Bar
Source: HSCIS 2009 Q1 to 2013 Q4Notes:- Data is annualized to a 365-day reporting period- FTE = Straight-time Hours divided by the annual Standard Work Hours for a full-time employee according to bargaining group (Nurses & Health Sciences - 1879.2 hours, Community & Facilities - 1950 hours)
FTEs
Affiliates
HAs & PHC
# of Sites
Affiliates
HAs & PHC
2,563.92,595.6 328
Reported FTEs & Sites - 2013 Industry Total
Community
Health Sciences
Nurses 676.3
349.4
1,538.2
42.9
0.6
2,552.1
32
22
27
5
1
8
By Designated Group
2014 Q4
Prepared by HEABC
E&OE
Page 7 of 29

YEAR
FTEs
Affiliates
HAs & PHC
# of Sites
Affiliates
HAs & PHC
2009
2010
2011
2012
2013 2,563.9
2,384.8
2,168.6
1,636.4
2,197.0
2,595.6
2,612.4
2,407.1
1,765.5
1,888.7
32
32
33
38
38
8
8
8
7
10
Reported FTEs & Sites Industry Total
Source: HSCIS 2009 Q1 to 2013 Q4Notes:- Data is annualized to a 365-day reporting period- FTE: Straight-time Hours divided by the annual standard work hours for a full-time employee according to bargaining group and year (Nurses - 1879.2 before 2013 and 1950 since 2013, Health Sciences - 1879.2 hours,Community & Facilities - 1950 hours).
Service TypeHome Support Agency
Community 2009
2010
2011
2012
2013
HealthSciences
2009
2010
2011
2012
2013
Nurses 2009
2010
2011
2012
2013
1,538.2
1,506.3
1,391.8
1,313.4
1,870.9
2,552.1
2,603.4
2,398.5
1,761.3
1,882.9
27
27
28
38
38
8
8
8
7
10
349.4
315.0
277.0
143.6
130.3
0.6
0.6
0.9
1.0
0.2
22
23
22
6
6
1
1
1
1
1
676.3
563.5
499.8
179.4
195.9
42.9
8.5
7.7
3.2
5.7
32
31
31
16
23
5
4
4
3
4
By Designated Group
Affiliates HAs & PHC
2009 2010 2011 2012 2013 2009 2010 2011 2012 20130
500
1,000
1,500
2,000
2,500
FTEs
1,151.0
1,186.0 1,126.1
1,081.61,242.9 1,263.4
847.4832.5
770.2 764.0
(44.9%)(47.2%)
(47.8%)
(45.4%) (43.4%)
(40.8%) (43.3%)(44.9%)
(47.6%) (48.7%)
1,888.71,765.5
2,407.1
2,612.4 2,595.6
1,888.71,765.5
2,407.1
2,612.4 2,595.6
1,013.41,080.7
1,017.11,090.8
998.7
649.0
920.4
782.7
738.1
924.3
415.6249.3 323.9 354.2 392.4
(45.5%)
(39.7%)
(42.4%)
(42.5%)(42.2%)
(35.6%)
(45.1%)
(42.6%)(42.6%)
(42.5%)
(18.9%)(15.2%) (14.9%) (14.9%) (15.3%)
2,197.0
1,636.4
2,168.6
2,384.8
2,563.9
2,197.0
1,636.4
2,168.6
2,384.8
2,563.9
Full Time Part Time Casual
FTEs by Job Status - Trend Home Support Agency
Community Health Sciences Nurses
2009 2010 2011 2012 2013 2009 2010 2011 2012 2013 2009 2010 2011 2012 20130
1,000
2,000
3,000
4,000
FTEs
By Designated Group
2014 Q4
Prepared by HEABC
E&OE
Page 8 of 29
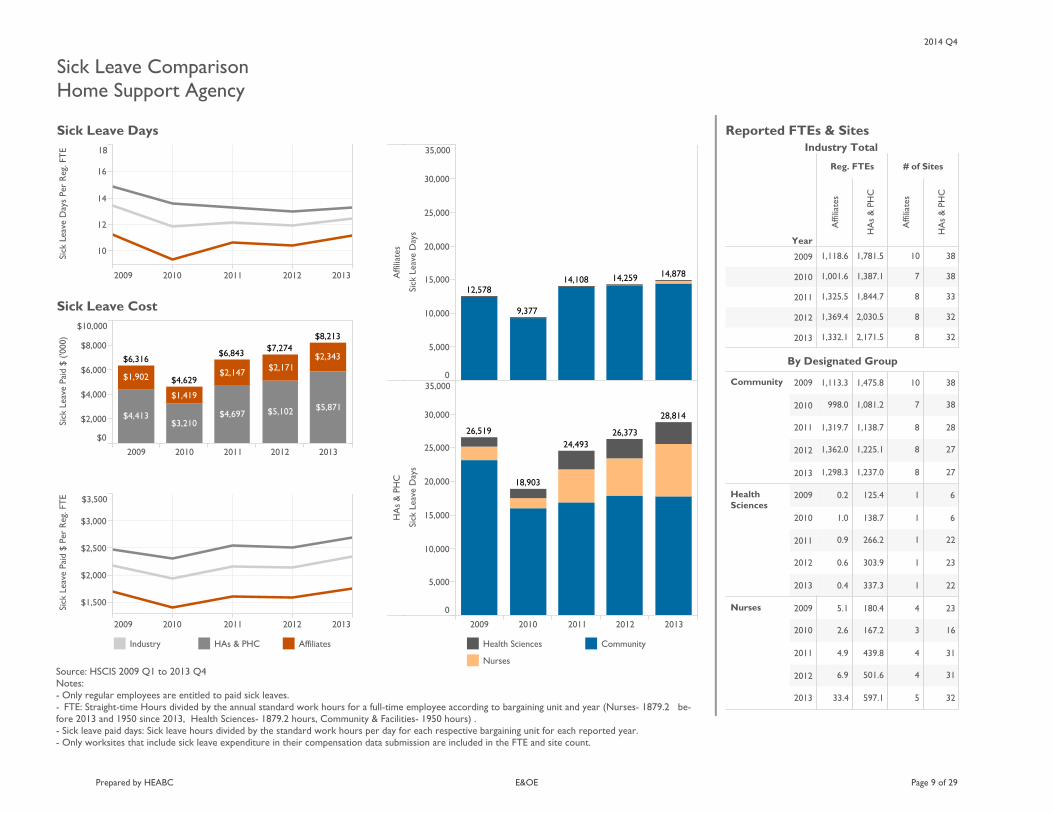
Sick Leave ComparisonHome Support Agency
2009 2010 2011 2012 2013$0
$2,000
$4,000
$6,000
$8,000
$10,000
Sick Leave Paid $ ('000)
$2,147
$4,697$3,210
$1,902
$5,102
$1,419
$2,343
$4,413
$2,171
$5,871
$6,316
$4,629
$6,843 $7,274$8,213
2009 2010 2011 2012 2013
10
12
14
16
18
Sick Leave Days Per Reg. FTE
2009 2010 2011 2012 2013
$1,500
$2,000
$2,500
$3,000
$3,500
Sick Leave Paid $ Per Reg. FTE
Sick Leave Cost
2009 2010 2011 2012 2013
Affiliates
HAs & PHC
0
5,000
10,000
15,000
20,000
25,000
30,000
35,000
Sick Leave Days
0
5,000
10,000
15,000
20,000
25,000
30,000
35,000
Sick Leave Days
12,578
9,377
14,108 14,259 14,878
26,519
18,903
24,49326,373
28,814
Sick Leave Days
Home Support Agency
Source: HSCIS 2009 Q1 to 2013 Q4Notes:- Only regular employees are entitled to paid sick leaves.- FTE: Straight-time Hours divided by the annual standard work hours for a full-time employee according to bargaining unit and year (Nurses- 1879.2 be-fore 2013 and 1950 since 2013, Health Sciences- 1879.2 hours, Community & Facilities- 1950 hours) .- Sick leave paid days: Sick leave hours divided by the standard work hours per day for each respective bargaining unit for each reported year.- Only worksites that include sick leave expenditure in their compensation data submission are included in the FTE and site count.
Year
Reg. FTEs
Affiliates
HAs & PHC
# of Sites
Affiliates
HAs & PHC
2009
2010
2011
2012
2013 2,171.5
2,030.5
1,844.7
1,387.1
1,781.5
1,332.1
1,369.4
1,325.5
1,001.6
1,118.6
32
32
33
38
38
8
8
8
7
10
Reported FTEs & Sites-
Community 2009
2010
2011
2012
2013
HealthSciences
2009
2010
2011
2012
2013
Nurses 2009
2010
2011
2012
2013
1,237.0
1,225.1
1,138.7
1,081.2
1,475.8
1,298.3
1,362.0
1,319.7
998.0
1,113.3
27
27
28
38
38
8
8
8
7
10
337.3
303.9
266.2
138.7
125.4
0.4
0.6
0.9
1.0
0.2
22
23
22
6
6
1
1
1
1
1
597.1
501.6
439.8
167.2
180.4
33.4
6.9
4.9
2.6
5.1
32
31
31
16
23
5
4
4
3
4
By Designated Group
Industry Total
Industry HAs & PHC Affiliates Health Sciences
Nurses
Community
2014 Q4
Prepared by HEABC
E&OE
Page 9 of 29

Overtime ComparisonHome Support Agency
2009 2010 2011 2012 2013$0
$2,000
$4,000
$6,000
$8,000
OT Paid $ ('000)
$3,087
$4,088
$1,356$2,256
$1,242 $1,152$1,806 $2,256
$2,043
$787
$3,285
$2,143
$3,409
$4,893
$6,344
2009 2010 2011 2012 2013
20
40
60
80
OT Hours Per FTE
2009 2010 2011 2012 2013
$0
$1,000
$2,000
$3,000
$4,000
$5,000
OT Paid $ Per FTE
Overtime Cost
2009 2010 2011 2012 2013
Affiliates
HAs & PHC
0
20,000
40,000
60,000
80,000
100,000
120,000
140,000
OT Hours
0
20,000
40,000
60,000
80,000
100,000
120,000
140,000
OT Hours
63,266
43,077
71,339
96,093
122,609
35,113
20,96727,684
46,162
56,562
Overtime Hours
Home Support Agency
Source: HSCIS 2009 Q1 to 2013 Q4Notes:- FTE: Straight-time Hours divided by the annual standard work hours for a full-time employee according to bargaining unit and year (Nurses- 1879.2 be-fore 2013 and 1950 since 2013, Health Sciences- 1879.2 hours, Community & Facilities- 1950 hours) .- OT hours Includes reported hours for Regular Workday OT, Regular Day off OT, OT Insufficient Notice, Call Backs, Other OT and Total OT. Bankedor CTO hours are not included. - Only worksites that include OT expenditure in their compensation data submission are included in the FTE and site count.
Year
FTEs
Affiliates
HAs & PHC
# of Sites
Affiliates
HAs & PHC
2009
2010
2011
2012
2013 2,563.9
2,384.8
2,168.6
1,636.4
2,197.0
2,595.6
2,591.5
2,386.1
1,748.2
1,874.2
32
32
33
38
38
8
7
7
6
9
Reported FTEs & Sites- Industry Total
Community 2009
2010
2011
2012
2013
HealthSciences
2009
2010
2011
2012
2013
Nurses 2009
2010
2011
2012
2013
1,538.2
1,506.3
1,391.8
1,313.4
1,870.9
2,552.1
2,583.9
2,379.2
1,745.8
1,869.0
27
27
28
38
38
8
7
7
6
9
349.4
315.0
277.0
143.6
130.3
0.6 22
23
22
6
6
1
676.3
563.5
499.8
179.4
195.9
42.9
7.7
7.0
2.5
5.1
32
31
31
16
23
5
3
3
2
3
By Designated Group
Affiliates HAs & PHC Industry Health Sciences
Nurses
Community
2014 Q4
Prepared by HEABC
E&OE
Page 10 of 29

Section 3 Mental Health - FTEs by Job Status - 2013 - FTEs by Job Status - Trend - Sick Leave Comparison - Overtime Comparison
..
..
2014 Q4
Prepared by HEABC
E&OE
Page 11 of 29
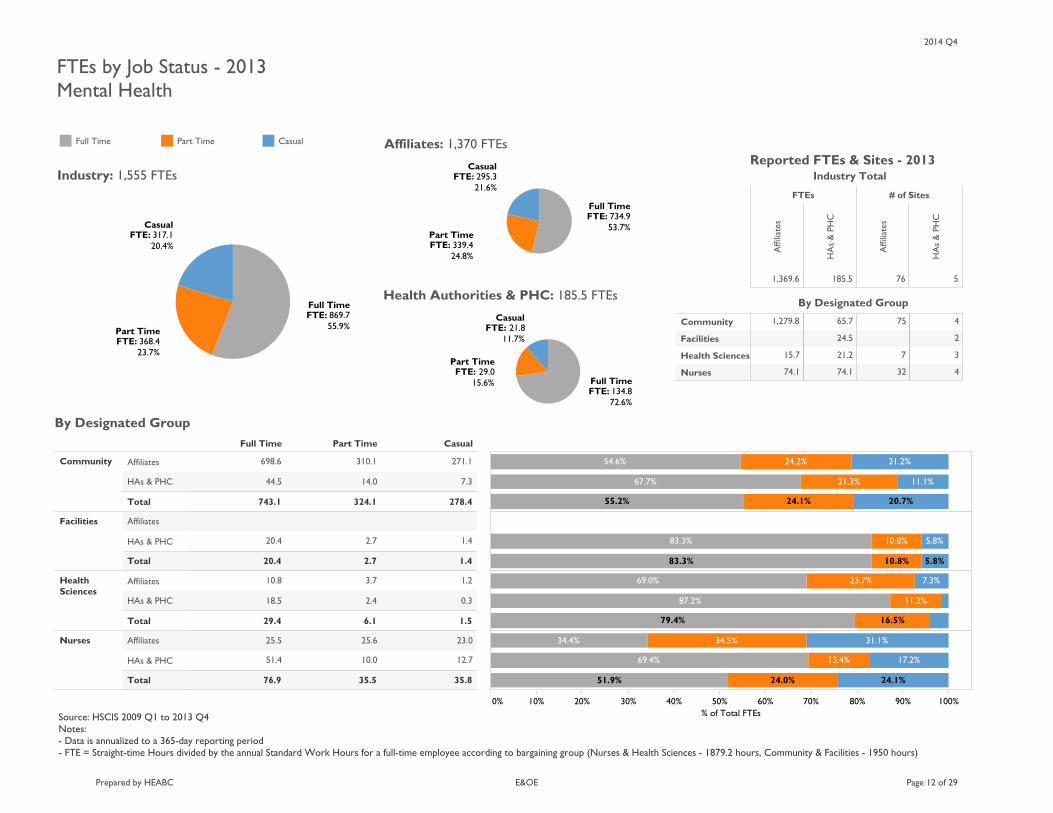
FTEs by Job Status - 2013Mental Health
20.4%
23.7%
55.9% Part TimeFTE: 368.4
23.7%
Full TimeFTE: 869.7
55.9%
CasualFTE: 317.1
20.4%
Industry: 1,555 FTEs
Full Time Part Time Casual
Service TypeMental Health
21.6%
24.8%53.7% Part Time
FTE: 339.424.8%
Full TimeFTE: 734.9
53.7%
CasualFTE: 295.3
21.6%
Affiliates: 1,370 FTEs
11.7%
15.6%
72.6%
Part TimeFTE: 29.015.6% Full Time
FTE: 134.872.6%
CasualFTE: 21.811.7%
Health Authorities & PHC: 185.5 FTEs
Full Time Part Time Casual
Community Affiliates
HAs & PHC
Total
Facilities Affiliates
HAs & PHC
Total
HealthSciences
Affiliates
HAs & PHC
Total
Nurses Affiliates
HAs & PHC
Total
278.4
7.3
271.1
324.1
14.0
310.1
743.1
44.5
698.6
1.4
1.4
2.7
2.7
20.4
20.4
1.5
0.3
1.2
6.1
2.4
3.7
29.4
18.5
10.8
35.8
12.7
23.0
35.5
10.0
25.6
76.9
51.4
25.5
By Designated Group
0% 10% 20% 30% 40% 50% 60% 70% 80% 90% 100%% of Total FTEs
20.7%24.1%55.2%
21.2%
11.1%
24.2%
21.3%
54.6%
67.7%
10.8%83.3%
10.8%83.3%
5.8%
5.8%
16.5%79.4%
23.7%
11.2%
69.0%
87.2%
7.3%
24.1%24.0%51.9%
31.1%
17.2%
34.5%
13.4%
34.4%
69.4%
By DG - Bar
Source: HSCIS 2009 Q1 to 2013 Q4Notes:- Data is annualized to a 365-day reporting period- FTE = Straight-time Hours divided by the annual Standard Work Hours for a full-time employee according to bargaining group (Nurses & Health Sciences - 1879.2 hours, Community & Facilities - 1950 hours)
FTEs
Affiliates
HAs & PHC
# of Sites
Affiliates
HAs & PHC
185.51,369.6 576
Reported FTEs & Sites - 2013 Industry Total
Community
Facilities
Health Sciences
Nurses 74.1
21.2
24.5
65.7
74.1
15.7
1,279.8
4
3
2
4
32
7
75
By Designated Group
2014 Q4
Prepared by HEABC
E&OE
Page 12 of 29

YEAR
FTEs
Affiliates
HAs & PHC
# of Sites
Affiliates
HAs & PHC
2009
2010
2011
2012
2013 185.5
162.2
157.2
56.9
70.9
1,369.6
1,522.7
1,501.2
1,484.3
1,470.9
5
6
5
5
5
76
98
93
92
94
Reported FTEs & Sites Industry Total
Source: HSCIS 2009 Q1 to 2013 Q4Notes:- Data is annualized to a 365-day reporting period- FTE: Straight-time Hours divided by the annual standard work hours for a full-time employee according to bargaining group and year (Nurses - 1879.2 before 2013 and 1950 since 2013, Health Sciences - 1879.2 hours,Community & Facilities - 1950 hours).
Service TypeMental Health
Community 2009
2010
2011
2012
2013
Facilities 2009
2010
2011
2012
2013
HealthSciences
2009
2010
2011
2012
2013
Nurses 2009
2010
2011
2012
2013
65.7
68.2
76.2
49.7
61.2
1,279.8
1,443.5
1,417.5
1,400.7
1,388.5
4
5
4
4
5
75
98
93
92
94
24.5
11.6
7.8
2
2
2
21.2
19.4
18.1
1.3
1.0
15.7
12.3
15.2
15.5
11.2
3
4
3
2
1
7
7
8
8
7
74.1
63.1
55.1
6.0
8.7
74.1
66.9
68.6
68.2
71.2
4
5
4
3
3
32
32
32
35
38
By Designated Group
Affiliates HAs & PHC
2009 2010 2011 2012 2013 2009 2010 2011 2012 20130
500
1,000
1,500
FTEs
0
500
1,000
1,500
FTE
804.1 807.2 797.5 811.5
734.9
368.6 385.4 401.1 405.6339.4
298.2 291.8 302.5 305.6 295.3
(54.7%) (54.4%) (53.1%) (53.3%)
(53.7%)
(25.1%) (26.0%) (26.7%) (26.6%)(24.8%)
(20.3%) (19.7%) (20.2%) (20.1%) (21.6%)
1,470.9 1,484.3 1,501.2 1,522.7
1,369.6
1,470.9 1,484.3 1,501.2 1,522.7
1,369.6
70.9 56.9
157.2 162.2 185.5
70.9 56.9
157.2 162.2 185.5
Full Time Part Time Casual
FTEs by Job Status - Trend Mental Health
Community Facilities Health Sciences Nurses
2009 2010 2011 2012 2013 2009 2010 2011 2012 2013 2009 2010 2011 2012 2013 2009 2010 2011 2012 20130
500
1,000
1,500
FTEs
By Designated Group
2014 Q4
Prepared by HEABC
E&OE
Page 13 of 29
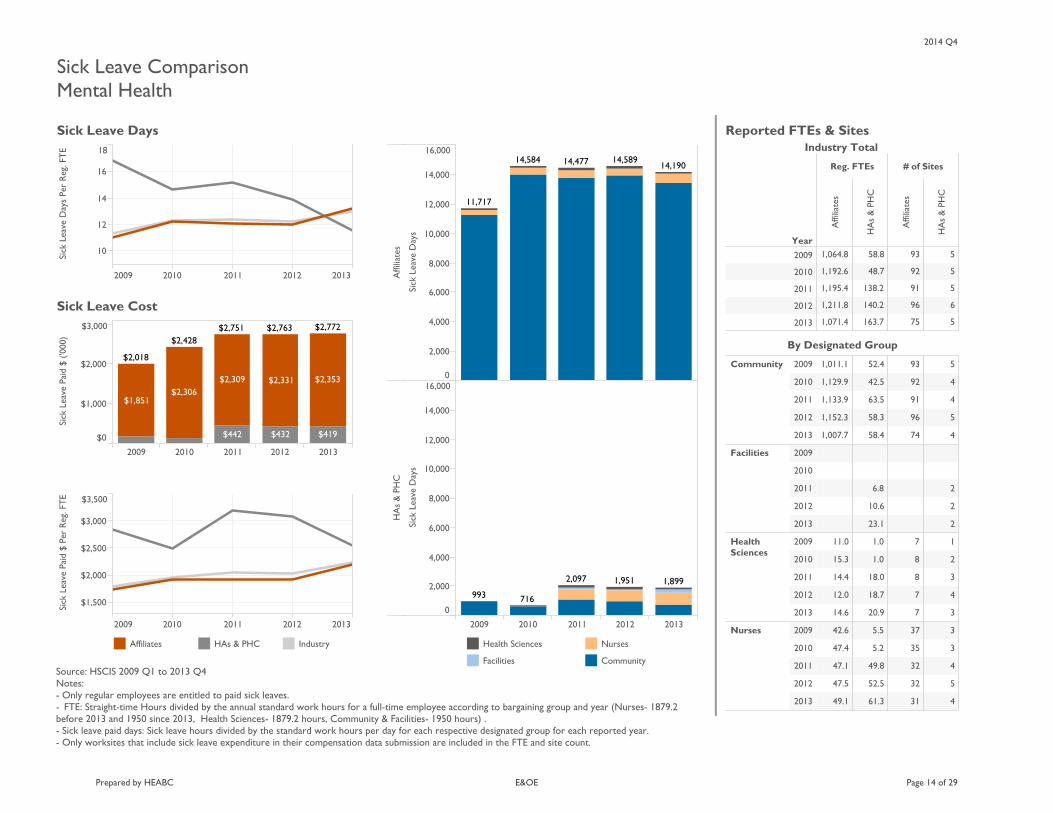
Sick Leave ComparisonMental Health
2009 2010 2011 2012 2013$0
$1,000
$2,000
$3,000
Sick Leave Paid $ ('000)
$2,306$2,309 $2,353
$1,851
$2,331
$442 $432 $419
$2,018
$2,428$2,751 $2,763 $2,772
2009 2010 2011 2012 2013
10
12
14
16
18
Sick Leave Days Per Reg. FTE
2009 2010 2011 2012 2013
$1,500
$2,000
$2,500
$3,000
$3,500
Sick Leave Paid $ Per Reg. FTE
Sick Leave Cost
2009 2010 2011 2012 2013
Affiliates
HAs & PHC
0
2,000
4,000
6,000
8,000
10,000
12,000
14,000
16,000
Sick Leave Days
0
2,000
4,000
6,000
8,000
10,000
12,000
14,000
16,000
Sick Leave Days
11,717
14,584 14,477 14,58914,190
993 716
2,097 1,951 1,899
Sick Leave Days
Mental Health
Source: HSCIS 2009 Q1 to 2013 Q4Notes:- Only regular employees are entitled to paid sick leaves.- FTE: Straight-time Hours divided by the annual standard work hours for a full-time employee according to bargaining group and year (Nurses- 1879.2before 2013 and 1950 since 2013, Health Sciences- 1879.2 hours, Community & Facilities- 1950 hours) .- Sick leave paid days: Sick leave hours divided by the standard work hours per day for each respective designated group for each reported year.- Only worksites that include sick leave expenditure in their compensation data submission are included in the FTE and site count.
Year
Reg. FTEs
Affiliates
HAs & PHC
# of Sites
Affiliates
HAs & PHC
2009
2010
2011
2012
2013 163.7
140.2
138.2
48.7
58.8
1,071.4
1,211.8
1,195.4
1,192.6
1,064.8
5
6
5
5
5
75
96
91
92
93
Reported FTEs & Sites-
Community 2009
2010
2011
2012
2013
Facilities 2009
2010
2011
2012
2013
HealthSciences
2009
2010
2011
2012
2013
Nurses 2009
2010
2011
2012
2013
58.4
58.3
63.5
42.5
52.4
1,007.7
1,152.3
1,133.9
1,129.9
1,011.1
4
5
4
4
5
74
96
91
92
93
23.1
10.6
6.8
2
2
2
20.9
18.7
18.0
1.0
1.0
14.6
12.0
14.4
15.3
11.0
3
4
3
2
1
7
7
8
8
7
61.3
52.5
49.8
5.2
5.5
49.1
47.5
47.1
47.4
42.6
4
5
4
3
3
31
32
32
35
37
By Designated Group
Industry Total
Affiliates HAs & PHC Industry Health Sciences
Facilities
Nurses
Community
2014 Q4
Prepared by HEABC
E&OE
Page 14 of 29

Overtime ComparisonMental Health
2009 2010 2011 2012 2013$0
$500
$1,000
$1,500
$2,000
OT Paid $ ('000)
$917
$634$818
$818
$818
$836
$789$411
$553
$897
$1,607$1,735
$1,470
2009 2010 2011 2012 2013
20
40
60
80
OT Hours Per FTE
2009 2010 2011 2012 2013
$0
$1,000
$2,000
$3,000
$4,000
$5,000
OT Paid $ Per FTE
Overtime Cost
2009 2010 2011 2012 2013
Affiliates
HAs & PHC
0
5,000
10,000
15,000
20,000
25,000
30,000
OT Hours
0
5,000
10,000
15,000
20,000
25,000
30,000
OT Hours
12,325
23,459 23,259
25,703
22,946
3,9702,342
12,570 12,688
10,352
Overtime Hours
Mental Health
Source: HSCIS 2009 Q1 to 2013 Q4Notes:- FTE: Straight-time Hours divided by the annual standard work hours for a full-time employee according to bargaining group and year (Nurses- 1879.2before 2013 and 1950 since 2013, Health Sciences- 1879.2 hours, Community & Facilities- 1950 hours) .- OT hours Includes reported hours for Regular Workday OT, Regular Day off OT, OT Insufficient Notice, Call Backs, Other OT and Total OT. Bankedor CTO hours are not included. - Only worksites that include OT expenditure in their compensation data submission are included in the FTE and site count.
Year
FTEs
Affiliates
HAs & PHC
# of Sites
Affiliates
HAs & PHC
2009
2010
2011
2012
2013 185.5
162.2
157.2
56.9
70.9
1,166.8
1,323.8
1,311.4
1,295.2
824.2
5
6
5
5
5
50
70
65
66
66
Reported FTEs & Sites- Industry Total
Community 2009
2010
2011
2012
2013
Facilities 2009
2010
2011
2012
2013
HealthSciences
2009
2010
2011
2012
2013
Nurses 2009
2010
2011
2012
2013
65.7
68.2
76.2
49.7
61.2
1,095.3
1,258.5
1,241.9
1,226.4
767.7
4
5
4
4
5
49
70
65
66
66
24.5
11.6
7.8
2
2
2
21.2
19.4
18.1
1.3
1.0
7.4
6.1
7.3
7.6
3.4
3
4
3
2
1
5
5
6
6
4
74.1
63.1
55.1
6.0
8.7
64.1
59.2
62.2
61.2
53.1
4
5
4
3
3
27
28
28
30
31
By Designated Group
Affiliates HAs & PHC Industry Health Sciences
Facilities
Nurses
Community
2014 Q4
Prepared by HEABC
E&OE
Page 15 of 29
Section 4 Child Development Centre - FTEs by Job Status - 2013 - FTEs by Job Status - Trend - Sick Leave Comparison - Overtime Comparison
..
..
2014 Q4
Prepared by HEABC
E&OE
Page 16 of 29

FTEs by Job Status - 2013Child Development Centre
Service TypeChild Development Centre
45.4%
46.4%
8.3%
Part TimeFTE: 133.1
45.4%
Full TimeFTE: 136.2
46.4%
CasualFTE: 24.2
8.3%
Affiliates: 293.5 FTEs
Full Time Part Time Casual
Community Affiliates
Facilities Affiliates
Health Sciences Affiliates
Nurses Affiliates
20.966.829.6
0.52.11.0
2.964.3105.6
By Designated Group
0% 10% 20% 30% 40% 50% 60% 70% 80% 90% 100%% of Total FTEs
17.8%57.0%25.2%
14.0%58.0%28.0%
37.2%61.1%
By DG - Bar
Source: HSCIS 2009 Q1 to 2013 Q4Notes:- Data is annualized to a 365-day reporting period- FTE = Straight-time Hours divided by the annual Standard Work Hours for a full-time employee according to bargaining group (Nurses & Health Sciences - 1879.2 hours, Community & Facilities - 1950 hours)
FTEs
Affiliates
# of Sites
Affiliates
293.5 9
Reported FTEs & Sites - 2013 Industry Total
Community
Facilities
Health Sciences 172.7
3.6
117.2
9
1
8
By Designated Group
Full Time Part Time Casual
*Child development centre is a service provided only through the affiliate worksites.
2014 Q4
Prepared by HEABC
E&OE
Page 17 of 29

YEAR
FTEs
Affiliates
# of Sites
Affiliates
2009
2010
2011
2012
2013 293.5
453.7
475.2
480.6
476.9
9
13
14
14
14
Reported FTEs & Sites Industry Total
Source: HSCIS 2009 Q1 to 2013 Q4Notes:- Data is annualized to a 365-day reporting period- FTE: Straight-time Hours divided by the annual standard work hours for a full-time employee according to bargaining group and year (Nurses - 1879.2 before 2013 and 1950 since 2013, Health Sciences - 1879.2 hours,Community & Facilities - 1950 hours).
Service TypeChild Development Centre
Community 2009
2010
2011
2012
2013
Facilities 2009
2010
2011
2012
2013
HealthSciences
2009
2010
2011
2012
2013
117.2
177.0
176.2
163.0
168.5
8
12
13
12
12
3.6
4.4
3.6
3.8
4.3
1
1
1
1
1
172.7
272.3
295.4
313.7
304.1
9
12
14
14
14
By Designated Group
Affiliates
2009 2010 2011 2012 20130
100
200
300
400
500
FTEs
199.7 210.7 200.7
232.0 228.4
193.8
136.2
242.3217.1
133.1
36.045.2 24.235.944.5
(45.4%)
(44.2%)(44.3%)(40.3%)(41.9%)
(46.4%)
(47.9%)(48.1%)(50.4%)(48.6%)
476.9 480.6 475.2453.7
293.5
476.9 480.6 475.2453.7
293.5
Full Time Part Time Casual
FTEs by Job Status - Trend Child Development Centre
Community Facilities Health Sciences
2009 2010 2011 2012 2013 2009 2010 2011 2012 2013 2009 2010 2011 2012 20130
100
200
300
FTEs
By Designated Group
*Child development centre is a service provided only through the affiliate worksites.
2014 Q4
Prepared by HEABC
E&OE
Page 18 of 29
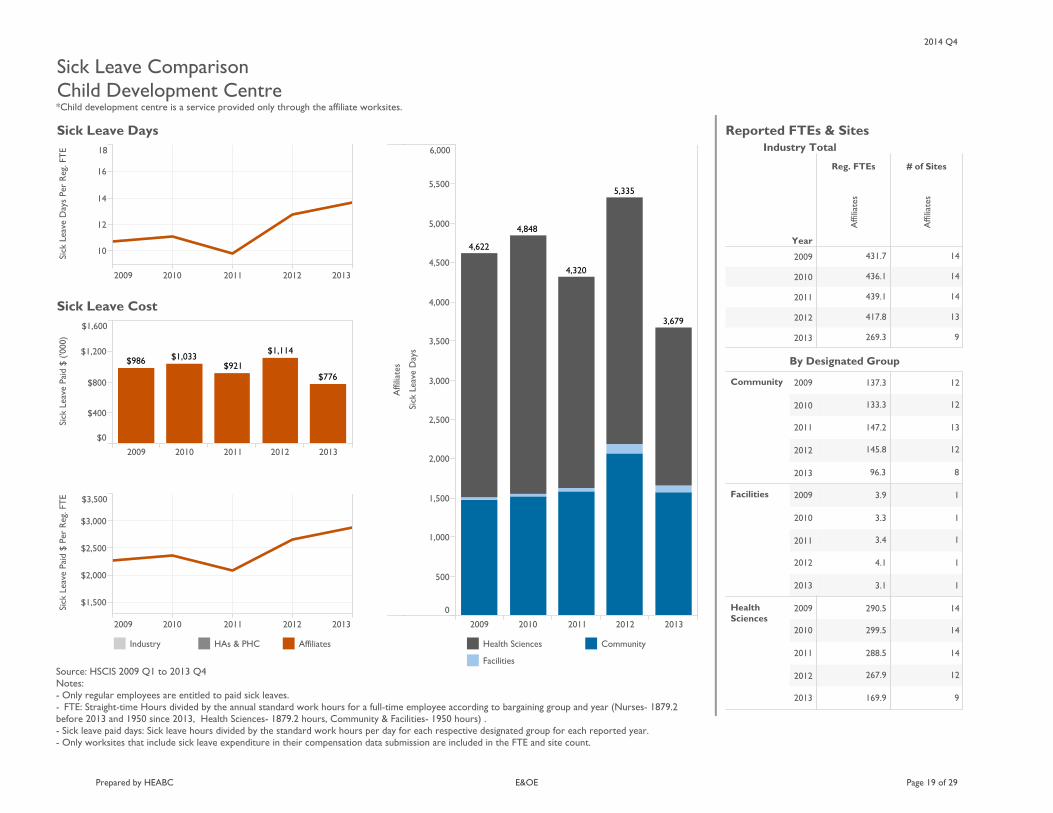
Sick Leave ComparisonChild Development Centre
2009 2010 2011 2012 2013$0
$400
$800
$1,200
$1,600
Sick Leave Paid $ ('000)
$1,114$1,033$986
$776$921
2009 2010 2011 2012 2013
10
12
14
16
18
Sick Leave Days Per Reg. FTE
2009 2010 2011 2012 2013
$1,500
$2,000
$2,500
$3,000
$3,500
Sick Leave Paid $ Per Reg. FTE
Sick Leave Cost
2009 2010 2011 2012 2013
Affiliates
0
500
1,000
1,500
2,000
2,500
3,000
3,500
4,000
4,500
5,000
5,500
6,000
Sick Leave Days
4,622
4,848
4,320
5,335
3,679
Sick Leave Days
Child Development Centre
Source: HSCIS 2009 Q1 to 2013 Q4Notes:- Only regular employees are entitled to paid sick leaves.- FTE: Straight-time Hours divided by the annual standard work hours for a full-time employee according to bargaining group and year (Nurses- 1879.2before 2013 and 1950 since 2013, Health Sciences- 1879.2 hours, Community & Facilities- 1950 hours) .- Sick leave paid days: Sick leave hours divided by the standard work hours per day for each respective designated group for each reported year.- Only worksites that include sick leave expenditure in their compensation data submission are included in the FTE and site count.
Year
Reg. FTEs
Affiliates
# of Sites
Affiliates
2009
2010
2011
2012
2013 269.3
417.8
439.1
436.1
431.7
9
13
14
14
14
Reported FTEs & Sites-
Community 2009
2010
2011
2012
2013
Facilities 2009
2010
2011
2012
2013
HealthSciences
2009
2010
2011
2012
2013
96.3
145.8
147.2
133.3
137.3
8
12
13
12
12
3.1
4.1
3.4
3.3
3.9
1
1
1
1
1
169.9
267.9
288.5
299.5
290.5
9
12
14
14
14
By Designated Group
Industry Total
Industry HAs & PHC Affiliates Health Sciences
Facilities
Community
*Child development centre is a service provided only through the affiliate worksites.
2014 Q4
Prepared by HEABC
E&OE
Page 19 of 29

Overtime ComparisonChild Development Centre
2009 2010 2011 2012 2013$0
$10
$20
$30
$40
OT Paid $ ('000) $27
$12
$7 $8$6
2009 2010 2011 2012 2013
20
40
60
80
OT Hours Per FTE
2009 2010 2011 2012 2013
$0
$1,000
$2,000
$3,000
$4,000
$5,000
OT Paid $ Per FTE
Overtime Cost
2009 2010 2011 2012 2013
Affiliates
0
100
200
300
400
500
600
700
800
OT Hours
176199
341
661
142
Overtime Hours
Child Development Centre
Source: HSCIS 2009 Q1 to 2013 Q4Notes:- FTE: Straight-time Hours divided by the annual standard work hours for a full-time employee according to bargaining group and year (Nurses- 1879.2before 2013 and 1950 since 2013, Health Sciences- 1879.2 hours, Community & Facilities- 1950 hours) .- OT hours Includes reported hours for Regular Workday OT, Regular Day off OT, OT Insufficient Notice, Call Backs, Other OT and Total OT. Bankedor CTO hours are not included. - Only worksites that include OT expenditure in their compensation data submission are included in the FTE and site count.
Year
FTEs
Affiliates
# of Sites
Affiliates
2009
2010
2011
2012
2013 171.2
322.6
340.8
347.8
343.4
6
9
10
10
10
Reported FTEs & Sites- Industry Total
Community 2009
2010
2011
2012
2013
Facilities 2009
2010
2011
2012
2013
HealthSciences
2009
2010
2011
2012
2013
74.9
132.3
132.3
118.3
118.5
5
8
9
8
8
3.6
4.4
3.6
3.8
4.3
1
1
1
1
1
92.7
185.9
204.9
225.7
220.6
6
8
10
10
10
By Designated Group
Affiliates HAs & PHC Industry Health Sciences
Facilities
Community
*Child development centre is a service provided only through the affiliate worksites.
2014 Q4
Prepared by HEABC
E&OE
Page 20 of 29
Appendix - Sick Leave in Long Term Care - Overtime in Long Term Care - Sick Leave in Home Support Agency - Overtime in Home Support Agency - Sick Leave in Mental Health - Overtime in Mental Health - Sick Leave in Child Development Centre - Overtime in Child Development Centre
..
..
2014 Q4
Prepared by HEABC
E&OE
Page 21 of 29
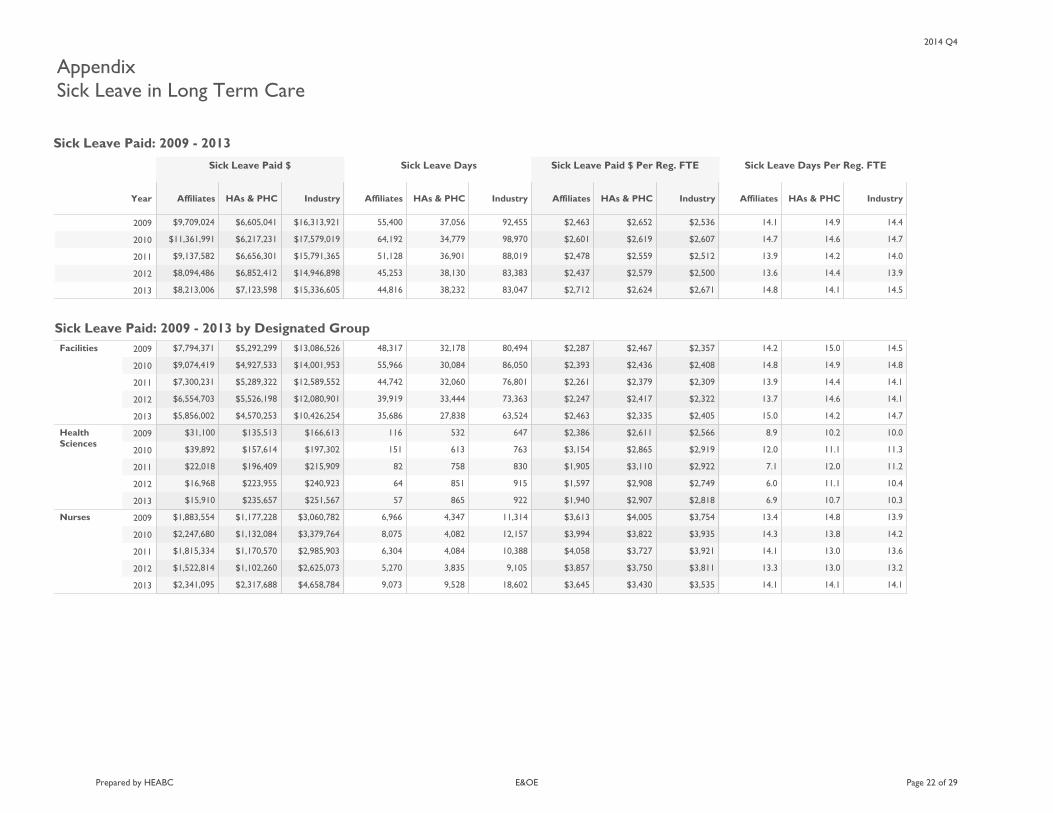
AppendixSick Leave in Long Term Care
Sick Leave Paid $ Sick Leave Days Sick Leave Paid $ Per Reg. FTE Sick Leave Days Per Reg. FTE
Year Affiliates HAs & PHC Industry Affiliates HAs & PHC Industry Affiliates HAs & PHC Industry Affiliates HAs & PHC Industry
2009
2010
2011
2012
2013 14.5
13.9
14.0
14.7
14.4
14.1
14.4
14.2
14.6
14.9
14.8
13.6
13.9
14.7
14.1
$2,671
$2,500
$2,512
$2,607
$2,536
$2,624
$2,579
$2,559
$2,619
$2,652
$2,712
$2,437
$2,478
$2,601
$2,463
83,047
83,383
88,019
98,970
92,455
38,232
38,130
36,901
34,779
37,056
44,816
45,253
51,128
64,192
55,400
$15,336,605
$14,946,898
$15,791,365
$17,579,019
$16,313,921
$7,123,598
$6,852,412
$6,656,301
$6,217,231
$6,605,041
$8,213,006
$8,094,486
$9,137,582
$11,361,991
$9,709,024
Facilities 2009
2010
2011
2012
2013
HealthSciences
2009
2010
2011
2012
2013
Nurses 2009
2010
2011
2012
2013
14.7
14.1
14.1
14.8
14.5
14.2
14.6
14.4
14.9
15.0
15.0
13.7
13.9
14.8
14.2
$2,405
$2,322
$2,309
$2,408
$2,357
$2,335
$2,417
$2,379
$2,436
$2,467
$2,463
$2,247
$2,261
$2,393
$2,287
63,524
73,363
76,801
86,050
80,494
27,838
33,444
32,060
30,084
32,178
35,686
39,919
44,742
55,966
48,317
$10,426,254
$12,080,901
$12,589,552
$14,001,953
$13,086,526
$4,570,253
$5,526,198
$5,289,322
$4,927,533
$5,292,299
$5,856,002
$6,554,703
$7,300,231
$9,074,419
$7,794,371
10.3
10.4
11.2
11.3
10.0
10.7
11.1
12.0
11.1
10.2
6.9
6.0
7.1
12.0
8.9
$2,818
$2,749
$2,922
$2,919
$2,566
$2,907
$2,908
$3,110
$2,865
$2,611
$1,940
$1,597
$1,905
$3,154
$2,386
922
915
830
763
647
865
851
758
613
532
57
64
82
151
116
$251,567
$240,923
$215,909
$197,302
$166,613
$235,657
$223,955
$196,409
$157,614
$135,513
$15,910
$16,968
$22,018
$39,892
$31,100
14.1
13.2
13.6
14.2
13.9
14.1
13.0
13.0
13.8
14.8
14.1
13.3
14.1
14.3
13.4
$3,535
$3,811
$3,921
$3,935
$3,754
$3,430
$3,750
$3,727
$3,822
$4,005
$3,645
$3,857
$4,058
$3,994
$3,613
18,602
9,105
10,388
12,157
11,314
9,528
3,835
4,084
4,082
4,347
9,073
5,270
6,304
8,075
6,966
$4,658,784
$2,625,073
$2,985,903
$3,379,764
$3,060,782
$2,317,688
$1,102,260
$1,170,570
$1,132,084
$1,177,228
$2,341,095
$1,522,814
$1,815,334
$2,247,680
$1,883,554
Sick Leave Paid: 2009 - 2013 by Designated Group
Long Term Care
Sick Leave Paid: 2009 - 2013
2014 Q4
Prepared by HEABC
E&OE
Page 22 of 29

AppendixOvertime in Long Term Care
OT Paid $ OT Hours OT Paid $ Per FTE OT Hours Per FTE
Year Affiliates HAs & PHC Industry Affiliates HAs & PHC Industry Affiliates HAs & PHC Industry Affiliates HAs & PHC Industry
2009
2010
2011
2012
2013 23.7
22.1
17.0
13.0
18.1
38.9
38.1
30.6
22.7
31.1
9.7
8.7
7.2
7.5
9.6
$1,128
$1,018
$752
$571
$794
$1,889
$1,778
$1,355
$994
$1,344
$428
$386
$314
$334
$436
161,451
156,008
126,597
105,077
140,101
126,924
122,366
95,694
66,169
94,946
34,527
33,642
30,903
38,907
45,154
$7,678,589
$7,197,697
$5,591,855
$4,625,335
$6,154,875
$6,162,438
$5,710,038
$4,240,300
$2,890,776
$4,105,015
$1,516,151
$1,487,658
$1,351,555
$1,734,559
$2,049,860
Facilities 2009
2010
2011
2012
2013
HealthSciences
2009
2010
2011
2012
2013
Nurses 2009
2010
2011
2012
2013
21.2
21.6
16.7
12.2
16.5
35.6
37.8
30.4
21.6
28.7
8.9
8.4
6.9
7.0
8.6
$882
$909
$668
$479
$636
$1,514
$1,612
$1,225
$845
$1,095
$344
$332
$268
$277
$337
108,642
134,011
108,200
85,951
111,067
84,090
105,495
82,203
54,235
76,161
24,552
28,516
25,997
31,715
34,906
$4,525,243
$5,630,196
$4,324,640
$3,368,723
$4,280,891
$3,574,023
$4,500,410
$3,311,088
$2,118,133
$2,910,150
$951,220
$1,129,786
$1,013,552
$1,250,589
$1,370,741
1.8
2.6
3.4
4.3
7.7
1.9
3.0
4.0
5.2
9.5
0.0
0.0
0.0
0.3
0.2
$105
$158
$192
$226
$370
$116
$179
$226
$274
$459
$0
$0
$0
$14
$10
166
234
264
309
524
166
234
264
305
521
0
0
0
4
3
$9,960
$14,176
$14,868
$16,111
$25,291
$9,960
$14,176
$14,868
$15,927
$25,151
$0
$0
$0
$183
$141
33.2
27.6
20.6
18.9
29.7
52.3
48.9
36.6
33.9
53.1
13.0
11.4
9.4
11.0
16.6
$1,984
$1,971
$1,420
$1,247
$1,927
$3,161
$3,513
$2,531
$2,203
$3,403
$735
$799
$649
$743
$1,103
52,642
21,762
18,134
18,817
28,509
42,667
16,637
13,227
11,629
18,264
9,975
5,125
4,907
7,188
10,245
$3,143,386
$1,553,325
$1,252,346
$1,240,502
$1,848,692
$2,578,455
$1,195,452
$914,343
$756,715
$1,169,714
$564,931
$357,873
$338,003
$483,786
$678,978
Overtime: 2009 - 2013 by Designated Group
Long Term Care
Overtime: 2009 - 2013
2014 Q4
Prepared by HEABC
E&OE
Page 23 of 29

AppendixSick Leave in Home Support Agency
Sick Leave Paid $ Sick Leave Days Sick Leave Paid $ Per Reg. FTE Sick Leave Days Per Reg. FTE
Year Affiliates HAs & PHC Industry Affiliates HAs & PHC Industry Affiliates HAs & PHC Industry Affiliates HAs & PHC Industry
2009
2010
2011
2012
2013 12.5
12.0
12.2
11.8
13.5
13.3
13.0
13.3
13.6
14.9
11.2
10.4
10.6
9.4
11.2
$2,344
$2,139
$2,159
$1,938
$2,178
$2,703
$2,513
$2,546
$2,314
$2,477
$1,759
$1,586
$1,619
$1,417
$1,701
43,692
40,631
38,601
28,280
39,097
28,818
26,373
24,493
18,903
26,519
14,878
14,259
14,108
9,377
12,578
$8,213,392
$7,273,833
$6,843,313
$4,628,508
$6,315,590
$5,871,340
$5,102,347
$4,696,657
$3,209,605
$4,413,459
$2,342,836
$2,171,486
$2,146,655
$1,418,903
$1,902,131
Community 2009
2010
2011
2012
2013
HealthSciences
2009
2010
2011
2012
2013
Nurses 2009
2010
2011
2012
2013
12.7
12.4
12.6
12.2
13.8
14.4
14.6
14.8
14.8
15.7
11.2
10.4
10.7
9.4
11.3
$1,952
$1,875
$1,904
$1,837
$2,083
$2,179
$2,199
$2,236
$2,226
$2,373
$1,736
$1,583
$1,617
$1,415
$1,699
32,232
32,056
30,877
25,338
35,684
17,753
17,852
16,815
15,989
23,143
14,480
14,204
14,062
9,349
12,541
$4,948,408
$4,851,180
$4,681,067
$3,818,689
$5,394,219
$2,695,024
$2,694,486
$2,546,643
$2,406,942
$3,502,224
$2,253,384
$2,156,693
$2,134,424
$1,411,747
$1,891,995
9.6
9.6
10.4
9.9
10.7
9.6
9.6
10.4
9.9
10.7
0.0
18.8
18.8
9.1
0.0
$2,515
$2,514
$2,740
$2,623
$2,796
$2,518
$2,510
$2,734
$2,627
$2,800
$0
$4,501
$4,388
$2,034
$0
3,229
2,916
2,786
1,386
1,340
3,229
2,905
2,769
1,377
1,340
0
11
17
9
0
$849,575
$765,418
$731,699
$366,353
$350,959
$849,575
$762,840
$727,730
$364,327
$350,959
$0
$2,577
$3,970
$2,026
$0
13.1
11.1
11.1
9.2
11.2
13.1
11.2
11.2
9.2
11.3
11.9
6.4
6.0
7.3
7.3
$3,831
$3,260
$3,217
$2,612
$3,076
$3,895
$3,280
$3,234
$2,621
$3,106
$2,679
$1,777
$1,690
$2,003
$2,000
8,231
5,659
4,938
1,556
2,073
7,836
5,615
4,909
1,538
2,036
398
44
29
19
37
$2,415,409
$1,657,236
$1,430,547
$443,467
$570,412
$2,326,741
$1,645,021
$1,422,285
$438,337
$560,276
$89,452
$12,216
$8,262
$5,130
$10,136
Sick Leave Paid: 2009 - 2013 by Designated Group
Home Support Agency
Sick Leave Paid: 2009 - 2013
2014 Q4
Prepared by HEABC
E&OE
Page 24 of 29
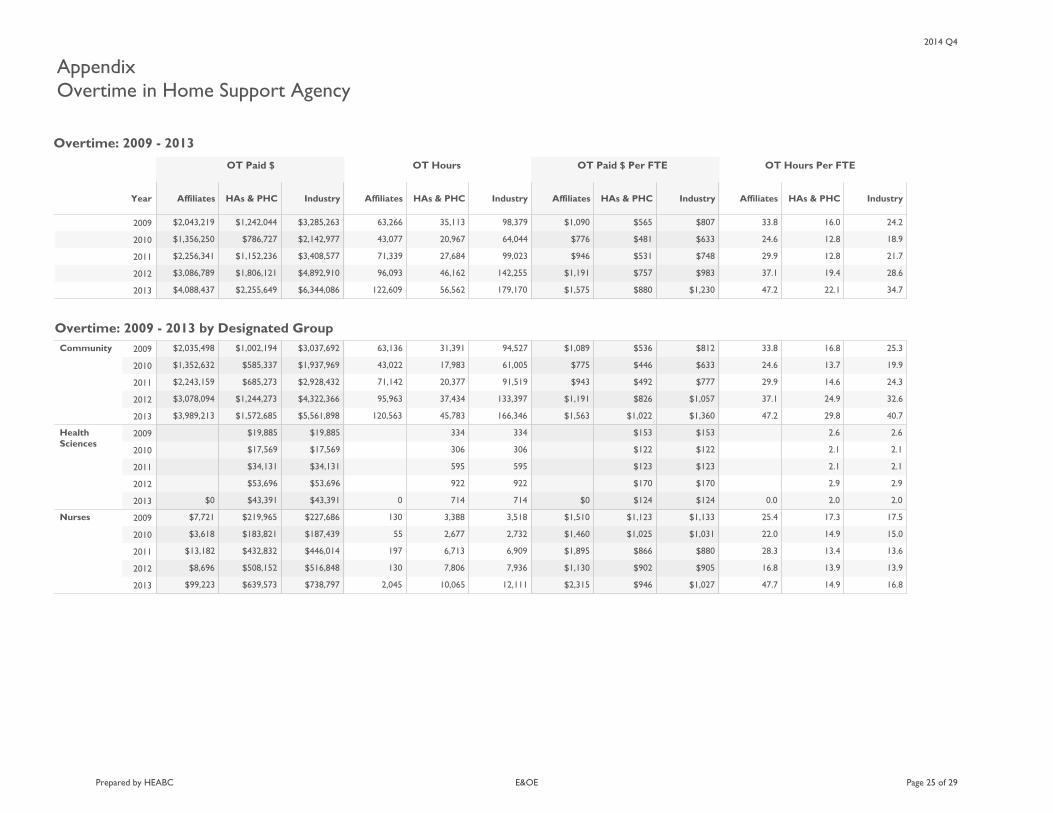
AppendixOvertime in Home Support Agency
OT Paid $ OT Hours OT Paid $ Per FTE OT Hours Per FTE
Year Affiliates HAs & PHC Industry Affiliates HAs & PHC Industry Affiliates HAs & PHC Industry Affiliates HAs & PHC Industry
2009
2010
2011
2012
2013 34.7
28.6
21.7
18.9
24.2
22.1
19.4
12.8
12.8
16.0
47.2
37.1
29.9
24.6
33.8
$1,230
$983
$748
$633
$807
$880
$757
$531
$481
$565
$1,575
$1,191
$946
$776
$1,090
179,170
142,255
99,023
64,044
98,379
56,562
46,162
27,684
20,967
35,113
122,609
96,093
71,339
43,077
63,266
$6,344,086
$4,892,910
$3,408,577
$2,142,977
$3,285,263
$2,255,649
$1,806,121
$1,152,236
$786,727
$1,242,044
$4,088,437
$3,086,789
$2,256,341
$1,356,250
$2,043,219
Community 2009
2010
2011
2012
2013
HealthSciences
2009
2010
2011
2012
2013
Nurses 2009
2010
2011
2012
2013
40.7
32.6
24.3
19.9
25.3
29.8
24.9
14.6
13.7
16.8
47.2
37.1
29.9
24.6
33.8
$1,360
$1,057
$777
$633
$812
$1,022
$826
$492
$446
$536
$1,563
$1,191
$943
$775
$1,089
166,346
133,397
91,519
61,005
94,527
45,783
37,434
20,377
17,983
31,391
120,563
95,963
71,142
43,022
63,136
$5,561,898
$4,322,366
$2,928,432
$1,937,969
$3,037,692
$1,572,685
$1,244,273
$685,273
$585,337
$1,002,194
$3,989,213
$3,078,094
$2,243,159
$1,352,632
$2,035,498
2.0
2.9
2.1
2.1
2.6
2.0
2.9
2.1
2.1
2.6
0.0$124
$170
$123
$122
$153
$124
$170
$123
$122
$153
$0714
922
595
306
334
714
922
595
306
334
0$43,391
$53,696
$34,131
$17,569
$19,885
$43,391
$53,696
$34,131
$17,569
$19,885
$0
16.8
13.9
13.6
15.0
17.5
14.9
13.9
13.4
14.9
17.3
47.7
16.8
28.3
22.0
25.4
$1,027
$905
$880
$1,031
$1,133
$946
$902
$866
$1,025
$1,123
$2,315
$1,130
$1,895
$1,460
$1,510
12,111
7,936
6,909
2,732
3,518
10,065
7,806
6,713
2,677
3,388
2,045
130
197
55
130
$738,797
$516,848
$446,014
$187,439
$227,686
$639,573
$508,152
$432,832
$183,821
$219,965
$99,223
$8,696
$13,182
$3,618
$7,721
Overtime: 2009 - 2013 by Designated Group
Home Support Agency
Overtime: 2009 - 2013
2014 Q4
Prepared by HEABC
E&OE
Page 25 of 29
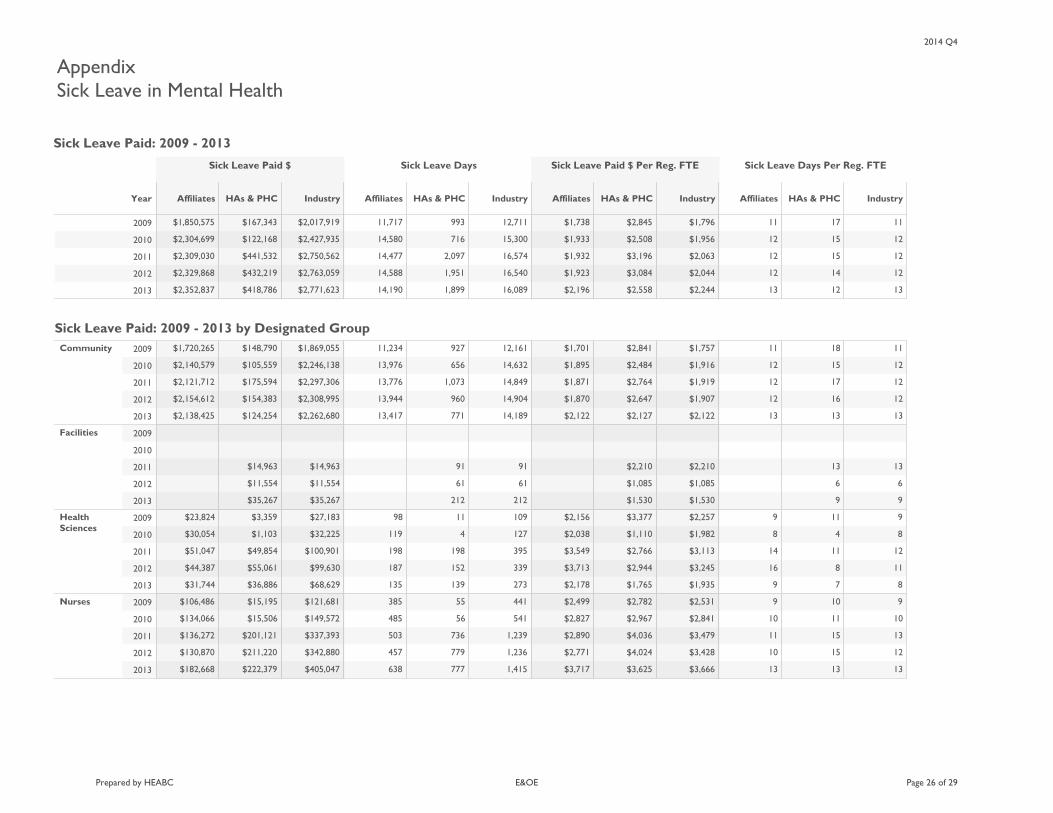
AppendixSick Leave in Mental Health
Sick Leave Paid $ Sick Leave Days Sick Leave Paid $ Per Reg. FTE Sick Leave Days Per Reg. FTE
Year Affiliates HAs & PHC Industry Affiliates HAs & PHC Industry Affiliates HAs & PHC Industry Affiliates HAs & PHC Industry
2009
2010
2011
2012
2013 13
12
12
12
11
12
14
15
15
17
13
12
12
12
11
$2,244
$2,044
$2,063
$1,956
$1,796
$2,558
$3,084
$3,196
$2,508
$2,845
$2,196
$1,923
$1,932
$1,933
$1,738
16,089
16,540
16,574
15,300
12,711
1,899
1,951
2,097
716
993
14,190
14,588
14,477
14,580
11,717
$2,771,623
$2,763,059
$2,750,562
$2,427,935
$2,017,919
$418,786
$432,219
$441,532
$122,168
$167,343
$2,352,837
$2,329,868
$2,309,030
$2,304,699
$1,850,575
Community 2009
2010
2011
2012
2013
Facilities 2009
2010
2011
2012
2013
HealthSciences
2009
2010
2011
2012
2013
Nurses 2009
2010
2011
2012
2013
13
12
12
12
11
13
16
17
15
18
13
12
12
12
11
$2,122
$1,907
$1,919
$1,916
$1,757
$2,127
$2,647
$2,764
$2,484
$2,841
$2,122
$1,870
$1,871
$1,895
$1,701
14,189
14,904
14,849
14,632
12,161
771
960
1,073
656
927
13,417
13,944
13,776
13,976
11,234
$2,262,680
$2,308,995
$2,297,306
$2,246,138
$1,869,055
$124,254
$154,383
$175,594
$105,559
$148,790
$2,138,425
$2,154,612
$2,121,712
$2,140,579
$1,720,265
9
6
13
9
6
13
$1,530
$1,085
$2,210
$1,530
$1,085
$2,210
212
61
91
212
61
91
$35,267
$11,554
$14,963
$35,267
$11,554
$14,963
8
11
12
8
9
7
8
11
4
11
9
16
14
8
9
$1,935
$3,245
$3,113
$1,982
$2,257
$1,765
$2,944
$2,766
$1,110
$3,377
$2,178
$3,713
$3,549
$2,038
$2,156
273
339
395
127
109
139
152
198
4
11
135
187
198
119
98
$68,629
$99,630
$100,901
$32,225
$27,183
$36,886
$55,061
$49,854
$1,103
$3,359
$31,744
$44,387
$51,047
$30,054
$23,824
13
12
13
10
9
13
15
15
11
10
13
10
11
10
9
$3,666
$3,428
$3,479
$2,841
$2,531
$3,625
$4,024
$4,036
$2,967
$2,782
$3,717
$2,771
$2,890
$2,827
$2,499
1,415
1,236
1,239
541
441
777
779
736
56
55
638
457
503
485
385
$405,047
$342,880
$337,393
$149,572
$121,681
$222,379
$211,220
$201,121
$15,506
$15,195
$182,668
$130,870
$136,272
$134,066
$106,486
Sick Leave Paid: 2009 - 2013 by Designated Group
Child Development Centre
Sick Leave Paid: 2009 - 2013
2014 Q4
Prepared by HEABC
E&OE
Page 26 of 29
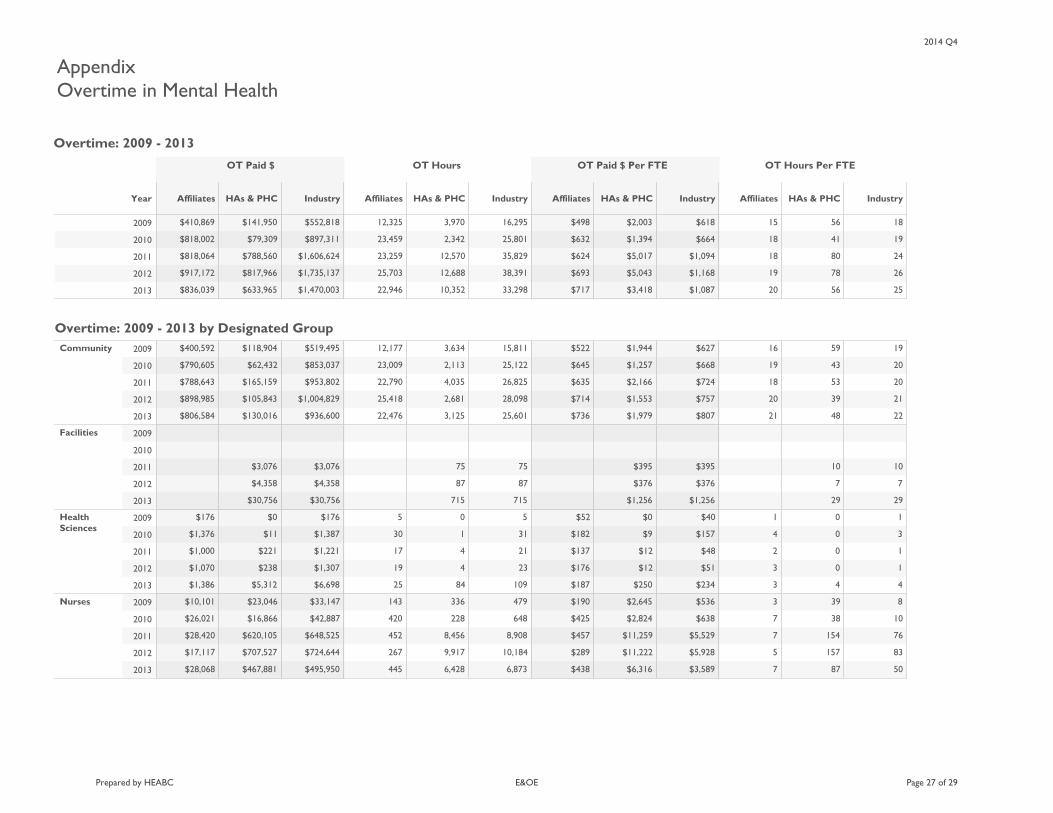
AppendixOvertime in Mental Health
OT Paid $ OT Hours OT Paid $ Per FTE OT Hours Per FTE
Year Affiliates HAs & PHC Industry Affiliates HAs & PHC Industry Affiliates HAs & PHC Industry Affiliates HAs & PHC Industry
2009
2010
2011
2012
2013 25
26
24
19
18
56
78
80
41
56
20
19
18
18
15
$1,087
$1,168
$1,094
$664
$618
$3,418
$5,043
$5,017
$1,394
$2,003
$717
$693
$624
$632
$498
33,298
38,391
35,829
25,801
16,295
10,352
12,688
12,570
2,342
3,970
22,946
25,703
23,259
23,459
12,325
$1,470,003
$1,735,137
$1,606,624
$897,311
$552,818
$633,965
$817,966
$788,560
$79,309
$141,950
$836,039
$917,172
$818,064
$818,002
$410,869
Community 2009
2010
2011
2012
2013
Facilities 2009
2010
2011
2012
2013
HealthSciences
2009
2010
2011
2012
2013
Nurses 2009
2010
2011
2012
2013
22
21
20
20
19
48
39
53
43
59
21
20
18
19
16
$807
$757
$724
$668
$627
$1,979
$1,553
$2,166
$1,257
$1,944
$736
$714
$635
$645
$522
25,601
28,098
26,825
25,122
15,811
3,125
2,681
4,035
2,113
3,634
22,476
25,418
22,790
23,009
12,177
$936,600
$1,004,829
$953,802
$853,037
$519,495
$130,016
$105,843
$165,159
$62,432
$118,904
$806,584
$898,985
$788,643
$790,605
$400,592
29
7
10
29
7
10
$1,256
$376
$395
$1,256
$376
$395
715
87
75
715
87
75
$30,756
$4,358
$3,076
$30,756
$4,358
$3,076
4
1
1
3
1
4
0
0
0
0
3
3
2
4
1
$234
$51
$48
$157
$40
$250
$12
$12
$9
$0
$187
$176
$137
$182
$52
109
23
21
31
5
84
4
4
1
0
25
19
17
30
5
$6,698
$1,307
$1,221
$1,387
$176
$5,312
$238
$221
$11
$0
$1,386
$1,070
$1,000
$1,376
$176
50
83
76
10
8
87
157
154
38
39
7
5
7
7
3
$3,589
$5,928
$5,529
$638
$536
$6,316
$11,222
$11,259
$2,824
$2,645
$438
$289
$457
$425
$190
6,873
10,184
8,908
648
479
6,428
9,917
8,456
228
336
445
267
452
420
143
$495,950
$724,644
$648,525
$42,887
$33,147
$467,881
$707,527
$620,105
$16,866
$23,046
$28,068
$17,117
$28,420
$26,021
$10,101
Overtime: 2009 - 2013 by Designated Group
Mental Health
Overtime: 2009 - 2013
2014 Q4
Prepared by HEABC
E&OE
Page 27 of 29
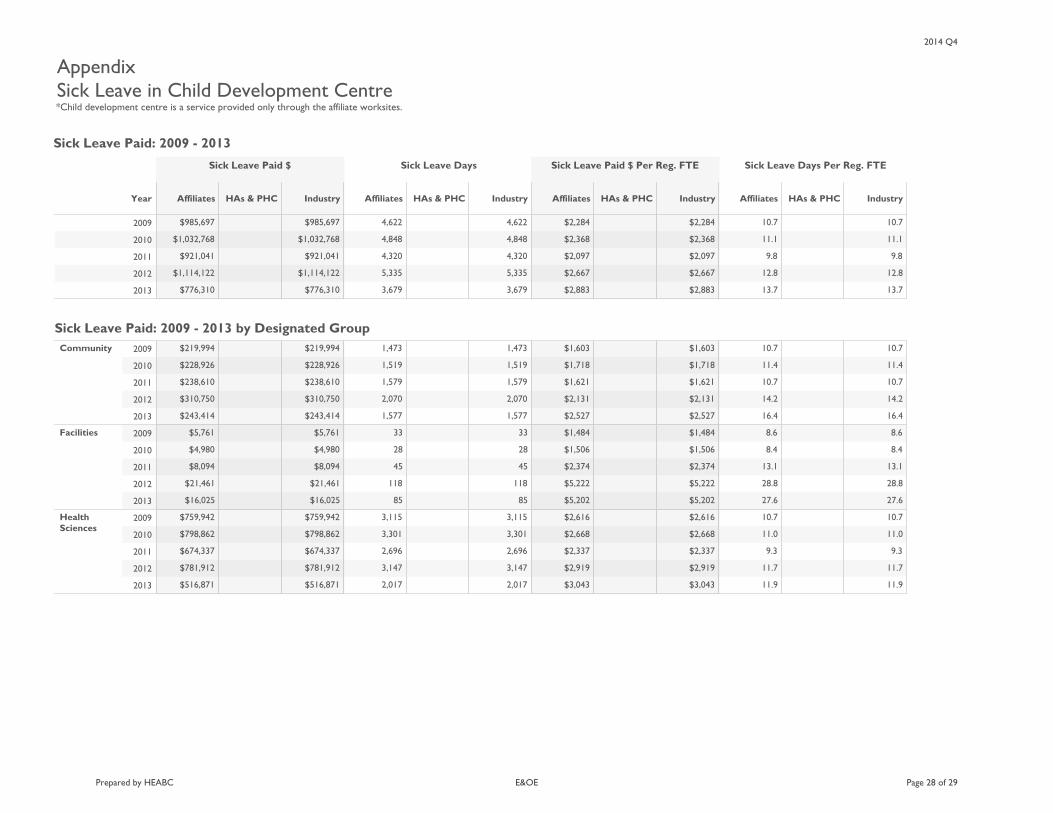
AppendixSick Leave in Child Development Centre
Sick Leave Paid $ Sick Leave Days Sick Leave Paid $ Per Reg. FTE Sick Leave Days Per Reg. FTE
Year Affiliates HAs & PHC Industry Affiliates HAs & PHC Industry Affiliates HAs & PHC Industry Affiliates HAs & PHC Industry
2009
2010
2011
2012
2013 13.7
12.8
9.8
11.1
10.7
13.7
12.8
9.8
11.1
10.7
$2,883
$2,667
$2,097
$2,368
$2,284
$2,883
$2,667
$2,097
$2,368
$2,284
3,679
5,335
4,320
4,848
4,622
3,679
5,335
4,320
4,848
4,622
$776,310
$1,114,122
$921,041
$1,032,768
$985,697
$776,310
$1,114,122
$921,041
$1,032,768
$985,697
Community 2009
2010
2011
2012
2013
Facilities 2009
2010
2011
2012
2013
HealthSciences
2009
2010
2011
2012
2013
16.4
14.2
10.7
11.4
10.7
16.4
14.2
10.7
11.4
10.7
$2,527
$2,131
$1,621
$1,718
$1,603
$2,527
$2,131
$1,621
$1,718
$1,603
1,577
2,070
1,579
1,519
1,473
1,577
2,070
1,579
1,519
1,473
$243,414
$310,750
$238,610
$228,926
$219,994
$243,414
$310,750
$238,610
$228,926
$219,994
27.6
28.8
13.1
8.4
8.6
27.6
28.8
13.1
8.4
8.6
$5,202
$5,222
$2,374
$1,506
$1,484
$5,202
$5,222
$2,374
$1,506
$1,484
85
118
45
28
33
85
118
45
28
33
$16,025
$21,461
$8,094
$4,980
$5,761
$16,025
$21,461
$8,094
$4,980
$5,761
11.9
11.7
9.3
11.0
10.7
11.9
11.7
9.3
11.0
10.7
$3,043
$2,919
$2,337
$2,668
$2,616
$3,043
$2,919
$2,337
$2,668
$2,616
2,017
3,147
2,696
3,301
3,115
2,017
3,147
2,696
3,301
3,115
$516,871
$781,912
$674,337
$798,862
$759,942
$516,871
$781,912
$674,337
$798,862
$759,942
Sick Leave Paid: 2009 - 2013 by Designated Group
Child Development Centre
Sick Leave Paid: 2009 - 2013
*Child development centre is a service provided only through the affiliate worksites.
2014 Q4
Prepared by HEABC
E&OE
Page 28 of 29

AppendixOvertime in Child Development Centre
OT Paid $ OT Hours OT Paid $ Per FTE OT Hours Per FTE
Year Affiliates HAs & PHC Industry Affiliates HAs & PHC Industry Affiliates HAs & PHC Industry Affiliates HAs & PHC Industry
2009
2010
2011
2012
2013 0.8
2.0
1.0
0.6
0.5
0.8
2.0
1.0
0.6
0.5
$48
$85
$35
$20
$17
$48
$85
$35
$20
$17
142
661
341
199
176
142
661
341
199
176
$8,134
$27,476
$11,969
$7,130
$5,689
$8,134
$27,476
$11,969
$7,130
$5,689
Community 2009
2010
2011
2012
2013
Facilities 2009
2010
2011
2012
2013
HealthSciences
2009
2010
2011
2012
2013
0.0
2.7
2.3
1.3
1.5
0.0
2.7
2.3
1.3
1.5
$0
$80
$74
$39
$48
$0
$80
$74
$39
$48
0
358
300
154
176
0
358
300
154
176
$0
$10,637
$9,859
$4,647
$5,689
$0
$10,637
$9,859
$4,647
$5,689
0.0
0.0
0.0
0.0
0.0
0.0
0.0
0.0
0.0
0.0
$0
$0
$0
$0
$0
$0
$0
$0
$0
$0
0
0
0
0
0
0
0
0
0
0
$0
$0
$0
$0
$0
$0
$0
$0
$0
$0
1.5
1.6
0.2
0.2
0.0
1.5
1.6
0.2
0.2
0.0
$88
$91
$10
$11
$0
$88
$91
$10
$11
$0
142
303
41
45
0
142
303
41
45
0
$8,134
$16,840
$2,110
$2,483
$0
$8,134
$16,840
$2,110
$2,483
$0
Overtime: 2009 - 2013 by Designated Group
Child Development Centre
Overtime: 2009 - 2013
*Child development centre is a service provided only through the affiliate worksites.
2014 Q4
Prepared by HEABC
E&OE
Page 29 of 29

200 - 1333 West Broadway Vancouver, BC V6H 4C6 T 604.736.5909 F 604.736.2715 www.heabc.bc.ca