sig to noise rms validation
TRANSCRIPT

5/13/2018 Sig to Noise Rms Validation - slidepdf.com
http://slidepdf.com/reader/full/sig-to-noise-rms-validation 1/13
921 (2001) 121–133Journal of Chromatography A,
www.elsevier.com/locate/chroma
Initial evaluation of quantitative performance of chromatographic
methods using replicates at multiple concentrationsa,b a,b ,*´Marcela Alejandra Castillo , Reynaldo Cesar Castells
a´ ´ ´ Division de Quımica Analıtica, Facultad de Ciencias Exactas, Universidad Nacional de La Plata, 47 esq. 115,
1900 La Plata, ArgentinabCIDEPINT , 52 e / 121 y 122, 1900 La Plata, Argentina
Received 12 December 2000; received in revised form 23 February 2001; accepted 12 April 2001
Abstract
The introduction of a novel analytical method must be supported by consistent information about its quantitative
potentialities; this is critical for whoever considers its utilization for an specific application. Unfortunately, literature abounds
in papers proposing excellent chromatographic methods of analysis that have been subjected to comparatively poor
quantitative evaluation. The methodology proposed in the present work makes use of some of the performance characteristics
whose measurement is recommended in validation protocols; pertinent to this stage of method development are the detection
and quantitation limits, the linear range and the repeatability. All this information can be calculated from the results of a
calibration with several replicates at each analyte level. Replicates enable the calculation of reproducibility at several analyte
levels and the estimation of the linear range; more important, replicates are necessary to detect changes in peak area standarddeviation with analyte amount. Regression of calibration data by means of unweighted least-squares (ULSR) can only be
performed in those cases in which homoscedasticity has been previously verified; heteroscedastic calibration data demand
regression by means of weighted least-squares (WLSR), since ULSR results in gross overestimation of prediction limits at
low analyte concentration. The proposal is used for the preliminary quantitative evaluation of a method for the determination
of nine biogenic amines by means of pre-column derivatization with dabsyl chloride and separation of derivatives by RPLC.
Limits of detection are calculated by a regression approach and by the classical signal-to-noise ratio method ( S / N approach).
No significant difference was detected for the amines limits of detection estimated by WLSR and by the S / N approach;
ULSR estimated limits of detection are between 7 and 78 times larger than those obtained by the other two methods, as a
consequence of the heteroscedasticity of calibration data. © 2001 Elsevier Science B.V. All rights reserved.
Keywords: Performance characteristics; Repeatability; Linearity; Limit of detection; Limit of quantitation; Biogenic amines
1. Introduction the determination of one or several analytes in a
given type of sample; in other circumstances the
The development of a novel analytical method objective is a method that after suitable adaptations
may be undertaken to solve a specific problem, as might be used in the analysis of different materials.
In any case the development work is hardly initiated
by working on real samples; measurements during*Corresponding author. Fax: 154-221-427-1537.
the initial stages are usually performed on solutions E -mail address: [email protected] (R.C. Cas-
tells). of well characterized substances, on analyte stan-
0021-9673/01/$ – see front matter©
2001 Elsevier Science B.V. All rights reserved.P I I : S0021-9673(01)00867-6

5/13/2018 Sig to Noise Rms Validation - slidepdf.com
http://slidepdf.com/reader/full/sig-to-noise-rms-validation 2/13
921 (2001) 121–133122 M . A. Castillo, R.C . Castells / J . Chromatogr . A
dards if available. In chromatographic analysis, for and beverages is under study in our laboratory; it
instance, conditions (column packing and dimen- consists in derivatizing the amines with dabsyl
sions, mobile phase, isocratic or gradient operation, chloride (4-dimethylaminoazobenzene-49-sulfonyl
etc.) to separate in a reasonable time all the analytes chloride), separation of derivatives by RPLC and
among themselves and from other substances whose detection by means of UV spectrophotometry. De-presence can be expected in real samples is usually rivatization and separation, as well as some initial
the first aspect to be defined; although there are well tests on meat samples, are treated in a separate
known strategies and even commercial software to paper; experimental procedures and calculations
attain this objective [1,2], considerable experimental pertinent to the preliminary evaluation of the quan-
work must usually be invested to optimize the titative performance of the method [7] are the subject
separation. When analytes are not detectable by of the present paper.
available means or when a more selective detection
is desirable for complex samples, a derivatization
stage is often included [3,4]; conditions maximizing 2. Performance characteristics to be evaluated
the yield of the derivatization process must then be and overview of measurement methods
studied. This study necessarily precedes the optimi-zation of derivatives separation, although some de- Not all the performance characteristics measured
gree of superposition is usually unavoidable. in validation protocols are pertinent at the present
Once derivatization and separation conditions have preliminary evaluation study. Those considered as
been defined the method is subjected to a preliminary indispensable in this work are treated subsequently.
quantitative evaluation with a twofold objective.
First, to check that the method fits to analyte levels 2.1. Precision
predictable for the type of materials motivating the
study, bearing in mind that the performance observed Repeatability is the only relevant precision criter-
in the work with standards very probably constitutes ion at this preliminary evaluation; it expresses the
the most that can be expected from it. In the second closeness of agreement between a series of indepen-
place because the information gathered at this stage dent measurements performed by a single analyst on
is important to detect matrix effects at the time of a given equipment over a short interval of time, andwhole method validation. It is debatable whether a represents the first or most basic level of precision
quantitative evaluation, performed at this stage of the evaluation [6,8]. Other precision criteria, as repro-
development, can be included within definitions of ducibility (precision between laboratories) and inter -
validation. Massart et al. ([5], Chapter 13) although mediate precision (different analysts and equipment,
not rejecting the possibility of validating only the over extended time scale, within a given laboratory),
actual determination, state that the first golden rule in are reserved for whole validation protocols.
validation is ‘‘validate the whole method’’; this Since precision is often concentration dependent,
includes pre-measurement operations, matrices and repeatability should be measured at several analyte
range of analyte concentration. EURACHEM [6] levels; ICH [9] suggests a minimum of nine in-
stresses that the limits between method development dependent measurements covering the procedure
and validation are diffuse and that many method range. Results are reported as standard deviation, asperformance parameters associated with validation relative standard deviation (RSD) or as percentage
are often evaluated, at least roughly, as part of standard deviation (%RSD). Derivatization implies
method development. To avoid confusions, the term pre-chromatographic manipulations that unavoidably
validation shall not be employed in this paper; this is result in precision losses; some estimations [1] raise
not an obstacle for using validation performance %RSD from below 1–2% for methods involving
criteria and for following (with some restrictions) only elemental pre-chromatographic operations (sam-
validation measurement guidelines. ple weighing and dissolving) to 5–10% for methods
A method for the determination of the nine including derivatization steps, and even higher at
biogenic amines more frequently occurring in foods trace levels.

5/13/2018 Sig to Noise Rms Validation - slidepdf.com
http://slidepdf.com/reader/full/sig-to-noise-rms-validation 3/13
921 (2001) 121–133 123 M . A. Castillo, R.C . Castells / J . Chromatogr . A
2.2. Linearity and linear range absent and risk b of not detecting analyte when it is
present; illustrations on the relationships between
Linearity is the ability of a method to elicit these parameters can be consulted in [5], Chapter 13.
responses that are proportional to analyte amount; Assuming that measurements distribute normally,
the linearity of the calibration line (graphical repre- that s at L is equal to s and defining a 5b 5D bl
sentation of peak areas as a function of measurement 0.05, method response at the detection limit, Y ,D
standard [6] amount) needs to be checked. The linear shall be given by [13,14]:
range is the interval of analyte amount over whichY 5m 1 3.29 s 5m 1 b LD bl bl bl 1 Dthe method behaves linearly. The quantitation limit
defines the lower end of the linear range; the upper ∴ L 5 3.29 (s / b ) (1)D bl 1
end is usually imposed by instrumental factors, aswhere b is the slope of the calibration line. On thewavelength bandwidth and stray radiation in UV 1
same lines, method response at the quantitation limit,detection [10]. Derivatization can considerably shor-Y , is given by:ten the linear range at its upper end, for instance Q
when analytes or their derivatives enter into non-Y 5m 1 k s 5m 1 b LQ bl Q bl bl 1 Q
linear regions of distribution processes (extraction,adsorption) or when excess reagent concentration is ∴ L 5 k (s / b ) (2)Q Q bl 1
limited by its solubility in the reaction medium. TheIUPAC [13] proposes a default value k 510, thuslinear range is estimated from the regression analysis Q
making s /(Y 2m )5 1/ k 5 0.10 for the RSD atof the calibration plot. Correlation coefficient is bl Q bl Q
the L . If the variance of the response changes withmisleading in testing linearity [11]; visual inspection Q
analyte amount, Eqs. (1) and (2) are substituted by:of calibration line and residuals can be illustrative,
but more objective tests are available, as the F -testY 5m 1 1.65 (s 1s )5m 1 b LD bl bl LD bl 1 Dfor lack-of-fit or the test of significance of the
quadratic regression coefficient obtained on fitting ∴ L 5 1.65 (s 1s ) / b (3)D bl LD 1
calibration data to a second degree polynomial ([5],
Chapters 8 and 13). An iterative procedure making
Y 5m 1 k s 5m 1 b LQ bl Q LQ bl 1 Quse of prediction limits was recently proposed [12].∴ L 5 k (s / b ) (4)Q Q LQ 1Linearity is not imperative, but it is highly desirable;
therefore, if non-linearity is detected by means of
any of these tests, the working range is usually The standard deviation of blanks cannot be mea-
reduced at the upper end and the test is repeated sured in chromatography; alternative methods must
through the remaining points. be applied and ICH recommendations [9] include
two of them:2.3. Lowest limits of the method (a) Based on signal-to-noise ratio: base line peak-
to-peak noise, h , is measured on the chromatogramN
The detection limit , L , is the lowest amount of of a sample blank processed by the analytical methodD
analyte in a sample that can be detected with a for a specified interval of time before and after the
specified degree of certainty, but not necessarily analyte retention time, and compared to analyte peak quantified. The quantitation limit , L , is the lowest heights, h( X ), measured under the same conditionsQ
amount of analyte in a sample that can be quantita- from samples containing known low analyte
tively determined with an acceptable level of preci- amounts, X . L and L are then obtained as L5 k hD Q N
sion and accuracy. X / h( X ), where k 52 or 3 for L and k 510 for L .D Q
IUPAC rigorous definition of L [13,14] is based This is the most popular method, and has been in useD
on the statistical theory of hypothesis testing. L from the early years of chromatographic analysis; itD
depends on blank signal (m ), on response disper- stems from analysts’ experience and common sensebl
sion at the blank level (s ) and on the definition of and lacks any formal relationship to statisticalbl
two risks: risk a of detecting analyte when it is theory.

5/13/2018 Sig to Noise Rms Validation - slidepdf.com
http://slidepdf.com/reader/full/sig-to-noise-rms-validation 4/13
921 (2001) 121–133124 M . A. Castillo, R.C . Castells / J . Chromatogr . A
(b) Based on the calibration curve: either the
residual standard deviation of a regression line, s , ore
the standard deviation of its intercept, s (b ), are0
used as estimators of s in Eq. (1) or Eq. (2). Millerbl
and Miller [15] made a similar proposal in 1988;their suggestion, however, was the use of the inter-
cept, b , and s as estimators of m and s ,0 e bl bl
respectively. When the precision of the measure-
ments is independent of concentration (homoscedas-
ticity) and the model is correct (no lack-of-fit
detected), s is an estimate of the standard deviatione
of the measurements ([5], Chapter 8). On the other
hand s (b ) can differ significantly from s , and its0 e
value depends on the distribution of concentration
values within the calibration range. When the preci-
sion of the measurements changes with analyteconcentration (heteroscedasticity) regression must be
performed by means of weighted least squares
regression (WLSR), specially when we are interested
in the low concentration region; the residual standard
deviation calculated with this statistical tool, s , is aew
weighted average for the calibration range of the
standard deviation of the measurements, and cannot Fig. 1. Sketch of a linear calibration line (—) with its upper and
lower prediction limits (— ? ? —). L is the critical level and L isbe used as an estimate of s . Neglect of these basic C Dblthe detection limit.statistical principles led recently [16] to suggest as a
global proposal the use of s within ICH method toew
estimate L ; neither ICH nor Miller and Miller Relations (5) and (7) are used in a recent IUPACD
mention WLSR in connection with detection limits. document [13] to define the critical level, L , and theC
ˆSeveral years ago Hubaux and Vos [17] demon- detection limit, L . Y was called decision limit byD C
strated that IUPAC prescriptions about detection Currie [18], since it represents the signal above
limit can be implemented by means of a calibration which the presence of analyte can be reliably de-ˆplot. Besides the calibration line, their approach cided. Y is the signal predicted by the regressionC
makes use of the prediction limits, i.e. the lines that equation for X 5 L ; however, 50% of the signalsC
ˆdefine the region where as yet not measured signals measured at L shall fall below Y . In other words,C C
shall fall with a probability of (1-a -b ): 100a % of measuring at L the probability of a false positive isC
the points are predicted to fall above the higher limit low but the chances of a false negative are high; it is
and 100b % of the points below the lower limit. A not an adequate criteria to express the lowest limits
calibration graph is sketched in Fig. 1; two important of a method, but it is essential to define L TheD.
points can be located on it by means of the following regression approach has been recommended byrelations, in which the abbreviation Pr is used for AOAC [19], by IUPAC [20] and by the German
probability: Normative Institute [21].
Hubaux and Vos made use of unweighted leastˆ squares regression, ULSR, in their presentation of Pr [(Y . Y ) when X 5 0]5a (5)C
the regression approach. A basic hypothesis of
ULSR is that the variance of the error distribution of ˆ Pr [(Y # Y ) when X 5 L ]5 0.5 (6)C C signals about their expectation remains constant [22];
in terms of calibration, this requirement means thatˆ the signal variance must be independent of analytePr [(Y # Y ) when X 5 L ]5b (7)C D

5/13/2018 Sig to Noise Rms Validation - slidepdf.com
http://slidepdf.com/reader/full/sig-to-noise-rms-validation 5/13
921 (2001) 121–133 125 M . A. Castillo, R.C . Castells / J . Chromatogr . A
amount. Numerous cases of heteroscedastic calibra- approach is that measurements must be distributed
tion data reported by analysts working with different over the (presumed) whole method range, since
instrumental techniques have been cited by Op- linear range is one important criteria to be estimated
penheimer et al. [23] and by Zorn et al. [24]. Garden while distributing the measurements in the low
et al. [25] were categorical with respect to this concentration region is advisable in estimation of LD
subject: ‘‘It is reasonable to expect that much or L . As mentioned, present objectives are differentQ
analytical data will not show constant variance nor from those prevailing in validation and is taken for
would we expect the variance to be a simple function granted that the whole procedure is going to be
of concentration’’. When ULSR is performed on validated on real samples.
heteroscedastic data effects of the larger signal
variability at high analyte levels are specially de-
leterious at low analyte levels; prediction bands are
artificially widened at this region and lower limits 3. Experimental
calculated from them do not reflect the assay capa-
bilities. Dabsyl chloride and amine hydrochlorides were
Two main options are available to deal with purchased from Aldrich (St. Louis, MO, USA).heteroscedastic data. One is data transformation, for HPLC-grade acetonitrile, methanol, acetone and
instance changing to a log Y versus log X relation- benzene were from E.M. Science (Gibbstown, USA).
ship; variance variability can be drastically reduced, Sodium hydrogen carbonate, hydrochloric acid and´but data linearity may be seriously affected. The sodium hydroxide were from Merck Quımica Argen-
second option is WLSR, that differs from ULSR in tina (Buenos Aires). Distilled water was purified in a
that a statistical weight w is assigned to responses Milli-Q System (Millipore Co., Bedford, MA, USA).i2
Y ; usually the inverse variance (1/ s ) at each level Nylon filtration membranes were from Micron Sepa-i i
is used as weight. This signifies that WLSR demands rations (Westborough, MA, USA).
a larger number of replicates than ULSR; estimates Amines name, abbreviation and purity are given in
about the minimum number of replicates by different Table 1. Two series of standard solutions, series S1
authors range from six to twenty. This level of (Phe, Ca, Tyr and Spd) and series S2 (Try, Pu, Hist,
replicate is frequently difficult to attain in practice Ser and Sp), with seven concentrations each werebecause of different motives, as costs or availability prepared in 0.1 M hydrochloric acid. Two stock
of calibration standards and reagents, or time de- solutions were prepared by dissolving carefully
manded by previous operations or by the chromato- weighed solid standards of each series in 0.1 M HCl;
graphic run. References to the determination of L the remaining standards in each series were preparedD
by means of WLSR are scarce [23,24,26]. by diluting both stocks by careful weighing of
In order to estimate the quantitation limit, signal solutions. Highest and lowest concentrations are
standard deviation is measured at different analyte listed in Table 1.
levels, signal RSD values are calculated at each level Details on derivatization and separation proce-
and L is defined as the analyte amount for which dures shall be shortly reported in a separate paper.Q
RSD reaches a pre-established value, for instance For the present purposes it is sufficient to mention
RSD50.10. This procedure has been recommended that 50 ml of each standard solution were mixed withby EURACHEM [6], and can be used both with 450 ml of buffer (sodium carbonates 0.15 M , pH 9.5)
homo- and heteroscedastic data. It can be im- and 500 ml of reagent (6 m M dabsyl chloride in
plemented graphically, for instance by plotting RSD acetonitrile) and heated at 708C for 30 min. Two ml
against X . of benzene were added after cooling in an ice bath,
All the performance characteristics that were followed by sonication and centrifugation until two
considered in the present paper as pertinent to fulfil a homogeneous phases were obtained; 1.8 ml of the
preliminary quantitative evaluation can be calculated organic extract were separated and dried at room
from data measured in a calibration with several temperature under nitrogen current. The residue was
replicates at each concentration. A drawback of this dissolved in 0.9 ml of acetone and filtered through
5/13/2018 Sig to Noise Rms Validation - slidepdf.com
http://slidepdf.com/reader/full/sig-to-noise-rms-validation 6/13
921 (2001) 121–133126 M . A. Castillo, R.C . Castells / J . Chromatogr . A
Table 1
Biogenic amines abbreviations, purities and concentration ranges
aAmine Abbreviation Purity Concentration (nmol/ml)
(% w/ w)Lowest Highest
Tryptamine Try 99 15.47 4866
Phenethylamine Phe 99 17.29 5238
Putrescine Pu 99 16.79 5281
Cadaverine Ca 99 17.13 5188
Histamine Hist 98 10.34 3251
Serotonine Ser 99 10.34 3251
Tyramine Tyr 98 10.63 3220
Spermidine Spd 99 10.64 3224
Spermine Sp 98 10.33 3248
aAs given by the supplier.
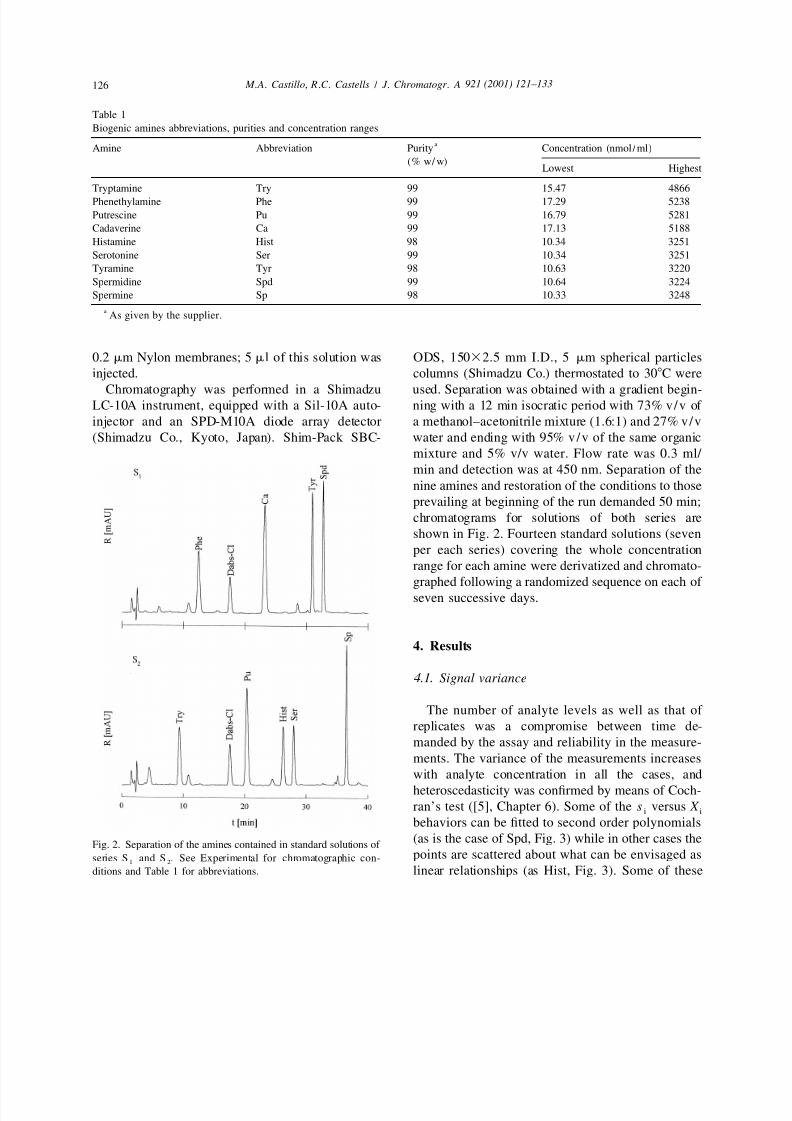
0.2 mm Nylon membranes; 5 ml of this solution was ODS, 15032.5 mm I.D., 5 mm spherical particlesinjected. columns (Shimadzu Co.) thermostated to 308C were
Chromatography was performed in a Shimadzu used. Separation was obtained with a gradient begin-
LC-10A instrument, equipped with a Sil-10A auto- ning with a 12 min isocratic period with 73% v/v of
injector and an SPD-M10A diode array detector a methanol–acetonitrile mixture (1.6:1) and 27% v/v
(Shimadzu Co., Kyoto, Japan). Shim-Pack SBC- water and ending with 95% v/v of the same organic
mixture and 5% v/v water. Flow rate was 0.3 ml/
min and detection was at 450 nm. Separation of the
nine amines and restoration of the conditions to those
prevailing at beginning of the run demanded 50 min;
chromatograms for solutions of both series are
shown in Fig. 2. Fourteen standard solutions (seven
per each series) covering the whole concentrationrange for each amine were derivatized and chromato-
graphed following a randomized sequence on each of
seven successive days.
4. Results
4.1. Signal variance
The number of analyte levels as well as that of
replicates was a compromise between time de-manded by the assay and reliability in the measure-
ments. The variance of the measurements increases
with analyte concentration in all the cases, and
heteroscedasticity was confirmed by means of Coch-
ran’s test ([5], Chapter 6). Some of the s versus X i i
behaviors can be fitted to second order polynomials
(as is the case of Spd, Fig. 3) while in other cases theFig. 2. Separation of the amines contained in standard solutions of
points are scattered about what can be envisaged asseries S and S . See Experimental for chromatographic con-1 2
ditions and Table 1 for abbreviations. linear relationships (as Hist, Fig. 3). Some of these

5/13/2018 Sig to Noise Rms Validation - slidepdf.com
http://slidepdf.com/reader/full/sig-to-noise-rms-validation 7/13
921 (2001) 121–133 127 M . A. Castillo, R.C . Castells / J . Chromatogr . A
Fig. 3. Peak area standard deviation s as a function of injected analyte amount X . Full lines correspond to attempts of fitting s to X i i i i
through all the experimental range. Dotted lines correspond to fitting s to Eq. (11).i
functions, however, displayed inappropriate be- 4.2. Regression analysis
haviors below the lowest experimental analyte level
(as a minimum, or extrapolation to negative values at Peak areas (Y ) were fitted to a model of first orderi
X 50). Since as a general rule no anomalous points in the injected analyte amount ( X /pmol, as calcu-i
and a regular increase of s with X was observed, lated from derivatization procedure) both by meansi i
statistical weights necessary to perform WLSR of ULSR and of WLSR. Basic equations for WLSR
through the whole range were calculated from raw are summarized in Table 2. Normalized weights
standard deviations; this was considered as a more were adopted [Eq. (T.2)], with ow 5 N , the totali
realistic attitude than smoothing standard deviation number of independent measurements. ULSR equa-
results by fitting to arbitrary functions. However, at tions are obtained from those in Table 2 by makingthe low concentration region (corresponding to X s 5s (i.e. w 51) for all i.i i i
between about 2.5 and 150 pmol) s and X are Initial regressions were performed on the completei i
linearly related, with correlation coefficient that in all data set, covering the whole concentration range, and
cases is higher than 0.997; these equations are the F -test at a 0.05 significance level was then used
subsequently used to estimate L and L . As shown to check the fit of experimental data to the linearD Q
in Fig. 4, the prediction limits calculated by means of model. Peak areas measured at the highest analyte
these linear equations are coincident in the low level were removed in those cases where lack-of-fit
concentration region with those obtained from the was detected and a regression through the remaining
fitting of s to X for the whole concentration range. points was performed, followed by a new applicationi i

5/13/2018 Sig to Noise Rms Validation - slidepdf.com
http://slidepdf.com/reader/full/sig-to-noise-rms-validation 8/13
921 (2001) 121–133128 M . A. Castillo, R.C . Castells / J . Chromatogr . A
Fig. 4. Weighted and unweighted least-squares regression analysis for Spd. Includes the calibration line (—); prediction limits (– – –), wi
calculated by fitting s to X by means of a second degree polynomial (see Fig. 3); prediction limits at the low concentration regioni i
(? ? ? ? ? ? ? ? ), w estimated by means of Eq. (11). Circles: Points within the linear range. Triangles: Points outside the linear range.i
Table 2
Summary of equations for WLSR calculations
2 2ˆ Y 5 b 1 b X (T.1) w 5 N (1 / s ) / O(1 / s ) (T.2)iw 0w 1w i i i i
¯ ¯ X 5Ow X / Ow (T.3) Y 5Ow Y / Ow (T.4)w i i i w i i i
2¯ S 5Ow ( X 2 X ) (T.5)xxw i i w
¯ ¯ ¯ b 5Ow Y ( X 2 X ) / S (T.6) b 5Y 2 b X (T.7)1w i i i w xxw 0w w 1w w
2 2 2 2 2s (b )5 s / S (T.8) s (b )5 s Ow X / S Ow (T.9)
1w ew xxw 0w ew i i xxw i
2 2ˆ s 5Ow (Y 2Y ) /( N 2 2) (T.10)ew i i i
1 / 22ˆ ¯ Y 5Y 6t s 1/ w 1 1/ Ow 1 ( X 2 X ) / S (T.11)f gi iw ( 12a,f ) ew i i i w xxw
For ULSR, make w 51 for all i; X : Analyte amount (pmol); Y : Peak area (mAU3s); N : Total number of calibration points; s : Peak areai i i i
ˆstandard deviation at the i-level; w : Normalized statistical weight; Y : Predicted peak area at the i-level; b , b : Weighted intercept andi iw 0w 1w
¯ ¯slopes estimates; X , Y : Weighted mean X and Y ; s : Weighted residual standard deviation.w w ew
5/13/2018 Sig to Noise Rms Validation - slidepdf.com
http://slidepdf.com/reader/full/sig-to-noise-rms-validation 9/13
921 (2001) 121–133 129 M . A. Castillo, R.C . Castells / J . Chromatogr . A
of the F -test. The iterative process was continued listed in columns A and B of Table 4. Instrumental
until no lack-of-fit was detected and the highest level repeatability, calculated from five chromatograms of
remaining at that step was considered as the upper the same derivatized aliquot, is listed under column
limit of the linear range. Application of this criterion C.
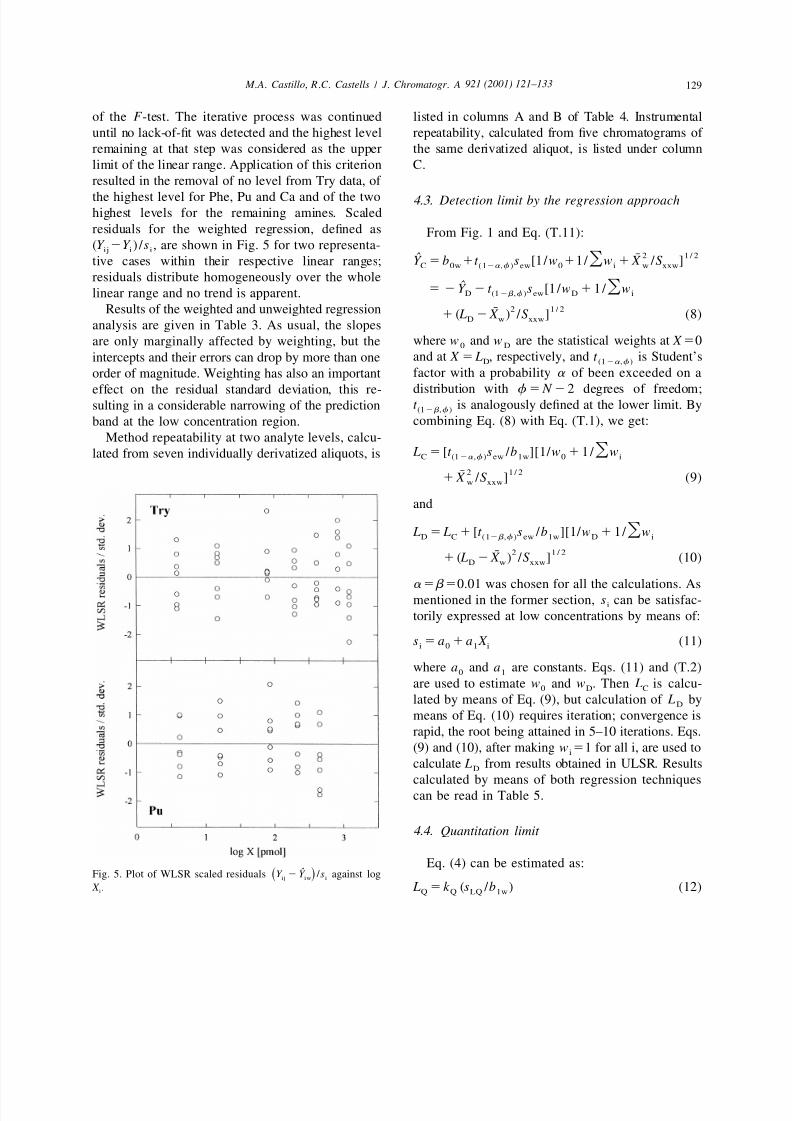
resulted in the removal of no level from Try data, of the highest level for Phe, Pu and Ca and of the two 4.3. Detection limit by the regression approachhighest levels for the remaining amines. Scaled
residuals for the weighted regression, defined as From Fig. 1 and Eq. (T.11):ˆ(Y 2Y ) / s , are shown in Fig. 5 for two representa-ij i i
2 1 / 2ˆ ¯ Y 5 b 1t s [1/ w 11/ Ow 1 X / S ]tive cases within their respective linear ranges; C 0w ( 12a,f ) ew 0 i w xxw
residuals distribute homogeneously over the wholeˆ 5 2Y 2 t s [1/ w 1 1/ OwD (12b ,f ) ew D ilinear range and no trend is apparent.
2 1 / 2Results of the weighted and unweighted regression ¯ 1 ( L 2 X ) / S ] (8)D w xxwanalysis are given in Table 3. As usual, the slopes
where w and w are the statistical weights at X 50are only marginally affected by weighting, but the 0 D
and at X 5 L , respectively, and t is Student’sintercepts and their errors can drop by more than one D (12a,f )
factor with a probability a of been exceeded on aorder of magnitude. Weighting has also an importantdistribution with f 5 N 2 2 degrees of freedom;effect on the residual standard deviation, this re-t is analogously defined at the lower limit. Bysulting in a considerable narrowing of the prediction (12b ,f )
combining Eq. (8) with Eq. (T.1), we get:band at the low concentration region.
Method repeatability at two analyte levels, calcu- L 5 [t s / b ][1/ w 1 1/ Owlated from seven individually derivatized aliquots, is C (12a,f ) ew 1w 0 i
2 1 / 2¯ 1 X / S ] (9)w xxw
and
L 5 L 1 [t s / b ][1/ w 1 1/ OwD C (12b ,f ) ew 1w D i
2 1 / 2¯ 1 ( L 2 X ) / S ] (10)D w xxw
a 5b 50.01 was chosen for all the calculations. As
mentioned in the former section, s can be satisfac-i
torily expressed at low concentrations by means of:
s 5 a 1 a X (11)i 0 1 i
where a and a are constants. Eqs. (11) and (T.2)0 1
are used to estimate w and w . Then L is calcu-0 D C
lated by means of Eq. (9), but calculation of L byD
means of Eq. (10) requires iteration; convergence is
rapid, the root being attained in 5–10 iterations. Eqs.(9) and (10), after making w 51 for all i, are used toi
calculate L from results obtained in ULSR. ResultsD
calculated by means of both regression techniques
can be read in Table 5.
4.4. Quantitation limit
Eq. (4) can be estimated as:ˆ Fig. 5. Plot of WLSR scaled residuals Y 2Y / s against logs dij iw i
X . L 5 k (s / b ) (12)i Q Q LQ 1 w

5/13/2018 Sig to Noise Rms Validation - slidepdf.com
http://slidepdf.com/reader/full/sig-to-noise-rms-validation 10/13
921 (2001) 121–133130 M . A. Castillo, R.C . Castells / J . Chromatogr . A
Table 3
Least squares parameters of the regression of peak area (Y / mAU3s) against injected analyte amount ( X /pmol). For each amine data on the j j
first line correspond to WLSR and those on the second line to ULSR
a b bAmine N Intercept6s Slope6s Residual Upper limit
standard of the linear
deviation range (pmol)
Try 49 435861319 4811655 7392 1200
36788645245 4694677 197722
Phe 42 64362421 4758628 12098 900
210190612125 4856629 49865
Pu 42 2194362117 80526108 10154 900
89399655433 73356131 228510
Ca 42 141162484 8260694 12839 900
221827626250 8456663 107959
Hist 35 603661720 64316133 7904 280
31998615980 59566115 58516
Ser 35 242561489 4508693 6721 280
16255610425 4303675 38176
Tyr 35 99561600 74016116 7084 280
2306615644 74236112 57430
Spd 35 2197862159 76096192 9433 280
214798617661 79506127 64832
Sp 35 2700862167 82416213 9249 280
13501625185 85986182 92223
aNumber of calibration data points.
bStandard deviation.
If a function s( X )5f( X ) has been previously evalu- particular case of this work the simplicity of Eq. (11)
ated, L can be determined, for instance, by plotting facilitates an analytical solution:Q
b X /f( X ) against X ; L is the value of X corre-1w Q L 5 k a /(b 2 k a ) (13)Q Q 0 1w Q 1sponding on the plot to an ordinate k . For theQ
Values of L calculated for IUPAC default value,Q
Table 4 k 510, can be read in Table 5. The results wereQResults for the repeatability of the method at two analyte levels (A confirmed by repeated derivatization and chromatog-and B) and for instrumental repeatability at one level (C)
raphy of standard solutions with concentrations closeAmine % RSD to those resulting in the injection of X 5 L pmol.Q
A B C
Try 5.2 (80) 4.3 (400) 0.96 (400) 4.5. Detection and quantitation limits by thePhe 2.6 (85) 2.2 (200) 1.7 (200)
signal-to-noise ratio ( S / N ratio approach ) Pu 5.7 (85) 4.3 (200) 2.2 (200)
Ca 4.9 (85) 3.5 (200) 1.8 (200)Peak-to-peak noise, h , was measured on chro-Hist 6.4 (50) 6.0 (130) 2.9 (130) N
Ser 7.1 (50) 6.2 (130) 1.7 (130) matograms of blank samples run on different days.Tyr 6.3 (50) 3.2 (130) 1.5 (130) Digital data (means of absorbance readings taken forSpd 9.5 (50) 5.0 (130) 2.5 (130)
periods of 0.64 s) collected for 3 min before and 3Sp 8.5 (50) 6.5 (130) 1.6 (130)
min after each analyte retention time were exportedA and B: Seven aliquots, individually derivatized, one injection and linearly fitted versus time by means of ULSR;
each; C: Five injections of the same derivatized aliquot; %influence of base line drift was removed in this way¯ ¯RSD5 s / Y 3 100, with s and Y expressed in peak area units;s di i i i
and the root mean square noise, rsmn [27] wasNumbers between parentheses indicate injected analyte amount
(pmol). obtained as the residual standard deviation of the fit.

5/13/2018 Sig to Noise Rms Validation - slidepdf.com
http://slidepdf.com/reader/full/sig-to-noise-rms-validation 11/13
921 (2001) 121–133 131 M . A. Castillo, R.C . Castells / J . Chromatogr . A
Table 5
Detection and quantitation limits calculated by the regression approach (ULSR and WLSR) and by the signal-to-noise ratio method
Amine Detection limit /pmol Quantitation limit /pmol
a aULSR WLSR S / N ratio Eq. (13) S / N ratio
bTry 210 (840) 2.7 (10.8) 6.2 (24.8) 7.8 (31.2) 33.2 (132.8)
Phe 52 (208) 7.4 (29.6) 6.7 (26.8) 12.2 (48.8) 36.0 (144.0)
Pu 55 (220) 3.1 (12.4) 4.2 (16.8) 8.5 (34.0) 20.5 (82.0)
Ca 65 (260) 4.6 (18.4) 4.4 (17.6) 7.7 (30.8) 21.1 (84.4)
Hist 51 (204) 4.0 (16.0) 4.2 (16.8) 11.5 (46.0) 20.5 (82.0)
Ser 46 (184) 4.5 (18.0) 3.9 (15.6) 12.9 (51.6) 25.1 (100.4)
Tyr 40 (160) 4.5 (18.0) 2.3 (9.2) 8.3 (33.2) 12.4 (49.6)
Spd 42 (168) 6.2 (24.8) 2.6 (10.4) 12.7 (50.8) 11.7 (46.8)
Sp 55 (220) 3.4 (13.6) 3.1 (12.4) 10.8 (43.2) 11.8 (47.2)
aCalculated by means of L5 k [h / h( X )] X where h( X ) is peak height at the analyte level X and h is peak-to-peak noise, using k 52 for
N N
L and k 510 for L .D Q
bNumbers between parentheses indicate the concentration (nmol/ml) of the standard solution subjected to the procedure.
Peak-to-peak noise is between three and six times last depends on derivative hydrophobicity, which in
larger than rmsn, depending upon noise characteris- his turn is strongly affected by the number of dabsyl
tics; visual inspection of our base lines indicated that groups linked to one analyte molecule. Therefore, it
making h 553rmsn was a safe choice. is hardly possible to state if the deviations from theN
Peak heights, h( X ), were measured by means of linear behavior at the highest concentrations result
instrument software from the base line defined for from derivatives solubilities or from limitations in
integration purposes after careful selection of peak the extent of reaction imposed by the low solubility
detect, top and end points. Then h( X ) / h ratios were of the reagent in the reaction mixture.N
fitted to a model of first order in X by means of The unweighted prediction intervals at low con-
WLSR using the inverse variance of peak heights as centrations are wider than the weighted intervals in
weighting factors. L and L , calculated from the situations of non-constant signal variance (see Fig.D Q
regression equation as the X values making h( X ) / 4). Therefore, detection limits are generally overesti-
h 52 or 10, respectively, can be read in Table 5. It mated when heteroscedastic calibration data areN
should be understood that this methodology was treated by the ULSR-approach [24–26]; unweighted
applied in order to obtain the best that can be detection limits listed in Table 5 range from 7 to 78
expected from the approach; as normally used, the times the weighted values and from 8 to 34 timesS / N ratio approach consists in making a short those estimated by means of the S / N ratio approach.
number of measurements in the low concentration Closer agreement is observed on comparing de-
region and interpolating between them. tection limits estimated by means of WLSR and S / N
ratio approaches. Paired differences are positive in
some cases and negative in others, and range from
5. Discussion less than 5% to more than 100% of the estimatedvalues; however, no significant difference between
Deleterious effects of derivatization on precision the results of the two methods was detected by
are clearly shown in columns B and C of Table 4, means of the Wilcoxon signed rank non-parametric
where whole method precision and purely chromato- test ([5], Chapter 12).
graphic precision at the same analyte level are Quantitation limits calculated by the S / N ratio
compared. The results gathered in the table fall approach with k 510 are larger than those obtainedQ
within the ranges estimated by other authors [1]. by means of Eq. (13), corresponding to %RSD that
The upper limit of the linear range (Table 3) range from 4.5 to 10.5.
decreases as the analyte retention time increases; this It is not easy to decide if these differences, not

5/13/2018 Sig to Noise Rms Validation - slidepdf.com
http://slidepdf.com/reader/full/sig-to-noise-rms-validation 12/13
921 (2001) 121–133132 M . A. Castillo, R.C . Castells / J . Chromatogr . A
negligible but not catastrophic, justify to change lated as peak area standard deviation/mean peak area
from the long used, intuitive and familiar to chroma- ratio) smaller than 0.10, the default value prescribed
tographers S / N ratio approach to the more elaborate, by IUPAC.
with more solid theoretical basis (but also ex-
perimentally more demanding) WLSR-approach. Oursuggestions can be summarized in the following
Acknowledgementsterms:
(a) The regression approach in the form rec-This work was sponsored by CONICET (Consejo
ommended by ICH [9] (i.e. estimating the blank ´ ´Nacional de Investigaciones Cientıficas y Tecnicas
standard deviation by means of the residual´de la Republica Argentina), by Agencia Nacional destandard deviation of the regression line or by
´ ´ ´Promocion Cientıfica y Tecnologica (contract BIDmeans of the slope standard deviation) is not´802/OC-AR) and by CICPBA (Comision de Inves-advisable by the reasons given in Section 2.3.
´tigaciones Cientıficas de la Provincia de Buenos(b) The S / N approach, as described by the ICHAires). M.A.C. acknowledges contract UNLP-[9], can be used in those situations in which theFOMEC for a fellowship.
estimation of the lowest limits of the methodconstitutes the only objective.
(c) In the more usual situations in which repro-
ducibility and linear range estimations are as Referencesimportant as those of lowest limits, the meth-
odology proposed in the present paper constitutes [1] L.R. Snyder, J.J. Kirkland, J.L. Glach, Practical HPLC
a more reliable option. On the other side, once the Method Development, 2nd ed., Wiley, New York, 1997.
[2] P.J. Schoenmakers, Optimization of Chromatographic Selec-chromatograms were run their results can be usedtivity, Elsevier, Amsterdam, 1986.to apply the S / N approach, providing a confirmat-
[3] H. Lingeman, W.J.M. Underberg (Eds.), Detection — Ori-ory result.
ented Derivatization Techniques in Liquid Chromatography,
Marcel Dekker, New York, 1990.
[4] G. Lunn, L.C. Hellwing, Handbook of Derivatization Re-
actions for HPLC, Wiley, New York, 1998.6. Conclusions[5] D.L. Massart, B.G.M. Vandeginste, L.M.C. Buydens, S. De
Jong, P.J. Lewi, J. Smeyers-Verbeke, Handbook of Chemo-A proposal for the preliminary evaluation of the
metrics and Qualimetrics: Part A, Elsevier, Amsterdam,quantitative performance of a chromatographic meth- 1997.od is presented and discussed. Detection and quanti- [6] EURACHEM Guide. The Fitness for Purpose of Analytical
Methods, LGC Ltd, Teddington, UK, 1998.tation limits, linear range and repeatability are calcu-[7] M.E. Swartz, I.S. Krull, Analytical Methods Developmentlated from the results of a calibration with several
and Validation, Marcel Dekker, New York, 1997.replicates at each analyte level. Replicates are essen-
[8] ICH Harmonized Tripartite Guideline. Text on Validation of tial in order to detect changes in precision with Analytical Procedures, ICH4, October 1994.analyte concentration, since application of unweight- [9] ICH Harmonized Tripartite Guideline. Validation of Ana-
lytical Procedures: Methodology, ICH4, November 1996.ed least-squares regression in situations of non-con-
[10] Chapter 13 D.A. Skoog, F.J. Holler, T.A. Nieman, in:stant signal variance yields overestimated detection Principles of Instrumental Analysis, 5th ed., Harcourt Bracelimits; on the other side replicates are also essentialand Co, Philadelphia, 1998.
to check response linearity and repeatability. An [11] Analytical Chemistry Committee, Royal Society of Chemis-statistically acceptable agreement is observed for the try, London, Analyst 119 (1994) 2363.
[12] J. Vial, A. Jardy, J. High Resol. Chromatogr. 22 (1999) 217.nine analytes assayed between detection limits esti-[13] IUPAC, prepared by L.A. Currie, IUPAC Commission onmated by weighted least-squares regression and by
Analytical Nomenclature, Recommendations in Evaluationmeans of the signal-to-noise approach. Quantitationof Analytical Methods including Detection and Quantifica-
limits estimated as the analyte amount resulting intion Capabilities, Pure Appl. Chem. 67 (1995) 1699, Tran-
peak heights ten times higher than the base line scription in Anal. Chim. Acta 391 (1999) 105.
peak-to-peak noise correspond to RSD values (calcu- [14] L.A. Currie, Anal. Chim. Acta 391 (1999) 127.
5/13/2018 Sig to Noise Rms Validation - slidepdf.com
http://slidepdf.com/reader/full/sig-to-noise-rms-validation 13/13
921 (2001) 121–133 133 M . A. Castillo, R.C . Castells / J . Chromatogr . A
[15] J.C. Miller, J.N. Miller, Statistics for Analytical Chemistry, [22] N.R. Draper, H. Smith, Applied Regression Analysis, 2nd
2nd ed., E. Horwood, London, 1988. ed., J. Wiley and Sons, New York, 1981.
[16] J. Vial, A. Jardy, Anal. Chem. 71 (1999) 2672. [23] L. Oppenheimer, T.P. Capizzi, R.M. Weppelman, H. Mehta,
[17] A. Hubaux, G. Vos, Anal. Chem. 42 (1970) 849. Anal. Chem. 55 (1983) 638.
[18] L.A. Currie, Anal. Chem. 40 (1968) 586. [24] M.E. Zorn, R.D. Gibbons, W.C. Sonzogni, Anal. Chem. 69
[19] G.T.Vernimont, in: W.E. Spendley. (Ed.), Use of Statistics to (1997) 3069.Develop and Evaluate Analytical Methods, AOAC, Arling- [25] J.S. Garden, D.G. Mitchell, W.N. Mills, Anal. Chem. 52ton, VA, 1985. (1980) 2310.
[20] IUPAC Committee on Analytical Nomenclature, Pure Appl. [26] J.R. Burdge, D.L. MacTaggart, S.O. Farwell, J. Chem. Ed.Chem. 66 (1994) 595. 76 (1999) 434.
[21] German Normative Institute, DIN 32645. Beuth, Berlin, [27] J.V. Hinshaw, LC–GC 18 (2000) 126.1994.