significant modulation of the hepatic proteome...
TRANSCRIPT
Significant modulation of the hepatic proteomeinduced by exposure to low temperature inXenopus laevis
Kazumichi Nagasawa1, Yuta Tanizaki1,2, Takehito Okui1, Atsuko Watarai3, Shinobu Ueda3 and Takashi Kato1,4,*1Department of Integrative Bioscience and Biomedical Engineering, Graduate School of Advanced Science and Engineering, Center for AdvancedLife and Medical Science, Waseda University, TWIns Building, 2-2 Wakamatsu-cho, Shinjuku-ku, Tokyo 162-8480, Japan2Japan Society for the Promotion of Science (JSPS), Kojimachi Business Center Building, 5-3-1 Kojimachi, Chiyoda-ku, Tokyo 102-0083, Japan3Institute for Innovation Design, Comprehensive Research Organization, Waseda University, TWIns Building, 2-2 Wakamatsu-cho, Shinjuku-ku,Tokyo 162-8480, Japan4Department of Biology, School of Education, Center for Advanced Life and Medical Science, Waseda University, TWIns Building, 2-2 Wakamatsu-cho, Shinjuku-ku, Tokyo 162-8480, Japan
*Author for correspondence ([email protected])
Biology Open 2, 1057–1069doi: 10.1242/bio.20136106Received 7th July 2013Accepted 22nd July 2013
SummaryThe African clawed frog, Xenopus laevis, is an ectothermic
vertebrate that can survive at low environmental
temperatures. To gain insight into the molecular events
induced by low body temperature, liver proteins were
evaluated at the standard laboratory rearing temperature
(22 C, control) and a low environmental temperature (5 C,
cold exposure). Using nano-flow liquid chromatography
coupled with tandem mass spectrometry, we identified 58
proteins that differed in abundance. A subsequent Gene
Ontology analysis revealed that the tyrosine and
phenylalanine catabolic processes were modulated by cold
exposure, which resulted in decreases in hepatic tyrosine and
phenylalanine, respectively. Similarly, levels of pyruvate
kinase and enolase, which are involved in glycolysis and
glycogen synthesis, were also decreased, whereas levels of
glycogen phosphorylase, which participates in glycogenolysis,
were increased. Therefore, we measured metabolites in the
respective pathways and found that levels of hepatic glycogen
and glucose were decreased. Although the liver was under
oxidative stress because of iron accumulation caused by
hepatic erythrocyte destruction, the hepatic NADPH/NADP
ratio was not changed. Thus, glycogen is probably utilized
mainly for NADPH supply rather than for energy or glucose
production. In conclusion, X. laevis responds to low body
temperature by modulating its hepatic proteome, which
results in altered carbohydrate metabolism.
� 2013. Published by The Company of Biologists Ltd. This is an
Open Access article distributed under the terms of the Creative
Commons Attribution License (http://creativecommons.org/
licenses/by/3.0), which permits unrestricted use, distribution
and reproduction in any medium provided that the original
work is properly attributed.
Key words: Proteomics, Pathway, Liver, Low temperature, Animal
model, Xenopus laevis
IntroductionIn order to survive, organisms respond to environmental changes
by altering their expression patterns of genes and proteins. One of
the most important environmental factors is temperature, which
governs the distribution, behaviour, and physiological responseof organisms. When the environmental temperature falls,
endothermic vertebrates, i.e. mammals and birds, maintain their
core body temperature within a narrow range by athermoregulatory system. Their bodies undergo numerous
physiological changes in response to cold stress to maintain
their temperature (Sonna et al., 2002; Silva, 2006). A cold
environment leads to hypothermia – abnormally low bodytemperatures. Apart from species that hibernate, most
endotherms are unable to survive at low body temperatures. In
contrast to endotherms, the core body temperature of ectothermic
vertebrates, including most fish, amphibians, and reptiles, as wellas most invertebrates, becomes low (Salt, 1949). The low body
temperature conditions modulate their physiological functioning
directly or indirectly due to low environmental temperature. How
and why mammalian hibernators and ectothermic vertebratessurvive in low temperatures have long been a scientific challenge
and an important line of inquiry for biologists. The cellular and
physiological responses to low body temperature have been
investigated. The key response is the downregulation of thecellular metabolic rate to new hypometabolic steady states in a
way that balances the ATP demand and ATP supply pathways
(Hochachka, 1986; Boutilier, 2001).
Amphibians have been used as physiological models to study
the responses to environmental stresses (Burggren and
Warburton, 2007; Hopkins, 2007). Cold exposure depressestheir metabolic rates and has effects on mitochondrial
bioenergetics (Boutilier et al., 1997; Trzcionka et al., 2008).
The African clawed frog, Xenopus laevis (Daudin), has served as
a crucial vertebrate model for biological research. Since the wildhabitat distribution of X. laevis covers a wide geographical range
(Tinsley et al., 1996; Tinsley and McCoid, 1996), this species is
Research Article 1057
Bio
logy
Open
by guest on September 1, 2018http://bio.biologists.org/Downloaded from

capable of tolerating a range of environmental conditions.
Therefore, we considered that X. laevis exposed to low
temperatures would be a good hypothermic model to
investigate responses to environmental temperature.
To understand the physiological responses to low-temperature
stress, global analyses of the genes and proteins responding to an
environmental stimulus should enable a deciphering of the
underlying physiological pathways (Cossins et al., 2006; Gracey,
2007). Although a number of previous studies have compared the
expression levels of mRNAs and proteins in cells and tissues, their
correlation has been controversial (Anderson and Seilhamer, 1997;
Ideker et al., 2001; Chen et al., 2002; Griffin et al., 2002; Mehra et
al., 2003; de Sousa Abreu et al., 2009; Maier et al., 2009;
Schwanhausser et al., 2011; Ghazalpour et al., 2011). Considering
that physiological events are determined by protein-driven
processes, the proteome should provide key information to
understand molecular responses. Proteomic studies have
investigated the following associated physiological responses in
X. laevis: the biosynthetic and secretory processes in
neuroendocrine cells (van Herp et al., 2008), white/black-
background adaptation (Devreese et al., 2010), response to
chemical exposure (Gillardin et al., 2009; Serrano et al., 2010),
photoreceptor outer segment assembly (Wang et al., 2009), and
limb regeneration (King et al., 2009). DNA microarrays for X. laevis
studies are currently commercially available from some companies
(GeneChip Xenopus laevis Genome Array from Affymetrix, Inc.
and Xenopus Gene Expression Microarray from Agilent
Technologies, Inc.). However, the proteomic approach in X. laevis
has been limited due to lack of availability of complete genomic
information. The draft genome sequence assembly of the Western
clawed frog, Xenopus (Silurana) tropicalis, was recently reported
(Hellsten et al., 2010). Additionally, concerted efforts are currently
underway in the United States, Japan, and elsewhere to carry out X.
laevis genome sequencing [Xenopus Community White Paper
2011; Xenbase: Xenopus laevis and Xenopus tropicalis biology and
genomics resource (http://www.xenbase.org/common)]. In the near
future, improvement in the accuracy of the Xenopus genomesequence will be achieved to facilitate proteomic approaches.
We previously investigated the haematopoietic response to low
temperature in X. laevis because haematopoiesis is one of the
most important physiological functions. After 24 hours of coldexposure (5 C), X. laevis displays anaemia associated with
hepatic erythrocyte destruction and hepatic iron accumulation as
a result of heme degradation (Maekawa et al., 2012). The
anaemia is prolonged during cold exposure concomitantly with
hepatic confinement of newly produced erythrocytes (Maekawa
et al., 2012). Generally, the liver plays a central role in metabolic
homeostasis and is a major site for the synthesis, metabolism,
storage, and redistribution of carbohydrates, proteins, and lipids
(Bechmann et al., 2012). The liver also plays an important role inenergy metabolism and the large change in metabolic rate caused
by cold exposure. In X. laevis, in contrast to mammals and
terrestrial frogs, the liver also plays a central role in the
production and destruction of erythrocytes (Chegini et al., 1979;
Nogawa-Kosaka et al., 2010; Nogawa-Kosaka et al., 2011;
Maekawa et al., 2012; Okui et al., 2013). Therefore, after
24 hours of cold exposure, various physiological responses may
occur in the liver. It is important to investigate these initial
responses to cold-exposure-induced low body temperature.
In the present study, we used a proteomics approach to profile
the liver proteome in X. laevis after exposure to low temperature,
because proteomics studies on the liver at low body temperature,such as gilthead sea breams exposed to the cold (Ibarz et al.,
2010), mammalian hibernators during entrance into hibernation
(Epperson et al., 2004; Shao et al., 2010; Epperson et al., 2010;
Rose et al., 2011), rat induced hypothermia (Oda et al., 2012),
Fig. 1. Transitions in environmental temperature and
hepatic proteins. (A) Relationship between cold-exposure time
and water temperature. A plastic tank containing 1 l of 22 Cwater was transferred to an incubator at 5 C and allowed to cool.During that time, the temperature of the water was measured. (B)Image of SDS-PAGE gels used to separate X. laevis liver proteinsamples; 10 mg of each sample from either the control or cold-exposure group (three frogs each) was separated on 12% SDS
polyacrylamide gels. Protein bands were visualized by stainingwith Coomassie brilliant blue R-250. Reducing (right panel) andnon-reducing (left panel) conditions are shown.
Hepatic proteome in Xenopus laevis 1058
Bio
logy
Open
by guest on September 1, 2018http://bio.biologists.org/Downloaded from

and freeze-tolerant wood frogs during winter (Kiss et al., 2011)
were recently reported. These studies enable us to carry out cross-
species comparisons of liver proteome changes. We applied a
label-free quantification method using nano-flow liquid
chromatography coupled with tandem mass spectrometry
(nanoLC–MS/MS) to assess X. laevis liver proteins that differ
in abundance between standard laboratory rearing temperature
(22 C, control condition) and low environmental temperature
(5 C, cold exposure). The purpose of this study was to gain an
insight into the initial physiological response to cold-exposure-
induced low body temperature.
Materials and MethodsAnimalsWild-type X. laevis (mass 30–40 g) frogs were purchased from Kazuo Ouchi
(Misato, Saitama, Japan) and housed in plastic tanks at the standard laboratory
rearing temperature (22 C) with constantly running water. This condition was
defined as the control condition. For low-temperature exposure, plastic tankscontaining X. laevis (one frog per tank containing 1 l of water at 22 C) were
transferred to an incubator (Bio Multi incubator; NK Systems, Osaka, Japan) set at
5 C and allowed to cool. All experiments were conducted according to the
Regulations for Animal Experimentation at Waseda University.
Haematological analysisThe haematological value of peripheral blood, including blood cell counts,
haemoglobin, and haematocrit values were obtained as previously reported(Aizawa et al., 2005; Nogawa-Kosaka et al., 2010; Nogawa-Kosaka et al., 2011;
Maekawa et al., 2012).
Liver tissue collectionAt 24 hours after cold exposure, X. laevis were quickly killed by beheading. The
livers from each of the control and cold-exposure groups (n53 each) were cut into
smaller pieces and flushed with Tris-buffered saline (20 mmol l21 Tris-HClpH 7.5, 100 mmol l21 NaCl) containing 1 mmol l21 ethylenediaminetetraacetic
acid (TBSE) to remove the excess blood, and then directly frozen in liquid nitrogenand stored at 280 C for protein analyses.
Extraction of hepatic proteinsA piece of the liver was homogenized in TBSE (0.5 ml per 100 mg of tissue) usinga bead beater-type homogenizer (Beads Crusher mT-12; TAITEC Co., Ltd.,
Saitama, Japan). The liver homogenates were centrifuged at 1,5006g for 5 minutes
at 4 C to remove cell debris and the supernatants were further centrifuged at15,0006g for 20 minutes at 4 C to remove insoluble proteins. The supernatants
containing soluble protein were collected and stored at 280 C until use. Proteinconcentration was determined using the Bradford assay reagent.
Protein digestionThree protein extracts from each individual were mixed in equal amounts(Fig. 2). The mixed extract containing 50 mg of protein was dissolved in
Fig. 2. Schematic view of sample and data processing. Each test sample, i.e.
a protein extract mixture derived from three frogs prepared by bead crusher,was subjected to tryptic digestion. Subsequent nanoLC–MS/MS analysis wasrepeated three times. Automatic peak extraction and MASCOT MS/MS ionsearch were performed using Xome software. The triplicate data wereprocessed individually in all combinations to calculate the protein ratios bynon-label quantification using Mass Navigator software then protein ratios wereaveraged after normalization. The details are explained in the Materials and
Methods and in Table 1.
Fig. 3. Outlines of MASCOT MS/MS ions search. (A) Summary ofMASCOT peptide identification in each search. aPeptide matches aboveidentity threshold (P,0.05); bFDR 5 decoy hits/NCBInr hits. (B) Venndiagrams of identified proteins in individual searches. Proteins identified in atleast two of the triplicate runs are highlighted in grey. (C) Comparison of valididentified proteins differentially expressed between the control and cold-
exposure conditions. Proteins identified at least twice were compared (126proteins from the control group and 100 proteins from the cold-exposuregroup); 81 proteins overlapped between both groups.
Hepatic proteome in Xenopus laevis 1059
Bio
logy
Open
by guest on September 1, 2018http://bio.biologists.org/Downloaded from

0.5 mol l21 Tris-HCl (pH 8.5) containing 8 mol l21 urea, 2.5 mmol l21
ethylenediaminetetraacetic acid, and 10 mmol l21 dithiothreitol, and incubated for
1.5 hours at 37 C. Iodoacetamide was then added at a concentration of 50 mmol l21 to
alkylate the reduced thiol groups. After incubation for 30 minutes at room temperature
in the dark, the mixture was diluted with 50 mmol l21 ammonium bicarbonate buffer ata final concentration of 1 mol l21 urea. For digestion, sequencing grade modified
trypsin (Promega KK., Tokyo, Japan) was added to the protein solution at 1:50
(trypsin:protein) and the mixture was incubated for 19 hours at 37 C. Formic acid was
added at a concentration of 0.1% to stop the reaction. The final solution was cleaned up
with MonoTip C18 tips (GL Sciences Inc., Tokyo, Japan) and the eluent was
evaporated in a vacuum centrifuge. The powdered peptides were redissolved in 50 ml
of 2% acetonitrile in water containing 0.02% formic acid for nanoLC–MS/MS analysis.
nanoLC–MS/MS analysisWe used Nano Frontier eLD system (Hitachi High-Technologies Corporation,
Tokyo, Japan). The analytical column was a packed nano-capillary column
(NTCC-360/75-3; Nikkyo Technos Co. Ltd., Tokyo, Japan). We also used a
monolithic trap column (Monolith Trap C18-50-15, Hitachi High-technologies
Corporation, Tokyo, Japan). The LC conditions were as follows. The flow rate
of the nanoflow pump was set at 200 nl min21. Solvent A was 2% aqueous
acetonitrile containing 0.1% formic acid, and solvent B was 98% aqueous
acetonitrile containing 0.1% formic acid. The composition of solvent B was
linearly increased from 2% at 0 minutes to 35% at 150 minutes, maintained at100% until 165 minutes, and then returned to the initial condition of 2%. The
MS/MS conditions were as follows: ESI voltage, +1.6 kV; curtain (nitrogen)
gas flow rate, 0.6 l min21; precursor mass scan range, m/z 100–2000; scan
time, 20 msec; fragment mass scan range, m/z 50–2000. The 2 ml of peptide
solution (equivalent to 2 mg of protein) were analysed in triplicate runs
(Fig. 2).
Data processingXome (Mitsui Knowledge Industry Co., Ltd., Tokyo, Japan) software was used for
generating the peak list and identification of proteins (Honmyo, 2007). For the
identification of proteins, we performed peptide mass fingerprint against the
NCBInr database [NCBInr 20130303 (23463169 sequences; 8064228071
residues); National Center for Biotechnology Information, http://www.ncbi.nlm.
Table 1. Upregulated proteins in cold-exposed X. laevis liver (group 1).
Controla Cold exposurea Human homologous protein
Accessionnumber Protein name
Proteinscore
Peptidecontent
Proteinscore
Peptidecontent
Foldchangeb
RefSeqprotein IDc Protein name Function
gi 147906883 hemoglobin subunitbeta-1
421 40 491 62 16.8 NP_000509{ hemoglobin subunitbeta
oxygen transport
gi 54037970 LOC495053 protein 41 8 52 13 9.79 NP_002696 periplakin structural constituentof cytoskeleton
gi 147902603 hemoglobin subunitalpha-2
252 45 322 58 7.47 NP_000508{ hemoglobin subunitalpha
oxygen transport
gi 122285 hemoglobin subunitalpha-1
338 48 403 65 7.13 NP_000508{ hemoglobin subunitalpha
oxygen transport
gi 148223115 fumarylacetoacetase 101 7 121 8 7.01 NP_000128 fumarylacetoacetase amino acidcatabolism
gi 62740095 LOC733209 protein 35 8 33 7 3.09 NP_004478{ Golgin subfamily Bmember 1 isoform 2
Golgi organization
gi 291290905 hemoglobin, gammaG
211 16 263 24 2.81 NP_000175{ hemoglobin subunitgamma-2
oxygen transport
gi 118384 ornithine decarboxy-lase 1
39 8 38 12 2.67 NP_004761 potassium voltage-gated channel subfam-
ily B member 2
cation transport
gi 147906522 potassiumvoltage-gated chan-
nel, Shab-relatedsubfamily, member 2
31 3 38 4 2.64 NP_002530 ornithine decarboxy-lase
polyamine biosynth-esis
gi 147898869 purine nucleosidephosphorylase
90 7 84 5 1.72 NP_000261 purine nucleosidephosphorylase
purine metabolism
gi 148222055 similar to carbonicanhydrase II
54 2 57 1 1.48 NP_940986 carbonic anhydrase 13 carbon metabolism
gi 147899037 malate dehydrogen-ase 2, NAD (mito-
chondrial)
55 5 96 5 1.37 NP_005909 malate dehydrogenase,mitochondrial precur-
sor
tricarboxylic acidpathway
gi 147904511 enolase 3 66 8 72 7 1.37 NP_001967 beta-enolase isoform 1 glycolysisgi 11385422 serine/threonine-pro-
tein kinase atr57 7 57 5 1.29 NP_001175 serine/threonine-pro-
tein kinase ATRDNA repair, proteinphosphorylation, cell
cycle control
aProtein scores and peptide contents in MASCOT MS/MS ion search. Maximum values for triplicate data are shown.bFold changes (cold exposure/control) of protein abundance. Identified peptides were aligned by m/z and retention time. Peptide peaks of the MS chromatogram
were approximated by the Gaussian waveform using the Simplex method and peak areas were calculated. Peptide ratios (cold exposure/control) were calculatedfrom the peak areas. Outliers were removed by Thompson’s rejection test and then protein ratios were estimated as the average of the peptide ratio. The triplicatedata were processed individually in all combinations to calculate protein ratios, and then the protein ratios were averaged after normalization. In many proteomicsstudies, the expression of proteins does not change under different conditions (Tabata et al., 2007), and the mode value (i.e. the most probable value) of proteinratios reflects variations in protein loading. Therefore, to take the variations into consideration, the ratio (cold exposure/control) for individual proteins betweensamples was normalized against the mode value of the ratios (the mode value was set as 1.0 for each combination). The scheme of this procedure is described inFig. 2.
By reference to a previous publication (Kolkman et al., 2006), the ratios were considered as significantly changed when they satisfied the following assumption:proteins with a cold-exposure/control ratio higher than 1.25 or lower than 0.8 had to have a coefficient of variation, i.e. average ratio divided by standarddeviation, below 30%. Significant values are in bold. The information for the peptide used for calculating the protein fold change (e.g. retention time and peakarea) is provided as supplementary material Table S5.
cRefSeq IDs of human homologues were obtained from NCBI HomoloGene database or by alignment with the NCBI Reference Sequence (RefSeq) databaseusing the BLASTp programme ({).
Hepatic proteome in Xenopus laevis 1060
Bio
logy
Open
by guest on September 1, 2018http://bio.biologists.org/Downloaded from

nih.gov] using the Mascot search engine version 2.1 (Matrix Science, London,UK). The Mascot MS/MS ion search conditions were as follows: taxonomy filter,X. laevis (African clawed frog) (17403 sequences); enzyme, trypsin; maximummissed cleavages, 1; fixed modifications, carbamidomethyl (C); variablemodifications, oxidation (M); peptide mass tolerance, 0.3 Da; MS/MS ion masstolerance, 0.3 Da; charge states, +1, +2, and +3; mass values, monoisotopic;instrument type, ESI-TRAP. The threshold score to achieve P,0.05 was set by theMascot algorithm. Because the nanoLC–MS/MS was performed in triplicate, thetriplicate data were processed separately (Fig. 2). As a result, the false discoveryrate (FDRs) was less than 0.05 in all Mascot searches, which indicates that thesignificance threshold (P,0.05) was applicable (Fig. 3A). The complete resultsare listed in supplementary material Table S1. Only an identification observed in atleast two of the three replicates was taken to be valid (Fig. 3B). The Xomeprogramme identified 145 X. laevis proteins, 113 of which had a humanhomologue in the NCBI HomoloGene database (http://www.ncbi.nlm.nih.gov/homologene). The remaining 32 proteins were manually annotated by alignmentwith the NCBI Reference Sequence (RefSeq) database using the BLASTpprogramme (NCBI Basic Local Alignment Search Tool, http://blast.ncbi.nlm.nih.gov/Blast.cgi).
To screen proteins differentially expressed between the control and cold-exposure groups, fold changes in protein abundance were calculated using the‘non-label quantitation’ function of Mass Navigator v1.2 (Mitsui KnowledgeIndustry Co., Ltd., Tokyo, Japan). The procedure for the calculation of protein foldchanges is described in Table 1. The complete results are listed in supplementarymaterial Table S2.
Gene ontology and pathway analysisTo identify significantly represented biological themes and functional groups inthe protein list, gene ontology (GO) and pathway analysis were performed usingthe Database for Annotation, Visualization and Integrated Discovery (DAVID)v6.7 program (http://david.abcc.ncifcrf.gov) (Huang et al., 2009a; Huang et al.,2009b). The GO analysis was used to identify enriched biological themes usingGO terms defined and provided as official terms by the Gene OntologyConsortium (http://www.geneontology.org) (Dennis et al., 2003). The ‘biologicalprocess’ subontology of GO (GO:BP) refers to a biological objective to which theprotein contributes and is widely used to evaluate sets of relationships betweenproteins. The pathway analysis was used to identify candidate proteins involved inpathways from the Kyoto Encyclopaedia of Genes and Genomes (KEGG) pathwaydatabase (http://www.genome.jp/kegg/pathway.html). The analysis conditionswere as follows: when the list of identified proteins in the control and cold-exposure conditions was used as the input data, the DAVID default populationbackground (corresponding genome-wide genes with at least one annotation in theanalysing categories) was used; when the differentially expressed protein list wasused, the total protein list from this study (145 proteins) was inputted and used as acustomized population background. We used EASE scores, which modifiedFisher’s exact test P values to evaluate the significance of enrichment (Hosack etal., 2003), and Benjamini and Hochberg FDR procedures for multiple testingcorrections (Benjamini and Hochberg, 1995). Only statistically enriched GO termsand pathways (Benjamini and Hochberg FDR-corrected P,0.01) with at least twoproteins were selected. To determine the hierarchical structure of the selected GOterms, we used QuickGO (http://www.ebi.ac.uk/QuickGO).
Quantification of free amino acidsFree amino acids were quantified by EZ:faast GC/FID Free (Physiological) AminoAcid Kit (Phenomenex, Inc., CA, USA) by using gas chromatography (GC)equipped with a flame ionization detector (FID) (GC-2014; Shimadzu Corporation,Kyoto, Japan). The protein extracts from X. laevos liver (equivalent to 0.5 mgprotein) were subjected to pretreatment for GC/FID analysis according to themanufacturer’s protocol. Chromatographic conditions were as follows: initial oventemperature of 80 C with 20 C min21 ramps to the final temperature of 320 C.Inlet temperature of 280 C under constant helium flow of 50 cm sec21 and thedetector temperature of 320 C is used for the analysis of derivatized amino acids.
Quantification of glycogen in the liverLiver glycogen was isolated by precipitation from ice-cold 5% trichloroacetic acidextracts using ice-cold 70% ethanol as previously described (Graff and Allen,1963). The precipitate was dissolved in water, hydrolyzed to glucose for 2 hours at100 C in 2 N sulphuric acid, and neutralized using 2 N sodium hydrate (Sahyun,1931). The glucose was measured using the glucose oxidase method (Glucose CIITest-Wako; Wako Pure Chemical Industries, Ltd., Osaka, Japan). The absorbanceat 505 nm was measured using a microplate reader (POWERSCAN HT; DSPharma Biomedical Co., Ltd., Osaka, Japan), and a factor of 0.927 was used toconvert the values obtained from glucose into values for anhydrous glycogen.
Quantification of glucose, glycerol, NADP and NADPHGlucose in the plasma and liver extracts was measured directly using the GlucoseCII Test from Wako. Glycerol in the plasma was measured directly by using the
Glycerol Colorimetric Assay Kit (Cayman Chemical Company, MI, USA). Liver
extracts for the glycerol assay were prepared as previously described (Driedzic et
al., 2006). A piece of frozen liver was homogenized in nine volumes of 10%
perchloric acid, and the homogenate was centrifuged at 15,0006g. The supernatant
was neutralized using potassium hydrate and assayed as described above. Theabsorbance at 540 nm was measured. NADP and NADPH in the liver were
measured using a fluorimetric assay (SensoLyte NADP/NADPH Assay Kit;
AnaSpec, Inc., CA, USA) according to the manufacturer’s instructions. The
resulting red fluorescence was monitored at excitation and emission wavelengths
of 560 and 590 nm, respectively.
ResultsAnaemia is induced by cold exposure in X. laevis
Over 6 hours of exposure to 5 C, the water temperature decreased
to almost 5 C (Fig. 1A). At 24 hours, the erythrocyte count was
approximately 70% of that in the control condition, and
haemoglobin and haematocrit values were also decreased as
reported previously (Maekawa et al., 2012) (data not shown). No
significant changes in body or hepatic weight were observed
(data not shown).
Fig. 4. GO and pathway analyses of X. laevis liver proteomes. (A) Schematicview of the data processing procedure. The GI accessions of X. laevis proteinswere converted to human RefSeq protein IDs by using NCBI HomoloGene andBLASTp, and then GO and pathway analyses were performed by using the
DAVID program. FDR-corrected P values were defined by modified Fisher’sexact test with the Benjamini and Hochberg FDR correction. The significantlyidentified GO:BP terms appearing deepest in the hierarchy and the significantlyidentified KEGG pathways are shown (FDR-corrected P,0.01). The details areexplained in the materials and methods. (B,C) Comparison of enriched GO:BPterms (B) and KEGG pathways (C) in the list of proteins identified between thecontrol and cold-exposure conditions.
Hepatic proteome in Xenopus laevis 1061
Bio
logy
Open
by guest on September 1, 2018http://bio.biologists.org/Downloaded from
X. laevis liver proteome
To survey hepatic protein profiles of X. laevis in the control and
cold-exposure groups, we conducted a proteomics analysis using
label-free nanoLC–MS/MS. Although the SDS-PAGE patterns of
the Coomassie brilliant blue-stained liver extracts were similar
between control and cold-exposure groups (Fig. 1B), the LC–
MS/MS analysis detected differences in the protein contents. We
identified 145 proteins (126 proteins from the control group and
100 proteins from the cold-exposure group), and 81 proteins
overlapped between the groups (Fig. 2C). Next, we set out to find
biologically relevant themes within the list of identified proteins.
The GO analysis identified five and seven GO:BP terms that
were significantly enriched in the control and cold-exposed X. laevis
liver proteomes, respectively. Four of these terms were common
between control and cold exposure. Only one term, ‘oxygen and
reactive oxygen species metabolic process (GO:0006800)’ (4
proteins, P52.8761023), was control-specific, and three terms,
‘cellular amide metabolic process (GO:0043603)’ (4 proteins,
P57.1761023), ‘coenzyme metabolic process (GO:0006732)’ (6
proteins, P55.8961023), and ‘cellular amino acid metabolic process
(GO:0006520)’ (9 proteins, P56.7361024), were cold-exposure-
specific. In the pathway analysis, two pathways, ‘glycolysis/
gluconeogenesis (xla00010)’ (control: 15 proteins, P52.6261029;
cold exposure: 12 proteins, P53.6361027) and ‘pentose phosphate
pathway (xla00030)’ (control: 9 proteins, P58.2961027; cold
exposure: 9 proteins, P53.4861027), were commonly associated
with the control and cold-exposed liver proteomes in X. laevis. Three
pathways, ‘tyrosine metabolism (xla00350)’ (6 proteins,
P51.2761023), ‘pyruvate metabolism (xla00620)’ (6 proteins,
P59.8661023), and ‘arginine and proline metabolism (xla00330)’
(6 proteins, P59.4861023), were cold-exposure-specific. Minimal
difference was observed between the control and cold-exposure
conditions, possiblybecause of the small number of X. laevisproteins
annotated with GO and KEGG pathways. We then converted the
identified proteins to their homologous human proteins for analysis
(Fig. 4A) and found that 14 and 19 GO:BP terms were significantly
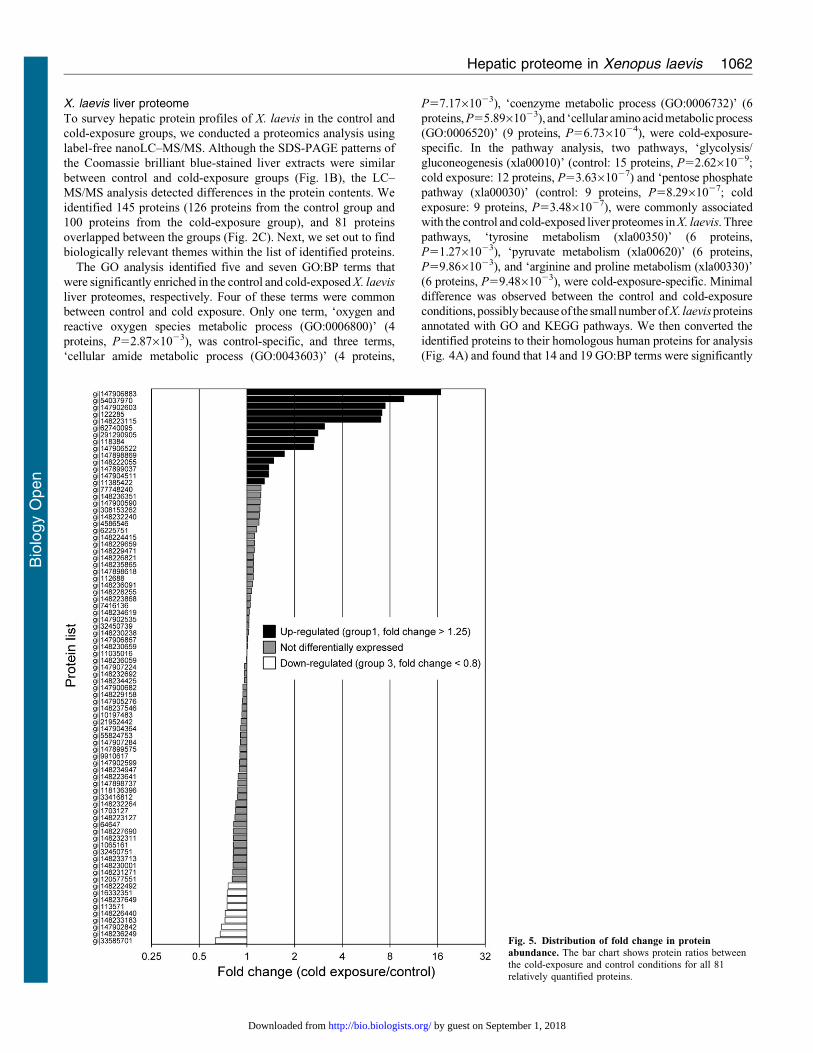
Fig. 5. Distribution of fold change in protein
abundance. The bar chart shows protein ratios betweenthe cold-exposure and control conditions for all 81relatively quantified proteins.
Hepatic proteome in Xenopus laevis 1062
Bio
logy
Open
by guest on September 1, 2018http://bio.biologists.org/Downloaded from

enriched in the control and cold-exposed X. laevis liver proteomes,
respectively (Fig. 4B). Twelve of these terms were shared between
control and coldexposure, and two and seven terms were control- and
cold-exposure-specific, respectively (Fig. 4B; supplementary
material Table S3). Five pathways were commonly associated with
both control and cold-exposed X. laevis liver proteomes (Fig. 4C;
supplementary material Table S4).
Differential protein abundance under cold exposure
To identify differentially expressed proteins associated with cold
exposure, non-label quantification was performed (Fig. 5). The
proteins found to be differentially expressed were categorized
into four groups. Fourteen proteins were upregulated by cold
exposure (fold change .1.25) (group 1; Table 1), and 13 proteins
were detected only in the cold-exposure condition (i.e.
considered to be newly induced) (group 2; Table 2). Nine
proteins were downregulated under cold exposure (fold change
,0.8) (group 3; Table 3), and the levels of 22 proteins were
below the detection limit (i.e. detected only in the control
condition) (group 4; Table 4). Generally, proteins in groups 1 and
2 (total, 27) can all be viewed as upregulated and those in groups
3 and 4 (total, 31) can be viewed as downregulated under cold
exposure. We then analysed the GO enrichment of these
upregulated and downregulated proteins by using the DAVID
program with X. laevis proteins and candidate human
homologues. Neither enriched GO:BP terms nor associated
KEGG pathways were identified, presumably because of thesmall number of proteins.
Validation of proteome data and GO and pathway analysis bymetabolite measurements
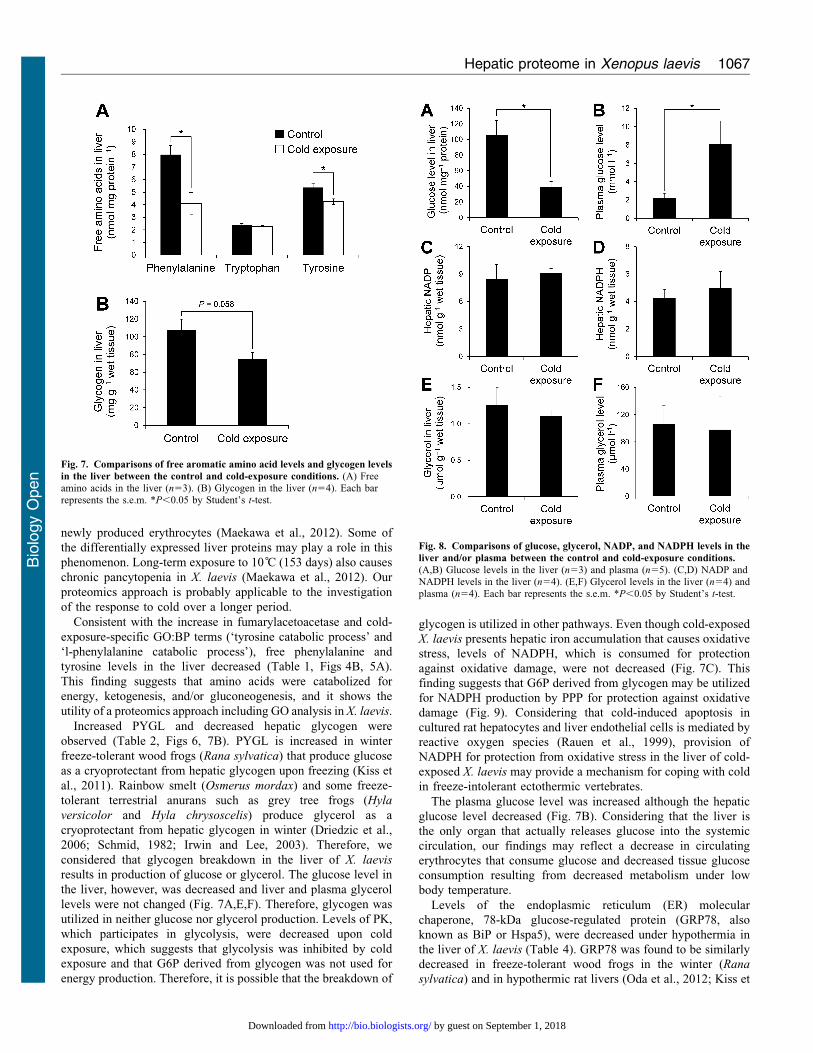
In the GO analysis, the ‘tyrosine catabolic process’ and ‘l-
phenylalanine catabolic process’ were significantly enriched only
under cold exposure (Fig. 4B). In addition, levels of
fumarylacetoacetase, which is necessary for metabolism of
phenylalanine and tyrosine, tended to increase in cold exposure
(Table 1). Generally, the liver metabolizes aromatic amino acids,including phenylalanine and tyrosine but not tryptophan (Dejong et
al., 2007). Therefore, levels of these free amino acid levels in the
liver were compared between the cold-exposure and control groups
(Fig. 7A). Phenylalanine and tyrosine levels significantly decreased
in cold exposure, whereas the tryptophan level did not change.
Fig. 6 shows cold-exposure-induced changes in protein
abundance associated with carbohydrate metabolic pathways.
Glycogen phosphorylase (PYGL), which catalyses the
breakdown of glycogen, was increased under cold exposure(Fig. 6). Levels of 1,4-alpha-glucan branching enzyme (GBE)
and UTP-glucose-1-phosphate uridylyltransferase (UDP-glucose
Table 2. Newly induced proteins in cold-exposed X. laevis liver (group 2).
Human homologous protein
Accession number Protein nameProteinscorea
Peptidecontenta RefSeq protein IDb Protein name Function
gi 147905834 lysosomal thioesterasePPT2-B precursor
58 11 NP_005146{ lysosomal thioesterasePPT2 isoform
a precursor
protein–lipid modification
gi 160420189 dopa decarboxylase(aromatic L-amino acid
decarboxylase)
32 6 NP_001076440 aromatic-L-amino-aciddecarboxylase isoform 1
amino acid metabolism
gi 147898691 DNA-dependent proteinkinase catalytic subunit
33 6 NP_008835{ DNA-dependent proteinkinase catalytic subunit
isoform 1
DNA repair, proteinphosphorylation, cell cycle
controlgi 125858908 unknown (protein for
IMAGE:8550378)30 5 NP_005073{ E3 ubiquitin/ISG15
ligase TRIM25proteolysis
gi 147902854 zinc finger protein 507 31 5 NP_055725{ zinc finger protein 507 transcriptional regulationgi 147901600 liver glycogen
phosphorylase35 4 NP_002854 glycogen phosphorylase,
liver form isoform 1glycogen metabolism
gi 68534041 LOC733291 protein 55 4 NP_006301 puromycin-sensitiveaminopeptidase
proteolysis
gi 147907415 ropporin-1-like protein 28 3 NP_001188395{ ropporin-1-like protein unknowngi 148225833 glycerol-3-phosphate
dehydrogenase 1 (soluble)54 3 NP_005267 glycerol-3-phosphate
dehydrogenase [NAD+],cytoplasmic isoform 1
phospholipid metabolism
gi 3745759 histone H4 75 3 NP_778224{ histone H4 chromatin packaging andremodeling
gi 147905626 alcohol dehydrogenase 1C(class I), gamma
polypeptide
35 2 NP_000660 alcohol dehydrogenase1C
carbohydrate metabolism
gi 37791449 protein tyrosinephosphatase PTP-PEST
37 2 NP_002826{ tyrosine-proteinphosphatase
non-receptor type 12isoform 1
protein phosphorylation,signal transduction, cell
adhesion, protein targeting,cell communication, cell
motilitygi 49115587 LOC443650 protein 32 2 NP_055807 disheveled-associated
activator ofmorphogenesis 1
cell motility
aProtein scores and peptide contents in MASCOT MS/MS ion search. Maximum values for triplicate data are shown.bRefSeq IDs of human homologues were obtained from NCBI HomoloGene database or by alignment with the NCBI Reference Sequence (RefSeq) database
using the BLASTp programme ({).
Hepatic proteome in Xenopus laevis 1063
Bio
logy
Open
by guest on September 1, 2018http://bio.biologists.org/Downloaded from
pyrophosphorylase, UGPase), which participate in glycogen
synthesis from glucose, were decreased (Fig. 6). Consequently,
it is likely that synthesis of glycogen was downregulated and
breakdown of glycogen was upregulated by cold exposure. Thus,
we compared liver glycogen levels between the cold-exposure
and control groups. The liver glycogen level tended to decrease
to 70% of the control level upon cold exposure (Fig. 7B).
Glycogen is broken down into glucose-1-phosphate (G1P) by
PYGL and is subsequently converted to glucose 6-phosphate
(G6P) by phosphoglucomutase (PGM). The resulting G6P is used
in several metabolic pathways: (1) it is used in glucose
production to supply energy for the body; (2) it fuels
downstream glycolysis to produce energy in the form of ATP
and NADH; (3) it is the starting substrate for the oxidative arm of
the pentose phosphate pathway (PPP); (4) it may be used for
biosynthesis of other metabolites. We examined whether liver
glycogen was broken down for these pathways as follows:
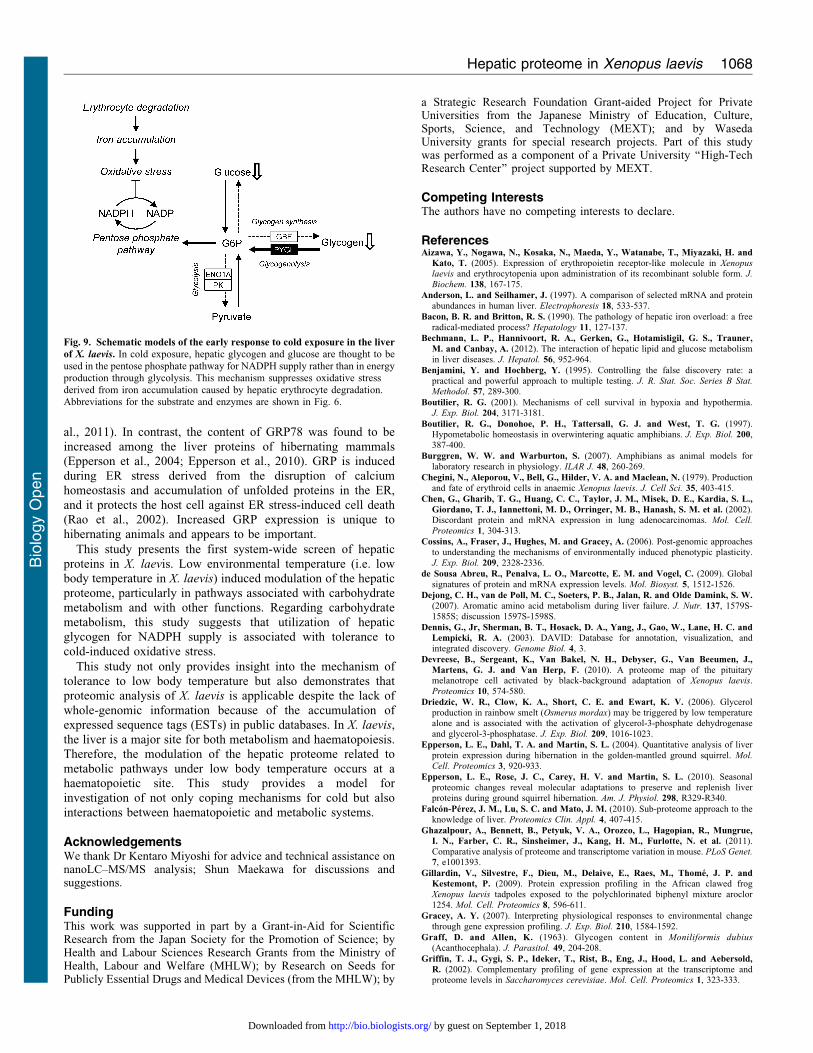
(1) Glucose production: increased PYGL and decreased
hepatic glycogen were observed (Figs 6, 7B). PYGL is
upregulated in winter freeze-tolerant wood frogs (Rana
sylvatica), which produce glucose from glycogen as a
cryoprotectant in freezing (Kiss et al., 2011). When hepatic
glucose production is increased, glucose levels in both liver and
plasma are elevated because the glucose moves to the
bloodstream across the hepatocyte membrane, mainly through
facilitated diffusion through the glucose transporter (Nordlie et
al., 1999). Therefore, we compared liver and plasma glucose
levels between the control and cold-exposure conditions. The
liver glucose level was significantly decreased to half of the level
in the control under the cold-exposure condition (Fig. 8A). In
contrast, the plasma glucose level significantly increased in the
cold-exposure condition (approximately 3.5 fold) (Fig. 8B).
(2) Glycolysis: the level of pyruvate kinase (PK), which catalyzes
the last step in the process of glycolysis by metabolising glucose to
pyruvate with a net gain of two ATP and two NADH molecules per
glucose molecule, was decreased (Fig. 6).
(3) PPP: the ‘pentose phosphate pathway’ was commonly
associated with the liver proteome in the control condition and
under cold exposure (Fig. 4C). In addition, the ‘pentose
biosynthetic process’ was significantly enriched only in
under exposure (Fig. 4B). These results suggest that G6P
derived from glycogen may be used for PPP. The oxidative
phase of PPP generates NADPH from NADP (Wamelink et al.,
2008). In X. laevis, cold exposure causes hepatic iron accumulation
as a result of heme degradation following erythrocyte destruction
(Maekawa et al., 2012). Iron accumulation is associated with free
radical production and elevates oxidative stress (Bacon and
Britton, 1990). Cellular NADPH is important for tolerance to
oxidative stress and maintenance of cellular redox homeostasis.
Therefore, hepatic NADP and NADPH levels were compared
between the control and cold-exposure conditions and found to be
unaffected by cold exposure (Fig. 8C,D). The hepatic NADPH/
NADP ratio was also not changed (data not shown).
(4) Biosynthesis of other metabolites: in rainbow smelt
(Osmerus mordax), glycerol accumulation in the plasma is
induced by low temperature (Driedzic et al., 2006). Some freeze-
tolerant terrestrial anurans such as grey tree frogs (Hyla
versicolor and Hyla chrysoscelis) also produce copious
quantities of glycerol as the cryoprotectant (Schmid, 1982;
Irwin and Lee, 2003). These species use liver glycogen as the
carbon source for glycerol synthesis. In this synthetic pathway,
dihydroxyacetone phosphate (DHAP) is converted to glycerol 3-
phosphate (G3P) and subsequently to glycerol via reactions
catalysed by glycerol-3-phosphate dehydrogenase (GPDH) and
glycerol-3-phosphatase (G3Pase), respectively. In our proteomic
analysis, GPDH levels increased under cold exposure (Fig. 6),
which suggests that glycogen may be used for glycerol
production. To test this possibility, glycerol levels in the liver
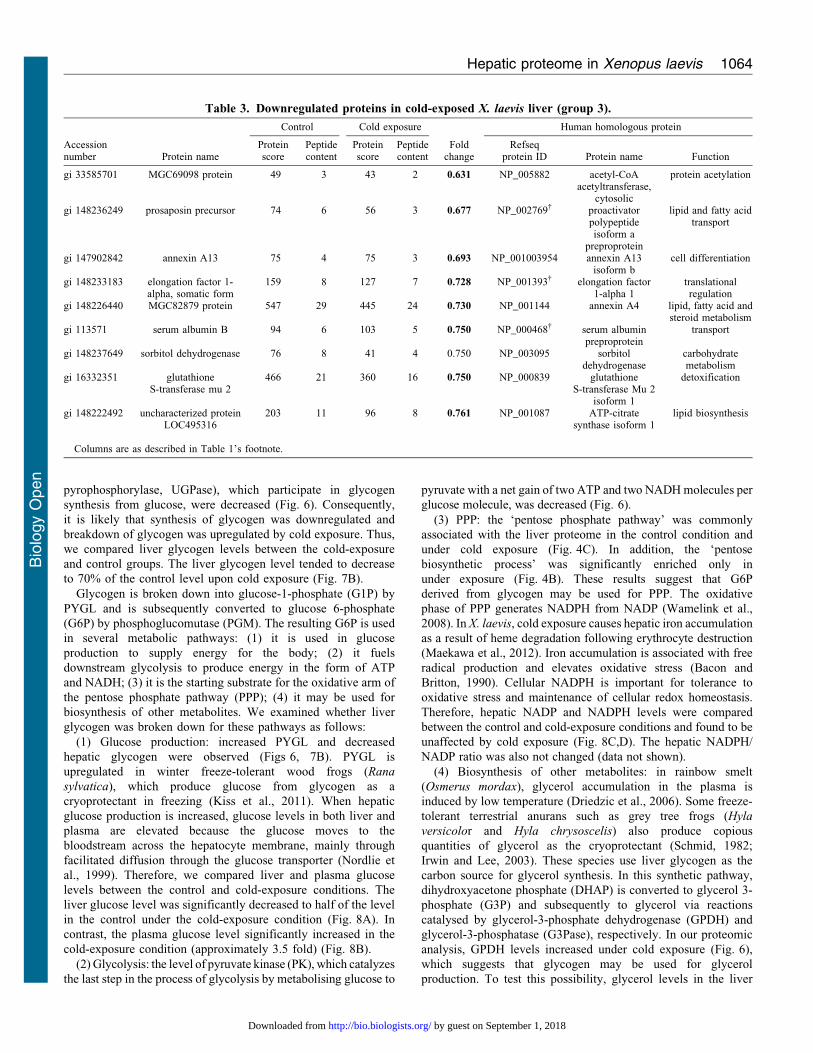
Table 3. Downregulated proteins in cold-exposed X. laevis liver (group 3).
Control Cold exposure Human homologous protein
Accessionnumber Protein name
Proteinscore
Peptidecontent
Proteinscore
Peptidecontent
Foldchange
Refseqprotein ID Protein name Function
gi 33585701 MGC69098 protein 49 3 43 2 0.631 NP_005882 acetyl-CoAacetyltransferase,
cytosolic
protein acetylation
gi 148236249 prosaposin precursor 74 6 56 3 0.677 NP_002769{ proactivatorpolypeptideisoform a
preproprotein
lipid and fatty acidtransport
gi 147902842 annexin A13 75 4 75 3 0.693 NP_001003954 annexin A13isoform b
cell differentiation
gi 148233183 elongation factor 1-alpha, somatic form
159 8 127 7 0.728 NP_001393{ elongation factor1-alpha 1
translationalregulation
gi 148226440 MGC82879 protein 547 29 445 24 0.730 NP_001144 annexin A4 lipid, fatty acid andsteroid metabolism
gi 113571 serum albumin B 94 6 103 5 0.750 NP_000468{ serum albuminpreproprotein
transport
gi 148237649 sorbitol dehydrogenase 76 8 41 4 0.750 NP_003095 sorbitoldehydrogenase
carbohydratemetabolism
gi 16332351 glutathioneS-transferase mu 2
466 21 360 16 0.750 NP_000839 glutathioneS-transferase Mu 2
isoform 1
detoxification
gi 148222492 uncharacterized proteinLOC495316
203 11 96 8 0.761 NP_001087 ATP-citratesynthase isoform 1
lipid biosynthesis
Columns are as described in Table 1’s footnote.
Hepatic proteome in Xenopus laevis 1064
Bio
logy
Open
by guest on September 1, 2018http://bio.biologists.org/Downloaded from

and plasma were compared between the control and cold-
exposure conditions. Glycerol levels in both the liver and plasma
were not changed by cold exposure (Fig. 8E,F).
DiscussionHere, using a proteomics approach, we demonstrated the protein
abundance profile of X. laevis liver after cold exposure. One
hundred and forty-five proteins were identified from the soluble
fraction of whole liver extract by trypsin digestion followed by
LC–MS/MS without prior fractionation of proteins; 58 of these
proteins were differentially expressed proteins (upregulated, 27;
downregulated, 31). No GO:BP terms, however, were significantly
enriched in these protein lists, presumably due to the small number
of proteins. In recent years, global proteomics approaches have
been widely used to characterize a number of tissue proteomes,
including liver (Falcon-Perez et al., 2010). Pre-fractionation of
protein samples by one-dimensional electrophoresis and/or liquid
chromatography has enabled the identification of more than 7000
proteins in the mouse liver (Shi et al., 2007; Lai et al., 2008). By
the application of these methods, the number of identified proteins
will be increased and enable GO and pathway analysis.
We have shown that the number of mature erythrocytes and
accumulation of iron catalyzed from heme decrease in the liver
within 24 hours after cold exposure (5 C), which reflects the
enhanced destruction of erythrocytes in the liver (Maekawa et al.,
2012). The enhanced hepatic destruction of erythrocytes is
thought to increase the protein levels of haemoglobin subunits in
the liver. Consistent with a previous finding, the protein levels of
haemoglobin subunits in the liver tended to increase within
24 hours after cold exposure in our proteomic analysis (Table 1),
which suggests that the results of the LC–MS/MS analysis in our
study reflect physiological responses as changes in protein
abundance. The peripheral erythrocyte count remains low during
cold exposure (5 days) because of the hepatic confinement of
Table 4. Proteins below detection limit in cold-exposed X. laevis liver (group 4).
Human homologous protein
Accession number Protein nameProteinscore
Peptidecontent
RefSeq proteinID Protein name Function
gi 148232992 enolase 1 a 105 9 NP_001419 alpha-enolase isoform 1 glycolysisgi 148235435 uncharacterized protein
LOC39881499 6 NP_006750 UTP–glucose-1-phosphate
uridylyltransferase isoform apolysaccharide metabolism
gi 148237900 adenosylhomocysteinase B 82 3 NP_000678 adenosylhomocysteinase isoform 1 purine metabolismgi 50415517 heat shock 70 kDa
protein78 3 NP_006588 heat shock cognate 71 kDa protein
isoform 1protein folding, stress
responsegi 50417653 LOC397850 protein 75 3 NP_005338 78 kDa glucose-regulated protein
precursorprotein folding, stress
responsegi 288557262 heat shock cognate 70.II
protein71 4 NP_068814{ heat shock-related 70 kDa protein 2 protein folding, stress
responsegi 159155766 LOC780759 protein 69 5 N-
P_001128527transketolase pentose-phosphate shunt,
vitamin metabolismgi 147899332 glucan (1,4-alpha-),
branching enzyme 163 6 NP_000149 1,4-alpha-glucan-branching enzyme glycogen metabolism
gi 11493740 DNA polymeraseepsilon
50 5 NP_006222{ DNA polymerase epsilon catalyticsubunit A
DNA repair, cell cycle
gi 18202614 pterin-4-alpha-carbinolaminedehydratase
48 2 NP_000272{ pterin-4-alpha-carbinolaminedehydratase precursor
mRNA transcription, pterinmetabolism
gi 64659 elongation factor 1-alpha 47 3 NP_001393 elongation factor 1-alpha 1 translational regulationgi 148233056 pyruvate kinase, liver and
RBC46 2 NP_002645 pyruvate kinase isozymes M1/M2
isoform aglycolysis
gi 147902366 cathepsin C precursor 39 4 N-P_001107645{
dipeptidyl peptidase 1 isoform cprecursor
proteolysis
gi 147905009 pericentriolar material 1protein
38 9 NP_006188{ pericentriolar material 1protein
centrosome assembly
gi 71051388 matrix metalloproteinase-18precursor
38 3 NP_002412{ interstitial collagenaseisoform 1 preproprotein
proteolysis
gi 147902026 peroxiredoxin 6 38 3 NP_004896 peroxiredoxin-6 immunity and defense,antioxidation and free radical
removalgi 147906799 lethal giant larvae homolog 1 36 5 NP_004131 lethal(2) giant larvae protein
homolog 1regulated exocytosis,
neurogenesis, ectodermdevelopment
gi 148222987 glucoside xylosyltransferase2 precursor
35 1 N-P_001073862{
glucoside xylosyltransferase2 precursor
O-glycan processing
gi 147906817 tumor necrosis factor,alpha-induced protein 3
33 4 NP_006281{ tumor necrosis factoralpha-induced protein 3
anti-apoptosis, inflammatoryresponse, ubiquitin
conjugation pathwaygi 148229521 protein CIP2A homolog 32 3 NP_065941 protein CIP2A unknowngi 147904142 topoisomerase (DNA) II
binding protein 131 15 NP_008958 DNA topoisomerase
2-binding protein 1DNA replication, cell cycle,
chromatin packaging andremodeling
gi 51703567 MGC84331 protein 31 7 NP_078857 protein FAM184A isoform 1 unknown
Columns are as described in Table 2’s footnote.
Hepatic proteome in Xenopus laevis 1065
Bio
logy
Open
by guest on September 1, 2018http://bio.biologists.org/Downloaded from
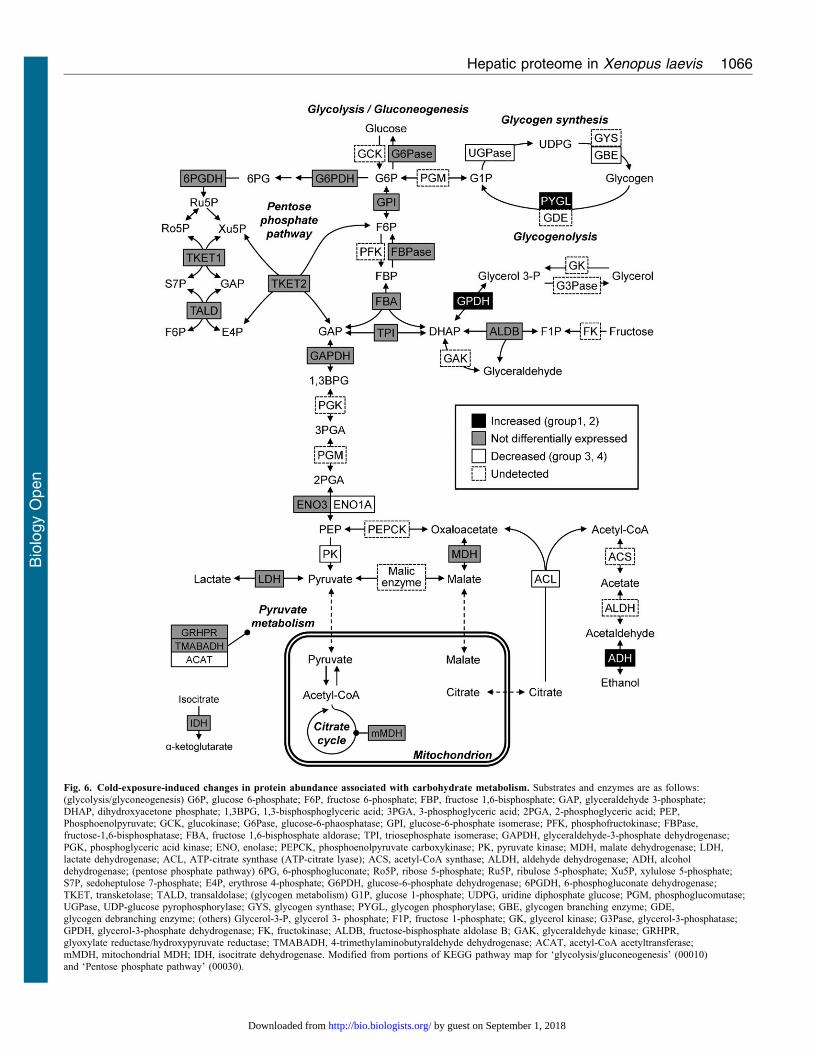
Fig. 6. Cold-exposure-induced changes in protein abundance associated with carbohydrate metabolism. Substrates and enzymes are as follows:(glycolysis/glyconeogenesis) G6P, glucose 6-phosphate; F6P, fructose 6-phosphate; FBP, fructose 1,6-bisphosphate; GAP, glyceraldehyde 3-phosphate;DHAP, dihydroxyacetone phosphate; 1,3BPG, 1,3-bisphosphoglyceric acid; 3PGA, 3-phosphoglyceric acid; 2PGA, 2-phosphoglyceric acid; PEP,Phosphoenolpyruvate; GCK, glucokinase; G6Pase, glucose-6-phaosphatase; GPI, glucose-6-phosphate isomerase; PFK, phosphofructokinase; FBPase,fructose-1,6-bisphosphatase; FBA, fructose 1,6-bisphosphate aldorase; TPI, triosephosphate isomerase; GAPDH, glyceraldehyde-3-phosphate dehydrogenase;
PGK, phosphoglyceric acid kinase; ENO, enolase; PEPCK, phosphoenolpyruvate carboxykinase; PK, pyruvate kinase; MDH, malate dehydrogenase; LDH,lactate dehydrogenase; ACL, ATP-citrate synthase (ATP-citrate lyase); ACS, acetyl-CoA synthase; ALDH, aldehyde dehydrogenase; ADH, alcoholdehydrogenase; (pentose phosphate pathway) 6PG, 6-phosphogluconate; Ro5P, ribose 5-phosphate; Ru5P, ribulose 5-phosphate; Xu5P, xylulose 5-phosphate;S7P, sedoheptulose 7-phosphate; E4P, erythrose 4-phosphate; G6PDH, glucose-6-phosphate dehydrogenase; 6PGDH, 6-phosphogluconate dehydrogenase;TKET, transketolase; TALD, transaldolase; (glycogen metabolism) G1P, glucose 1-phosphate; UDPG, uridine diphosphate glucose; PGM, phosphoglucomutase;UGPase, UDP-glucose pyrophosphorylase; GYS, glycogen synthase; PYGL, glycogen phosphorylase; GBE, glycogen branching enzyme; GDE,glycogen debranching enzyme; (others) Glycerol-3-P, glycerol 3- phosphate; F1P, fructose 1-phosphate; GK, glycerol kinase; G3Pase, glycerol-3-phosphatase;
GPDH, glycerol-3-phosphate dehydrogenase; FK, fructokinase; ALDB, fructose-bisphosphate aldolase B; GAK, glyceraldehyde kinase; GRHPR,glyoxylate reductase/hydroxypyruvate reductase; TMABADH, 4-trimethylaminobutyraldehyde dehydrogenase; ACAT, acetyl-CoA acetyltransferase;mMDH, mitochondrial MDH; IDH, isocitrate dehydrogenase. Modified from portions of KEGG pathway map for ‘glycolysis/gluconeogenesis’ (00010)and ‘Pentose phosphate pathway’ (00030).
Hepatic proteome in Xenopus laevis 1066
Bio
logy
Open
by guest on September 1, 2018http://bio.biologists.org/Downloaded from
newly produced erythrocytes (Maekawa et al., 2012). Some of
the differentially expressed liver proteins may play a role in this
phenomenon. Long-term exposure to 10 C (153 days) also causes
chronic pancytopenia in X. laevis (Maekawa et al., 2012). Our
proteomics approach is probably applicable to the investigation
of the response to cold over a longer period.
Consistent with the increase in fumarylacetoacetase and cold-
exposure-specific GO:BP terms (‘tyrosine catabolic process’ and
‘l-phenylalanine catabolic process’), free phenylalanine and
tyrosine levels in the liver decreased (Table 1, Figs 4B, 5A).
This finding suggests that amino acids were catabolized for
energy, ketogenesis, and/or gluconeogenesis, and it shows the
utility of a proteomics approach including GO analysis in X. laevis.
Increased PYGL and decreased hepatic glycogen were
observed (Table 2, Figs 6, 7B). PYGL is increased in winter
freeze-tolerant wood frogs (Rana sylvatica) that produce glucose
as a cryoprotectant from hepatic glycogen upon freezing (Kiss et
al., 2011). Rainbow smelt (Osmerus mordax) and some freeze-
tolerant terrestrial anurans such as grey tree frogs (Hyla
versicolor and Hyla chrysoscelis) produce glycerol as a
cryoprotectant from hepatic glycogen in winter (Driedzic et al.,
2006; Schmid, 1982; Irwin and Lee, 2003). Therefore, we
considered that glycogen breakdown in the liver of X. laevis
results in production of glucose or glycerol. The glucose level in
the liver, however, was decreased and liver and plasma glycerol
levels were not changed (Fig. 7A,E,F). Therefore, glycogen was
utilized in neither glucose nor glycerol production. Levels of PK,
which participates in glycolysis, were decreased upon cold
exposure, which suggests that glycolysis was inhibited by cold
exposure and that G6P derived from glycogen was not used for
energy production. Therefore, it is possible that the breakdown of
glycogen is utilized in other pathways. Even though cold-exposed
X. laevis presents hepatic iron accumulation that causes oxidative
stress, levels of NADPH, which is consumed for protection
against oxidative damage, were not decreased (Fig. 7C). This
finding suggests that G6P derived from glycogen may be utilized
for NADPH production by PPP for protection against oxidative
damage (Fig. 9). Considering that cold-induced apoptosis in
cultured rat hepatocytes and liver endothelial cells is mediated by
reactive oxygen species (Rauen et al., 1999), provision of
NADPH for protection from oxidative stress in the liver of cold-
exposed X. laevis may provide a mechanism for coping with cold
in freeze-intolerant ectothermic vertebrates.
The plasma glucose level was increased although the hepatic
glucose level decreased (Fig. 7B). Considering that the liver is
the only organ that actually releases glucose into the systemic
circulation, our findings may reflect a decrease in circulating
erythrocytes that consume glucose and decreased tissue glucose
consumption resulting from decreased metabolism under low
body temperature.
Levels of the endoplasmic reticulum (ER) molecular
chaperone, 78-kDa glucose-regulated protein (GRP78, also
known as BiP or Hspa5), were decreased under hypothermia in
the liver of X. laevis (Table 4). GRP78 was found to be similarly
decreased in freeze-tolerant wood frogs in the winter (Rana
sylvatica) and in hypothermic rat livers (Oda et al., 2012; Kiss et
Fig. 8. Comparisons of glucose, glycerol, NADP, and NADPH levels in the
liver and/or plasma between the control and cold-exposure conditions.
(A,B) Glucose levels in the liver (n53) and plasma (n55). (C,D) NADP andNADPH levels in the liver (n54). (E,F) Glycerol levels in the liver (n54) andplasma (n54). Each bar represents the s.e.m. *P,0.05 by Student’s t-test.
Fig. 7. Comparisons of free aromatic amino acid levels and glycogen levels
in the liver between the control and cold-exposure conditions. (A) Freeamino acids in the liver (n53). (B) Glycogen in the liver (n54). Each barrepresents the s.e.m. *P,0.05 by Student’s t-test.
Hepatic proteome in Xenopus laevis 1067
Bio
logy
Open
by guest on September 1, 2018http://bio.biologists.org/Downloaded from
al., 2011). In contrast, the content of GRP78 was found to be
increased among the liver proteins of hibernating mammals(Epperson et al., 2004; Epperson et al., 2010). GRP is induced
during ER stress derived from the disruption of calciumhomeostasis and accumulation of unfolded proteins in the ER,
and it protects the host cell against ER stress-induced cell death(Rao et al., 2002). Increased GRP expression is unique to
hibernating animals and appears to be important.
This study presents the first system-wide screen of hepatic
proteins in X. laevis. Low environmental temperature (i.e. lowbody temperature in X. laevis) induced modulation of the hepatic
proteome, particularly in pathways associated with carbohydratemetabolism and with other functions. Regarding carbohydrate
metabolism, this study suggests that utilization of hepaticglycogen for NADPH supply is associated with tolerance to
cold-induced oxidative stress.
This study not only provides insight into the mechanism of
tolerance to low body temperature but also demonstrates thatproteomic analysis of X. laevis is applicable despite the lack of
whole-genomic information because of the accumulation ofexpressed sequence tags (ESTs) in public databases. In X. laevis,
the liver is a major site for both metabolism and haematopoiesis.Therefore, the modulation of the hepatic proteome related to
metabolic pathways under low body temperature occurs at ahaematopoietic site. This study provides a model for
investigation of not only coping mechanisms for cold but also
interactions between haematopoietic and metabolic systems.
AcknowledgementsWe thank Dr Kentaro Miyoshi for advice and technical assistance onnanoLC–MS/MS analysis; Shun Maekawa for discussions andsuggestions.
FundingThis work was supported in part by a Grant-in-Aid for ScientificResearch from the Japan Society for the Promotion of Science; byHealth and Labour Sciences Research Grants from the Ministry ofHealth, Labour and Welfare (MHLW); by Research on Seeds forPublicly Essential Drugs and Medical Devices (from the MHLW); by
a Strategic Research Foundation Grant-aided Project for PrivateUniversities from the Japanese Ministry of Education, Culture,Sports, Science, and Technology (MEXT); and by WasedaUniversity grants for special research projects. Part of this studywas performed as a component of a Private University ‘‘High-TechResearch Center’’ project supported by MEXT.
Competing InterestsThe authors have no competing interests to declare.
ReferencesAizawa, Y., Nogawa, N., Kosaka, N., Maeda, Y., Watanabe, T., Miyazaki, H. and
Kato, T. (2005). Expression of erythropoietin receptor-like molecule in Xenopus
laevis and erythrocytopenia upon administration of its recombinant soluble form. J.
Biochem. 138, 167-175.
Anderson, L. and Seilhamer, J. (1997). A comparison of selected mRNA and proteinabundances in human liver. Electrophoresis 18, 533-537.
Bacon, B. R. and Britton, R. S. (1990). The pathology of hepatic iron overload: a freeradical-mediated process? Hepatology 11, 127-137.
Bechmann, L. P., Hannivoort, R. A., Gerken, G., Hotamisligil, G. S., Trauner,
M. and Canbay, A. (2012). The interaction of hepatic lipid and glucose metabolismin liver diseases. J. Hepatol. 56, 952-964.
Benjamini, Y. and Hochberg, Y. (1995). Controlling the false discovery rate: apractical and powerful approach to multiple testing. J. R. Stat. Soc. Series B Stat.
Methodol. 57, 289-300.
Boutilier, R. G. (2001). Mechanisms of cell survival in hypoxia and hypothermia.J. Exp. Biol. 204, 3171-3181.
Boutilier, R. G., Donohoe, P. H., Tattersall, G. J. and West, T. G. (1997).Hypometabolic homeostasis in overwintering aquatic amphibians. J. Exp. Biol. 200,387-400.
Burggren, W. W. and Warburton, S. (2007). Amphibians as animal models forlaboratory research in physiology. ILAR J. 48, 260-269.
Chegini, N., Aleporou, V., Bell, G., Hilder, V. A. and Maclean, N. (1979). Productionand fate of erythroid cells in anaemic Xenopus laevis. J. Cell Sci. 35, 403-415.
Chen, G., Gharib, T. G., Huang, C. C., Taylor, J. M., Misek, D. E., Kardia, S. L.,
Giordano, T. J., Iannettoni, M. D., Orringer, M. B., Hanash, S. M. et al. (2002).Discordant protein and mRNA expression in lung adenocarcinomas. Mol. Cell.
Proteomics 1, 304-313.
Cossins, A., Fraser, J., Hughes, M. and Gracey, A. (2006). Post-genomic approachesto understanding the mechanisms of environmentally induced phenotypic plasticity.J. Exp. Biol. 209, 2328-2336.
de Sousa Abreu, R., Penalva, L. O., Marcotte, E. M. and Vogel, C. (2009). Globalsignatures of protein and mRNA expression levels. Mol. Biosyst. 5, 1512-1526.
Dejong, C. H., van de Poll, M. C., Soeters, P. B., Jalan, R. and Olde Damink, S. W.
(2007). Aromatic amino acid metabolism during liver failure. J. Nutr. 137, 1579S-1585S; discussion 1597S-1598S.
Dennis, G., Jr, Sherman, B. T., Hosack, D. A., Yang, J., Gao, W., Lane, H. C. andLempicki, R. A. (2003). DAVID: Database for annotation, visualization, andintegrated discovery. Genome Biol. 4, 3.
Devreese, B., Sergeant, K., Van Bakel, N. H., Debyser, G., Van Beeumen, J.,
Martens, G. J. and Van Herp, F. (2010). A proteome map of the pituitarymelanotrope cell activated by black-background adaptation of Xenopus laevis.Proteomics 10, 574-580.
Driedzic, W. R., Clow, K. A., Short, C. E. and Ewart, K. V. (2006). Glycerolproduction in rainbow smelt (Osmerus mordax) may be triggered by low temperaturealone and is associated with the activation of glycerol-3-phosphate dehydrogenaseand glycerol-3-phosphatase. J. Exp. Biol. 209, 1016-1023.
Epperson, L. E., Dahl, T. A. and Martin, S. L. (2004). Quantitative analysis of liverprotein expression during hibernation in the golden-mantled ground squirrel. Mol.
Cell. Proteomics 3, 920-933.
Epperson, L. E., Rose, J. C., Carey, H. V. and Martin, S. L. (2010). Seasonalproteomic changes reveal molecular adaptations to preserve and replenish liverproteins during ground squirrel hibernation. Am. J. Physiol. 298, R329-R340.
Falcon-Perez, J. M., Lu, S. C. and Mato, J. M. (2010). Sub-proteome approach to theknowledge of liver. Proteomics Clin. Appl. 4, 407-415.
Ghazalpour, A., Bennett, B., Petyuk, V. A., Orozco, L., Hagopian, R., Mungrue,I. N., Farber, C. R., Sinsheimer, J., Kang, H. M., Furlotte, N. et al. (2011).Comparative analysis of proteome and transcriptome variation in mouse. PLoS Genet.
7, e1001393.
Gillardin, V., Silvestre, F., Dieu, M., Delaive, E., Raes, M., Thome, J. P. andKestemont, P. (2009). Protein expression profiling in the African clawed frogXenopus laevis tadpoles exposed to the polychlorinated biphenyl mixture aroclor1254. Mol. Cell. Proteomics 8, 596-611.
Gracey, A. Y. (2007). Interpreting physiological responses to environmental changethrough gene expression profiling. J. Exp. Biol. 210, 1584-1592.
Graff, D. and Allen, K. (1963). Glycogen content in Moniliformis dubius
(Acanthocephala). J. Parasitol. 49, 204-208.
Griffin, T. J., Gygi, S. P., Ideker, T., Rist, B., Eng, J., Hood, L. and Aebersold,
R. (2002). Complementary profiling of gene expression at the transcriptome andproteome levels in Saccharomyces cerevisiae. Mol. Cell. Proteomics 1, 323-333.
Fig. 9. Schematic models of the early response to cold exposure in the liver
of X. laevis. In cold exposure, hepatic glycogen and glucose are thought to be
used in the pentose phosphate pathway for NADPH supply rather than in energyproduction through glycolysis. This mechanism suppresses oxidative stressderived from iron accumulation caused by hepatic erythrocyte degradation.Abbreviations for the substrate and enzymes are shown in Fig. 6.
Hepatic proteome in Xenopus laevis 1068
Bio
logy
Open
by guest on September 1, 2018http://bio.biologists.org/Downloaded from

Hellsten, U., Harland, R. M., Gilchrist, M. J., Hendrix, D., Jurka, J., Kapitonov, V.,Ovcharenko, I., Putnam, N. H., Shu, S., Taher, L. et al. (2010). The genome of theWestern clawed frog Xenopus tropicalis. Science 328, 633-636.
Hochachka, P. W. (1986). Defense strategies against hypoxia and hypothermia. Science
231, 234-241.Honmyo, I. (2007). A pioneer with strong reliance on advanced technology. Asia Pac.
Biotech. News 11, 1033-1035.Hopkins, W. A. (2007). Amphibians as models for studying environmental change.
ILAR J. 48, 270-277.Hosack, D. A., Dennis, G., Jr, Sherman, B. T., Lane, H. C. and Lempicki, R. A.
(2003). Identifying biological themes within lists of genes with EASE. Genome Biol.
4, R70.Huang, D. W., Sherman, B. T. and Lempicki, R. A. (2009a). Systematic and
integrative analysis of large gene lists using DAVID bioinformatics resources. Nat.
Protoc. 4, 44-57.Huang, D. W., Sherman, B. T. and Lempicki, R. A. (2009b). Bioinformatics
enrichment tools: paths toward the comprehensive functional analysis of large genelists. Nucleic Acids Res. 37, 1-13.
Ibarz, A., Martın-Perez, M., Blasco, J., Bellido, D., de Oliveira, E. and Fernandez-
Borras, J. (2010). Gilthead sea bream liver proteome altered at low temperatures byoxidative stress. Proteomics 10, 963-975.
Ideker, T., Thorsson, V., Ranish, J. A., Christmas, R., Buhler, J., Eng, J. K.,
Bumgarner, R., Goodlett, D. R., Aebersold, R. and Hood, L. (2001). Integratedgenomic and proteomic analyses of a systematically perturbed metabolic network.Science 292, 929-934.
Irwin, J. T. and Lee, R. E., Jr. (2003). Geographic variation in energy storage andphysiological responses to freezing in the gray treefrogs Hyla versicolor andH. chrysoscelis. J. Exp. Biol. 206, 2859-2867.
King, M. W., Neff, A. W. and Mescher, A. L. (2009). Proteomics analysis ofregenerating amphibian limbs: changes during the onset of regeneration. Int. J. Dev.
Biol. 53, 955-969.Kiss, A. J., Muir, T. J., Lee, R. E., Jr and Costanzo, J. P. (2011). Seasonal variation in
the hepatoproteome of the dehydration and freeze-tolerant wood frog, Rana sylvatica.Int. J. Mol. Sci. 12, 8406-8414.
Kolkman, A., Daran-Lapujade, P., Fullaondo, A., Olsthoorn, M. M., Pronk, J. T.,Slijper, M. and Heck, A. J. (2006). Proteome analysis of yeast response to variousnutrient limitations. Mol. Syst. Biol. 2, 2006.0026.
Lai, K. K., Kolippakkam, D. and Beretta, L. (2008). Comprehensive and quantitativeproteome profiling of the mouse liver and plasma. Hepatology 47, 1043-1051.
Maekawa, S., Iemura, H., Kuramochi, Y., Nogawa-Kosaka, N., Nishikawa, H.,Okui, T., Aizawa, Y. and Kato, T. (2012). Hepatic confinement of newly producederythrocytes caused by low-temperature exposure in Xenopus laevis. J. Exp. Biol. 215,3087-3095.
Maier, T., Guell, M. and Serrano, L. (2009). Correlation of mRNA and protein incomplex biological samples. FEBS Lett. 583, 3966-3973.
Mehra, A., Lee, K. H. and Hatzimanikatis, V. (2003). Insights into the relationbetween mRNA and protein expression patterns: I. Theoretical considerations.Biotechnol. Bioeng. 84, 822-833.
Nogawa-Kosaka, N., Hirose, T., Kosaka, N., Aizawa, Y., Nagasawa, K., Uehara, N.,Miyazaki, H., Komatsu, N. and Kato, T. (2010). Structural and biological propertiesof erythropoietin in Xenopus laevis. Exp. Hematol. 38, 363-372.
Nogawa-Kosaka, N., Sugai, T., Nagasawa, K., Tanizaki, Y., Meguro, M., Aizawa, Y.,Maekawa, S., Adachi, M., Kuroki, R. and Kato, T. (2011). Identification oferythroid progenitors induced by erythropoietic activity in Xenopus laevis. J. Exp.
Biol. 214, 921-927.Nordlie, R. C., Foster, J. D. and Lange, A. J. (1999). Regulation of glucose production
by the liver. Annu. Rev. Nutr. 19, 379-406.Oda, T., Shimizu, K., Yamaguchi, A., Satoh, K. and Matsumoto, K. (2012).
Hypothermia produces rat liver proteomic changes as in hibernating mammals butdecreases endoplasmic reticulum chaperones. Cryobiology 65, 104-112.
Okui, T., Yamamoto, Y., Maekawa, S., Nagasawa, K., Yonezuka, Y., Aizawa, Y. and
Kato, T. (2013). Quantification and localization of erythropoietin-receptor-
expressing cells in the liver of Xenopus laevis. Cell Tissue Res. 353, 153-164.
Rao, R. V., Peel, A., Logvinova, A., del Rio, G., Hermel, E., Yokota, T., Goldsmith,
P. C., Ellerby, L. M., Ellerby, H. M. and Bredesen, D. E. (2002). Coupling
endoplasmic reticulum stress to the cell death program: role of the ER chaperone
GRP78. FEBS Lett. 514, 122-128.
Rauen, U., Polzar, B., Stephan, H., Mannherz, H. G. and de Groot, H. (1999). Cold-
induced apoptosis in cultured hepatocytes and liver endothelial cells: mediation by
reactive oxygen species. FASEB J. 13, 155-168.
Rose, J. C., Epperson, L. E., Carey, H. V. and Martin, S. L. (2011). Seasonal liver
protein differences in a hibernator revealed by quantitative proteomics using whole
animal isotopic labeling. Comp. Biochem. Physiol. 6D, 163-170.
Sahyun, M. (1931). Determination of glycogen in tissues. J. Biol. Chem. 93, 227-234.
Salt, R. W. (1949). Cold and cold-blooded animals. Can. J. Comp. Med. Vet. Sci. 13,
177-181.
Schmid, W. D. (1982). Survival of frogs in low temperature. Science 215, 697-698.
Schwanhausser, B., Busse, D., Li, N., Dittmar, G., Schuchhardt, J., Wolf, J., Chen,
W. and Selbach, M. (2011). Global quantification of mammalian gene expression
control. Nature 473, 337-342.
Serrano, J., Higgins, L., Witthuhn, B. A., Anderson, L. B., Markowski, T.,
Holcombe, G. W., Kosian, P. A., Korte, J. J., Tietge, J. E. and Degitz, S. J. (2010).
In vivo assessment and potential diagnosis of xenobiotics that perturb the thyroid
pathway: Proteomic analysis of Xenopus laevis brain tissue following exposure to
model T4 inhibitors. Comp. Biochem. Physiol. 5D, 138-150.
Shao, C., Liu, Y., Ruan, H., Li, Y., Wang, H., Kohl, F., Goropashnaya, A. V.,
Fedorov, V. B., Zeng, R., Barnes, B. M. et al. (2010). Shotgun proteomics analysis
of hibernating arctic ground squirrels. Mol. Cell. Proteomics 9, 313-326.
Shi, R., Kumar, C., Zougman, A., Zhang, Y., Podtelejnikov, A., Cox, J., Wisniewski,
J. R. and Mann, M. (2007). Analysis of the mouse liver proteome using advanced
mass spectrometry. J. Proteome Res. 6, 2963-2972.
Silva, J. E. (2006). Thermogenic mechanisms and their hormonal regulation. Physiol.
Rev. 86, 435-464.
Sonna, L. A., Fujita, J., Gaffin, S. L. and Lilly, C. M. (2002). Invited review: Effects of
heat and cold stress on mammalian gene expression. J. Appl. Physiol. 92, 1725-1742.
Tabata, T., Sato, T., Kuromitsu, J. and Oda, Y. (2007). Pseudo internal standard
approach for label-free quantitative proteomics. Anal. Chem. 79, 8440-8445.
Tinsley, R. C. and McCoid, M. J. (1996). Feral populations of Xenopus outside of
Africa. In The Biology Of Xenopus (ed. R. C. Tinsley and H. R. Kobel), pp. 81-94.
New York, NY: Oxford University Press.
Tinsley, R. C., Loumont, C. and Kobel, H. R. (1996). Geographical distribution and
ecology. In The Biology Of Xenopus (ed. R. C. Tinsley and H. R. Kobel), pp. 35-60.
New York, NY: Oxford University Press.
Trzcionka, M., Withers, K. W., Klingenspor, M. and Jastroch, M. (2008). The
effects of fasting and cold exposure on metabolic rate and mitochondrial proton leak
in liver and skeletal muscle of an amphibian, the cane toad Bufo marinus. J. Exp. Biol.
211, 1911-1918.
van Herp, F., van Bakel, N. H., Coenen, A. J., Sergeant, K., Devreese, B. and
Martens, G. J. (2008). Physiological manipulation of cellular activity tunes protein
and ultrastructural profiles in a neuroendocrine cell. J. Endocrinol. 198, 607-616.
Wamelink, M. M., Struys, E. A. and Jakobs, C. (2008). The biochemistry, metabolism
and inherited defects of the pentose phosphate pathway: a review. J. Inherit. Metab.
Dis. 31, 703-717.
Wang, X., Nookala, S., Narayanan, C., Giorgianni, F., Beranova-Giorgianni, S.,
McCollum, G., Gerling, I., Penn, J. S. and Jablonski, M. M. (2009). Proteomic
analysis of the retina: removal of RPE alters outer segment assembly and retinal
protein expression. Glia 57, 380-392.
Hepatic proteome in Xenopus laevis 1069
Bio
logy
Open
by guest on September 1, 2018http://bio.biologists.org/Downloaded from