simulation of aerosol optical properties over a tropical urban site in
TRANSCRIPT
Ann. Geophys., 29, 955–963, 2011www.ann-geophys.net/29/955/2011/doi:10.5194/angeo-29-955-2011© Author(s) 2011. CC Attribution 3.0 License.
AnnalesGeophysicae
Simulation of aerosol optical properties over a tropical urban site inIndia using a global model and its comparison with groundmeasurements
D. Goto1, K. V. S. Badarinath2, T. Takemura3, and T. Nakajima1
1Atmosphere and Ocean Research Institute, University of Tokyo, Kashiwa, Chiba, Japan2Atmospheric Science Section, National Remote Sensing Centre, Hyderabad, India3Research Institute for Applied Mechanics, Kyusyu University, Kasuga, Fukuoka, Japan
Received: 8 November 2010 – Revised: 23 May 2011 – Accepted: 30 May 2011 – Published: 31 May 2011
Abstract. Aerosols have great impacts on atmospheric en-vironment, human health, and earth’s climate. Therefore,information on their spatial and temporal distribution is ofparamount importance. Despite numerous studies have ex-amined the variation and trends of BC and AOD over In-dia, only very few have focused on their spatial distribu-tion or even correlating the observations with model sim-ulations. In the present study, a three-dimensional aerosoltransport-radiation model coupled with a general circulationmodel. SPRINTARS, simulated atmospheric aerosol dis-tributions including BC and aerosol optical properties, i.e.,aerosol optical thickness (AOT),Angstrom Exponent (AE),and single scattering albedo (SSA). The simulated results arecompared with both BC measurements by aethalometer andaerosol optical properties measured by ground-based skyra-diometer and by satellite sensor, MODIS/Terra over Hyder-abad, which is a tropical urban area of India, for the year2008. The simulated AOT and AE in Hyderabad are foundto be comparable to ground-based measured ones. The simu-lated SSA tends to be higher than the ground-based measure-ments. Both these comparisons of aerosol optical propertiesbetween the simulations with different emission inventoriesand the measurements indicate that, firstly the model uncer-tainties derived from aerosol emission inventory cannot ex-plain the gaps between the simulations and the measurementsand secondly the vertical transport of BC and the treatmentof BC-containing particles can be the main issue in the globalmodel to solve the gap.
Keywords. Atmospheric composition and structure(Aerosols and particles)
Correspondence to:D. Goto([email protected])
1 Introduction
Atmospheric aerosols have great impacts on the environ-ment, human health, and earth’s climate (Forster et al., 2007).In Asia, especially, atmospheric black carbon (BC) emissionsare modulated by anthropogenic activities related to fossil-fuel combustion, biomass burning and industrial activities(Ramanathan et al., 2008). Also South Asia, apart from otherindustrial regions in the world such as North America andEurope, is located in subtropical or tropical regions wheredry and wet seasons arrive periodically. In the dry season,biomass burning and other combustion processes often oc-cur and emit a large amount of BC and organic carbon (OC)in the atmosphere (Bond et al., 2004). Biomass burning hasbeen reported to be the main cause of the dense brown cloudsthat plague South Asia each winter and affects the health ofpeople inhaling the pollutants, causing bronchitis and asthma(Gustafson et al., 2009). BC, which is the optically absorb-ing part of carbonaceous aerosols, has significant optical andradiative properties, as compared to the other constituents,i.e., sulfate and nitrate. The BC emission is the secondstrongest impact on global warming, next to carbon dioxideemission according to Ramanathan and Carmichael (2008);it can heat the atmosphere and then can cause changes in theatmospheric circulation (Tripathi et al., 2007). However, theradiative effects of BC are one of the largest uncertaintiesin climate modeling (Andreae et al., 2005; Ramanathan etal., 2007). In order to improve the model simulations, mea-surements of both BC and aerosol optical information are re-quired. Several studies on continuous and simultaneous mea-surements of both BC and aerosol optical information overthe South-Asian region are reported in literature (Ganguly etal., 2006; Sreekanth et al., 2007; Safai et al., 2007; Gadhaviand Jayaraman, 2010; Singh et al., 2010). Validation stud-ies on aerosol model simulations with these measurements
Published by Copernicus Publications on behalf of the European Geosciences Union.

956 D. Goto et al.: Simulation of aerosol optical properties over a tropical urban site
has been less attempted in this region except for few studies(Adhikari et al., 2007), which validated their simulation re-sults with the observed ones over South Asia during almostone year.
Evaluation of simulated aerosol optical properties inglobal models with measurements is very important forproper estimation of the aerosol radiative forcing. In the esti-mation of the aerosol radiative focing, the AOT and the SSAare two important parameters. In the present study, observeddata on these parameters in Hyderabad, which is located ina tropical urban area of India (Badarinath et al., 2007a, b),are used for model evaluation by comparing them with simu-lated aerosol optical properties using a global aerosol model,SPRINTARS (Takemura et al., 2000, 2002, 2005, 2009).
2 Methodology
2.1 Data collection
The study area of Hyderabad, India is located between17◦10′ and 17◦50′ N and 78◦10′ and 78◦50′ E. Hyderabad isthe fifth largest city of India, highly urbanized with popula-tion of 5 751 780 inhabitants (census 2001). The city is influ-enced not only by vehicular pollutants, but also by industrialas well as biomass-burning emissions. The climate of theregion is semi-arid with a total rainfall of∼700 mm occur-ring mostly during the monsoon season in the June–Octoberperiod. The climatology of the area experiences four dom-inant seasons each year, winter (December–February), pre-monsoon (March–May), monsoon (June–September), andpost-monsoon (October–November). The measurements re-ported in this work were carried out under clear-sky con-ditions in the premises of the National Remote SensingCentre (NRSC) campus located at Balanagar (17◦28′ N and78◦26′ E) well within the urban center of Hyderabad.
BC aerosols measurements were carried out using sevenchannels aethalometer (model AE31, Magee Scientific,USA) at NRSC. The aethalometer uses quartz fiber filtertape through which air is passed for a fixed amount of time(typically 5 min) with a selected constant flow rate (2.9 l perminute). At the end of each measurement cycle, changes inthe filter transmission at seven wavelengths (370 nm, 470 nm,520 nm, 590 nm, 660 nm, 880 nm and 950 nm) are recorded.The 880 nm channel is considered as standard channel forBC measurement (Wiengartner et al., 2003). BC mass con-centrations are estimated by the change in transmittance ofthis quartz fiber tape over which the deposition of the par-ticles takes place. The beam attenuation (ATN) providesa measure of the absorbing mass. The mass concentrationof BC is obtained from an incremental ATN between twomeasurements using the effective specific mass absorptioncross-section value of 16.6 m2 g−1 for 880 nm channel forthe BC deposited on the filter area of the sample spot and theflow rate. The uncertainty in BC measurement will be in the
range 0.040–0.060 µg m−3. The limitations and uncertaintiesof aethalometer in BC measurements and corrections neededare well documented in the recent literature (Hansen et al.,1984; Arnott et al., 2005; Schmid et al., 2006).
Aerosol observations were carried out using a PREDESun/sky radiometer (POM-01L, PREDE Incorporated,Japan) during January–December 2008. This instrumentis widely used in the SKYNET aerosol radiation networkin the world (http://atmos.cr.chiba-u.ac.jp/aerosol/skynet) forSun/sky observation. This instrument makes measurementsof both direct and diffuse sky radiances at pre-defined scatter-ing angles at regular intervals. The Sun/sky radiometer wasoperated on clear-sky days at 10-min interval. The Sun/skyradiance data were analysed with the radiative transfer inver-sion code SkyRad Pack version 4.2 (Nakajima et al., 1996;http://www.ccsr.u-tokyo.ac.jp/∼clastr/) to retrieve AOT, AE,SSA and volume size distribution. AOT is calculated onthe basis of the Beer-Lambert-Bouger law with correctionfor Rayleigh scattering, the change of Sun-Earth distance,and ozone optical depth. The sky radiometer was operatedin disc scan mode to estimate solid view angles at differentwavelengths as part of a calibration procedure recommendedby the manufacturer. Detailed calibration and data reduc-tion procedures for this instrument were described elsewhere(Nakajima et al., 1996; Pandithurai et al., 2007).
2.2 Model description
In this study, we use a global three-dimensional aerosoltransport-radiation model, the Spectral Radiation-TransportModel for Aerosol Species (SPRINTARS), which is de-scribed elsewhere (Takemura et al., 2000, 2002, 2005, 2009).The SPRINTARS has been implemented in an atmosphericgeneral circulation model (AGCM) developed by the Cen-ter for Climate System Research of the University of Tokyo,National Institute for Environmental Studies, and the Fron-tier Research Center for Global Change (K-1 Model Devel-opers, 2004; hereafter referred to as MIROC AGCM). Theversion of SPRINTARS is 3.84, which is the latest versionsince August 2010. In this study, we use T42 horizontal res-olution (approximately 2.8◦ by 2.8◦ in latitude and longitude)and 20 layers of the vertical resolution. The time step is setto 20 min. The model calculates mass mixing ratios of themain tropospheric aerosols, i.e., carbonaceous aerosol (BCand OC), sulfate, soil dust, sea salt, and the precursor gasesof sulfate, i.e., sulfur dioxide (SO2) and dimethylsulfide. Theaerosol transport processes include emission, advection, dif-fusion, sulfur chemistry, wet deposition, and gravitationalsettling. In all experiments, the monthly averaged global dis-tributions for sea-surface temperature (SST) and sea ice wereprovided by Hadley Centre, Met Office, UK. For proper sim-ulations of the aerosol distribution, all experiments were con-ducted with NCAR/NCEP six-hourly nudged meteorologicalfields on winds, water vapor, and temperature.
Ann. Geophys., 29, 955–963, 2011 www.ann-geophys.net/29/955/2011/

D. Goto et al.: Simulation of aerosol optical properties over a tropical urban site 957
Fig. 1. Mean annual BC emissions for 2008 as used in the AeroComstandard experiment.
The radiation transfer with a k-distribution scheme,MSTRN-8, in the MIROC AGCM can handle scattering,absorption, and emission by aerosol and cloud particles, aswell as absorption by gaseous constituents (Nakajima et al.,2000). The particles are treated as external mixtures exceptfor carbonaceous aerosols. The secondary OC and 50 % BCmass from fossil fuel source are treated as externally mixedparticles, but other carbonaceous particles are treated as in-ternal mixtures of BC and primary OC. For soil dust andsea salt aerosols, mixing ratios are calculated for various sizebins from 0.1 to 10 µm (Takemura et al., 2009). On the otherhand, for carbonaceous and sulfate aerosols, the dry moderadii are set to 0.1 and 0.0695 µm, respectively (Takemuraet al., 2002). Aerosol densities are set to the same values asTakemura et al. (2002). The scattering properties by Mie the-ory used in this study are described elsewhere (Schutgens etal., 2010).
Emission inventories of aerosols (primary OC and BC)and its precursors (SO2) used in the model simulationsare widely used in the AeroCom (AC) project. Theanthropogenic primary organic aerosol and BC emis-sions are based on Bond et al. (2004). The spa-tial distribution of anthropogenic BC emission invento-ries in the AC emission inventory is shown in Fig. 1.The anthropogenic SO2 emissions are based on EDGAR32FT2000 database (http://www.pbl.nl/en/themasites/edgar/emissiondata/edgar32ft2000/index.html). Biomass burn-ing emissions in each month is based on the fire maps derivedfrom MODIS. The oxidant concentrations such as ozoneand hydroxyl radical, which are not predicted in SPRINT-ARS but are needed to calculate sulfate chemistry, are givenby a global chemical transport model, CHASER by Sudo
Fig. 2. BC mass concentration in Hyderabad for the year 2008.There are two simulations: SPRINTARS with the AeroCom emis-sions (solid line with white circles) and with the modified emissionsby scaling a factor of 20 around Hyderabad (solid line with blackcircle) and skyradiometer measurements (dashed line with crosses).
Fig. 3. As in Fig. 1, but for AOT except for MODIS/Terra observa-tions (dashed line with black triangles).
et al. (2002), which also was implemented in the MIROCAGCM. In addition to the standard AC emission inventory,we have added scaling factor of 20 to the AC inventory in thegrid including the Hyderabad measurement site and gener-ated modified AC emission inventory. This has been carriedout to account for the higher BC concentrations over the mea-surement site compared to the standard AC emission inven-tory. Model simulations are carried out with the standard ACemission inventory and the modified AC emission inventory.
www.ann-geophys.net/29/955/2011/ Ann. Geophys., 29, 955–963, 2011
958 D. Goto et al.: Simulation of aerosol optical properties over a tropical urban site
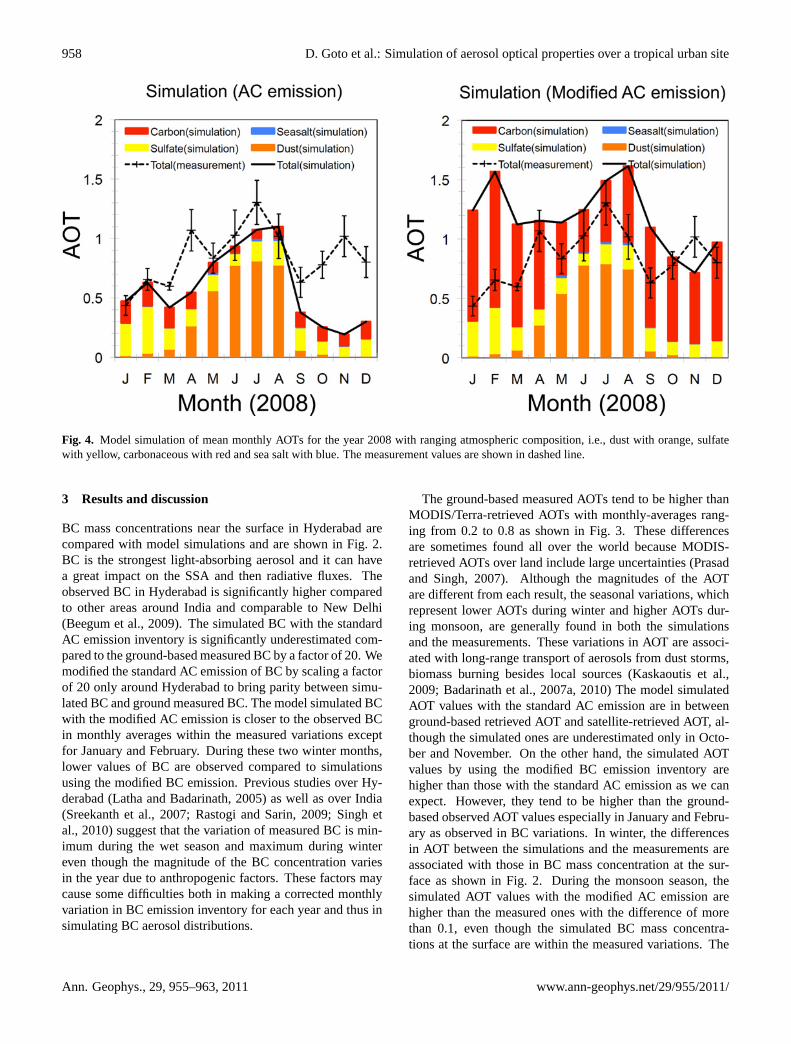
Fig. 4. Model simulation of mean monthly AOTs for the year 2008 with ranging atmospheric composition, i.e., dust with orange, sulfatewith yellow, carbonaceous with red and sea salt with blue. The measurement values are shown in dashed line.
3 Results and discussion
BC mass concentrations near the surface in Hyderabad arecompared with model simulations and are shown in Fig. 2.BC is the strongest light-absorbing aerosol and it can havea great impact on the SSA and then radiative fluxes. Theobserved BC in Hyderabad is significantly higher comparedto other areas around India and comparable to New Delhi(Beegum et al., 2009). The simulated BC with the standardAC emission inventory is significantly underestimated com-pared to the ground-based measured BC by a factor of 20. Wemodified the standard AC emission of BC by scaling a factorof 20 only around Hyderabad to bring parity between simu-lated BC and ground measured BC. The model simulated BCwith the modified AC emission is closer to the observed BCin monthly averages within the measured variations exceptfor January and February. During these two winter months,lower values of BC are observed compared to simulationsusing the modified BC emission. Previous studies over Hy-derabad (Latha and Badarinath, 2005) as well as over India(Sreekanth et al., 2007; Rastogi and Sarin, 2009; Singh etal., 2010) suggest that the variation of measured BC is min-imum during the wet season and maximum during wintereven though the magnitude of the BC concentration variesin the year due to anthropogenic factors. These factors maycause some difficulties both in making a corrected monthlyvariation in BC emission inventory for each year and thus insimulating BC aerosol distributions.
The ground-based measured AOTs tend to be higher thanMODIS/Terra-retrieved AOTs with monthly-averages rang-ing from 0.2 to 0.8 as shown in Fig. 3. These differencesare sometimes found all over the world because MODIS-retrieved AOTs over land include large uncertainties (Prasadand Singh, 2007). Although the magnitudes of the AOTare different from each result, the seasonal variations, whichrepresent lower AOTs during winter and higher AOTs dur-ing monsoon, are generally found in both the simulationsand the measurements. These variations in AOT are associ-ated with long-range transport of aerosols from dust storms,biomass burning besides local sources (Kaskaoutis et al.,2009; Badarinath et al., 2007a, 2010) The model simulatedAOT values with the standard AC emission are in betweenground-based retrieved AOT and satellite-retrieved AOT, al-though the simulated ones are underestimated only in Octo-ber and November. On the other hand, the simulated AOTvalues by using the modified BC emission inventory arehigher than those with the standard AC emission as we canexpect. However, they tend to be higher than the ground-based observed AOT values especially in January and Febru-ary as observed in BC variations. In winter, the differencesin AOT between the simulations and the measurements areassociated with those in BC mass concentration at the sur-face as shown in Fig. 2. During the monsoon season, thesimulated AOT values with the modified AC emission arehigher than the measured ones with the difference of morethan 0.1, even though the simulated BC mass concentra-tions at the surface are within the measured variations. The
Ann. Geophys., 29, 955–963, 2011 www.ann-geophys.net/29/955/2011/

D. Goto et al.: Simulation of aerosol optical properties over a tropical urban site 959
Fig. 5. Mean annual AOT distribution around India for the year 2008.(a) Model simulation with AC emission inventory.(b) Modelsimulation with modified AC emission inventory.(c) MODIS/Terra.
annual-mean AOT is calculated to be 0.59 in the simulationwith the AC emission, 1.18 in the simulation with the mod-ified emission, 0.85 in the ground-based observation, and0.37 in the MODIS/Terra retrieval. To investigate aerosolcomposition, we show simulated AOTs in terms of chem-ical species (Fig. 4). Figure 4 indicates that an increasein AOT around Hyderabad during April to August corre-sponds to an increase in dust component. The summertimehigh AOTs correspond to dust composition in our simulationwith a maximum of 0.81. This increased dust is due to longrange transport of aerosols from dust storm events located faraway at∼2000 km over region covering Iran and Pakistan asshown in satellite observation of Fig. 5 and previous studies(e.g., Badarinath et al., 2007a). In annual-averages, the AOTaround western India is affected by such dust storms from theMiddle East Asia. These higher AOTs over the Middle EastAsia are also obtained both by model and MODIS/Terra, de-spite the large spatial difference. Comparison in AOT dueto carbonaceous aerosol between two different simulationsshows that the annual average AOTs of the carbonaceousaerosol range from 0.12 (AC) to 0.71 (modified AC). The
difference in monthly-average AOT values between two sim-ulations is calculated to be 0.30 for the wet season corre-sponding to June and 0.94 for February.
Model-predicted AEs in both the emission inventories arevery similar to observed AE in term of the magnitudes andseasonality (Fig. 6). The differences in AE between simu-lations with two emission inventories exist during the wetseason, because of an increase in OC of high scattering ef-ficiency as associated with an increase in the BC emission.Model-simulated SSAs in the standard AC emission tend tobe higher than the simulated ones in the modified AC emis-sion and observed SSAs, whereas the seasonality of the sim-ulated SSAs in the AC emission is comparable to the ob-served ones except for January, February, and March. Theskyradiometer-retrieved SSA may have errors due to the re-trieval algorithm as suggested in literature (Che et al., 2008).The magnitudes of the simulated SSA with the modified ACemission are better than those with the standard AC emis-sion, whereas the seasonality is not good especially duringsummer. This is because the increase in SSA during summeris primarily caused by an increase in scattering components
www.ann-geophys.net/29/955/2011/ Ann. Geophys., 29, 955–963, 2011

960 D. Goto et al.: Simulation of aerosol optical properties over a tropical urban site
Fig. 6. Monthly variations in AE from two model simulations withthe AC emissions (solid line with white circles), modified AC emis-sions (solid line with black circles) and skyradiometer observations(dashed line with crosses) for the year 2008.
Fig. 7. As in Fig. 6, but for SSA.
associated with aerosol’s hygroscopic growth, which cangive larger AOT as indicated in Fig. 4. The differences inSSA between model simulations and observations may becaused by treatment of the mixing process between BC andother scattering components, which can have a large impacton SSA values in the range of±0.05 (Shiraiwa et al., 2008).
Finally, the correlation between AE-SSA and BC-SSA areinvestigated to know how columnar SSA is determined byBC or dust components and how BC aerosols at the surfacedo affect the columnar SSA values. Figures 8 and 9 showscatter plots of AE-SSA and BC-SSA with the measurementsand the simulations using two emission inventories over Hy-derbad in 2008 except for January to March due to unreli-
Fig. 8. Scatter plot of AE vs SSA over Hyderabad in 2008. Blackcircles indicate simulations both with the AC and the modified emis-sions and crosses indicate observations. The lines are best fits to thedata points (thick line: black circles, dashed line: crosses).
Fig. 9. As in Fig. 8, but for a scatter plot of BC vs. SSA.
able values of measured SSA in these month. In Fig. 8,the positive trend indicates that columnar absorption is de-termined primarily by large-size absorbing particles, that isdust, whereas the negative trend shows that columnar absorp-tion is determined primarily by small-size absorbing parti-cles, that is BC. The correlation between AE and SSA in themeasurements is positive with a regression slope of+0.10and a correlation coefficient (R2) of 0.73, whereas that inthe simulations is slightly negative with a regression slopeof −0.01 and aR2 of 0.01. The reverse trend of AE-SSAbetween the simulations and the measurements indicates dif-ferences in contributions of columnar BC in the small parti-cle to columnar absorption over Hyderabad. Other finding is
Ann. Geophys., 29, 955–963, 2011 www.ann-geophys.net/29/955/2011/
D. Goto et al.: Simulation of aerosol optical properties over a tropical urban site 961
that model results do not have a correlation between AE andSSA, which is so different from the measurement results. InFig. 9, the positive correlation between BC and SSA sug-gests that increases in BC at the surface do not correspond todecreases in SSA in the column burden, that means that sur-face BC concentration is not the major factor to determinethe columnar variations in absorption. The negative correla-tion suggests that changes in BC at the surface could stronglymodulate the columnar absorption. The correlation betweenBC and SSA in the measurements is positive with a regres-sion slope of+0.00 and aR2 of 0.58, whereas that in the sim-ulations is slightly negative with a regression slope of−0.00and aR2 of 0.59. The reverse trend of BC-SSA betweenthe simulations and the measurements indicates differencesin response of BC at the surface to column absorption overHyderabad.
These results lead us to the conclusion that in the simu-lations the increase in BC at the surface causes the increasein columnar absorption and the decrease in columnar SSAvalues over Hyderabad, whereas in the measurements the in-crease in BC at the surface does not cause the increase incolumnar absorption and the columnar absorption can be de-termined not by small-size absorbing particle, BC, but bylarge-size absorbing particle, dust. This gap can be partlybecause vertical distributions of the simulated BC are notmatched with those of the measured BC, that is, the simu-lated BC at the surface is underestimated due to large verti-cal convection in the boundary layer. Other possible reasonis that the assumed mixing state in the BC and other parti-cles does not represent that in the real atmosphere, that isthe model BC particles may have stronger absorptions. Inaddition, this is possibly because the global model with thecoarse size of the grid (∼300 km in this study) cannot exactlycompare with point observations on the surface. These prob-lems are expected to exist over India in other global models,because detailed validations over India were not performedmainly because the continuous measurements are limitedfor validating performances of global models, as suggestedby Koch et al. (2009), who compared BC simulations fromabout 20 global models. Furthermore, the aerosol burdens in-cluding BC are very high and complex over India comparedto other areas (Ramanathan et al., 2008) and thus making itdifficult to compare simulation results with measurements.
In order to estimate an impact of the differences in AOTand SSA between the simulations and the measurements onthe aerosol direct radiative forcing (ADRF), we estimated theADRF with an offline radiative transfer model, Rstar, whichwas developed by Nakajima and Tanaka (1986, 1988) and isvery similar to the radiation code MSTRN used in this study.Using the averaged values of AOT and SSA from Figs. 3and 7, the differences in ADRF between the simulations andthe measurements at the surface under the clear sky is es-timated to be about+12 W m−2 (July–August) and about+15 W m−2 (October–December), respectively. In conclu-sion, the differences in AOT and SSA between the simula-
tions and the measurements can strongly affect the ADRFand the impact of the ADRF is not so small. Therefore, wehave to reduce the differences between the simulations andthe measurements in order to estimate the proper model cal-culation of the ADRF.
4 Conclusions
In this study, we compared global model simulation ofaerosol optical thickness (AOT),Angstrom Exponent (AE),and single scattering albedo (SSA) with ground measure-ments over Hyderabad, a tropical urban site in India. Theresults of study suggested that:
1. AOT and AE in the model simulations are comparableto ground-based measurements.
2. SSA in the simulations tends to be higher than that inthe ground based measurements and has been attributedto a treatment of BC-containing particles in the globalmodel.
One of the largest uncertainties in the simulations is emissioninventory, which was changed with different magnitudes inthis study to match simulated BC mass concentrations at thesurface to measured ones. A comparison between the simula-tions with the two emission inventories showed that the sim-ulated AOT and SSA in the column were sometimes differentfrom the measured ones. This could be due to vertical trans-port pattern, assumed optical properties of BC-containingparticles, and spatial resolution in model as well as possiblemeasurement errors for SSA values.
Acknowledgements.The authors express their sincere thanks toDr. Diehl and AeroCom project for providing emission data sets.The Collection 5 MODIS aerosol products from NASA MODISteam, the reanalysis data from NCEP/OAR/ESRL PSD, Boul-der, Colorado, USA, and the HadISST data from Hadley Cen-tre, Met Office, UK are gratefully acknowledged. The modelsimulations were performed using the National Institute for En-vironmental Studies, Japan, supercomputer system (NEC SX-8R/128M16). Part of the authors was supported by projects(RECCA, JAXA/EarthCARE, MEXT/VL for Climate SystemDiagnostics, MOE/Global Environment Research Fund B-083,NIES/GOSAT, and JST/CREST).
Topical Editor P. M. Ruti thanks two anonymous referees fortheir help in evaluating this paper.
References
Adhikary, B., Carmichael, G. R., Tang, Y. H., Leung, L. R., Qian,Y., Schauer, J. J., Stone, E. A., Ramanathan, V., and Ramana,M. V.: Characterization of the seasonal cycle of south Asianaerosols: A regional-scale modeling analysis, J. Geophys. Res.,112, D22S22,doi:10.1029/2006JD008143, 2007.
Andreae, M. O., Jones, C. J., and Cox, P. M.: Strong present-dayaerosol cooling implies a hot future, Nature, 435, 1187–1190,2005.
www.ann-geophys.net/29/955/2011/ Ann. Geophys., 29, 955–963, 2011
962 D. Goto et al.: Simulation of aerosol optical properties over a tropical urban site
Arnott, W. P., Hamasha, K., Moosmuller, H., Sheridan, P. J., andOrgen, J. A.: Towards aerosol light-absorption measurementswith a 7-wavelength aethalometer evaluation with a photoacoutisinstrument and 3-wavelength Nephelometer, Aerosol Sci. Tech-nol., 39, 17–25, 2005.
Badarinath, K. V. S., Kharol, S. K., Kaskaoutis, D. G., and Kam-bezidis, H. D.: Case study of a dust storm over Hyderabad area,India: its impact on solar radiation using satellite data and groundmeasurements, Sci. Total Environ., 384(1–3), 316–332, 2007a.
Badarinath, K. V. S., Kharol, S. K., Kaskaoutis, D. G., and Kam-bezidis, H. D.: Influence of atmospheric aerosols on solar spec-tral irradiance in an urban area, J. Atmos. Solar-Terr. Phys., 69,589–599, 2007b.
Badarinath, K. V. S., Kharol, S. K., Kaskaoutis, D. G., Sharma, A.R., Ramaswamy, V., and Kambezidis, H. D.: Long-range trans-port of dust aerosols over the Arabian Sea and Indian region – Acase study using satellite data and ground-based measurements,Global Planet. Change, 72, 164–181, 2010.
Beegum, S. N., Moorthy, K. K., Babu, S. S., Satheesh, S. K., Vinoj,V., Badarinath, K. V. S., Safai, P. D., Devara, P. C. S., Singh, S.,Vinod, U. C., and Pant, D. P.: Spatial distribution of aerosol blackcarbon over India during pre-monsoon season, Atmos. Environ.,43, 1071–1078, 2009.
Bond, T. C., Streets, D. G., Yarber, K. F., Nelson, S. M., Woo, J.-H.,and Klimont, Z.: A technology-based global inventory of blackand organic carbon emissions from combstion, J. Geophys. Res.,109, D14203,doi:10.1029/2003JD003697, 2004.
Che, H., Shi, G., Uchiyama, A., Yamazaki, A., Chen, H., Goloub,P., and Zhang, X.: Intercomparison between aerosol opticalproperties by a PREDE skyradiometer and CIMEL sunphotome-ter over Beijing, China, Atmos. Chem. Phys., 8, 3199–3214,doi:10.5194/acp-8-3199-2008, 2008.
Forster, P., Ramaswamy, V., Artaxo, P., Berntsen, T., Betts, R., Fa-hey, D. W., Haywood, J., Lean, J., Lowe, D. C., Myhre, G.,Nganga, J., Prinn, R., Raga, G., Schulz, M., and Van Dorland,R.: Changes in Atmospheric Constituents and in Radiative Forc-ing, in: Climate Change 2007: The Physical Science Basis. Con-tribution of Working Group I to the Fourth Assessment Reportof the Intergovernmental Panel on Climate Change, edited by:Solomon, S., Qin, D., Manning, M., Chen, Z., Marquis, M., Av-eryt, K. B., Tignor, M., and Miller, H. L., Cambridge UniversityPress, Cambridge, United Kingdom and New York, NY, USA,2007.
Gadhavi, H. and Jayaraman, A.: Absorbing aerosols: contributionof biomass burning and implications for radiative forcing, Ann.Geophys., 28, 103–111,doi:10.5194/angeo-28-103-2010, 2010.
Ganguly, D., Jayaraman, A., and Gadhavi, H.: Physical and op-tical properties of aerosols over an urban location in westernIndia: Seasonal variablities, J. Geophys. Res., 111, D24206,doi:10.1029/2006JD007392, 2006
Gustafsson, O., Krusa, M., Zencak, Z., Sheesley, R. J., Granat,L., Engstrom, E., Praveen, P. S., Rao, P. S. P., Leck, C., andRodhe, H.: Brown Clouds over South Asia: Biomass or FossilFuel Combustion?, Science, 323, 495–498, 2009.
Hansen, A. D. A., Rosen, H., and Novakov, T.: The aethalometer:an instrument for the real-time measurements of optical absorp-tion by aerosol particles, Sci. Total Environ., 36, 191–196, 1984.
K-1 Model Developers: K-1 coupled GCM (MIROC) description,K-1 Tech. Rep. 1, edited by: Hasumi, H. and Emori, S., Univ. of
Tokyo, Tokyo, 2004.Kaskaoutis, D. G., Badarinath, K. V. S., Kharol, S. K., Sharma, A.
R., and Kambezidis, H. D.: Variations in the aerosol optical prop-erties and types over the tropical urban site of Hyderabad, India,J. Geophys. Res., 114, D22204,doi:10.1029/2009JD012423,2009.
Koch, D., Schulz, M., Kinne, S., McNaughton, C., Spackman, J.R., Balkanski, Y., Bauer, S., Berntsen, T., Bond, T. C., Boucher,O., Chin, M., Clarke, A., De Luca, N., Dentener, F., Diehl, T.,Dubovik, O., Easter, R., Fahey, D. W., Feichter, J., Fillmore, D.,Freitag, S., Ghan, S., Ginoux, P., Gong, S., Horowitz, L., Iversen,T., Kirkevag, A., Klimont, Z., Kondo, Y., Krol, M., Liu, X.,Miller, R., Montanaro, V., Moteki, N., Myhre, G., Penner, J. E.,Perlwitz, J., Pitari, G., Reddy, S., Sahu, L., Sakamoto, H., Schus-ter, G., Schwarz, J. P., Seland, Ø., Stier, P., Takegawa, N., Take-mura, T., Textor, C., van Aardenne, J. A., and Zhao, Y.: Evalu-ation of black carbon estimations in global aerosol models, At-mos. Chem. Phys., 9, 9001–9026,doi:10.5194/acp-9-9001-2009,2009.
Latha, K. M. and Badarinath, K. V. S.: Seasonal variations of blackcarbon aerosols and total aerosol mass concentrations over urbanenvironment in India, Atmos. Environ., 39, 4129–4141, 2005.
Nakajima, T. and Tanaka, M.: Matrix formulations for the trans-fer of solar radiation in a plane-parallel scattering atmosphere, J.Quant. Spectrosc. Radiat. Transfer, 35, 13–21, 1986.
Nakajima, T. and Tanaka, M.: Algorithms for radiative intensitycalculations in moderately thick atmospheres using a truncationapproximation, J. Quant. Spectrosc. Radiat. Transfer, 40, 51–69,1988.
Nakajima, T., Tonna, G., Rao, R., Boi, P., Kaufman, Y., and Hol-ben, B. N.: Use of sky brightness measurements from ground forremote sensing of particulate polydispersions. Appl. Optics, 35,2672–2686, 1996.
Nakajima, T., Tsukamoto, M., Tsushima, Y., Numaguti, A., andKimura, T.: Modeling of the radiative process in an atmosphericgeneral circulation model, Appl. Optics, 39, 4869–4878, 2000.
Pandithurai, G., Pinker, R. T., Devara, P. C. S., Takamura, T.,and Dani, K. K.: Seasonal asymmetry in diurnal variation ofaerosol optical characteristics over Pune, western India, J. Geo-phys. Res., 112, D08208,doi:10.1029/2006JD007803, 2007.
Prasad, A. K. and Singh, R. P.: Comparison of MISR-MODISaerosol optical depth over the Indo-Gangetic basin during thewinter and summer seasons (2000–2005), Remote Sens. Envi-ron., 107, 109–119, 2007.
Ramanathan, V. and Carmicheal, G.: Global and regional climatechanges due to black carbon, Nature Geoscience, 1, 221–227,2008.
Ramanathan, V., Ramana, M. V., Roberts, G., Kim, D., Corriganm,C., Chung, C., and Winker, D.: Warming trends in Asia amplifiedby brown cloud solar absorption, Nature, 448, 575–579, 2007.
Ramanathan, V., Akimoto, H., Bonasoni, P., Brauer, M.,Carmichael, G., Chung, C. E., Feng, Y., Fuzzi, S., Hasnain, S. I.,Iyngararasan, M., Jayaraman, A., Lawrence, M. G., Nakajima,T., Panwar, T. S., Ramana, M. V., Rupakheti, M., Weidemann,S., and Yoon, S.-C.: Atmosphere Brown Clouds and RegionalClimate Change, Part I of Atmosphere Brown Clouds: RegionalAssessment Report with Focus on Asia. Published by the ProjectAtmosphere Brown Cloud, United National Environment Pro-gramme, Nairobi, Kenya, 2008.
Ann. Geophys., 29, 955–963, 2011 www.ann-geophys.net/29/955/2011/
D. Goto et al.: Simulation of aerosol optical properties over a tropical urban site 963
Rastogi, N. and Sarin, M. M.: Quantitative chemical composi-tion and characteristics of aerosols over western India: One-yearrecord of temporal variability, Atmos. Environ., 43, 3481–3488,2009.
Safai, P. D., Kewat, S., Praveen, P. S., Rao, P. S. P., Momin, G.A., Ali, K., and Devara, P. C. S.: Seasonal variation of blackcarbon aerosols over a tropical urban city of Pune, India, Atmos.Environ., 41, 2699–2709, 2007.
Schmid, O., Artaxo, P., Arnott, W. P., Chand, D., Gatti, L. V., Frank,G. P., Hoffer, A., Schnaiter, M., and Andreae, M. O.: Spectrallight absorption by ambient aerosols influenced by biomass burn-ing in the Amazon Basin. I: Comparison and field calibrationof absorption measurement techniques, Atmos. Chem. Phys., 6,3443–3462,doi:10.5194/acp-6-3443-2006, 2006.
Schutgens, N. A. J., Miyoshi, T., Takemura, T., and Nakajima,T.: Applying an ensemble Kalman filter to the assimilation ofAERONET observations in a global aerosol transport model, At-mos. Chem. Phys., 10, 2561–2576,doi:10.5194/acp-10-2561-2010, 2010.
Singh, S., Soni, K., Bano, T., Tanwar, R. S., Nath, S., andArya, B. C.: Clear-sky direct aerosol radiative forcing vari-ations over mega-city Delhi, Ann. Geophys., 28, 1157–1166,doi:10.5194/angeo-28-1157-2010, 2010.
Shiraiwa, M., Kondo, Y., Moteki, N., Takegawa, N., Sahu, L.K., Takami, A., Hatakeyama, S., Yonemura, S., and Blake,D. R.,: Radiative impact of mixing state of black carbonaerosol in Asian outflow, J. Geophys. Res., 113, D24210,doi:10.1029/2008JD010546, 2008.
Sreekanth, V., Niranjan, K., and Madhavan, B. L.: Radiative forc-ing of black carbon over eastern India, Geophys. Res. Lett., 34,L17818,doi:10.1029/2007GL030377, 2007.
Sudo, K., Takahashi, M., Kurokawa, J., and Akimoto, H.:CHASER: A global chemical model of the troposphere:1. Model description, J. Geophys. Res., 107(D17), 4339,doi:10.1029/2001JD001113, 2002.
Takemura, T., Okamoto, H., Maruyama, Y., Numaguti, A., Hig-urashi, A., and Nakajima, T.: Global three-dimensional simula-tion of aerosol optical thickness distribution of various origins, J.Geophys. Res., 105, 17853–17873, 2000.
Takemura T., Nakajima, T., Dubovik, O., Holben, B. N., and Kinne,S.: Single scattering albedo and radiative forcing of variousaerosol species with a global three-dimensional model, J. Cli-mate, 15, 333–352, 2002.
Takemura, T., Nozawa, T., Emori, S., Nakajima, T. Y., and Naka-jima, T.: Simulation of climate response to aerosol direct and in-direct effects with aerosol transport-radiation model, J. Geophys.Res., 110, D02202,doi:10.1029/2004JD005029, 2005.
Takemura, T., Egashira, M., Matsuzawa, K., Ichijo, H., O’ishi, R.,and Abe-Ouchi, A.: A simulation of the global distribution andradiative forcing of soil dust aerosols at the Last Glacial Max-imum, Atmos. Chem. Phys., 9, 3061–3073,doi:10.5194/acp-9-3061-2009, 2009.
Tripathi, S. N., Srivastava, A. K., Dey, S., Satheesh, S. K., andKrishnamoorthy, K.: The vertical profile of atmospheric heatingrate of black carbon aerosols at Kanpur in northern India, Atmos.Environ., 41(32), 6909–6915, 2007.
Wiengartner, E., Saathoff, H., Schnaiter, M., Streit, N., Bitnar, B.,and Baltensperger, U.: Absorption of light by soot particles: De-termination of the absorption coefficient by means of aethalome-ters, J. Aerosol Sci., 34, 1445–1463, 2003.
www.ann-geophys.net/29/955/2011/ Ann. Geophys., 29, 955–963, 2011