singapore vs india economically
TRANSCRIPT


Presented By:
Satish Badalia
Chintan Vaidya
Tejas
Sourabh Kumar (C- 127)
Aditya Desai
Ruchit
Neha
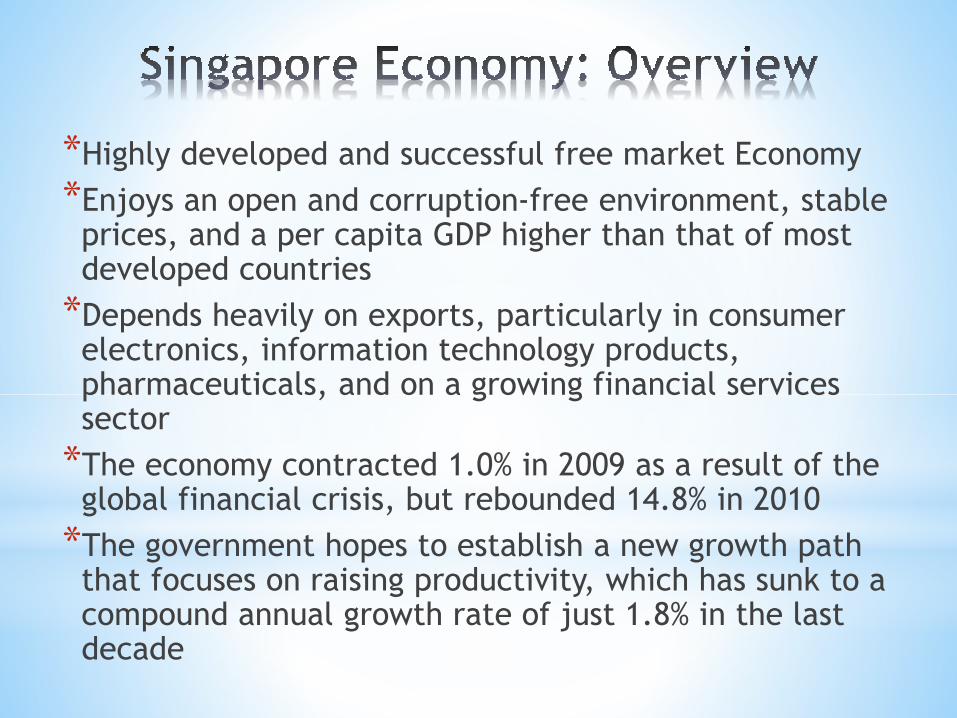
*Highly developed and successful free market Economy
*Enjoys an open and corruption-free environment, stable prices, and a per capita GDP higher than that of most developed countries
*Depends heavily on exports, particularly in consumer electronics, information technology products, pharmaceuticals, and on a growing financial services sector
*The economy contracted 1.0% in 2009 as a result of the global financial crisis, but rebounded 14.8% in 2010
*The government hopes to establish a new growth path that focuses on raising productivity, which has sunk to a compound annual growth rate of just 1.8% in the last decade
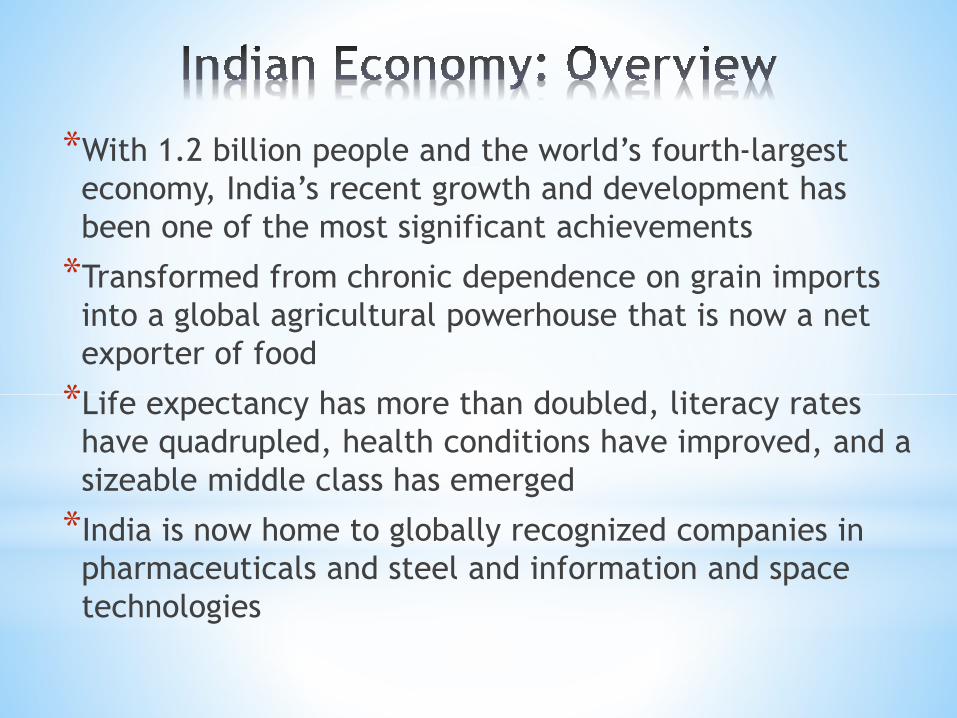
*With 1.2 billion people and the world’s fourth-largest
economy, India’s recent growth and development has
been one of the most significant achievements
*Transformed from chronic dependence on grain imports
into a global agricultural powerhouse that is now a net
exporter of food
*Life expectancy has more than doubled, literacy rates
have quadrupled, health conditions have improved, and a
sizeable middle class has emerged
*India is now home to globally recognized companies in
pharmaceuticals and steel and information and space
technologies
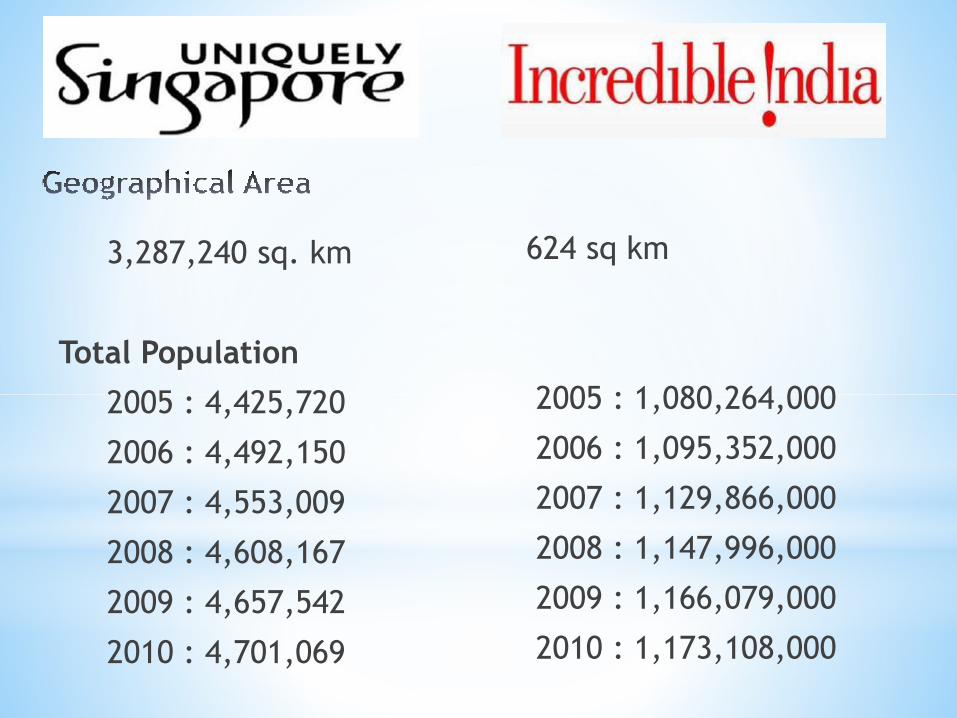
3,287,240 sq. km
Total Population
2005 : 4,425,720
2006 : 4,492,150
2007 : 4,553,009
2008 : 4,608,167
2009 : 4,657,542
2010 : 4,701,069
624 sq km
2005 : 1,080,264,000
2006 : 1,095,352,000
2007 : 1,129,866,000
2008 : 1,147,996,000
2009 : 1,166,079,000
2010 : 1,173,108,000

*GDP Amount (in US$)
2005 : 123,506,892,267.6
2006 : 139,020,876,513.2
2007 : 168,705,756,482.3
2008 : 178,924,164,929.5
2009 : 194,131,267,854.5
2010 : 217,200,123,752.4
2005 : 834,216,897,836.7
2006 : 949,116,769,619.2
2007 : 1,238,700,195,643.9
2008 : 1,224,096,625,885.5
2009 : 1,365,372,912,989.1
2010 : 1,710,917,218,018.0
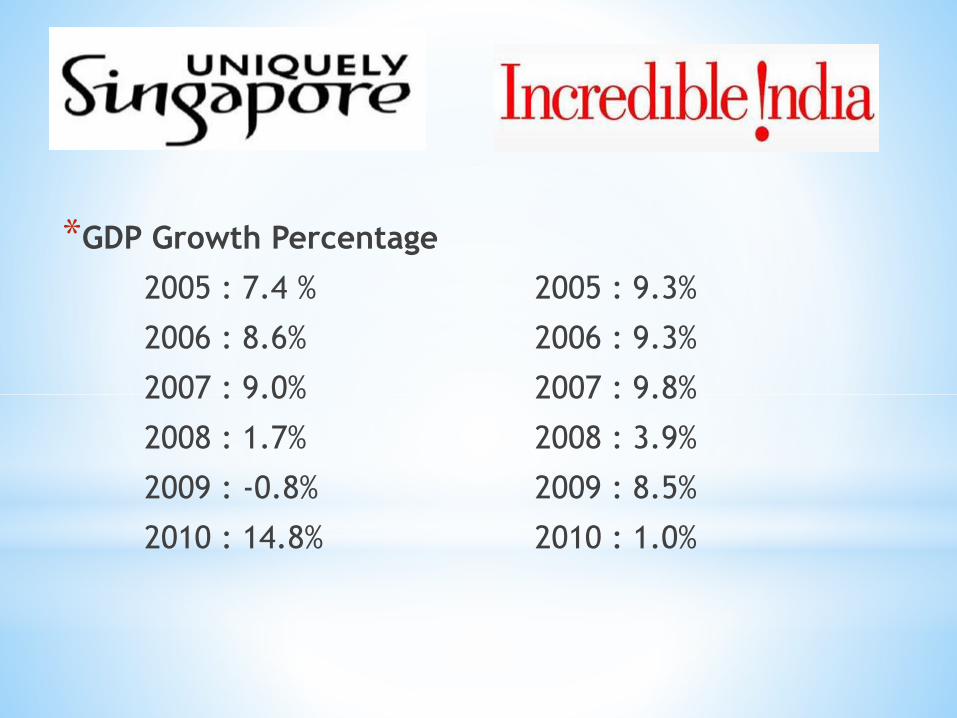
*GDP Growth Percentage
2005 : 7.4 %
2006 : 8.6%
2007 : 9.0%
2008 : 1.7%
2009 : -0.8%
2010 : 14.8%
2005 : 9.3%
2006 : 9.3%
2007 : 9.8%
2008 : 3.9%
2009 : 8.5%
2010 : 1.0%
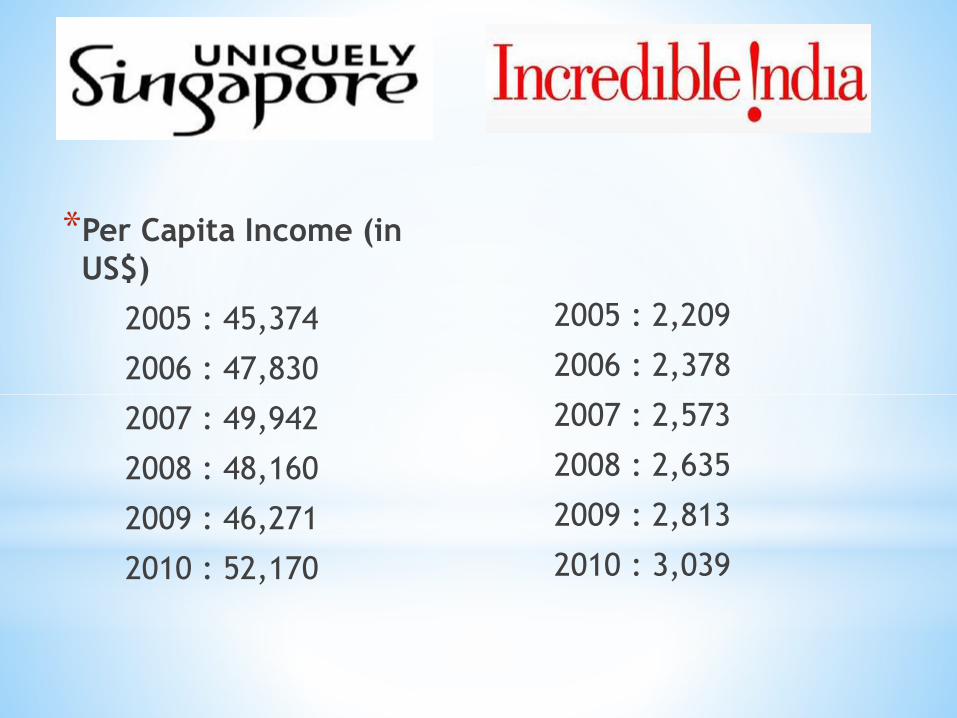
*Per Capita Income (in
US$)
2005 : 45,374
2006 : 47,830
2007 : 49,942
2008 : 48,160
2009 : 46,271
2010 : 52,170
2005 : 2,209
2006 : 2,378
2007 : 2,573
2008 : 2,635
2009 : 2,813
2010 : 3,039
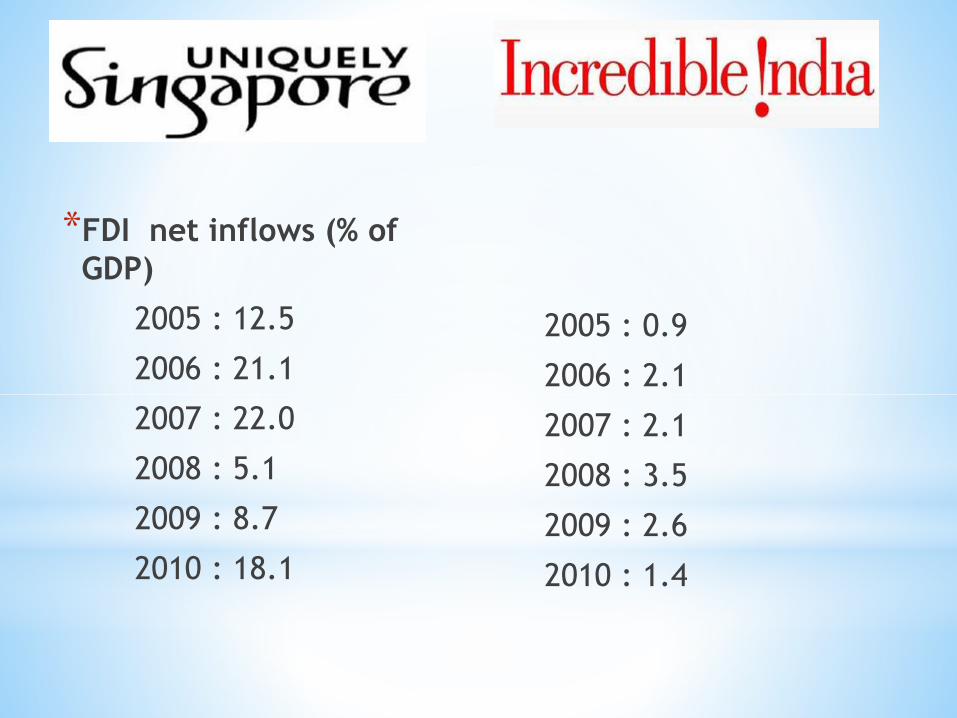
*FDI net inflows (% of
GDP)
2005 : 12.5
2006 : 21.1
2007 : 22.0
2008 : 5.1
2009 : 8.7
2010 : 18.1
2005 : 0.9
2006 : 2.1
2007 : 2.1
2008 : 3.5
2009 : 2.6
2010 : 1.4
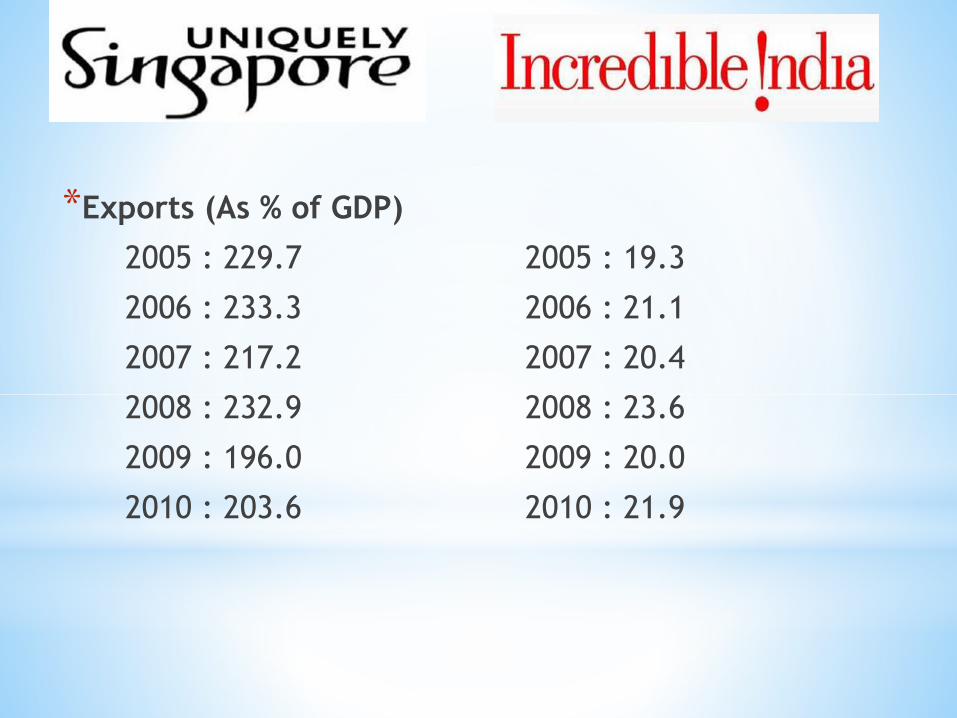
*Exports (As % of GDP)
2005 : 229.7
2006 : 233.3
2007 : 217.2
2008 : 232.9
2009 : 196.0
2010 : 203.6
2005 : 19.3
2006 : 21.1
2007 : 20.4
2008 : 23.6
2009 : 20.0
2010 : 21.9
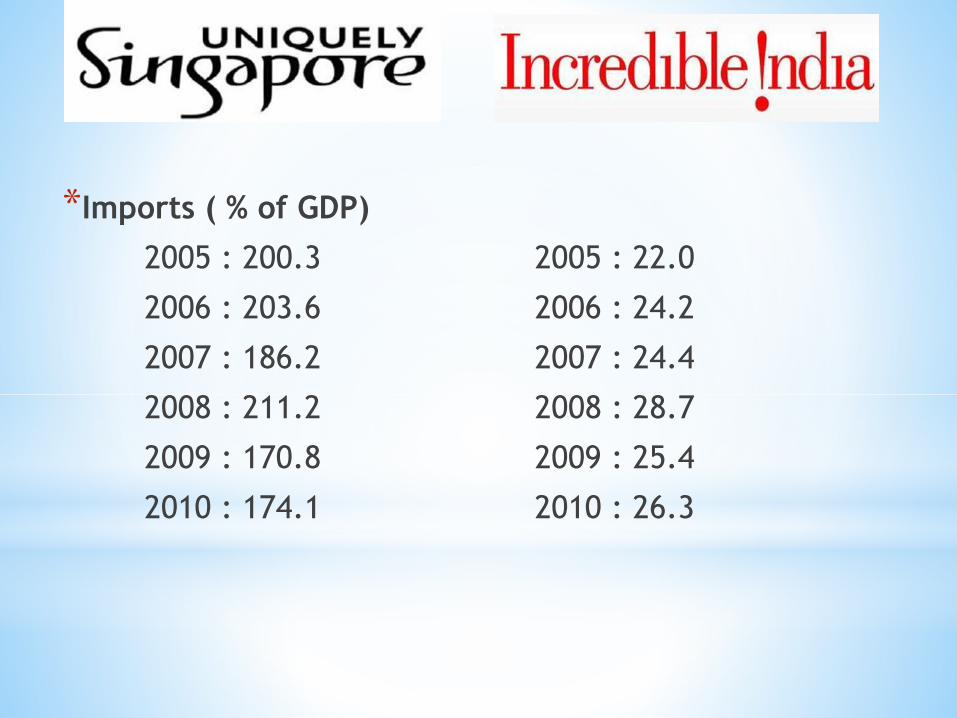
*Imports ( % of GDP)
2005 : 200.3
2006 : 203.6
2007 : 186.2
2008 : 211.2
2009 : 170.8
2010 : 174.1
2005 : 22.0
2006 : 24.2
2007 : 24.4
2008 : 28.7
2009 : 25.4
2010 : 26.3

*Mean Years of Schooling
(adults)(in Years)
2005 : 8.4
2006 : 8.8
2007 : 9.1
2008 : 9.4
2009 : 9.4
2010 : 10.1
2005 : 4.0
2006 : 4.1
2007 : 4.1
2008 : 4.2
2009 : 4.3
2010 : 4.4
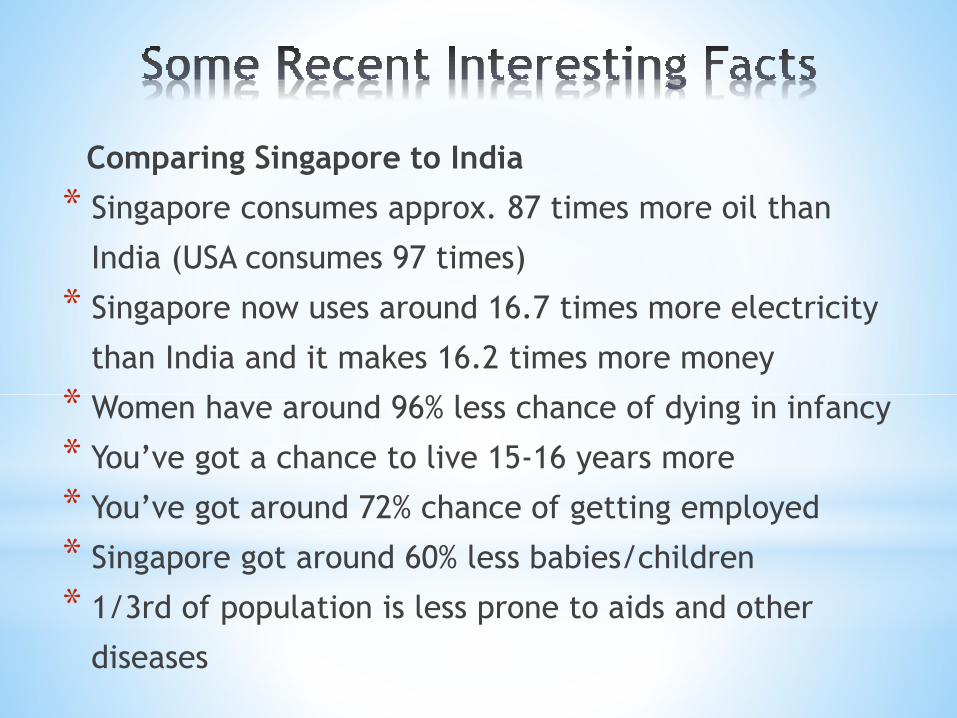
Comparing Singapore to India
* Singapore consumes approx. 87 times more oil than
India (USA consumes 97 times)
* Singapore now uses around 16.7 times more electricity
than India and it makes 16.2 times more money
* Women have around 96% less chance of dying in infancy
* You’ve got a chance to live 15-16 years more
* You’ve got around 72% chance of getting employed
* Singapore got around 60% less babies/children
* 1/3rd of population is less prone to aids and other
diseases