single manager - fund map - absa · single manager - fund map ... absa money market fund 3 m onths...
TRANSCRIPT

Wealth and Investment Management
Single Manager - Fund Map October 2017
Absa Fund Managers Limited, Reg No 1991/000881/06
Barclays Sandton South Campus, 15 Alice Lane, Sandton, 2196
Unit Trust Helpline 0860 111 456 / www.absa.co.za/wim

Wealth and Investment Management
Single Manager - Fund Map
Fund Recommended Term Risk Profile
Interest Bearing Absa Money Market Fund 3 Months + Absa Income Enhancer Fund 6 Months + Absa Core Income Fund 6 Months + Absa Smart Alpha Income 6 Months + Absa Tactical Income Fund 2 Years + Absa Bond Fund 1 Year + Absa Inflation Linked Income Fund 1 Year +
Multi Asset Absa Flexible Income Fund 6 Months + Absa Inflation Beater Fund 3 Years + Absa Absolute Fund 3 Years + Absa Wealth Preserver Plus Fund 1 Year + Absa Balanced Fund 3 Years + Absa Managed Fund 3 Years + Absa Smart Alpha Defensive Fund 5 Years +
Equity Absa Property Equity Fund 3 Years + Absa Smart Alpha Property Fund 3 Years + Absa SA Core Equity Fund 5 Years + Absa Select Equity Fund 5 Years + Absa Smart Alpha Equity Fund 5 Years + Absa Large Cap Fund 5 Years +
International/Africa Absa Euro Income Fund varies Absa Sterling Income Fund varies Absa US Dollar Income Fund varies Absa Global Core Equity Feeder Fund 5 Years + Absa Global Value Feeder Fund 5 Years + Absa Global Multi-Asset Feeder Fund 3 Years + Absa Global Property Feeder Fund 5 Years + Absa Africa Equity Feeder Fund 5 Years +
Absa SM Fund Map

Wealth and Investment Management
Absa Money Market Fund Minimum disclosure documentMonth ended 31 October 2017
Fund detailsIndustry category SA - Interest Bearing - Money MarketBenchmark STeFI Composite IndexFund launch date 02 May 1997Class R Launch Date 02 May 1997Fund Size R 68.53 BillionJSE code ABMMFund Manager Juan Bekker – SAIFM
Rehana Rungasamy – BCom, SAIFMAsset Manager Absa Asset Management (Pty) LtdMinimum lump sum R 100 000Minimum Monthly R 1000
Income Distribution - cents per unit (cpu)Date c.p.u Nominal Yield Effective YieldNov-16 0.62 7.56% 7.83%Dec-16 0.62 7.56% 7.89%Jan-17 0.64 7.57% 7.83%Feb-17 0.62 7.47% 7.85%Mar-17 0.64 7.47% 7.77%Apr-17 0.62 7.51% 7.75%May-17 0.64 8.04% 8.20%Jun-17 0.62 7.83% 7.90%Jul-17 0.63 7.28% 7.51%Aug-17 0.62 7.28% 7.52%Sep-17 0.60 7.46% 7.54%Oct-17 0.61 7.15% 7.41%Total 7.48
Income declaration The last day of every monthIncome distributions The first day of the following month
Fees and Cost ratio (VAT incl.)Fees Class RInitial Fees: Absa: 0.16%
Adviser: 0.24%Annual Fees: Management: 0.57%
Adviser:Performance Fee: No
Costs (annual, based on period shown) Class RFor the period to 30-06-2017, from: 01/07/2014Total expense ratio (TER): 0.57%Transaction costs (TC): 0%Total investment charges (TER+TC): 0.57%Please refer to Disclosure section on next page for further information on Fees and Costs
PerformancePerformance: annualised total returns (%)Term Class R Benchmark Sector Average RankLaunch 9.15 - 9.11 1/41 Year 7.71 7.60 7.78 21/303 Year 7.15 7.07 7.15 13/255 Year 6.31 6.43 6.44 22/2410 Year 7.03 7.18 7.16 14/17
Performance Yearly returns (%)1 yr ending: Oct'17 Oct'16 Oct'15 Oct'14 Oct'13 Oct'12 Oct'11 Oct'10Class R 7.71 7.43 6.32 5.13 4.97 5.30 5.76 6.93Benchmark 7.60 7.22 6.41 5.74 5.18 5.61 5.83 7.13Sector Average & Rank: applies to the R Class.Please refer to Disclosures section on next page for further information on calculation methodology and source of allperformance data content (tables and/or charts) of this MDD
Fund objectivesThe primary performance objective of the portfolio is to obtain as high level ofcurrent income as is consistent with capital preservations and liquidity. Capitalgains will be of an incidental nature
Fund strategyThe fund aims to achieve this by investing in graded short-term money marketinstruments. The fund invests principally in cash, deposits and money-marketinstruments. The fund has a maximum weighted duration of 90 days
Fund features• Ideal vehicle for short-term investments• Aims to achieve a competitive interest rate• Provides immediate liquidity• Attractive alternative to savings and deposit accounts• Suitable for investors who seek capital preservation with minimal volatility
Fund specific risksDefault: There is a risk that the issuers of fixed income investments (e.g. bonds)may not be able to meet interest payments nor repay the money they haveborrowed. The worse the credit quality of the issuer, the greater the risk of defaultand therefore investment loss. Interest rate: The value of fixed incomeinvestments (e.g. bonds) tends to decrease when interest rates and/or inflationrises.Liquidity: There may be insufficient buyers or sellers of particularinvestments giving rise to delays in trading and being able to make settlementsfrom the Fund and/or large fluctuations in the value of the Fund which may leadto larger financial losses than might be anticipated.
Risk profile and advisable minimum termLow Low-Medium Medium Medium-High High
3 Months + 6 Months + 2 Years + 3 Years + 5 Years +
Risk statisticsClass R Since Inception (02 May 1997)Number of positive months 246/246Highest 1 Year Performance 31/05/1999 19.07%Lowest 1 Year Performance 31/01/2014 4.95%
Cumulative performance (5 years) Absa Money Market R STeFI Composite
100
110
120
130
140
150
Oct-12
Oct-13
Oct-14
Oct-15
Oct-16
Oct-17
The chart reflects the value (monthly data points) of a R100 investment made on the01/11/2012
Absa Money Market Fund

Wealth and Investment Management
Duration Allocation
7,52%
13,84%
15,21%
17,33%
46,14%
3 - 6 months
6 - 9 months
Cash
9 - 12 months
0 - 3 months
Issuer Exposure (%)Nedcor Ltd 22.53Absa Group Ltd 21.49Standard Bank Group 20.77Investec Ltd 19.84Firstrand Bank Ltd 15.07Republic of South Africa 0.29
Duration InformationWeighted average duration 100Modified average duration 0.18
Asset Allocation (%)Cash/Money Market 100.00%
Quarterly fund commentary as at 30 September 2017The Fund Commentary is provided on a quarterly basis and can be found on www.absa.co.za/WIM under Unit Trusts Minimum Disclosure Documents. The latest quarterly commentaryavailable is for the quarter ending 30 September 2017.
DisclosuresFees: Class R annual management fee does not include the advisers ongoing fee.
Costs: Total Expense Ratio (“TER”) is expressed as an annualised percentage of the value of the Class of the portfolio that was incurred as expenses relating to the administration of theportfolio. A higher TER does not necessarily imply a poor return, nor does a lower TER imply a good return. The current TER cannot be regarded as an accurate indication of future TER's.Transaction Costs (“TC”) is expressed as an annualised percentage of the value of the portfolio that was incurred as costs relating to the buying and selling of the assets underlying theportfolio. TC are a necessary cost in administering the portfolio and impact returns. TC should not be considered in isolation as returns may be impacted by many other factors over timeincluding market returns, the type of portfolio, the investment decisions of the investment manager and the TER. Note that the total investment charges (TER+TC) have already been deductedprior to the calculation of the performance figures shown. Effective Annual Cost (“EAC”) is a measure that summarises the total cost that an investor incurs through their investment in aparticular financial product, based on the principles set out in the ASISA EAC standard. EAC data is available on request.
Performance: Performance is calculated for the portfolio⁄class of portfolios. Illustrative performance information is included for illustrative purposes only; individual investor performance maydiffer as a result of initial and ongoing fees, the actual investment date, the date of reinvestment and dividend withholding tax. All figures quoted are from Morningstar and⁄or IRESS, for theperiod ending 31/10/2017 (unless otherwise stated), calculated on a NAV to NAV basis, with income distributions reinvested on the ex-dividend date. Annualised figures refer to the averageyearly return of an investment over a given time period, all actual annual figures (if not shown) are available on request.
Collective Investment Schemes (CIS) are generally medium to long-term investments. The value of participatory interests may go down as well as up and past performance is not necessarilya guide to future performance. Fluctuations or movements in exchange rates may cause the value of underlying international investments in a fund to move up or down. Forward pricing isused. CIS are traded at ruling prices. Absa Fund Managers Limited (AFM) may borrow up to 10% (ten per cent) of the market value of a fund to accommodate insufficient liquidity. Securitiesin a fund may be lent to borrowers. Income from the fund is distributed monthly and may only be paid out into an account as nominated by the investor. Prices are calculated on a net assetvalue (NAV) basis which is the total value of all assets in a fund including any income accrual and less permissible deductions from the fund. Prices are published daily and are available atwww.Absa.co.za/Absacoza/indices/Absa-unit-trusts and in daily newspapers, or from AFM upon request. Fees and charges associated with the most expensive class are available directlyfrom AFM for investment by members of the public, other than financial institutions. CIS are financial products and not investments in insurance policies with an insurer and therefore cooling-off periods do not apply. AFM does not provide any guarantee either with respect to the capital or the return of a fund. The directors and personnel of AFM may be invested in any of thefunds. AFM holds professional indemnity cover. AFM utilises Absa Bank Limited’s electronic and telephone banking platform. All requests for transactions received on or before 16:00 everyday will traded at ruling prices and valued after 16:00 on that day. Investments in funds with foreign securities may involve various material risks, which include potential constraints onliquidity and the repatriation of funds, macroeconomic, political, foreign exchange, tax and settlement risks and potential limitations on the availability of market information and there maybe tax to be levied on certain of the benefits accruing to the investor from the funds and AFM may be required to deduct and pay over to the authorities any such tax from such benefits beforepaying any balance to or for the benefit of the investor. AFM has a right to close the fund to new investors in order to manage it more efficiently in accordance with its mandate. The investorunderstands that the legal and tax environment is continually changing, and that AFM cannot be held responsible for any changes to the law which might have an effect on their investment,and which did not exist at the time their investment was made. Additional information on the fund including, but not limited to, brochures, application forms, annual and half-yearly reportsare available free of charge from the AFM website or from AFM upon request. The investor further acknowledges that they are aware that a money market fund is not a bank deposit account,a constant unit price of R1 (one rand) will be maintained although, owing to circumstances, it may be amended to a lower amount, the total return to the investor is made of inTERest receivedand any gain or loss made on any particular instrument, in most cases the return will merely have the effect of increasing or decreasing the daily yield but in cases of abnormal losses it canhave the effect of reducing the capital value, the yield is calculated using an annualised seven day rolling average and excessive withdrawals may place liquidity pressures and in suchcircumstances a process of ring fencing of withdrawal instructions and managed pay-outs over time may be followed. The investment return is not guaranteed and is dependent on theperformance of the underlying investments. This fund Will not have more than 25% in any one single entity. AFM is a registered Collective Investment Scheme Manager and a full memberof the Association for Savings and Investment SA. This document is a Minimum Disclosure Document (MDD) in terms of the Advertising, Marketing and Information Disclosure requirementsfor Collective Investment Schemes published by the Financial Services Board. MDD issue date: 15 November 2017
Contact detailsManagement Company
Absa Fund Managers LimitedReg no 1991/000881/06 Absa Sandton South Campus, 15 Alice Lane, Sandton, 2196 Private Bag X10056, Sandton, 2146 Contact Centre: 0860 111 456 Fax: 0860 212 123 Email: [email protected] Website: www.absa.co.za/wim
Trustees
Société Générale Johannesburg BranchPO Box 6872, Johannesburg, 2000
Asset Manager
Absa Asset ManagementAn authorised financial services provider, FSP No: 522 Telephone: +27 (0)11 243 4563 Website:www.absa.co.za/wim
Absa Money Market Fund

Wealth and Investment Management
Absa Money Market Fund Fund Commentary30 September 2017
Commentary DocumentThe Reserve Bank’s Monetary Policy Committee (MPC) reduced the repo rate by 25 basis points to 6.75% for the first time in five years at its July policy meeting, dueto rising growth concerns and easing inflation forecasts. However, the Reserve Bank disappointed markets at its September meeting when they decided to keep therepo rate on hold, defying market expectations for a further 25 basis point rate cut. Governor Lesetja Kganyago cited heightened uncertainties in the economy asreason to keep the repo rate on hold. The prospect of further sovereign credit-ratings downgrades; upside risk to inflation from a potential 20% electricity tariff hike;looming US interest rates hikes, which would put upward pressure on the Rand; as well as the rise in crude oil prices, all of which will put upward pressure on theinflation trajectory. The Reserve Bank revised its inflation forecast marginally higher to 5.00% in 2018 from 4.90%, while 2017 forecast was left unchanged at5.30%. Local politics and a newfound strength in the US Dollar continued to plaque the Rand which was under significant pressure in September. A hawkish Federal OpenMarket Committee (FOMC) and the announcement of the start of the US balance sheet reduction caused the Dollar to strengthen. The Rand thus weakened againstthe US Dollar and other major currencies. The Rand ended the quarter at 13.55 against the US Dollar. The forward rate agreement (FRA) curve moved higher after the MPC’s decision to keep rates on hold, thus shifting expectations from a 100% probability of a 25basis points cut in November to a 50% probability. Consequently, the money market yield curve steepened toward the end of September, with the 1 year NCD rate trading higher at 7.70% from a previous low of7.50%. The weighted average duration on the money market fund continues to be kept relatively close to the maximum permitted weighted average duration of 120 days.
DisclosuresCollective Investment Schemes (CIS) are generally medium to long-term investments. The value of participatory interests may go down as well as up and pastperformance is not necessarily a guide to future performance. Fluctuations or movements in exchange rates may cause the value of underlying international investmentsin a fund to move up or down. Forward pricing is used. CIS are traded at ruling prices. Absa Fund Managers Limited (AFM) may borrow up to 10% (ten per cent) ofthe market value of a fund to accommodate insufficient liquidity. Securities in a fund may be lent to borrowers. Income from the fund is distributed monthly and mayonly be paid out into an account as nominated by the investor. Prices are calculated on a net asset value (NAV) basis which is the total value of all assets in a fundincluding any income accrual and less permissible deductions from the fund. Prices are published daily and are available at www.Absa.co.za/Absacoza/indices/Absa-unit-trusts and in daily newspapers, or from AFM upon request. Fees and charges associated with the most expensive class are available directly from AFM forinvestment by members of the public, other than financial institutions. CIS are financial products and not investments in insurance policies with an insurer and thereforecooling-off periods do not apply. AFM does not provide any guarantee either with respect to the capital or the return of a fund. The directors and personnel of AFMmay be invested in any of the funds. AFM holds professional indemnity cover. AFM utilises Absa Bank Limited’s electronic and telephone banking platform. All requestsfor transactions received on or before 16:00 every day will traded at ruling prices and valued after 16:00 on that day. Investments in funds with foreign securities mayinvolve various material risks, which include potential constraints on liquidity and the repatriation of funds, macroeconomic, political, foreign exchange, tax andsettlement risks and potential limitations on the availability of market information and there may be tax to be levied on certain of the benefits accruing to the investorfrom the funds and AFM may be required to deduct and pay over to the authorities any such tax from such benefits before paying any balance to or for the benefit ofthe investor. AFM has a right to close the fund to new investors in order to manage it more efficiently in accordance with its mandate. The investor understands thatthe legal and tax environment is continually changing, and that AFM cannot be held responsible for any changes to the law which might have an effect on theirinvestment, and which did not exist at the time their investment was made. Additional information on the fund including, but not limited to, brochures, applicationforms, annual and half-yearly reports are available free of charge from the AFM website or from AFM upon request. The investor further acknowledges that they areaware that a money market fund is not a bank deposit account, a constant unit price of R1 (one rand) will be maintained although, owing to circumstances, it may beamended to a lower amount, the total return to the investor is made of inTERest received and any gain or loss made on any particular instrument, in most cases thereturn will merely have the effect of increasing or decreasing the daily yield but in cases of abnormal losses it can have the effect of reducing the capital value, the yieldis calculated using an annualised seven day rolling average and excessive withdrawals may place liquidity pressures and in such circumstances a process of ring fencingof withdrawal instructions and managed pay-outs over time may be followed. The investment return is not guaranteed and is dependent on the performance of theunderlying investments. This fund Will not have more than 25% in any one single entity. AFM is a registered Collective Investment Scheme Manager and a full memberof the Association for Savings and Investment SA. This document is a Minimum Disclosure Document (MDD) in terms of the Advertising, Marketing and InformationDisclosure requirements for Collective Investment Schemes published by the Financial Services Board. MDD issue date: 15 November 2017
Contact details
Management Company
Absa Fund Managers LimitedReg no 1991/000881/06 Absa Sandton South Campus, 15 Alice Lane, Sandton, 2196 Private Bag X10056, Sandton, 2146 Contact Centre: 0860 111 456 Fax: 0860 212 123 Email: [email protected] Website: www.absa.co.za/wim
Trustees
Société Générale Johannesburg BranchPO Box 6872, Johannesburg, 2000
Asset Manager
Absa Asset ManagementAn authorised financial services provider, FSP No: 522 Telephone: +27 (0)11 243 4563 Website:www.absa.co.za/wim
Absa Money Market Fund

Wealth and Investment Management
Absa Income Enhancer Fund Minimum disclosure documentMonth ended 31 October 2017
Fund detailsIndustry category SA - Interest Bearing - Short TermBenchmark BEASSA 1 – 3 yearFund launch date 01 April 1993Class R Launch Date 01 April 1993Fund Size R 561.47 MillionJSE code ABSCFund Manager Rehana Rungasamy – BCom, SAIFM
Eben Mare – B.Sc. (Hons), M.Sc., Ph.D Applied MathematicsAsset Manager Absa Asset Management (Pty) LtdMinimum lump sum R 2000Minimum Monthly R 200
Income Distribution - cents per unit (cpu)Class R
Date (cpu) (yl)Mar-17 2.02 7.60%Jun-17 2.19 7.85%Sep-17 2.29 7.40%Total 8.53
Income declaration 31 Mar, 30 Jun, 30 Sep & 31 DecIncome distributions 1 Apr, 1 Jul, 1 Oct & 1 Jan
Fees and Cost ratio (VAT incl.)Fees Class RInitial Fees: Absa: 0%
Adviser: 0-1.14%Annual Fees: Management: 0.63%
Adviser: 0-1.14%Performance Fee:
Costs (annual, based on period shown) Class RFor the period to 30-06-2017, from: 01/07/2014Total expense ratio (TER): 0.80%Transaction costs (TC): 0.01%Total investment charges (TER+TC): 0.81%Please refer to Disclosure section on next page for further information on Fees and Costs
PerformancePerformance: annualised total returns (%)Term Class R Benchmark Sector Average RankLaunch 9.89 - 10.49 3/41 Year 8.96 8.25 8.70 11/293 Year 7.61 7.39 7.71 18/255 Year 6.41 6.64 6.84 23/2410 Year 7.20 7.87 7.64 11/11
Performance Yearly returns (%)1 yr ending: Oct'17 Oct'16 Oct'15 Oct'14 Oct'13 Oct'12 Oct'11 Oct'10Class R 8.96 7.30 6.59 3.45 5.83 5.10 5.47 7.46Benchmark 8.25 7.48 6.44 6.06 4.98 8.01 9.16 8.87Sector Average & Rank: applies to the R Class.Please refer to Disclosures section on next page for further information on calculation methodologyand source of all performance data content (tables and/or charts) of this MDD
Fund objectivesThe fund aims to provide investors with a reasonable level of current income andmaximum stability for capital invested
Fund strategyTo achieve this objective, the securities normally included in the portfolio willconsist of non-equity securities, financially sound preference shares (subject tothe provisions of the Act), debenture stock, debenture bonds and unsecurednotes to be acquired at fair market prices. The fund may also include participatoryinterests of collective investment schemes.
Fund features• A specialised fixed-income fund, ideal for short-term investments• Aims to provide a reasonable level of current income and capital stability• Outperforms cash over time and hedges against interest rate volatility• Higher level of income than a traditional money market fund• Suitable for risk-averse investors who require a regular stream of income
from their capital base
Fund specific risksDefault: There is a risk that the issuers of fixed income investments (e.g. bonds)may not be able to meet interest payments nor repay the money they haveborrowed. The worse the credit quality of the issuer, the greater the risk of defaultand therefore investment loss. Interest rate: The value of fixed incomeinvestments (e.g. bonds) tends to decrease when interest rates and/or inflationrises.Liquidity: There may be insufficient buyers or sellers of particularinvestments giving rise to delays in trading and being able to make settlementsfrom the Fund and/or large fluctuations in the value of the Fund which may leadto larger financial losses than might be anticipated.
Risk profile and advisable minimum termLow Low-Medium Medium Medium-High High
3 Months + 6 Months + 2 Years + 3 Years + 5 Years +
Risk statisticsClass R Since Inception (01 April 1993)Number of positive months 275/295Highest 1 Year Performance 30/09/1999 26.23%Lowest 1 Year Performance 30/09/2014 3.16%
Cumulative performance (5 years)
Absa Income Enhancer R BEASSA 1 - 3 Year
100
110
120
130
140
150
Oct-12
Oct-13
Oct-14
Oct-15
Oct-16
Oct-17
The chart reflects the value (monthly data points) of a R100 investment made on the01/11/2012
Absa Income Enhancer Fund

Wealth and Investment Management
Duration Allocation
0,47%
4,67%
5,72%
5,75%
14,14%
69,25%
3 - 6 months
6 - 9 months
15 - 18 months
9 - 12 months
Cash
>24 months
Duration InformationWeighted average duration 954Modified average duration 0.72
Asset Allocation (%)Money market 43.72%Floating rate bonds 36.76%Interest bearing CIS 14.95%Fixed rate bonds 4.57%
Quarterly fund commentary as at 30 September 2017The Fund Commentary is provided on a quarterly basis and can be found on www.absa.co.za/WIM under Unit Trusts Minimum Disclosure Documents. The latest quarterly commentaryavailable is for the quarter ending 30 September 2017.
DisclosuresFees: Class R Adviser annual fee is not included in the annual management fee, it is charged by a way of unit reduction.
Costs: Total Expense Ratio (“TER”) is expressed as an annualised percentage of the value of the Class of the portfolio that was incurred as expenses relating to the administration of theportfolio. A higher TER does not necessarily imply a poor return, nor does a lower TER imply a good return. The current TER cannot be regarded as an accurate indication of future TER's.Transaction Costs (“TC”) is expressed as an annualised percentage of the value of the portfolio that was incurred as costs relating to the buying and selling of the assets underlying theportfolio. TC are a necessary cost in administering the portfolio and impact returns. TC should not be considered in isolation as returns may be impacted by many other factors over timeincluding market returns, the type of portfolio, the investment decisions of the investment manager and the TER. Note that the total investment charges (TER+TC) have already been deductedprior to the calculation of the performance figures shown. Effective Annual Cost (“EAC”) is a measure that summarises the total cost that an investor incurs through their investment in aparticular financial product, based on the principles set out in the ASISA EAC standard. EAC data is available on request.
Performance: Performance is calculated for the portfolio⁄class of portfolios. Illustrative performance information is included for illustrative purposes only; individual investor performance maydiffer as a result of initial and ongoing fees, the actual investment date, the date of reinvestment and dividend withholding tax. All figures quoted are from Morningstar and⁄or IRESS, for theperiod ending 31/10/2017 (unless otherwise stated), calculated on a NAV to NAV basis, with income distributions reinvested on the ex-dividend date. Annualised figures refer to the averageyearly return of an investment over a given time period, all actual annual figures (if not shown) are available on request.
Collective Investment Schemes (CIS) are generally medium to long-term investments. The value of participatory interests may go down as well as up and past performance is not necessarilya guide to future performance. Fluctuations or movements in exchange rates may cause the value of underlying international investments in a fund to move up or down. Forward pricing isused. CIS are traded at ruling prices. Absa Fund Managers Limited (AFM) may borrow up to 10% (ten per cent) of the market value of a fund to accommodate insufficient liquidity. Securitiesin a fund may be lent to borrowers. Income from the fund is distributed quarterly and may only be paid out into an account as nominated by the investor. Prices are calculated on a net assetvalue (NAV) basis which is the total value of all assets in a fund including any income accrual and less permissible deductions from the fund. Prices are published daily and are available atwww.Absa.co.za/Absacoza/indices/Absa-unit-trusts and in daily newspapers, or from AFM upon request. Fees and charges associated with the most expensive class are available directlyfrom AFM for investment by members of the public, other than financial institutions. CIS are financial products and not investments in insurance policies with an insurer and therefore cooling-off periods do not apply. AFM does not provide any guarantee either with respect to the capital or the return of a fund. The directors and personnel of AFM may be invested in any of thefunds. AFM holds professional indemnity cover. AFM utilises Absa Bank Limited’s electronic and telephone banking platform. All requests for transactions received on or before 16:00 everyday will traded at ruling prices and valued after 16:00 on that day. Investments in funds with foreign securities may involve various material risks, which include potential constraints onliquidity and the repatriation of funds, macroeconomic, political, foreign exchange, tax and settlement risks and potential limitations on the availability of market information and there maybe tax to be levied on certain of the benefits accruing to the investor from the funds and AFM may be required to deduct and pay over to the authorities any such tax from such benefits beforepaying any balance to or for the benefit of the investor. AFM has a right to close the fund to new investors in order to manage it more efficiently in accordance with its mandate. The investorunderstands that the legal and tax environment is continually changing, and that AFM cannot be held responsible for any changes to the law which might have an effect on their investment,and which did not exist at the time their investment was made. Additional information on the fund including, but not limited to, brochures, application forms, annual and half-yearly reportsare available free of charge from the AFM website or from AFM upon request. This portfolio derives its income primarily from interest-bearing Instruments. The yields quoted are currentyields as at the relevant month end date. AFM is a registered Collective Investment Scheme Manager and a full member of the Association for Savings and Investment SA. This document isa Minimum Disclosure Document (MDD) in terms of the Advertising, Marketing and Information Disclosure requirements for Collective Investment Schemes published by the FinancialServices Board. MDD issue date: 15 November 2017
Contact detailsManagement Company
Absa Fund Managers LimitedReg no 1991/000881/06 Absa Sandton South Campus, 15 Alice Lane, Sandton, 2196 Private Bag X10056, Sandton, 2146 Contact Centre: 0860 111 456 Fax: 0860 212 123 Email: [email protected] Website: www.absa.co.za/wim
Trustees
Société Générale Johannesburg BranchPO Box 6872, Johannesburg, 2000
Asset Manager
Absa Asset ManagementAn authorised financial services provider, FSP No: 522 Telephone: +27 (0)11 243 4563 Website:www.absa.co.za/wim
Absa Income Enhancer Fund

Wealth and Investment Management
Absa Income Enhancer Fund Fund Commentary30 September 2017
Commentary DocumentThe Reserve Bank’s Monetary Policy Committee (MPC) reduced the repo rate by 25 basis points to 6.75% for the first time in five years at its July policy meeting, dueto rising growth concerns and easing inflation forecasts. However, the Reserve Bank disappointed markets at its September meeting when they decided to keep therepo rate on hold, defying market expectations for a further 25 basis point rate cut. Governor Lesetja Kganyago cited heightened uncertainties in the economy asreason to keep the repo rate on hold. The prospect of further sovereign credit-ratings downgrades; upside risk to inflation from a potential 20% electricity tariff hike;looming US interest rates hikes, which would put upward pressure on the Rand; as well as the rise in crude oil prices, all of which will put upward pressure on theinflation trajectory. The Reserve Bank revised its inflation forecast marginally higher to 5.00% in 2018 from 4.90%, while 2017 forecast was left unchanged at5.30%. Local politics and a newfound strength in the US Dollar continued to plaque the Rand which was under significant pressure in September. A hawkish Federal OpenMarket Committee (FOMC) and the announcement of the start of the US balance sheet reduction caused the Dollar to strengthen. The Rand thus weakened againstthe US Dollar and other major currencies. The Rand ended the quarter at 13.55 against the US Dollar. The forward rate agreement (FRA) curve moved higher after the MPC’s decision to keep rates on hold, thus shifting expectations from a 100% probability of a 25basis points cut in November to a 50% probability. Consequently, the money market yield curve steepened toward the end of September, with the 1 year NCD rate trading higher at 7.70% from a previous low of7.50%. Bond yields fell sharply on the back of the rate cut in July, and the curve steepened further driven by the rise in US -10 year treasury yield. The yield on the R186 bondtraded a low 8.38% and ended the quarter at 8.55%. The weighted average duration on the Fund continues to be kept relatively close to the maximum permitted weighted average duration.
DisclosuresCollective Investment Schemes (CIS) are generally medium to long-term investments. The value of participatory interests may go down as well as up and pastperformance is not necessarily a guide to future performance. Fluctuations or movements in exchange rates may cause the value of underlying international investmentsin a fund to move up or down. Forward pricing is used. CIS are traded at ruling prices. Absa Fund Managers Limited (AFM) may borrow up to 10% (ten per cent) ofthe market value of a fund to accommodate insufficient liquidity. Securities in a fund may be lent to borrowers. Income from the fund is distributed quarterly and mayonly be paid out into an account as nominated by the investor. Prices are calculated on a net asset value (NAV) basis which is the total value of all assets in a fundincluding any income accrual and less permissible deductions from the fund. Prices are published daily and are available at www.Absa.co.za/Absacoza/indices/Absa-unit-trusts and in daily newspapers, or from AFM upon request. Fees and charges associated with the most expensive class are available directly from AFM forinvestment by members of the public, other than financial institutions. CIS are financial products and not investments in insurance policies with an insurer and thereforecooling-off periods do not apply. AFM does not provide any guarantee either with respect to the capital or the return of a fund. The directors and personnel of AFMmay be invested in any of the funds. AFM holds professional indemnity cover. AFM utilises Absa Bank Limited’s electronic and telephone banking platform. All requestsfor transactions received on or before 16:00 every day will traded at ruling prices and valued after 16:00 on that day. Investments in funds with foreign securities mayinvolve various material risks, which include potential constraints on liquidity and the repatriation of funds, macroeconomic, political, foreign exchange, tax andsettlement risks and potential limitations on the availability of market information and there may be tax to be levied on certain of the benefits accruing to the investorfrom the funds and AFM may be required to deduct and pay over to the authorities any such tax from such benefits before paying any balance to or for the benefit ofthe investor. AFM has a right to close the fund to new investors in order to manage it more efficiently in accordance with its mandate. The investor understands thatthe legal and tax environment is continually changing, and that AFM cannot be held responsible for any changes to the law which might have an effect on theirinvestment, and which did not exist at the time their investment was made. Additional information on the fund including, but not limited to, brochures, applicationforms, annual and half-yearly reports are available free of charge from the AFM website or from AFM upon request. This portfolio derives its income primarily frominterest-bearing Instruments. The yields quoted are current yields as at the relevant month end date. AFM is a registered Collective Investment Scheme Manager anda full member of the Association for Savings and Investment SA. This document is a Minimum Disclosure Document (MDD) in terms of the Advertising, Marketingand Information Disclosure requirements for Collective Investment Schemes published by the Financial Services Board. MDD issue date: 15 November 2017
Contact details
Management Company
Absa Fund Managers LimitedReg no 1991/000881/06 Absa Sandton South Campus, 15 Alice Lane, Sandton, 2196 Private Bag X10056, Sandton, 2146 Contact Centre: 0860 111 456 Fax: 0860 212 123 Email: [email protected] Website: www.absa.co.za/wim
Trustees
Société Générale Johannesburg BranchPO Box 6872, Johannesburg, 2000
Asset Manager
Absa Asset ManagementAn authorised financial services provider, FSP No: 522 Telephone: +27 (0)11 243 4563 Website:www.absa.co.za/wim
Absa Income Enhancer Fund

Wealth and Investment Management
Absa Core Income Fund Minimum disclosure documentMonth ended 31 October 2017
Fund detailsIndustry category SA - Interest Bearing - Short TermBenchmark JIBAR + 0.5%Fund launch date 13 October 2016Class A launch Date 13 October 2016Fund Size R 512.6 MillionJSE code ACICAFund Manager James Turp – B.Econ, SAIFM
Eben Mare – B.Sc. (Hons), M.Sc., Ph.D Applied MathematicsAsset Manager Absa Asset Management (Pty) LtdMinimum lump sum R 2000Minimum Monthly R 200
Income distributions - cents per unit (cpu)Class A
the 3 months ended 31 Dec 2016 0the 3 months ended 31 Mar 2017 2.10the 3 months ended 30 Jun 2017 2.17the 3 months ended 30 Sep 2017 2.09
Income declaration 31 Mar, 30 Jun, 30 Sep & 31 DecIncome distributions 15 Apr, 15 Jul, 15 Oct & 15 Jan
Fees and Cost ratio (VAT incl.)Fees Class AInitial Fees: Absa: 0%
Adviser: 0-3.42%Annual Fees: Management: 0.57%
Adviser: 0-1.14%Performance Fee: No
Costs (annual, based on period shown) Class AFor the period to 30-06-2017, from: 13-10-2016Total expense ratio (TER): 0.60%Transaction costs (TC): 0.07%Total investment charges (TER+TC): 0.67%Please refer to Disclosure section on next page for further information on Fees and Costs
PerformancePerformance cummulative total returns (%)Term Class A Benchmark Sector Average RankLaunch 10.07 5.19 9.15 4/291 Month 0.60 0.63 0.65 20/303 month 1.94 1.91 2.04 22/306 Month 4.63 3.87 4.26 3/309 Month 7.29 - 6.53 4/30
Sector Average & Rank: applies to the A Class.Please refer to Disclosures section on next page for further information on calculation methodologyand source of all performance data content (tables and/or charts) of this MDD
Cumulative performance (since inception)
Absa Core Income A JIBAR + 0.5%
100
103
106
109
112
115
Oct-16
Dec-16
Mar-17
The chart reflects the value (monthly data points) of a R100 investment made on the 13 October 2016
Fund objectivesThe Fund aims to provide investors with a higher level of current income thantraditional money market collective investment scheme portfolios, while ensuringcapital preservation and liquidity
Fund strategyThe Absa Core Income Fund will predominantly invest in interest bearing andnon-equity securities. Securities to be included in the portfolio will include assetsin liquid form, money market instruments, bonds, debentures, debenture bonds,notes, preference shares (subject to the provisions of the Act), and any otherincome bearing instruments and securities that the Act may from time to timeallow, listed and unlisted financial instruments, Interest bearing instruments andnon-equity securities in the currency of a country other than the Republic maybe included in the Fund.
Fund features• A specialised fixed income fund, ideal for short-term investments• Aims to provide a reasonable level of current income and capital stability• Higher level of income than a traditional money market fund
Fund specific risksDefault: There is a risk that the issuers of fixed income investments (e.g. bonds)may not be able to meet interest payments nor repay the money they haveborrowed. The worse the credit quality of the issuer, the greater the risk of defaultand therefore investment loss.Interest rate: The value of fixed incomeinvestments (e.g. bonds) tends to decrease when interest rates and/or inflationrises.Liquidity: There may be insufficient buyers or sellers of particularinvestments giving rise to delays in trading and being able to make settlementsfrom the Fund and/or large fluctuations in the value of the Fund which may leadto larger financial losses than might be anticipated.
Risk profile and advisable minimum termLow Low-Medium Medium Medium-High High
3 Months + 6 Months + 2 Years + 3 Years + 5 Years +
Risk statisticsClass A Since Inception (13 October 2016)Number of positive months 12/12No highest/lowest one year performance data disclosed due to the length of thetime the fund has been in existence.
Absa Core Income Fund

Wealth and Investment Management
Asset Allocation (%)
10,33%
41,94%
47,73%
Fixed rate bonds
Money market
Floating rate bonds
Duration Allocation
1,57%
1,97%
3,92%
6,24%
20,93%
65,38%
3 - 6 months
12 - 15 months
15 - 18 months
18 - 21 months
Cash
>24 months
Quarterly fund commentary as at 30 September 2017The Fund Commentary is provided on a quarterly basis and can be found on www.absa.co.za/WIM under Unit Trusts Minimum Disclosure Documents. The latest quarterly commentaryavailable is for the quarter ending 30 September 2017.
DisclosuresFees: Class A Adviser annual fee is not included in the annual management fee, it is charged by a way of unit reduction.
Costs: Total Expense Ratio (“TER”) is expressed as an annualised percentage of the value of the Class of the portfolio that was incurred as expenses relating to the administration of theportfolio. A higher TER does not necessarily imply a poor return, nor does a lower TER imply a good return. The current TER cannot be regarded as an accurate indication of future TER's.Transaction Costs (“TC”) is expressed as an annualised percentage of the value of the portfolio that was incurred as costs relating to the buying and selling of the assets underlying theportfolio. TC are a necessary cost in administering the portfolio and impact returns. TC should not be considered in isolation as returns may be impacted by many other factors over timeincluding market returns, the type of portfolio, the investment decisions of the investment manager and the TER. Where the class/portfolio is less than 1 year old the TER and TC cannot bedetermined accurately because of the short life span, calculations are based on actual data where possible and best estimates where actual data is not available. Note that the Total InvestmentCharges (TER+TC) have already been deducted prior to the calculation of the performance figures shown. Effective Annual Cost (“EAC”) is a measure that summarises the total cost that aninvestor incurs through their investment in a particular financial product, based on the principles set out in the ASISA EAC Standard. EAC data is available on request.
Performance: Performance is calculated for the portfolio⁄ class of portfolios. Illustrative performance information is included for illustrative purposes only; individual investor performance maydiffer as a result of initial and ongoing fees, the actual investment date, the date of reinvestment and dividend withholding tax. All figures quoted are from Morningstar and⁄ or IRESS, for theperiod ending 31/10/2017 (unless otherwise stated), calculated on a NAV to NAV basis, with income distributions reinvested on the ex-dividend date. Annualised figures refer to the averageyearly return of an investment over a given time period, all actual annual figures (if not shown) are available on request.
Collective Investment Schemes (CIS) are generally medium to long-term investments. The value of participatory interests may go down as well as up and past performance is not necessarilya guide to future performance. Fluctuations or movements in exchange rates may cause the value of underlying international investments in a fund to move up or down. Forward pricing isused. CIS are traded at ruling prices. Absa Fund Managers Limited (AFM) may borrow up to 10% (ten per cent) of the market value of a fund to accommodate insufficient liquidity. Securitiesin a fund may be lent to borrowers. Income from the fund is distributed quarterly and may only be paid out into an account as nominated by the investor. Prices are calculated on a net assetvalue (NAV) basis which is the total value of all assets in a fund including any income accrual and less permissible deductions from the fund. Prices are published daily and are available atwww.absa.co.za/Absacoza/Indices/Absa-Unit-Trusts and in daily newspapers, or from AFM upon request. Fees and charges associated with the most expensive class are available directlyfrom AFM for investment by members of the public, other than financial institutions. CIS are financial products and not investments in insurance policies with an insurer and therefore cooling-off periods do not apply. AFM does not provide any guarantee either with respect to the capital or the return of a fund. The directors and personnel of AFM may be invested in any of thefunds. AFM holds professional indemnity cover. AFM utilises Absa Bank Limited’s electronic and telephone banking platform. All requests for transactions received on or before 16:00 everyday will traded at ruling prices and valued after 16:00 on that day. Investments in funds with foreign securities may involve various material risks, which include potential constraints onliquidity and the repatriation of funds, macroeconomic, political, foreign exchange, tax and settlement risks and potential limitations on the availability of market information and there maybe tax to be levied on certain of the benefits accruing to the investor from the funds and AFM may be required to deduct and pay over to the authorities any such tax from such benefits beforepaying any balance to or for the benefit of the investor. AFM has a right to close the fund to new investors in order to manage it more efficiently in accordance with its mandate. The investorunderstands that the legal and tax environment is continually changing, and that AFM cannot be held responsible for any changes to the law which might have an effect on their investment,and which did not exist at the time their investment was made. Additional information on the fund including, but not limited to, brochures, application forms, annual and half-yearly reportsare available free of charge from the AFM website or from AFM upon request. This portfolio derives its income primarily from interest-bearing instruments. The yields quoted are currentyields as at the relevant month end date. AFM is a registered Collective Investment Scheme Manager and a full member of the Association for Savings and Investment SA. This document isa Minimum Disclosure Document (MDD) in terms of the Advertising, Marketing and Information Disclosure Requirements for Collective Investment Schemes published by the FinancialServices Board. MDD issue date: 15 November 2017
Contact detailsManagement Company
Absa Fund Managers LimitedReg no 1991/000881/06 Absa Sandton South Campus, 15 Alice Lane, Sandton, 2196 Private Bag X10056, Sandton, 2146 Contact Centre: 0860 111 456 Fax: 0860 212 123 Email: [email protected] Website: www.absa.co.za/wim
Trustees
Société Générale Johannesburg BranchPO Box 6872, Johannesburg, 2000
Asset Manager
Absa Asset ManagementAn authorised financial services provider, FSP No: 522 Telephone: +27 (0)11 243 4563 Website:www.absa.co.za/wim
Absa Core Income Fund
Wealth and Investment Management
Absa Core Income Fund Fund Commentary30 September 2017
Commentary Document The Reserve Bank’s Monetary Policy Committee (MPC) reduced the repo rate by 25 basis points to 6.75% for the first time in five years at its July policy meeting, dueto rising growth concerns and easing inflation forecasts. However, the Reserve Bank disappointed markets at its September meeting when they decided to keep therepo rate on hold, defying market expectations for a further 25 basis point rate cut. Governor Lesetja Kganyago cited heightened uncertainties in the economy asreason to keep the repo rate on hold. The prospect of further sovereign credit-ratings downgrades; upside risk to inflation from a potential 20% electricity tariff hike;looming US interest rates hikes, which would put upward pressure on the Rand; as well as the rise in crude oil prices, all of which will put upward pressure on theinflation trajectory. The Reserve Bank revised its inflation forecast marginally higher to 5.00% in 2018 from 4.90%, while 2017 forecast was left unchanged at5.30%. Local politics and a newfound strength in the US Dollar continued to plaque the Rand which was under significant pressure in September. A hawkish Federal OpenMarket Committee (FOMC) and the announcement of the start of the US balance sheet reduction caused the Dollar to strengthen. The Rand thus weakened againstthe US Dollar and other major currencies. The Rand ended the quarter at 13.55 against the US Dollar. The forward rate agreement (FRA) curve moved higher after the MPC’s decision to keep rates on hold, thus shifting expectations from a 100% probability of a 25basis points cut in November to a 50% probability. Consequently, the money market yield curve steepened toward the end of September, with the 1 year NCD rate trading higher at 7.70% from a previous low of7.50%. Bond yields fell sharply on the back of the rate cut in July, and the curve steepened further driven by the rise in US -10 year treasury yield. The yield on the R186 bondtraded a low 8.38% and ended the quarter at 8.55%. The weighted average duration on the Fund continues to be kept relatively close to the maximum permitted weighted average duration.
DisclosuresCollective Investment Schemes (CIS) are generally medium to long-term investments. The value of participatory interests may go down as well as up and pastperformance is not necessarily a guide to future performance. Fluctuations or movements in exchange rates may cause the value of underlying international investmentsin a fund to move up or down. Forward pricing is used. CIS are traded at ruling prices. Absa Fund Managers Limited (AFM) may borrow up to 10% (ten per cent) ofthe market value of a fund to accommodate insufficient liquidity. Securities in a fund may be lent to borrowers. Income from the fund is distributed quarterly and mayonly be paid out into an account as nominated by the investor. Prices are calculated on a net asset value (NAV) basis which is the total value of all assets in a fundincluding any income accrual and less permissible deductions from the fund. Prices are published daily and are available at www.absa.co.za/Absacoza/Indices/Absa-Unit-Trusts and in daily newspapers, or from AFM upon request. Fees and charges associated with the most expensive class are available directly from AFM forinvestment by members of the public, other than financial institutions. CIS are financial products and not investments in insurance policies with an insurer and thereforecooling-off periods do not apply. AFM does not provide any guarantee either with respect to the capital or the return of a fund. The directors and personnel of AFMmay be invested in any of the funds. AFM holds professional indemnity cover. AFM utilises Absa Bank Limited’s electronic and telephone banking platform. All requestsfor transactions received on or before 16:00 every day will traded at ruling prices and valued after 16:00 on that day. Investments in funds with foreign securities mayinvolve various material risks, which include potential constraints on liquidity and the repatriation of funds, macroeconomic, political, foreign exchange, tax andsettlement risks and potential limitations on the availability of market information and there may be tax to be levied on certain of the benefits accruing to the investorfrom the funds and AFM may be required to deduct and pay over to the authorities any such tax from such benefits before paying any balance to or for the benefit ofthe investor. AFM has a right to close the fund to new investors in order to manage it more efficiently in accordance with its mandate. The investor understands thatthe legal and tax environment is continually changing, and that AFM cannot be held responsible for any changes to the law which might have an effect on theirinvestment, and which did not exist at the time their investment was made. Additional information on the fund including, but not limited to, brochures, applicationforms, annual and half-yearly reports are available free of charge from the AFM website or from AFM upon request. This portfolio derives its income primarily frominterest-bearing instruments. The yields quoted are current yields as at the relevant month end date. AFM is a registered Collective Investment Scheme Manager anda full member of the Association for Savings and Investment SA. This document is a Minimum Disclosure Document (MDD) in terms of the Advertising, Marketingand Information Disclosure Requirements for Collective Investment Schemes published by the Financial Services Board. MDD issue date: 15 November 2017
Contact details
Management Company
Absa Fund Managers LimitedReg no 1991/000881/06 Absa Sandton South Campus, 15 Alice Lane, Sandton, 2196 Private Bag X10056, Sandton, 2146 Contact Centre: 0860 111 456 Fax: 0860 212 123 Email: [email protected] Website: www.absa.co.za/wim
Trustees
Société Générale Johannesburg BranchPO Box 6872, Johannesburg, 2000
Asset Manager
Absa Asset ManagementAn authorised financial services provider, FSP No: 522 Telephone: +27 (0)11 243 4563 Website:www.absa.co.za/wim
Absa Core Income Fund

Wealth and Investment Management
Absa Smart Alpha Income Fund Minimum disclosure documentMonth ended 31 October 2017
Fund detailsIndustry category SA – Interest Bearing- Short TermBenchmark STeFi Composite IndexFund launch date 23 April 2015Class A launch Date 24 April 2015Class D launch date 24 April 2015Fund Size R 60.09 MillionJSE code ASACAFund Manager St John Bunkell -MSc Chem.EngAsset Manager Absa Alternative Asset ManagementMinimum lump sum R 2000Minimum Monthly R 200
Income distributions - cents per unit (cpu)Class A Class D
the 3 months ended 31 Dec 2016 1.68 1.79the 3 months ended 31 Mar 2017 1.75 1.83the 3 months ended 30 Jun 2017 2.12 2.15the 3 months ended 30 Sep 2017 0 0
Income declaration 31 Mar, 30 Jun, 30 Sep & 31 DecIncome distributions 15 Apr, 15 Jul, 15 Oct & 15 Jan
Fees and Cost ratio (VAT incl.)Fees Class A Class DInitial Fees: Absa: 0% 0%
Adviser: 0-3.42% 0%Annual Fees: Management: 0.51% 0.40%
Adviser: 0-1.14% 0%Performance Fee: No No
Costs (annual, based on period shown) Class A Class DFor the period to 30-06-2017, from: 23-04-2015 23-04-2015Total expense ratio (TER): 1.14% 0.49%Transaction costs (TC): 0.05% 0.05%Total investment charges (TER+TC): 1.19% 0.54%Please refer to Disclosure section on next page for further information on Fees and Costs
PerformancePerformance: cumulative total returns (%)Term Class A Benchmark Sector
AverageRank Class D
Launch 16.96 19.21 21.36 26/27 17.923 month 1.63 1.82 2.04 30/30 1.656 Month 3.80 3.73 4.26 29/30 3.859 Month 5.88 5.61 6.53 29/30 6.011 Year 7.76 7.60 8.70 28/29 7.97
Sector Average and Rank: applies to the A Class.Please refer to Disclosures section on next page for further information on calculation methodology and source of allperformance data content (tables and/or charts) of this MDD.
Fund objectivesThe Absa Smart Alpha Income Fund aims to provide investors with sustainableincome and liquidity over the short term with low standard deviation of return.Capital appreciation will be of an incidental nature
Fund strategyThe fund will invest in fixed income and assets in liquid form and be exposed tosmall amounts of market risk in fixed income (nominal and inflation- linkedgovernment bonds) in order to generate outperformance above assets in liquidform. The fund will have a relatively short duration by investing predominantly inMoney Market Instruments (min. 80%) while igenerating alpha using quantitativeAsset allocation techniques
Fund features• A specialised fixed-income fund, ideal for short-term investments• Aims to provide a reasonable level of current income and capital stability• Outperforms cash over time and hedges against interest rate volatility• Higher level of income than a traditional money market fund• Suitable for risk-averse investors who require a regular stream of income
from their capital base• Suitable for retirement fund investments
Fund specific risksDefault: There is a risk that the issuers of fixed income investments (e.g.bonds)may not be able to meet interest payments nor repay the money they haveborrowed. The worse the credit quality of the issuer, the greater the risk of defaultand therefore investment loss. Interest rate: The value offixed incomeinvestments (e.g. bonds) tends to decrease when interest rates and/or inflationrises. Liquidity: There may be insufficient buyers or sellers of particularinvestments giving rise to delays in trading and being able to make settlementsfrom the Fund and/or large fluctuations in the value of the Fund which may leadto larger financial losses than anticipated
Risk profile and advisable minimum termLow Low-Medium Medium Medium-High High
3 Months + 6 Months + 2 Years + 3 Years + 5 Years +
Risk statisticsClass A Since Inception (24 April 2015)Number of positive months 30/30Highest 1 Year Performance 31/10/2017 7.76%Lowest 1 Year Performance 30/04/2016 5.09%
Cumulative performance (since inception)
Absa Smart Alpha Income A Absa Smart Alpha Income D STeFI Composite
100
105
110
115
120
125
Apr-15
Jun-15
Sep-15
Dec-15
Mar-16
Jun-16
Sep-16
Dec-16
Mar-17
Jun-17
Oct-17
Absa Smart Alpha Income Fund

Wealth and Investment Management
Asset Allocation (%)
0,62%
40,51%
58,87%
Cash
Interest Bearing 0 - 3 yr
Money Market Assets
Duration Allocation
1,12%
1,67%
3,35%
6,89%
8,48%
23,42%
55,08%
Cash
9 to 12 Months
Over 24 Months
6 to 9 Months
12 to 24 Months
0 to 3 Months
3 to 6 Months
Quarterly fund commentary as at 30 September 2017The Fund Commentary is provided on a quarterly basis and can be found on www.absa.co.za/WIM under Unit Trusts Minimum Disclosure Documents. The latest quarterly commentaryavailable is for the quarter ending 30 September 2017.
DisclosuresFees: Class A Adviser annual fee is not included in the annual management fee, it is charged by a way of unit reduction.
Costs: Total Expense Ratio (“TER”) is expressed as an annualised percentage of the value of the Class of the portfolio that was incurred as expenses relating to the administration of theportfolio. A higher TER does not necessarily imply a poor return, nor does a lower TER imply a good return. The current TER cannot be regarded as an accurate indication of future TER's.Transaction Costs (“TC”) is expressed as an annualised percentage of the value of the portfolio that was incurred as costs relating to the buying and selling of the assets underlying theportfolio. TC are a necessary cost in administering the portfolio and impact returns. TC should not be considered in isolation as returns may be impacted by many other factors over timeincluding market returns, the type of portfolio, the investment decisions of the investment manager and the TER. Note that the total investment charges (TER+TC) have already been deductedprior to the calculation of the performance figures shown. Effective Annual Cost (“EAC”) is a measure that summarises the total cost that an investor incurs through their investment in aparticular financial product, based on the principles set out in the ASISA EAC standard. EAC data is available on request.
Performance: Performance is calculated for the portfolio⁄class of portfolios. Illustrative performance information is included for illustrative purposes only; individual investor performance maydiffer as a result of initial and ongoing fees, the actual investment date, the date of reinvestment and dividend withholding tax. All figures quoted are from Morningstar and⁄or IRESS, for theperiod ending 31/10/2017 (unless otherwise stated), calculated on a NAV to NAV basis, with income distributions reinvested on the ex-dividend date. Annualised figures refer to the averageyearly return of an investment over a given time period, all actual annual figures (if not shown) are available on request.
Collective Investment Schemes (CIS) are generally medium to long-term investments. The value of participatory interests may go down as well as up and past performance is not necessarilya guide to future performance. Fluctuations or movements in exchange rates may cause the value of underlying international investments In a fund to move up or down. Forward pricing isused. CIS are traded at ruling prices. Absa Fund Managers Limited (AFM) may borrow up to 10% (ten per cent) of the market value of a fund to accommodate insufficient liquidity. Securitiesin a fund may be lent to borrowers. Income from the fund is distributed quarterly and may only be paid out into an account as nominated by the investor. Prices are calculated on a net assetvalue (NAV) basis which is the total value of all assets in a fund including any income accrual and less permissible deductions from the fund. Prices are published daily and are available atwww.Absa.co.za/Absacoza/indices/Absa-unit-trusts and in daily newspapers, or from AFM upon request. Fees and charges associated with the most expensive class are available directlyfrom AFM for investment by members of the public, other than financial institutions. CIS are financial products and not investments in insurance policies with an insurer and therefore cooling-off periods do not apply. AFM does not provide any guarantee either with respect to the capital or the return of a fund. The directors and personnel of AFM may be invested In any of thefunds. AFM holds professional indemnity cover. AFM utilises Absa Bank Limited’s electronic and telephone banking platform. All requests for transactions received on or before 16:00 everyday will traded at ruling prices and valued after 16:00 on that day. Investments in funds with foreign securities may involve various material risks, which include potential constraints onliquidity and the repatriation of funds, macroeconomic, political, foreign exchange, tax and settlement risks and potential limitations on the availability of market information and there maybe tax to be levied on certain of the benefits accruing to the investor from the funds and AFM may be required to deduct and pay over to the authorities any such tax from such benefits beforepaying any balance to or for the benefit of the investor. AFM has A right to close the fund to new investors in order to manage it more efficiently in accordance with its mandate. The investorunderstands that the legal and tax environment is continually changing, and that AFM cannot be held responsible for any changes to the law which might have an effect on their investment,and which did not exist at the time their investment was made. Additional information on the fund including, but not limited to, brochures, application forms, annual and half-yearly reportsare available free of charge from the AFM website or from AFM upon request. This portfolio derives its income primarily from interest-bearing Instruments. The yields quoted are currentyields as at the relevant month end date. AFM is a registered Collective Investment Scheme Manager and a full member of the Association for Savings and Investment SA. This document isa Minimum Disclosure Document (MDD) in terms of the Advertising, Marketing and Information Disclosure requirements for Collective Investment Schemes published by the FinancialServices Board. MDD issue date: 15 November 2017
Contact detailsManagement Company
Absa Fund Managers LimitedReg no 1991/000881/06 Absa Sandton South Campus, 15 Alice Lane, Sandton, 2196 Private Bag X10056, Sandton, 2146 Contact Centre: 0860 111 456 Fax: 0860 212 123 Email: [email protected] Website: www.absa.co.za/wim
Trustees
Société Générale Johannesburg BranchPO Box 6872, Johannesburg, 2000
Asset Manager
Absa Alternative Asset ManagementAn authorised financial services provider, FSP No: 2877 Telephone: +27 (0)21 927 6404 Website:www.absa.co.za/wim
Absa Smart Alpha Income Fund

Wealth and Investment Management
Absa Smart Alpha Income Fund Fund Commentary30 September 2017
Commentary DocumentSA equities, represented by the FTSE/ JSE Top 40 Index (Top 40), rose 8.71% in the third quarter of this year, while SA bonds, represented by the South African AllBond Index, rose by 3.68% for the period. Global equities, represented by the MSCI World Index, rose 4.39%. The Rand weakened by 3.70% against the U.S. Dollarin the third quarter. The Fund by comparison rose by 1.86%, in the third quarter net of all costs and fees, relative to the Stefi Benchmark of 1.82%. South Africa’s economy recovered in the second quarter of 2017. This is largely attributed to a re-bound in the agriculture sector due to the improved summer rainfalland a mild improvement in the mining sector production. Low confidence amongst the private sector and consumers continues to result in low capital expenditureand tight fiscal policy has hamstrung public and SOE expenditure. Investors are uncertain as to the outcome of the December 2017 ANC leadership conference which sees two factions go head-to-head to elect their leadership. Eachfaction has very different views on what is needed for the economy which removes the prospect of policy certainty for the foreseeable future. Lower consumer expenditure, lower food prices (especially grains), a stable currency and stable energy prices have resulted in an improved inflation outlook. TheAugust 2017 year-on-year CPI printed at 4.8%, well within the 6% upper band. The relatively benign inflation outlook, coupled with weaker manufacturing andemployment figures, provided scope for the MPC of the SARB to cut the repo rate from 7.00% to 6.75% at the July meeting. The AAM Smart Alpha Income Fundwas long of fixed rates with a slightly longer duration than that of traditional money market funds and benefitted from the cut in rates.
DisclosuresCollective Investment Schemes (CIS) are generally medium to long-term investments. The value of participatory interests may go down as well as up and pastperformance is not necessarily a guide to future performance. Fluctuations or movements in exchange rates may cause the value of underlying international investmentsIn a fund to move up or down. Forward pricing is used. CIS are traded at ruling prices. Absa Fund Managers Limited (AFM) may borrow up to 10% (ten per cent) ofthe market value of a fund to accommodate insufficient liquidity. Securities in a fund may be lent to borrowers. Income from the fund is distributed quarterly and mayonly be paid out into an account as nominated by the investor. Prices are calculated on a net asset value (NAV) basis which is the total value of all assets in a fundincluding any income accrual and less permissible deductions from the fund. Prices are published daily and are available at www.Absa.co.za/Absacoza/indices/Absa-unit-trusts and in daily newspapers, or from AFM upon request. Fees and charges associated with the most expensive class are available directly from AFM forinvestment by members of the public, other than financial institutions. CIS are financial products and not investments in insurance policies with an insurer and thereforecooling-off periods do not apply. AFM does not provide any guarantee either with respect to the capital or the return of a fund. The directors and personnel of AFMmay be invested In any of the funds. AFM holds professional indemnity cover. AFM utilises Absa Bank Limited’s electronic and telephone banking platform. All requestsfor transactions received on or before 16:00 every day will traded at ruling prices and valued after 16:00 on that day. Investments in funds with foreign securities mayinvolve various material risks, which include potential constraints on liquidity and the repatriation of funds, macroeconomic, political, foreign exchange, tax andsettlement risks and potential limitations on the availability of market information and there may be tax to be levied on certain of the benefits accruing to the investorfrom the funds and AFM may be required to deduct and pay over to the authorities any such tax from such benefits before paying any balance to or for the benefit ofthe investor. AFM has A right to close the fund to new investors in order to manage it more efficiently in accordance with its mandate. The investor understands thatthe legal and tax environment is continually changing, and that AFM cannot be held responsible for any changes to the law which might have an effect on theirinvestment, and which did not exist at the time their investment was made. Additional information on the fund including, but not limited to, brochures, applicationforms, annual and half-yearly reports are available free of charge from the AFM website or from AFM upon request. This portfolio derives its income primarily frominterest-bearing Instruments. The yields quoted are current yields as at the relevant month end date. AFM is a registered Collective Investment Scheme Manager anda full member of the Association for Savings and Investment SA. This document is a Minimum Disclosure Document (MDD) in terms of the Advertising, Marketingand Information Disclosure requirements for Collective Investment Schemes published by the Financial Services Board. MDD issue date: 15 November 2017
Contact details
Management Company
Absa Fund Managers LimitedReg no 1991/000881/06 Absa Sandton South Campus, 15 Alice Lane, Sandton, 2196 Private Bag X10056, Sandton, 2146 Contact Centre: 0860 111 456 Fax: 0860 212 123 Email: [email protected] Website: www.absa.co.za/wim
Trustees
Société Générale Johannesburg BranchPO Box 6872, Johannesburg, 2000
Asset Manager
Absa Alternative Asset ManagementAn authorised financial services provider, FSP No: 2877 Telephone: +27 (0)21 927 6404 Website:www.absa.co.za/wim
Absa Smart Alpha Income Fund
Wealth and Investment Management
Absa Tactical Income Fund Minimum disclosure documentMonth ended 31 October 2017
Fund detailsIndustry category SA - Multi Asset - IncomeBenchmark 3 Month JIBAR + 2.5% p.aFund launch date 14 June 2017Class A launch Date 14 June 2017Fund Size R 62.95 MillionJSE code ABTCAFund Manager James Turp - B.com, SAIFM
Eben Mare – B.Sc. (Hons), M.Sc., Ph.D Applied MathematicsAsset Manager Absa Asset Management (Pty) LtdMinimum lump sum R 2 000Minimum Monthly R 200
Income distributions - cents per unit (cpu)Class A
the 6 months ended 31 Dec 2016the 6 months ended 30 Jun 2017 0.24
Income declaration 30 June & 31 DecemberIncome distributions 15 July & 15 January
Fees and Cost ratio (VAT incl.)Fees Class AInitial Fees: Absa: 0%
Adviser: 0 -3.42%Annual Fees: Management: 0.63%
Adviser: 0-1.14%Performance Fee: No
Costs (annual, based on period shown) Class AFor the period to 30-06-2017, from: 23-04-2015Total expense ratio (TER): 0.69%Transaction costs (TC): 0%Total investment charges (TER+TC): 0.69%Please refer to Disclosure section on next page for further information on Fees and Costs
Performance*Performance and risk data is not displayed as the fund/class is less than 6 months old.
Fund objectivesThe Absa Tactical Income Fund aims to deliver higher risk- risk adjusted returnsthan traditional money market or pure income portfolios, while preserving capitalover a twelve month rolling period.
Fund strategyThe Fund will be actively managed to allow cycle-based tactical allocations alongthe yield curve, which are specific to prevailing market conditions, with the aimto achieve risk adjusted performance returns in excess of money market yieldsor traditional yield depending on the interest rate cycle. Securities to be includedin the fund will be assets in liquid form, interest bearing securities, other non-equity securities acquired on the exchanges (as legislation permits), equitysecurities-as per the ASISA SA Multi Assets Income category limits , and any otherincome bearing instrument and securities that the Act may from time to timeallow and which are considered consistent with the portfolio’s primary objectiveand allowed by regulations as may change from time to time, listed and unlistedinstruments, all to be acquired at fair market prices.
Fund features• Exposure to the South African yield curve will be actively managed based on
the interest rate cycle and will not constrained by a particular fixed- interestbenchmark weighting.
• The duration characteristics may be that of a money market fund, a pureincome fund or a combination thereof, depending on the interest rate cycle.
• The strategy give rise tactical signal where the invest cycle is gauged, relativeto the longer-term strategic forecasts, therefore enabling benefits to bederived from reduced risk and improved returns on a cycle adjusted basis.
Fund specific risksDefault: There is a risk that the issuers of fixed income investments (e.g. bonds)may not be able to meet interest payments nor repay the money they haveborrowed. The worse the credit quality of the issuer, the greater the risk of defaultand therefore investment loss. Interest rate: The value of fixed incomeinvestments (e.g. bonds) tends to decrease when interest rates and/or inflationrises. Liquidity: There may be insufficient buyers or sellers of particularinvestments giving rise to delays in trading and being able to make settlementsfrom the Fund and/or large fluctuations in the value of the Fund which may leadto larger financial losses than might be anticipated.
Risk profile and advisable minimum termLow Low-Medium Medium Medium-High High
3 Months + 6 Months + 2 Years + 3 Years + 5 Years +
Risk statisticsNo risk statistics for this class of the portfolio are currently disclosed due to thelength of time that this class of the portfolio has been in existence.
Absa Tactical Income Fund

Wealth and Investment Management
Asset Allocation (%)
32,17%
33,31%
34,52%
Interest bearing CIS
Fixed rate bonds
Money market
Quarterly fund commentary as at 30 September 2017The Fund Commentary is provided on a quarterly basis and can be found on www.absa.co.za/WIM under Unit Trusts Minimum Disclosure Documents. The latest quarterly commentaryavailable is for the quarter ending 30 September 2017.
DisclosuresFees: Class A Adviser annual fee is not included in the annual management fee, it is charged by a way of unit reduction.
Costs: Total Expense Ratio (“TER”) is expressed as an annualised percentage of the value of the Class of the portfolio that was incurred as expenses relating to the administration of theportfolio. A higher TER does not necessarily imply a poor return, nor does a lower TER imply a good return. The current TER cannot be regarded as an accurate indication of future TER's.Transaction Costs (“TC”) is expressed as an annualised percentage of the value of the portfolio that was incurred as costs relating to the buying and selling of the assets underlying theportfolio. TC are a necessary cost in administering the portfolio and impact returns. TC should not be considered in isolation as returns may be impacted by many other factors over timeincluding market returns, the type of portfolio, the investment decisions of the investment manager and the TER. Note that the Total Investment Charges (TER+TC) have already been deductedprior to the calculation of the performance figures shown. Effective Annual Cost (“EAC”) is a measure that summarises the total cost that an investor incurs through their investment in aparticular financial product, based on the principles set out in the ASISA EAC Standard. EAC data is available on request.
Performance: Performance is calculated for the portfolio⁄ class of portfolios. Illustrative performance information is included for illustrative purposes only; individual investor performance maydiffer as a result of initial and ongoing fees, the actual investment date, the date of reinvestment and dividend withholding tax. All figures quoted are from Morningstar and⁄ or IRESS, for theperiod ending 31/10/2017 (unless otherwise stated), calculated on a NAV to NAV basis, with income distributions reinvested on the ex-dividend date. Annualised figures refer to the averageyearly return of an investment over a given time period, all actual annual figures (if not shown) are available on request.
Collective Investment Schemes (CIS) are generally medium to long-term investments. The value of participatory interests may go down as well as up and past performance is not necessarilya guide to future performance. Fluctuations or movements in exchange rates may cause the value of underlying international investments an a fund to move up or down. Forward pricing isused. CIS are traded at ruling prices. Absa Fund Managers Limited (AFM) may borrow up to 10% (ten per cent) of the market value of a fund to accommodate insufficient liquidity. Securitiesin a fund may be lent to borrowers. Income from the fund is distributed quarterly and may only be paid out into an account as nominated by the investor. Prices are calculated on a net assetvalue (NAV) basis which is the total value of all assets in a fund including any income accrual and less permissible deductions from the fund. Prices are published daily and are available atwww.Absa.co.za/Absacoza/indices/Absa-unit-trusts and in daily newspapers, or from AFM upon request. Fees and charges associated with the most expensive class are available directlyfrom AFM for investment by members of the public, other than financial institutions. CIS are financial products and not investments in insurance policies with an insurer and therefore cooling-off periods do not apply. AFM does not provide any guarantee either with respect to the capital or the return of a fund. The directors and personnel of AFM may be invested in any of thefunds. AFM holds professional indemnity cover. AFM utilises Absa Bank Limited’s electronic and telephone banking platform. All requests for transactions received on or before 16:00 everyday will traded at ruling prices and valued after 16:00 on that day. Investments in funds with foreign securities may involve various material risks, which include potential constraints onliquidity and the repatriation of funds, macroeconomic, political, foreign exchange, tax and settlement risks and potential limitations on the availability of market information and there maybe tax to be levied on certain of the benefits accruing to the investor from the funds and AFM may be required to deduct and pay over to the authorities any such tax from such benefits beforepaying any balance to or for the benefit of the investor. AFM has a right to close the fund to new investors in order to manage it more efficiently in accordance with its mandate. The investorunderstands that the legal and tax environment is continually changing, and that AFM cannot be held responsible for any changes to the law which might have an effect on their investment,and which did not exist at the time their investment was made. Additional information on the fund including, but not limited to, brochures, application forms, annual and half-yearly reportsare available free of charge from the AFM website or from AFM upon request. This portfolio derives its income primarily from interest-bearing Instruments. The yields quoted are currentyields as at the relevant month end date. AFM is a registered Collective Investment Scheme Manager and a full member of the Association for Savings and Investment SA. This document isa Minimum Disclosure Document (MDD) in terms of the Advertising, Marketing and Information Disclosure Requirements for Collective Investment Schemes published by the FinancialServices Board. MDD issue date: 15 November 2017
Contact detailsManagement Company
Absa Fund Managers LimitedReg no 1991/000881/06 Absa Sandton South Campus, 15 Alice Lane, Sandton, 2196 Private Bag X10056, Sandton, 2146 Contact Centre: 0860 111 456 Fax: 0860 212 123 Email: [email protected] Website: www.absa.co.za/wim
Trustees
Société Générale Johannesburg BranchPO Box 6872, Johannesburg, 2000
Asset Manager
Absa Alternative Asset ManagementAn authorised financial services provider, FSP No: 2877 Telephone: +27 (0)21 927 6404 Website:www.absa.co.za/wim
Absa Tactical Income Fund

Wealth and Investment Management
Absa Bond Fund Minimum disclosure documentMonth ended 31 October 2017
Fund detailsIndustry category SA - Interest Bearing - Variable TermBenchmark BEASSA All Bond IndexFund launch date 14 May 2002Class A launch Date 14 May 2002Fund Size R 2.34 BillionJSE code ABBAFund Manager James Turp – B.Econ, SAIFMAsset Manager Absa Asset Management (Pty) LtdMinimum lump sum R 2000Minimum Monthly R 200
Income distributions - cents per unit (cpu)Class A
the 3 months ended 31 Dec 2016 2.16the 3 months ended 31 Mar 2017 2.48the 3 months ended 30 Jun 2017 2.35the 3 months ended 30 Sep 2017 2.45
Income declaration 31 Mar, 30 Jun, 30 Sep & 31 DecIncome distributions 15 Apr, 15 Jul, 15 Oct & 15 Jan
Fees and Cost ratio (VAT incl.)Fees Class AInitial Fees: Absa: 0%
Adviser: 0 -3.42%Annual Fees: Management: 0.57%
Adviser: 0-1.14%Performance Fee: No
Costs (annual, based on period shown) Class AFor the period to 30-06-2017, from: 01/07/2014Total expense ratio (TER): 0.82%Transaction costs (TC): 0.66%Total investment charges (TER+TC): 1.48%Please refer to Disclosure section on next page for further information on Fees and Costs
PerformancePerformance: annualised total returns (%)Term Class A Benchmark Sector Average RankLaunch 9.22 9.46 9.16 8/101 Year 6.66 5.04 4.66 9/333 Year 6.84 5.61 5.30 4/225 Year 6.32 5.98 5.69 7/1810 Year 7.60 8.01 7.81 13/15
Performance Yearly returns (%)1 yr ending: Oct'17 Oct'16 Oct'15 Oct'14 Oct'13 Oct'12 Oct'11 Oct'10Class A 6.66 9.01 4.90 7.92 3.21 12.23 7.67 15.02Benchmark 5.04 6.95 4.85 8.98 4.14 13.22 7.76 16.74Sector Average & Rank: applies to the A Class. Please refer to Disclosures section on next page for further informationon calculation methodology and source of all performance data content (tables and/or charts) of this MDD
Fund objectivesAbsa Bond Fund is a specialist portfolio in the fixed income funds category whoseprimary objective is to seek above average income with some capital growth atbelow average risk to investors.
Fund strategyThe Fund will provide investors with well-diversified exposure to the SouthAfrican Bond market as well as other interest bearing instruments and will investprimarily in South African bonds, corporate bonds, gilts, fixed deposits and otherinterest-bearing instruments of differing terms to maturity, taking into accountchanges in interest rates, credit risk and liquidity.
Fund features• A specialist fixed-income fund, ideal for medium to long term investments• Provides affordable access and exposure to the South African bond market• Offers diversification from equity shares• Potential higher return and with more volatility than money market and
traditional income funds• Suitable for investors requiring above average income with some capital
growth
Fund specific risksDefault: There is a risk that the issuers of fixed income investments (e.g. bonds)may not be able to meet interest payments nor repay the money they haveborrowed. The worse the credit quality of the issuer, the greater the risk of defaultand therefore investment loss.Interest rate: The value of fixed incomeinvestments (e.g. bonds) tends to decrease when interest rates and/or inflationrises.Liquidity: There may be insufficient buyers or sellers of particularinvestments giving rise to delays in trading and being able to make settlementsfrom the Fund and/or large fluctuations in the value of the Fund which may leadto larger financial losses than might be anticipated.
Risk profile and advisable minimum termLow Low-Medium Medium Medium-High High
3 Months + 6 Months + 2 Years + 3 Years + 5 Years +
Risk statisticsClass A Since Inception (14 May 2002)Number of positive months 124/185Highest 1 Year Performance 30/06/2003 25.94%Lowest 1 Year Performance 31/01/2016 -4.45%
Cumulative performance (5 years)
ABSA Bond A BEASSA ALBI
85
100
115
130
145
160
Oct-12
Dec-12
Mar-13
Jun-13
Sep-13
Dec-13
Mar-14
Jun-14
Sep-14
Dec-14
Mar-15
Jun-15
Sep-15
Dec-15
Mar-16
Jun-16
Sep-16
Dec-16
Mar-17
Jun-17
Oct-17
The chart reflects the value (monthly data points) of a R100 investment made on the01/11/2012
Absa Bond Fund
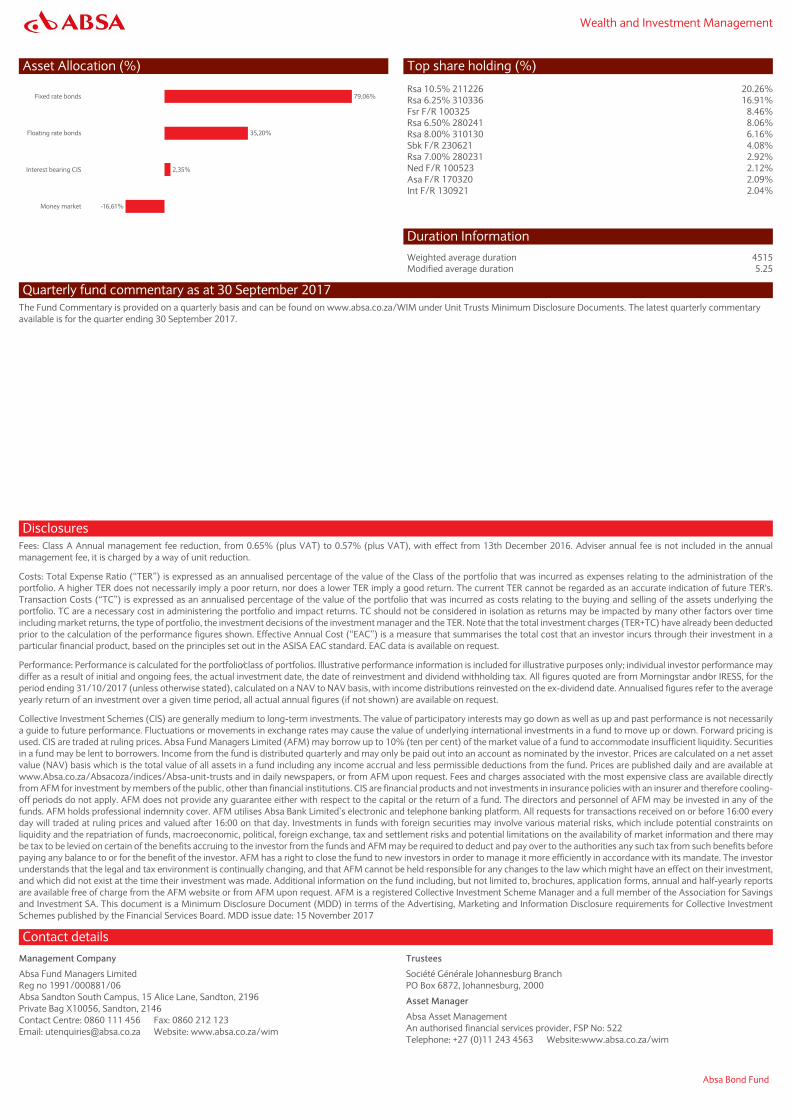
Wealth and Investment Management
Asset Allocation (%)
-16,61%
2,35%
35,20%
79,06%
Money market
Interest bearing CIS
Floating rate bonds
Fixed rate bonds
Top share holding (%)
Rsa 10.5% 211226 20.26%Rsa 6.25% 310336 16.91%Fsr F/R 100325 8.46%Rsa 6.50% 280241 8.06%Rsa 8.00% 310130 6.16%Sbk F/R 230621 4.08%Rsa 7.00% 280231 2.92%Ned F/R 100523 2.12%Asa F/R 170320 2.09%Int F/R 130921 2.04%
Duration InformationWeighted average duration 4515Modified average duration 5.25
Quarterly fund commentary as at 30 September 2017The Fund Commentary is provided on a quarterly basis and can be found on www.absa.co.za/WIM under Unit Trusts Minimum Disclosure Documents. The latest quarterly commentaryavailable is for the quarter ending 30 September 2017.
DisclosuresFees: Class A Annual management fee reduction, from 0.65% (plus VAT) to 0.57% (plus VAT), with effect from 13th December 2016. Adviser annual fee is not included in the annualmanagement fee, it is charged by a way of unit reduction.
Costs: Total Expense Ratio (“TER”) is expressed as an annualised percentage of the value of the Class of the portfolio that was incurred as expenses relating to the administration of theportfolio. A higher TER does not necessarily imply a poor return, nor does a lower TER imply a good return. The current TER cannot be regarded as an accurate indication of future TER's.Transaction Costs (“TC”) is expressed as an annualised percentage of the value of the portfolio that was incurred as costs relating to the buying and selling of the assets underlying theportfolio. TC are a necessary cost in administering the portfolio and impact returns. TC should not be considered in isolation as returns may be impacted by many other factors over timeincluding market returns, the type of portfolio, the investment decisions of the investment manager and the TER. Note that the total investment charges (TER+TC) have already been deductedprior to the calculation of the performance figures shown. Effective Annual Cost (“EAC”) is a measure that summarises the total cost that an investor incurs through their investment in aparticular financial product, based on the principles set out in the ASISA EAC standard. EAC data is available on request.
Performance: Performance is calculated for the portfolio⁄class of portfolios. Illustrative performance information is included for illustrative purposes only; individual investor performance maydiffer as a result of initial and ongoing fees, the actual investment date, the date of reinvestment and dividend withholding tax. All figures quoted are from Morningstar and⁄or IRESS, for theperiod ending 31/10/2017 (unless otherwise stated), calculated on a NAV to NAV basis, with income distributions reinvested on the ex-dividend date. Annualised figures refer to the averageyearly return of an investment over a given time period, all actual annual figures (if not shown) are available on request.
Collective Investment Schemes (CIS) are generally medium to long-term investments. The value of participatory interests may go down as well as up and past performance is not necessarilya guide to future performance. Fluctuations or movements in exchange rates may cause the value of underlying international investments in a fund to move up or down. Forward pricing isused. CIS are traded at ruling prices. Absa Fund Managers Limited (AFM) may borrow up to 10% (ten per cent) of the market value of a fund to accommodate insufficient liquidity. Securitiesin a fund may be lent to borrowers. Income from the fund is distributed quarterly and may only be paid out into an account as nominated by the investor. Prices are calculated on a net assetvalue (NAV) basis which is the total value of all assets in a fund including any income accrual and less permissible deductions from the fund. Prices are published daily and are available atwww.Absa.co.za/Absacoza/indices/Absa-unit-trusts and in daily newspapers, or from AFM upon request. Fees and charges associated with the most expensive class are available directlyfrom AFM for investment by members of the public, other than financial institutions. CIS are financial products and not investments in insurance policies with an insurer and therefore cooling-off periods do not apply. AFM does not provide any guarantee either with respect to the capital or the return of a fund. The directors and personnel of AFM may be invested in any of thefunds. AFM holds professional indemnity cover. AFM utilises Absa Bank Limited’s electronic and telephone banking platform. All requests for transactions received on or before 16:00 everyday will traded at ruling prices and valued after 16:00 on that day. Investments in funds with foreign securities may involve various material risks, which include potential constraints onliquidity and the repatriation of funds, macroeconomic, political, foreign exchange, tax and settlement risks and potential limitations on the availability of market information and there maybe tax to be levied on certain of the benefits accruing to the investor from the funds and AFM may be required to deduct and pay over to the authorities any such tax from such benefits beforepaying any balance to or for the benefit of the investor. AFM has a right to close the fund to new investors in order to manage it more efficiently in accordance with its mandate. The investorunderstands that the legal and tax environment is continually changing, and that AFM cannot be held responsible for any changes to the law which might have an effect on their investment,and which did not exist at the time their investment was made. Additional information on the fund including, but not limited to, brochures, application forms, annual and half-yearly reportsare available free of charge from the AFM website or from AFM upon request. AFM is a registered Collective Investment Scheme Manager and a full member of the Association for Savingsand Investment SA. This document is a Minimum Disclosure Document (MDD) in terms of the Advertising, Marketing and Information Disclosure requirements for Collective InvestmentSchemes published by the Financial Services Board. MDD issue date: 15 November 2017
Contact detailsManagement Company
Absa Fund Managers LimitedReg no 1991/000881/06 Absa Sandton South Campus, 15 Alice Lane, Sandton, 2196 Private Bag X10056, Sandton, 2146 Contact Centre: 0860 111 456 Fax: 0860 212 123 Email: [email protected] Website: www.absa.co.za/wim
Trustees
Société Générale Johannesburg BranchPO Box 6872, Johannesburg, 2000
Asset Manager
Absa Asset ManagementAn authorised financial services provider, FSP No: 522 Telephone: +27 (0)11 243 4563 Website:www.absa.co.za/wim
Absa Bond Fund
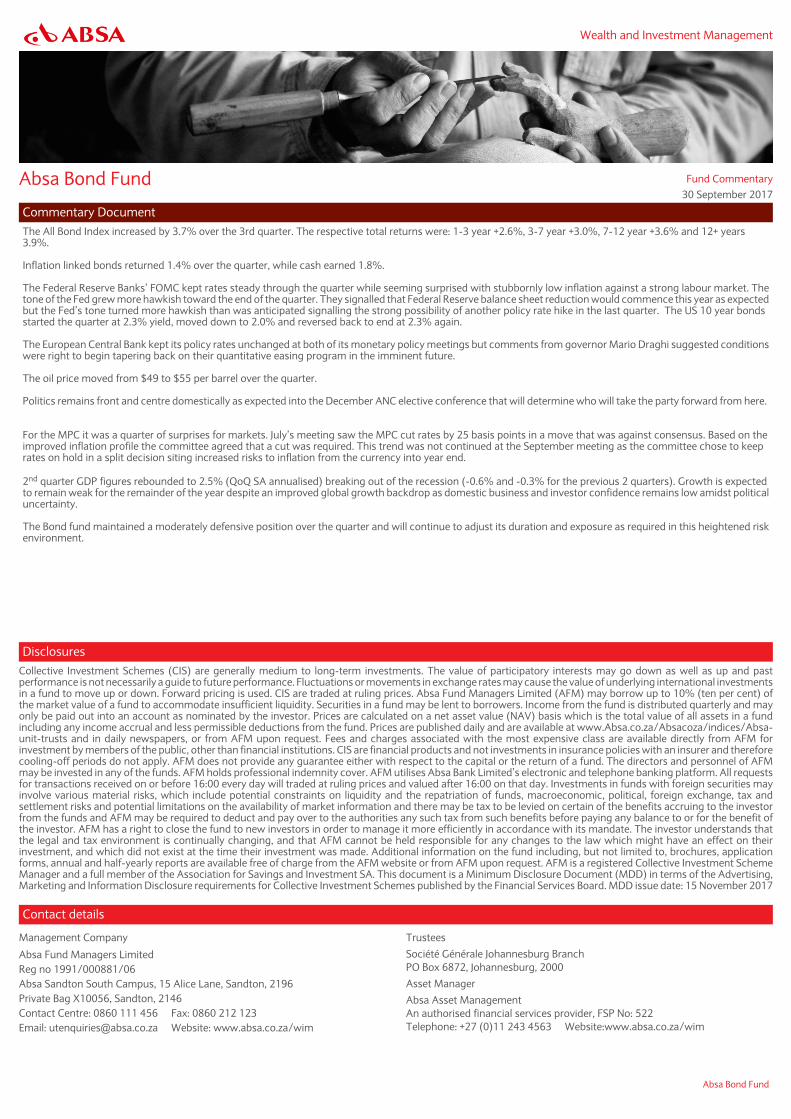
Wealth and Investment Management
Absa Bond Fund Fund Commentary30 September 2017
Commentary DocumentThe All Bond Index increased by 3.7% over the 3rd quarter. The respective total returns were: 1-3 year +2.6%, 3-7 year +3.0%, 7-12 year +3.6% and 12+ years3.9%. Inflation linked bonds returned 1.4% over the quarter, while cash earned 1.8%. The Federal Reserve Banks’ FOMC kept rates steady through the quarter while seeming surprised with stubbornly low inflation against a strong labour market. Thetone of the Fed grew more hawkish toward the end of the quarter. They signalled that Federal Reserve balance sheet reduction would commence this year as expectedbut the Fed’s tone turned more hawkish than was anticipated signalling the strong possibility of another policy rate hike in the last quarter. The US 10 year bondsstarted the quarter at 2.3% yield, moved down to 2.0% and reversed back to end at 2.3% again. The European Central Bank kept its policy rates unchanged at both of its monetary policy meetings but comments from governor Mario Draghi suggested conditionswere right to begin tapering back on their quantitative easing program in the imminent future. The oil price moved from $49 to $55 per barrel over the quarter. Politics remains front and centre domestically as expected into the December ANC elective conference that will determine who will take the party forward from here. For the MPC it was a quarter of surprises for markets. July’s meeting saw the MPC cut rates by 25 basis points in a move that was against consensus. Based on theimproved inflation profile the committee agreed that a cut was required. This trend was not continued at the September meeting as the committee chose to keeprates on hold in a split decision siting increased risks to inflation from the currency into year end. 2nd quarter GDP figures rebounded to 2.5% (QoQ SA annualised) breaking out of the recession (-0.6% and -0.3% for the previous 2 quarters). Growth is expectedto remain weak for the remainder of the year despite an improved global growth backdrop as domestic business and investor confidence remains low amidst politicaluncertainty. The Bond fund maintained a moderately defensive position over the quarter and will continue to adjust its duration and exposure as required in this heightened riskenvironment.
DisclosuresCollective Investment Schemes (CIS) are generally medium to long-term investments. The value of participatory interests may go down as well as up and pastperformance is not necessarily a guide to future performance. Fluctuations or movements in exchange rates may cause the value of underlying international investmentsin a fund to move up or down. Forward pricing is used. CIS are traded at ruling prices. Absa Fund Managers Limited (AFM) may borrow up to 10% (ten per cent) ofthe market value of a fund to accommodate insufficient liquidity. Securities in a fund may be lent to borrowers. Income from the fund is distributed quarterly and mayonly be paid out into an account as nominated by the investor. Prices are calculated on a net asset value (NAV) basis which is the total value of all assets in a fundincluding any income accrual and less permissible deductions from the fund. Prices are published daily and are available at www.Absa.co.za/Absacoza/indices/Absa-unit-trusts and in daily newspapers, or from AFM upon request. Fees and charges associated with the most expensive class are available directly from AFM forinvestment by members of the public, other than financial institutions. CIS are financial products and not investments in insurance policies with an insurer and thereforecooling-off periods do not apply. AFM does not provide any guarantee either with respect to the capital or the return of a fund. The directors and personnel of AFMmay be invested in any of the funds. AFM holds professional indemnity cover. AFM utilises Absa Bank Limited’s electronic and telephone banking platform. All requestsfor transactions received on or before 16:00 every day will traded at ruling prices and valued after 16:00 on that day. Investments in funds with foreign securities mayinvolve various material risks, which include potential constraints on liquidity and the repatriation of funds, macroeconomic, political, foreign exchange, tax andsettlement risks and potential limitations on the availability of market information and there may be tax to be levied on certain of the benefits accruing to the investorfrom the funds and AFM may be required to deduct and pay over to the authorities any such tax from such benefits before paying any balance to or for the benefit ofthe investor. AFM has a right to close the fund to new investors in order to manage it more efficiently in accordance with its mandate. The investor understands thatthe legal and tax environment is continually changing, and that AFM cannot be held responsible for any changes to the law which might have an effect on theirinvestment, and which did not exist at the time their investment was made. Additional information on the fund including, but not limited to, brochures, applicationforms, annual and half-yearly reports are available free of charge from the AFM website or from AFM upon request. AFM is a registered Collective Investment SchemeManager and a full member of the Association for Savings and Investment SA. This document is a Minimum Disclosure Document (MDD) in terms of the Advertising,Marketing and Information Disclosure requirements for Collective Investment Schemes published by the Financial Services Board. MDD issue date: 15 November 2017
Contact details
Management Company
Absa Fund Managers LimitedReg no 1991/000881/06 Absa Sandton South Campus, 15 Alice Lane, Sandton, 2196 Private Bag X10056, Sandton, 2146 Contact Centre: 0860 111 456 Fax: 0860 212 123 Email: [email protected] Website: www.absa.co.za/wim
Trustees
Société Générale Johannesburg BranchPO Box 6872, Johannesburg, 2000
Asset Manager
Absa Asset ManagementAn authorised financial services provider, FSP No: 522 Telephone: +27 (0)11 243 4563 Website:www.absa.co.za/wim
Absa Bond Fund

Wealth and Investment Management
Absa Inflation Linked Income Fund Minimum disclosure documentMonth ended 31 October 2017
Fund detailsIndustry category SA - Interest Bearing - Variable TermBenchmark CPI + 2%Fund launch date 13 October 2016Class A launch Date 13 October 2016Fund Size R 863.86 MillionJSE code ABLCAFund Manager James Turp – B.Econ, SAIFM
Eben Mare – B.Sc. (Hons), M.Sc., Ph.D Applied MathematicsAsset Manager Absa Asset Management (Pty) LtdMinimum lump sum R 2000Minimum Monthly R 200
Income distributions - cents per unit (cpu)Class A
the 3 months ended 31 Dec 2016 0the 3 months ended 31 Mar 2017 1.58the 3 months ended 30 Jun 2017 1.74the 3 months ended 30 Sep 2017 1.8
Income declaration 31 Mar, 30 Jun, 30 Sep & 31 DecIncome distributions 15 Apr, 15 Jul, 15 Oct & 15 Jan
Fees and Cost ratio (VAT incl.)Fees Class AInitial Fees: Absa: 0%
Adviser: 0-3.42%Annual Fees: Management: 0.57%
Adviser: 0-1.14%Performance Fee: No
Costs (annual, based on period shown) Class AFor the period to 30-06-2017, from: 13-10-2016Total expense ratio (TER): 0.60%Transaction costs (TC): 0.25%Total investment charges (TER+TC): 0.85%Please refer to Disclosure section on next page for further information on Fees and Costs
PerformancePerformance cummulative total returns (%)Term Class A Benchmark Sector Average RankLaunch 8.60 7.45 5.90 3/331 Month -0.08 0.64 -1.59 3/343 month 1.64 1.36 0.33 2/346 Month 3.73 2.45 1.57 2/349 Month 5.87 - 3.74 3/33
Sector Average & Rank: applies to the A Class.Please refer to Disclosures section on next page for further information on calculation methodologyand source of all performance data content (tables and/or charts) of this MDD
Cumulative performance (since inception)
Absa Inflation Linked Income A CPI + 2%
100
103
106
109
112
115
Oct-16
Dec-16
Mar-17
Jun-17
Oct-17
The chart reflects the value (monthly data points) of a R100 investment made on the 13 October 2016
Fund objectivesThe objective of the fund is to provide investors with a real rate of return aboveinflation (CPI), through exposure to a diversified portfolio of inflation linked fixedsecurities.
Fund strategyThe fund will be a fixed-interest portfolio that will predominantly invest in nominaland inflation linked fixed interest securities, other fixed income securities withlonger term maturity bias, assets in liquid form and other fixed-income securities(non-equity securities) from the markets around the world(as legislationpermits). Through active portfolio management, positions will be constantlymonitored to ensure that they remain within the investment criteria over theinvestment term
Fund features• Enables investors to obtain a real yield that preserves purchasing power even
when inflation is high• Ideal for risk-averse investors seeking positive real returns• Aims to provide a reasonable level of current income and capital stability
Fund specific risksDefault: There is a risk that the issuers of fixed income investments (e.g. bonds)may not be able to meet interest payments nor repay the money they haveborrowed. The worse the credit quality of the issuer, the greater the risk of defaultand therefore investment loss. Interest rate: The value of fixed incomeinvestments (e.g. bonds) tends to decrease when interest rates and/or inflationrises. Liquidity: There may be insufficient buyers or sellers of particularinvestments giving rise to delays in trading and being able to make settlementsfrom the Fund and/or large fluctuations in the value of the Fund which may leadto larger financial losses than anticipated
Risk profile and advisable minimum termLow Low-Medium Medium Medium-High High
3 Months + 6 Months + 2 Years + 3 Years + 5 Years +
Risk statisticsClass A Since Inception (13 October 2016)Number of positive months 9/12No highest/lowest one year performance data disclosed due to the length of thetime the fund has been in existence.
Absa Inflation Linked Income Fund

Wealth and Investment Management
Asset Allocation (%)
17,84%
20,44%
61,72%
Inflation linked bonds
Money market
Fixed & floatingrate bonds
Duration Allocation
0,27%
3,04%
3,24%
4,84%
5,50%
9,31%
10,04%
63,75%
12 - 15 months
0 - 3 months
Cash
3 - 6 months
18 - 21 months
21 - 24 months
6 - 9 months
>24 months
Quarterly fund commentary as at 30 September 2017The Fund Commentary is provided on a quarterly basis and can be found on www.absa.co.za/WIM under Unit Trusts Minimum Disclosure Documents. The latest quarterly commentaryavailable is for the quarter ending 30 September 2017.
DisclosuresFees: Class A Adviser annual fee is not included in the annual management fee, it is charged by a way of unit reduction.
Costs: Total Expense Ratio (“TER”) is expressed as an annualised percentage of the value of the Class of the portfolio that was incurred as expenses relating to the administration of theportfolio. A higher TER does not necessarily imply a poor return, nor does a lower TER imply a good return. The current TER cannot be regarded as an accurate indication of future TER's.Transaction Costs (“TC”) is expressed as an annualised percentage of the value of the portfolio that was incurred as costs relating to the buying and selling of the assets underlying theportfolio. TC are a necessary cost in administering the portfolio and impact returns. TC should not be considered in isolation as returns may be impacted by many other factors over timeincluding market returns, the type of portfolio, the investment decisions of the investment manager and the TER.Where the class/portfolio is less than 1 year old the TER and TC cannot bedetermined accurately because of the short life span, calculations are based on actual data where possible and best estimates where actual data is not available. Note that the Total InvestmentCharges (TER+TC) have already been deducted prior to the calculation of the performance figures shown. Effective Annual Cost (“EAC”) is a measure that summarises the total cost that aninvestor incurs through their investment in a particular financial product, based on the principles set out in the ASISA EAC Standard. EAC data is available on request.
Performance: Performance is calculated for the portfolio⁄ class of portfolios. Illustrative performance information is included for illustrative purposes only; individual investor performance maydiffer as a result of initial and ongoing fees, the actual investment date, the date of reinvestment and dividend withholding tax. All figures quoted are from Morningstar and⁄ or IRESS, for theperiod ending 31/10/2017 (unless otherwise stated), calculated on a NAV to NAV basis, with income distributions reinvested on the ex-dividend date. Annualised figures refer to the averageyearly return of an investment over a given time period, all actual annual figures (if not shown) are available on request.
Collective Investment Schemes (CIS) are generally medium to long-term investments. The value of participatory interests may go down as well as up and past performance is not necessarilya guide to future performance. Fluctuations or movements in exchange rates may cause the value of underlying international investments in a fund to move up or down. Forward pricing isused. CIS are traded at ruling prices. Absa Fund Managers Limited (AFM) may borrow up to 10% (ten per cent) of the market value of a fund to accommodate insufficient liquidity. Securitiesin a fund may be lent to borrowers. Income from the fund is distributed quarterly and may only be paid out into an account as nominated by the investor. Prices are calculated on a net assetvalue (NAV) basis which is the total value of all assets in a fund including any income accrual and less permissible deductions from the fund. Prices are published daily and are available atwww.Absa.co.za/Absacoza/indices/Absa-unit-trusts and in daily newspapers, or from AFM upon request. Fees and charges associated with the most expensive class are available directlyfrom AFM for investment by members of the public, other than financial institutions. CIS are financial products and not investments in insurance policies with an insurer and therefore cooling-off periods do not apply. AFM does not provide any guarantee either with respect to the capital or the return of a fund. The directors and personnel of AFM may be invested in any of thefunds. AFM holds professional indemnity cover. AFM utilises Absa Bank Limited’s electronic and telephone banking platform. All requests for transactions received on or before 16:00 everyday will traded at ruling prices and valued after 16:00 on that day. Investments in funds with foreign securities may involve various material risks, which include potential constraints onliquidity and the repatriation of funds, macroeconomic, political, foreign exchange, tax and settlement risks and potential limitations on the availability of market information and there maybe tax to be levied on certain of the benefits accruing to the investor from the funds and AFM may be required to deduct and pay over to the authorities any such tax from such benefits beforepaying any balance to or for the benefit of the investor. AFM has a right to close the fund to new investors in order to manage it more efficiently in accordance with its mandate. The investorunderstands that the legal and tax environment is continually changing, and that AFM cannot be held responsible for any changes to the law which might have an effect on their investment,and which did not exist at the time their investment was made. Additional information on the fund including, but not limited to, brochures, application forms, annual and half-yearly reportsare available free of charge from the AFM website or from AFM upon request. This portfolio derives its income primarily from interest-bearing instruments. The yields quoted are currentyields as at the relevant month end date. AFM is a registered Collective Investment Scheme Manager and a full member of the Association for Savings and Investment SA. This document isa Minimum Disclosure Document (MDD) in terms of the Advertising, Marketing and Information Disclosure Requirements for Collective Investment Schemes published by the FinancialServices Board. MDD issue date: 15 November 2017
Contact detailsManagement Company
Absa Fund Managers LimitedReg no 1991/000881/06 Absa Sandton South Campus, 15 Alice Lane, Sandton, 2196 Private Bag X10056, Sandton, 2146 Contact Centre: 0860 111 456 Fax: 0860 212 123 Email: [email protected] Website: www.absa.co.za/wim
Trustees
Société Générale Johannesburg BranchPO Box 6872, Johannesburg, 2000
Asset Manager
Absa Asset ManagementAn authorised financial services provider, FSP No: 522 Telephone: +27 (0)11 243 4563 Website:www.absa.co.za/wim
Absa Inflation Linked Income Fund

Wealth and Investment Management
Absa Inflation Linked Income Fund Fund Commentary30 September 2017
Commentary DocumentThe All Bond Index increased by 3.7% over the 3rd quarter. The respective total returns were: 1-3 year +2.6%, 3-7 year +3.0%, 7-12 year +3.6% and 12+ years3.9%. Inflation linked bonds returned 1.4% over the quarter, while cash earned 1.8%. The Federal Reserve Banks’ FOMC kept rates steady through the quarter while seeming surprised with stubbornly low inflation against a strong labour market. Thetone of the Fed grew more hawkish toward the end of the quarter. They signalled that Federal Reserve balance sheet reduction would commence this year as expectedbut the Fed’s tone turned more hawkish than was anticipated signalling the strong possibility of another policy rate hike in the last quarter. The US 10 year bondsstarted the quarter at 2.3% yield, moved down to 2.0% and reversed back to end at 2.3% again. The European Central Bank kept its policy rates unchanged at both of its monetary policy meetings but comments from governor Mario Draghi suggested conditionswere right to begin tapering back on their quantitative easing program in the imminent future. The oil price moved from $49 to $55 per barrel over the quarter. Politics remains front and centre domestically as expected into the December ANC elective conference that will determine who will take the party forward from here. For the MPC it was a quarter of surprises for markets. July’s meeting saw the MPC cut rates by 25 basis points in a move that was against consensus. Based on theimproved inflation profile the committee agreed that a cut was required. This trend was not continued at the September meeting as the committee chose to keeprates on hold in a split decision siting increased risks to inflation from the currency into year end. 2nd quarter GDP figures rebounded to 2.5% (QoQ SA annualised) breaking out of the recession (-0.6% and -0.3% for the previous 2 quarters). Growth is expectedto remain weak for the remainder of the year despite an improved global growth backdrop as domestic business and investor confidence remains low amidst politicaluncertainty. The Bond fund maintained a moderately defensive position over the quarter and will continue to adjust its duration and exposure as required in this heightened riskenvironment.
DisclosuresCollective Investment Schemes (CIS) are generally medium to long-term investments. The value of participatory interests may go down as well as up and pastperformance is not necessarily a guide to future performance. Fluctuations or movements in exchange rates may cause the value of underlying international investmentsin a fund to move up or down. Forward pricing is used. CIS are traded at ruling prices. Absa Fund Managers Limited (AFM) may borrow up to 10% (ten per cent) ofthe market value of a fund to accommodate insufficient liquidity. Securities in a fund may be lent to borrowers. Income from the fund is distributed quarterly and mayonly be paid out into an account as nominated by the investor. Prices are calculated on a net asset value (NAV) basis which is the total value of all assets in a fundincluding any income accrual and less permissible deductions from the fund. Prices are published daily and are available at www.Absa.co.za/Absacoza/indices/Absa-unit-trusts and in daily newspapers, or from AFM upon request. Fees and charges associated with the most expensive class are available directly from AFM forinvestment by members of the public, other than financial institutions. CIS are financial products and not investments in insurance policies with an insurer and thereforecooling-off periods do not apply. AFM does not provide any guarantee either with respect to the capital or the return of a fund. The directors and personnel of AFMmay be invested in any of the funds. AFM holds professional indemnity cover. AFM utilises Absa Bank Limited’s electronic and telephone banking platform. All requestsfor transactions received on or before 16:00 every day will traded at ruling prices and valued after 16:00 on that day. Investments in funds with foreign securities mayinvolve various material risks, which include potential constraints on liquidity and the repatriation of funds, macroeconomic, political, foreign exchange, tax andsettlement risks and potential limitations on the availability of market information and there may be tax to be levied on certain of the benefits accruing to the investorfrom the funds and AFM may be required to deduct and pay over to the authorities any such tax from such benefits before paying any balance to or for the benefit ofthe investor. AFM has a right to close the fund to new investors in order to manage it more efficiently in accordance with its mandate. The investor understands thatthe legal and tax environment is continually changing, and that AFM cannot be held responsible for any changes to the law which might have an effect on theirinvestment, and which did not exist at the time their investment was made. Additional information on the fund including, but not limited to, brochures, applicationforms, annual and half-yearly reports are available free of charge from the AFM website or from AFM upon request. This portfolio derives its income primarily frominterest-bearing instruments. The yields quoted are current yields as at the relevant month end date. AFM is a registered Collective Investment Scheme Manager anda full member of the Association for Savings and Investment SA. This document is a Minimum Disclosure Document (MDD) in terms of the Advertising, Marketingand Information Disclosure Requirements for Collective Investment Schemes published by the Financial Services Board. MDD issue date: 15 November 2017
Contact details
Management Company
Absa Fund Managers LimitedReg no 1991/000881/06 Absa Sandton South Campus, 15 Alice Lane, Sandton, 2196 Private Bag X10056, Sandton, 2146 Contact Centre: 0860 111 456 Fax: 0860 212 123 Email: [email protected] Website: www.absa.co.za/wim
Trustees
Société Générale Johannesburg BranchPO Box 6872, Johannesburg, 2000
Asset Manager
Absa Asset ManagementAn authorised financial services provider, FSP No: 522 Telephone: +27 (0)11 243 4563 Website:www.absa.co.za/wim
Absa Inflation Linked Income Fund
Wealth and Investment Management
Absa Flexible Income Fund Minimum disclosure documentMonth ended 31 October 2017
Fund detailsIndustry category SA - Multi Asset - IncomeBenchmark STeFI Composite (effective 30 Nov'13, formerly Alexander
Forbes Money Market Index)Fund launch date 20 April 2004Class A1 launch Date 25 July 2016Fund Size R 0.27 MillionJSE code AFIA1Fund Manager James Turp – B.Econ, SAIFM
Eben Mare – B.Sc. (Hons), M.Sc., Ph.D Applied MathematicsAsset Manager Absa Asset Management (Pty) LtdMinimum lump sum R 2000Minimum Monthly R 200
Income Distribution - cents per unit (cpu)Date Class A1Nov-16 0.50Dec-16 0.53Jan-17 0.84Feb-17 0.57Mar-17 0.44Apr-17 1.11May-17 0.90Jun-17 0.54Jul-17 1.11Aug-17 0.55Sep-17 0.53Oct-17 1.06Total 8.68
Income declaration Monthly, on the 24thIncome distributions Monthly, on the 25thYield 4.64% per annum
Fees and Cost ratio (VAT incl.)Fees Class A1Initial Fees: Absa: 0%
Adviser: 0%Annual Fees: Management: 0.63%
Adviser: 0-1.14%Performance Fee: No
Costs (annual, based on period shown) Class A1For the period to 30-06-2017, from: 25-07-2016Total expense ratio (TER): 0.69%Transaction costs (TC): 0.16%Total investment charges (TER+TC): 0.85%Please refer to Disclosure section on next page for further information on Fees and Costs
PerformancePerformance cummulative total returns (%)Term Class A1 Benchmark Sector Average RankLaunch 9.56 9.73 9.56 55/731 Month 0.37 0.61 0.85 65/823 month 2.12 1.82 2.18 32/806 Month 4.61 3.73 3.41 16/79
Please refer to Disclosures section on next page for further information on calculation methodology and source of allperformance data content (tables and/or charts) of this MDD
Fund objectivesThe primary objective of the Absa Flexible Income Fund is to seek optimal incomewith income stability, with a medium to low risk to investors. Capital growth willbe of an incidental nature.
Fund strategyThe fund invests the majority of its assets in South African investment marketsat all times and will flexibly allocate assets within the non-equity securitiesmarkets and assets and assets in liquid form as well as participatory interests inproperty based collective investment schemes
Fund features• Ideal vehicle for short to medium term investments• The structure of the fund is flexible but always income biased• The fund provides monthly income for trust beneficiaries• Suitable for investors who require monthly income and seek a yield in excess
of money market rates while simultaneously meeting fiduciary obligations
Fund specific risksInterest rate: The value of fixed income investments (e.g. bonds) tends todecrease when interest rates and/or inflation rises.Multi-asset investment: TheFund is subject to possible financial losses in multiple markets and mayunderperform more focused funds.Property: Investments in real estate securitiescan carry the same risks as investing directly in real estate itself. Real estate pricesrise and fall in response to a variety of factors, including local, regional andnational economic and political conditions, interest rates and tax considerations.
Risk profile and advisable minimum termLow Low-Medium Medium Medium-High High
3 Months + 6 Months + 2 Years + 3 Years + 5 Years +
Risk statisticsClass A1 Since Inception (25 July 2016)Number of positive months 15/15No highest/lowest one year performance data disclosed due to the length of thetime the fund has been in existence.
Cumulative performance (since inception)
Absa Flexible Income A1 STeFi Composite
97
100
103
106
109
112
Jul-16
Nov-16
Mar-17
Jul-17
Oct-17
The chart reflects the value (monthly data points) of a R100 investment made on the 25July 2016
Absa Flexible Income Fund
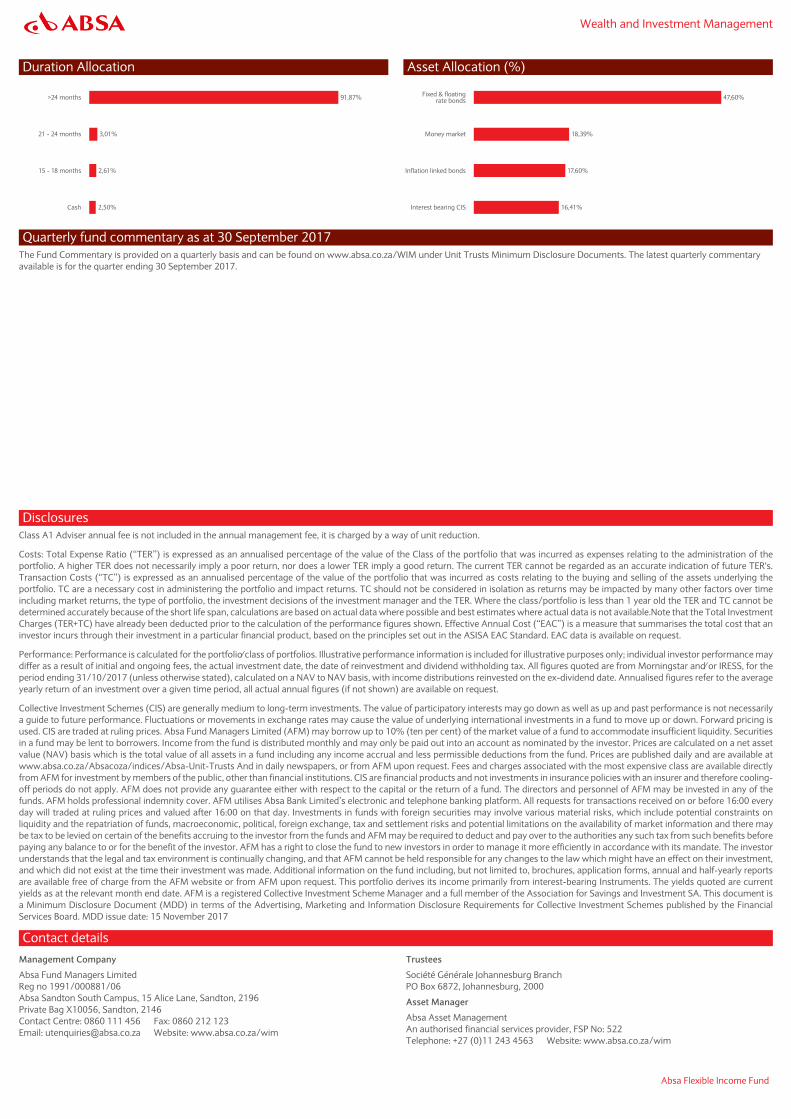
Wealth and Investment Management
Duration Allocation
2,50%
2,61%
3,01%
91,87%
Cash
15 - 18 months
21 - 24 months
>24 months
Asset Allocation (%)
16,41%
17,60%
18,39%
47,60%
Interest bearing CIS
Inflation linked bonds
Money market
Fixed & floatingrate bonds
Quarterly fund commentary as at 30 September 2017The Fund Commentary is provided on a quarterly basis and can be found on www.absa.co.za/WIM under Unit Trusts Minimum Disclosure Documents. The latest quarterly commentaryavailable is for the quarter ending 30 September 2017.
DisclosuresClass A1 Adviser annual fee is not included in the annual management fee, it is charged by a way of unit reduction.
Costs: Total Expense Ratio (“TER”) is expressed as an annualised percentage of the value of the Class of the portfolio that was incurred as expenses relating to the administration of theportfolio. A higher TER does not necessarily imply a poor return, nor does a lower TER imply a good return. The current TER cannot be regarded as an accurate indication of future TER's.Transaction Costs (“TC”) is expressed as an annualised percentage of the value of the portfolio that was incurred as costs relating to the buying and selling of the assets underlying theportfolio. TC are a necessary cost in administering the portfolio and impact returns. TC should not be considered in isolation as returns may be impacted by many other factors over timeincluding market returns, the type of portfolio, the investment decisions of the investment manager and the TER. Where the class/portfolio is less than 1 year old the TER and TC cannot bedetermined accurately because of the short life span, calculations are based on actual data where possible and best estimates where actual data is not available.Note that the Total InvestmentCharges (TER+TC) have already been deducted prior to the calculation of the performance figures shown. Effective Annual Cost (“EAC”) is a measure that summarises the total cost that aninvestor incurs through their investment in a particular financial product, based on the principles set out in the ASISA EAC Standard. EAC data is available on request.
Performance: Performance is calculated for the portfolio⁄ class of portfolios. Illustrative performance information is included for illustrative purposes only; individual investor performance maydiffer as a result of initial and ongoing fees, the actual investment date, the date of reinvestment and dividend withholding tax. All figures quoted are from Morningstar and⁄ or IRESS, for theperiod ending 31/10/2017 (unless otherwise stated), calculated on a NAV to NAV basis, with income distributions reinvested on the ex-dividend date. Annualised figures refer to the averageyearly return of an investment over a given time period, all actual annual figures (if not shown) are available on request.
Collective Investment Schemes (CIS) are generally medium to long-term investments. The value of participatory interests may go down as well as up and past performance is not necessarilya guide to future performance. Fluctuations or movements in exchange rates may cause the value of underlying international investments in a fund to move up or down. Forward pricing isused. CIS are traded at ruling prices. Absa Fund Managers Limited (AFM) may borrow up to 10% (ten per cent) of the market value of a fund to accommodate insufficient liquidity. Securitiesin a fund may be lent to borrowers. Income from the fund is distributed monthly and may only be paid out into an account as nominated by the investor. Prices are calculated on a net assetvalue (NAV) basis which is the total value of all assets in a fund including any income accrual and less permissible deductions from the fund. Prices are published daily and are available atwww.absa.co.za/Absacoza/indices/Absa-Unit-Trusts And in daily newspapers, or from AFM upon request. Fees and charges associated with the most expensive class are available directlyfrom AFM for investment by members of the public, other than financial institutions. CIS are financial products and not investments in insurance policies with an insurer and therefore cooling-off periods do not apply. AFM does not provide any guarantee either with respect to the capital or the return of a fund. The directors and personnel of AFM may be invested in any of thefunds. AFM holds professional indemnity cover. AFM utilises Absa Bank Limited’s electronic and telephone banking platform. All requests for transactions received on or before 16:00 everyday will traded at ruling prices and valued after 16:00 on that day. Investments in funds with foreign securities may involve various material risks, which include potential constraints onliquidity and the repatriation of funds, macroeconomic, political, foreign exchange, tax and settlement risks and potential limitations on the availability of market information and there maybe tax to be levied on certain of the benefits accruing to the investor from the funds and AFM may be required to deduct and pay over to the authorities any such tax from such benefits beforepaying any balance to or for the benefit of the investor. AFM has a right to close the fund to new investors in order to manage it more efficiently in accordance with its mandate. The investorunderstands that the legal and tax environment is continually changing, and that AFM cannot be held responsible for any changes to the law which might have an effect on their investment,and which did not exist at the time their investment was made. Additional information on the fund including, but not limited to, brochures, application forms, annual and half-yearly reportsare available free of charge from the AFM website or from AFM upon request. This portfolio derives its income primarily from interest-bearing Instruments. The yields quoted are currentyields as at the relevant month end date. AFM is a registered Collective Investment Scheme Manager and a full member of the Association for Savings and Investment SA. This document isa Minimum Disclosure Document (MDD) in terms of the Advertising, Marketing and Information Disclosure Requirements for Collective Investment Schemes published by the FinancialServices Board. MDD issue date: 15 November 2017
Contact detailsManagement Company
Absa Fund Managers LimitedReg no 1991/000881/06 Absa Sandton South Campus, 15 Alice Lane, Sandton, 2196 Private Bag X10056, Sandton, 2146 Contact Centre: 0860 111 456 Fax: 0860 212 123 Email: [email protected] Website: www.absa.co.za/wim
Trustees
Société Générale Johannesburg BranchPO Box 6872, Johannesburg, 2000
Asset Manager
Absa Asset ManagementAn authorised financial services provider, FSP No: 522 Telephone: +27 (0)11 243 4563 Website: www.absa.co.za/wim
Absa Flexible Income Fund

Wealth and Investment Management
Absa Flexible Income Fund Fund Commentary30 September 2017
Commentary DocumentThe Federal Reserve Banks’ FOMC kept rates steady through the quarter while seeming surprised with stubbornly low inflation against a strong labour market. Thetone of the Fed grew more hawkish toward the end of the quarter. They signalled that Federal Reserve balance sheet reduction would commence this year as expectedbut the Fed’s tone turned more hawkish than was anticipated signalling the strong possibility of another policy rate hike in the last quarter. The US 10 year bondsstarted the quarter at 2.3% yield, moved down to 2.0% and reversed back to end at 2.3% again. The European Central Bank kept its policy rates unchanged at both of its monetary policy meetings but comments from governor Mario Draghi suggested conditionswere right to begin tapering back on their quantitative easing program in the imminent future. The oil price moved from $49 to $55 per barrel over the quarter. Politics remains front and centre domestically as expected into the December ANC elective conference that will determine who will take the party forward fromhere. For the MPC it was a quarter of surprises for markets. July’s meeting saw the MPC cut rates by 25 basis points in a move that was against consensus. Based on theimproved inflation profile the committee agreed that a cut was required. This trend was not continued at the September meeting as the committee chose to keeprates on hold in a split decision siting increased risks to inflation from the currency into year end. 2nd quarter GDP figures rebounded to 2.5% (QoQ SA annualised) breaking out of the recession (-0.6% and -0.3% for the previous 2 quarters). Growth is expectedto remain weak for the remainder of the year despite an improved global growth backdrop as domestic business and investor confidence remains low amidst politicaluncertainty.
DisclosuresCollective Investment Schemes (CIS) are generally medium to long-term investments. The value of participatory interests may go down as well as up and pastperformance is not necessarily a guide to future performance. Fluctuations or movements in exchange rates may cause the value of underlying international investmentsin a fund to move up or down. Forward pricing is used. CIS are traded at ruling prices. Absa Fund Managers Limited (AFM) may borrow up to 10% (ten per cent) ofthe market value of a fund to accommodate insufficient liquidity. Securities in a fund may be lent to borrowers. Income from the fund is distributed monthly and mayonly be paid out into an account as nominated by the investor. Prices are calculated on a net asset value (NAV) basis which is the total value of all assets in a fundincluding any income accrual and less permissible deductions from the fund. Prices are published daily and are available at www.absa.co.za/Absacoza/indices/Absa-Unit-Trusts And in daily newspapers, or from AFM upon request. Fees and charges associated with the most expensive class are available directly from AFM forinvestment by members of the public, other than financial institutions. CIS are financial products and not investments in insurance policies with an insurer and thereforecooling-off periods do not apply. AFM does not provide any guarantee either with respect to the capital or the return of a fund. The directors and personnel of AFMmay be invested in any of the funds. AFM holds professional indemnity cover. AFM utilises Absa Bank Limited’s electronic and telephone banking platform. All requestsfor transactions received on or before 16:00 every day will traded at ruling prices and valued after 16:00 on that day. Investments in funds with foreign securities mayinvolve various material risks, which include potential constraints on liquidity and the repatriation of funds, macroeconomic, political, foreign exchange, tax andsettlement risks and potential limitations on the availability of market information and there may be tax to be levied on certain of the benefits accruing to the investorfrom the funds and AFM may be required to deduct and pay over to the authorities any such tax from such benefits before paying any balance to or for the benefit ofthe investor. AFM has a right to close the fund to new investors in order to manage it more efficiently in accordance with its mandate. The investor understands thatthe legal and tax environment is continually changing, and that AFM cannot be held responsible for any changes to the law which might have an effect on theirinvestment, and which did not exist at the time their investment was made. Additional information on the fund including, but not limited to, brochures, applicationforms, annual and half-yearly reports are available free of charge from the AFM website or from AFM upon request. This portfolio derives its income primarily frominterest-bearing Instruments. The yields quoted are current yields as at the relevant month end date. AFM is a registered Collective Investment Scheme Manager anda full member of the Association for Savings and Investment SA. This document is a Minimum Disclosure Document (MDD) in terms of the Advertising, Marketingand Information Disclosure Requirements for Collective Investment Schemes published by the Financial Services Board. MDD issue date: 15 November 2017
Contact details
Management Company
Absa Fund Managers LimitedReg no 1991/000881/06 Absa Sandton South Campus, 15 Alice Lane, Sandton, 2196 Private Bag X10056, Sandton, 2146 Contact Centre: 0860 111 456 Fax: 0860 212 123 Email: [email protected] Website: www.absa.co.za/wim
Trustees
Société Générale Johannesburg BranchPO Box 6872, Johannesburg, 2000
Asset Manager
Absa Asset ManagementAn authorised financial services provider, FSP No: 522 Telephone: +27 (0)11 243 4563 Website: www.absa.co.za/wim
Absa Flexible Income Fund

Wealth and Investment Management
Absa Inflation Beater Fund Minimum disclosure documentMonth ended 31 October 2017
Fund detailsIndustry category SA - Multi Asset - Low EquityBenchmark CPI + 3%Fund launch date 01 October 2002Class A launch Date 01 October 2002Class C1 launch Date 04 April 2013Fund Size R 390.44 MillionJSE code ABIBFund Manager Eben Mare – B.Sc. (Hons), M.Sc., Ph.D Applied MathematicsAsset Manager Absa Asset Management (Pty) LtdMinimum lump sum R 1000Minimum Monthly R 100
Income distributions - cents per unit (cpu)Class A Class C1
the 3 months ended 31 Dec 2016 0 0the 3 months ended 31 Mar 2017 0 0the 3 months ended 30 Jun 2017 2.03 2.13the 3 months ended 30 Sep 2017 3.08 3.26
Income declaration 31 Mar, 30 Jun, 30 Sep & 31 DecIncome distributions 1Apr, 1 Jul, 1 Oct & 1 Jan
Fees and Cost ratio (VAT incl.)Fees Class A Class C1Initial Fees: Absa: 0% 0%
Adviser: 0-3.42% 0%Annual Fees: Management: 1.43% 0.97%
Adviser: 0-1.14%Performance Fee: No No
Costs (annual, based on period shown) Class A Class C1For the period to 30-06-2017, from: 01/07/2014 01/07/2014Total expense ratio (TER): 1.44% 0.98%Transaction costs (TC): 0.06% 0.06%Total investment charges (TER+TC): 1.50% 1.04%Please refer to Disclosure section on next page for further information on Fees and Costs
PerformancePerformance: annualised total returns (%)Term Class A Benchmark Sector
AverageRank Class C1
Launch 8.58 8.48 9.95 5/6 6.091 Year 7.28 8.06 10.00 131/138 7.803 Year 5.74 8.27 7.37 91/97 6.215 Year 6.20 8.54 8.54 77/81 -10 Year 7.78 8.98 8.01 29/47 -
Performance Yearly returns (%)1 yr ending: Oct'17 Oct'16 Oct'15 Oct'14 Oct'13 Oct'12 Oct'11 Oct'10Class A 7.28 3.49 6.48 8.07 5.72 12.34 7.10 8.55Benchmark 8.06 9.13 7.61 8.96 8.93 8.46 8.77 6.05Class C1 7.80 3.92 6.94 8.56 - - - -Sector Average & rank: applies to the A Class.Please refer to Disclosure section on the next page for further information on calculation methodology and source of allperformance data content (tables and/or charts) of this MDD.
Fund objectivesAbsa Inflation Beater Fund is a specialist portfolio that will predominantly investits assets in South African investment markets and seeks to provide aboveaverageincome and capital growth.The fund endeavors to exceed general nationalinflation levels over the longer term at below average to average risk toinvestors.
Fund strategyThe fund will use an active asset allocation strategy by investing in shares,income-bearing instruments and fixed-interest instruments, with majorexposureto inflation-linked bonds. The majority of the fund will be invested inSouth African fixed-income assets, including bonds, gilts and corporate bondswith either short, intermediate or long terms to maturity, non-equity securitiesand securities acquired on exchanges. Shares are limited to a maximum of 20%of the portfolio.
Fund features• Ideal vehicle for medium to long-term investments• Aims to provide consistent positive returns above inflation• Strong focus on capital protection• Offers diversification by providing exposure to multiple asset classes• Offers potential for income and capital appreciation• Suitable for investors who require capital stability and steady capital growth
Fund specific risksInterest rate: The value of fixed income investments (e.g. bonds) tends todecrease when interest rates and/or inflation rises. Multi-asset investment: TheFund is subject to possible financial losses in multiple markets and mayunderperform more focused funds. Property: Investments in real estate securitiescan carry the same risks as investing directly in real estate itself. Real estate pricesrise and fall in response to a variety of factors, including local, regional andnational economic and political conditions, interest rates and tax considerations
Risk profile and advisable minimum termLow Low-Medium Medium Medium-High High
3 Months + 6 Months + 2 Years + 3 Years + 5 Years +
Risk statisticsClass A Since Inception (01 October 2002)Number of positive months 156/181Highest 1 Year Performance 31/03/2006 15.12%Lowest 1 Year Performance 31/01/2016 1.68%
Cumulative performance (5 years)
Absa Inflation Beater A CPI(Headline) CPI + 3%
100
115
130
145
160
175
Oct-12
Dec-12
Mar-13
Jun-13
Sep-13
Dec-13
Mar-14
Jun-14
Sep-14
Dec-14
Mar-15
Jun-15
Sep-15
Dec-15
Mar-16
Jun-16
Sep-16
Dec-16
Mar-17
Jun-17
Oct-17
The chart reflects the value (monthly data points) of a R100 investment made on the01/11/2012
Absa Inflation Beater Fund

Wealth and Investment Management
Asset Allocation (%)
2,45%
2,61%
3,43%
4,19%
8,28%
79,04%
Money market
Equity
Property
Fixed rate bonds
Inflation linked bonds
Floating rate bonds
Top share holding (%)
Old Mutual 7.55%African Rainbow Cap 6.79%Woolies 5.97%Barclays Africa Group 5.93%Tsogo Sun Holdings Limited 5.71%JSE 5.68%Brait 5.60%
Quarterly fund commentary as at 30 September 2017The Fund Commentary is provided on a quarterly basis and can be found on www.absa.co.za/WIM under Unit Trusts Minimum Disclosure Documents. The latest quarterly commentaryavailable is for the quarter ending 30 September 2017.
DisclosuresFees: Class A Adviser annual fee is not included in the annual management fee, it is charged by a way of unit reduction.
Costs: Total Expense Ratio (“TER”) is expressed as an annualised percentage of the value of the Class of the portfolio that was incurred as expenses relating to the administration of theportfolio. A higher TER does not necessarily imply a poor return, nor does a lower TER imply a good return. The current TER cannot be regarded as an accurate indication of future TER's.Transaction Costs (“TC”) is expressed as an annualised percentage of the value of the portfolio that was incurred as costs relating to the buying and selling of the assets underlying theportfolio. TC are a necessary cost in administering the portfolio and impact returns. TC should not be considered in isolation as returns may be impacted by many other factors over timeincluding market returns, the type of portfolio, the investment decisions of the investment manager and the TER. Note that the total investment charges (TER+TC) have already been deductedprior to the calculation of the performance figures shown. Effective Annual Cost (“EAC”) is a measure that summarises the total cost that an investor incurs through their investment in aparticular financial product, based on the principles set out in the ASISA EAC standard. EAC data is available on request.
Performance: Performance is calculated for the portfolio⁄class of portfolios. Illustrative performance information is included for illustrative purposes only; individual investor performance maydiffer as a result of initial and ongoing fees, the actual investment date, the date of reinvestment and dividend withholding tax. All figures quoted are from Morningstar and⁄or IRESS, for theperiod ending 31/10/2017 (unless otherwise stated), calculated on a NAV to NAV basis, with income distributions reinvested on the ex-dividend date. Annualised figures refer to the averageyearly return of an investment over a given time period, all actual annual figures (if not shown) are available on request.
Collective Investment Schemes (CIS) are generally medium to long-term investments. The value of participatory interests may go down as well as up and past performance is not necessarilya guide to future performance. Fluctuations or movements in exchange rates may cause the value of underlying international investments in a fund to move up or down. Forward pricing isused. CIS are traded at ruling prices. Absa Fund Managers Limited (AFM) may borrow up to 10% (ten per cent) of the market value of a fund to accommodate insufficient liquidity. Securitiesin a fund may be lent to borrowers. Income from the fund is distributed quarterly and may only be paid out into an account as nominated by the investor. Prices are calculated on a net assetvalue (NAV) basis which is the total value of all assets in a fund including any income accrual and less permissible deductions from the fund. Prices are published daily and are available atwww.Absa.co.za/Absacoza/indices/Absa-unit-trusts and in daily newspapers, or from AFM upon request. Fees and charges associated with the most expensive class are available directlyfrom AFM for investment by members of the public, other than financial institutions. CIS are financial products and not investments in insurance policies with an insurer and therefore cooling-off periods do not apply. AFM does not provide any guarantee either with respect to the capital or the return of a fund. The directors and personnel of AFM may be invested in any of thefunds. AFM holds professional indemnity cover. AFM utilises Absa Bank Limited’s electronic and telephone banking platform. All requests for transactions received on or before 16:00 everyday will traded at ruling prices and valued after 16:00 on that day. Investments in funds with foreign securities may involve various material risks, which include potential constraints onliquidity and the repatriation of funds, macroeconomic, political, foreign exchange, tax and settlement risks and potential limitations on the availability of market information and there maybe tax to be levied on certain of the benefits accruing to the investor from the funds and AFM may be required to deduct and pay over to the authorities any such tax from such benefits beforepaying any balance to or for the benefit of the investor. AFM has a right to close the fund to new investors in order to manage it more efficiently in accordance with its mandate. The investorunderstands that the legal and tax environment is continually changing, and that AFM cannot be held responsible for any changes to the law which might have an effect on their investment,and which did not exist at the time their investment was made. Additional information on the fund including, but not limited to, brochures, application forms, annual and half-yearly reportsare available free of charge from the AFM website or from AFM upon request. AFM is a registered Collective Investment Scheme Manager and a full member of the Association for Savingsand Investment SA. This document is a Minimum Disclosure Document (MDD) in terms of the Advertising, Marketing and Information Disclosure requirements for Collective InvestmentSchemes published by the Financial Services Board. MDD issue date: 15 November 2017
Contact detailsManagement Company
Absa Fund Managers LimitedReg no 1991/000881/06 Absa Sandton South Campus, 15 Alice Lane, Sandton, 2196 Private Bag X10056, Sandton, 2146 Contact Centre: 0860 111 456 Fax: 0860 212 123 Email: [email protected] Website: www.absa.co.za/wim
Trustees
Société Générale Johannesburg BranchPO Box 6872, Johannesburg, 2000
Asset Manager
Absa Asset ManagementAn authorised financial services provider, FSP No: 522 Telephone: +27 (0)11 243 4563 Website:www.absa.co.za/wim
Absa Inflation Beater Fund

Wealth and Investment Management
Absa Inflation Beater Fund Fund Commentary30 September 2017
Commentary DocumentThe Absa Inflation Beater Fund invests in a strategic mix of domestic assets which is designed with the objective of generating a return of CPI plus 3% per annumover a rolling 3 year term, while trying to minimize the risk of losing money in any one year. Assets in the fund include: inflation-linked bonds, fixed-interest bonds,money market, equity and property. Assets selected for this fund are chosen carefully, based not only on return, but also with a view to minimize the potentialdownside risk of the portfolio. The last 3 months have been characterized by a strong rebound in commodity prices which was led by a recovery in oil and base metal price. Consequently, strongcommodity prices, weaker exchange rate of the rand against the majors and the suspension of the Mining Charter, led Resources stocks higher and they were amongstthe best performers in the All Share index which subsequently contributed to equities being the best performing asset class in Q32017.Over the past 12 months, the All Share index delivered 10.2% yoy with Industrials (13.3% yoy) and Resources (11.4%) stocks leading the broad index higher whileFinancials (7.6% yoy) lagged behind and performed in line with cash returns ( Stefi 7.6% yoy). The stock market performance was supported by a relatively stableexchange rate of the rand over the past year, strong commodity prices performance and relatively cheap equity valuations. For the MPC, it was a quarter of surprises for markets. July’s meeting saw the MPC cut rates by 25 basis points, on the back of improved inflation profile, in a movethat was against consensus but this trend was surprisingly not followed on in the September MPC meeting citing increased risks to inflation from the currency intoyear end. Also, 2Q2017 real GDP figures surprised on the upside with a rebound to 2.5% (QoQ SA annualized) thus breaking out of the 1Q2017 recession. Growth is expectedto remain weak for the remainder of the year despite an improved global growth backdrop as domestic business and investor confidence remains low amidst politicaluncertainty. The Inflation Beater Fund improved its 1-year performance from a sub-target return of 6.05% (CPI+3 target of 8.5%) in 2Q2017 to a matching return of 7.8% (CPI+3 target of 7.8%) in 3Q2017. The fund still lags behind its target return of CPI+3 in rolling 3-year but the turnaround strategy is yielding positive results, albeit in theshort-term. At the time of writing this report, the mix of assets in the Absa Inflation Beater Fund was: Money market 2%Inflation linked bonds 8%Fixed & Floating interest rate bonds 83%Domestic Equity 6%Domestic Property 1% Total 100%
The investment environment remains volatile. Our first aim is always to protect our clients’ money, and to achieve a satisfactory return over a rolling three year period.
DisclosuresCollective Investment Schemes (CIS) are generally medium to long-term investments. The value of participatory interests may go down as well as up and pastperformance is not necessarily a guide to future performance. Fluctuations or movements in exchange rates may cause the value of underlying internationalinvestments in a fund to move up or down. Forward pricing is used. CIS are traded at ruling prices. Absa Fund Managers Limited (AFM) may borrow up to 10% (tenper cent) of the market value of a fund to accommodate insufficient liquidity. Securities in a fund may be lent to borrowers. Income from the fund is distributedquarterly and may only be paid out into an account as nominated by the investor. Prices are calculated on a net asset value (NAV) basis which is the total value ofall assets in a fund including any income accrual and less permissible deductions from the fund. Prices are published daily and are available at www.Absa.co.za/Absacoza/indices/Absa-unit-trusts and in daily newspapers, or from AFM upon request. Fees and charges associated with the most expensive class are availabledirectly from AFM for investment by members of the public, other than financial institutions. CIS are financial products and not investments in insurance policieswith an insurer and therefore cooling-off periods do not apply. AFM does not provide any guarantee either with respect to the capital or the return of a fund. Thedirectors and personnel of AFM may be invested in any of the funds. AFM holds professional indemnity cover. AFM utilises Absa Bank Limited’s electronic andtelephone banking platform. All requests for transactions received on or before 16:00 every day will traded at ruling prices and valued after 16:00 on that day.Investments in funds with foreign securities may involve various material risks, which include potential constraints on liquidity and the repatriation of funds,macroeconomic, political, foreign exchange, tax and settlement risks and potential limitations on the availability of market information and there may be tax to belevied on certain of the benefits accruing to the investor from the funds and AFM may be required to deduct and pay over to the authorities any such tax from suchbenefits before paying any balance to or for the benefit of the investor. AFM has a right to close the fund to new investors in order to manage it more efficiently inaccordance with its mandate. The investor understands that the legal and tax environment is continually changing, and that AFM cannot be held responsible for anychanges to the law which might have an effect on their investment, and which did not exist at the time their investment was made. Additional information on thefund including, but not limited to, brochures, application forms, annual and half-yearly reports are available free of charge from the AFM website or from AFM uponrequest. AFM is a registered Collective Investment Scheme Manager and a full member of the Association for Savings and Investment SA. This document is a MinimumDisclosure Document (MDD) in terms of the Advertising, Marketing and Information Disclosure requirements for Collective Investment Schemes published by theFinancial Services Board. MDD issue date: 15 November 2017
Absa Inflation Beater Fund

Wealth and Investment Management
Contact details
Management Company
Absa Fund Managers LimitedReg no 1991/000881/06 Absa Sandton South Campus, 15 Alice Lane, Sandton, 2196 Private Bag X10056, Sandton, 2146 Contact Centre: 0860 111 456 Fax: 0860 212 123 Email: [email protected] Website: www.absa.co.za/wim
Trustees
Société Générale Johannesburg BranchPO Box 6872, Johannesburg, 2000
Asset Manager
Absa Asset ManagementAn authorised financial services provider, FSP No: 522 Telephone: +27 (0)11 243 4563 Website:www.absa.co.za/wim
Absa Inflation Beater Fund

Wealth and Investment Management
Absa Absolute Fund Minimum disclosure documentMonth ended 31 October 2017
Fund detailsIndustry category SA - Multi Asset - Low EquityBenchmark CPI + 4% p.a. over a rolling 36 month periodFund launch date 20 November 2006Class A launch Date 20 November 2006Class C1 launch date 07 March 2013Fund Size R 9.63 BillionJSE code ABAFFund Manager Eben Mare – B.Sc. (Hons), M.Sc., Ph.D Applied MathematicsAsset Manager Absa Asset Management (Pty) LtdMinimum lump sum R 2000Minimum Monthly R 200
Income distributions - cents per unit (cpu)Class A Class C1
the 6 months ended 31 Dec 2016 2.71 3.38the 6 months ended 30 Jun 2017 1.93 2.59
Income declaration 30 June & 31 DecemberIncome distributions 15 July & 15 January
Fees and Cost ratio (VAT incl.)Fees Class A Class C1Initial Fees: Absa: 0% 0%
Adviser: 0 -3.42% 0%Annual Fees: Management: 1.71% 0.97%
Adviser: 0-1.14%Performance Fee: No No
Costs (annual, based on period shown) Class A Class C1For the period to 30-06-2017, from: 01/07/2014 01/07/2014Total expense ratio (TER): 1.71% 0.97%Transaction costs (TC): 0.06% 0.06%Total investment charges (TER+TC): 1.77% 1.03%Please refer to Disclosure section on next page for further information on Fees and Costs
PerformancePerformance: annualised total returns (%)Term Class A Benchmark Sector
AverageRank Class C1
Launch 9.34 10.13 8.49 6/32 7.671 Year 6.84 9.06 10.00 133/138 7.563 Year 5.82 9.27 7.37 90/97 6.645 Year 7.17 9.54 8.54 72/81 -10 Year 8.86 9.98 8.01 8/47 -
Performance Yearly returns (%)1 yr ending: Oct'17 Oct'16 Oct'15 Oct'14 Oct'13 Oct'12 Oct'11 Oct'10Class A 6.84 0.62 10.23 8.73 9.72 14.42 8.45 10.18Benchmark 9.06 10.13 8.61 9.96 9.93 9.46 9.77 7.05Class C1 7.56 1.49 11.11 9.62 - - - -
Benchmark: CPI + 4% lagged by 1 month. Sector Average & Rank: applies to the A Class.Please refer to Disclosures section on next page for further information on calculation methodology and source of all performancedata content (tables and/or charts) of this MDD
Fund objectivesThe portfolio objective is to provide a consistent positive return above inflationover the medium term, whilst aiming to protect capital over the longer term, withmoderate risk to investors. The portfolio aims to minimise the risk of capital lossover any 12 month period.
Fund strategyThe Fund will use a diversified allocation of its investments across all classes ofassets, as well as choose lower risk individual assets to lower the risk profile ofthe fund while targeting low risk returns. The Fund will invest in South Africaninvestments and financial markets at all times. Securities to be included in thefund will be non-equity securities, assets in form, equity securities acquired onexchanges and financial Instruments as well as any other securities that the Actmay from time to time allow. The fund is managed according to the guidelinesas set out in regulation 28 of the pension funds act and is suitable for retirementfunds Investments.
Fund features• Ideal vehicle for medium to long-term investments• Aims to provide consistent positive return above inflation• Offers diversification by providing exposure to multiple asset classes• Provides a source of income and offers potential for capital appreciation• Potential higher return and with more volatility than money market and
traditional income funds• Suitable for pre and post-retirement investments
Fund specific risksInterest rate: The value of fixed income investments (e.g. bonds) tends todecrease when interest rates and/or inflation rises. Multi-asset investment: TheFund is subject to possible financial losses in multiple markets and mayunderperform more focused funds. Property: Investments in real estate securitiescan carry the same risks as investing directly in real estate itself. Real estate pricesrise and fall in response to a variety of factors, including local, regional andnational economic and political conditions, interest rates and tax considerations.
Risk profile and advisable minimum termLow Low-Medium Medium Medium-High High
3 Months + 6 Months + 2 Years + 3 Years + 5 Years +
Risk statisticsClass A Since Inception (20 November 2006)Number of positive months 103/131Highest 1 Year Performance 31/12/2012 15.49%Lowest 1 Year Performance 31/05/2017 -1.16%
Cumulative performance (5 years)
Absa Absolute Fund A CPI (Headline) CPI +4%
100
115
130
145
160
175
Oct-12
Dec-12
Jun-13
Dec-13
Jun-14
Dec-14
Jun-15
Dec-15
Jun-16
Dec-16
Jun-17
Oct-17
The chart reflects the value (monthly data points) of a R100 investment made on the01/11/2012
Absa Absolute Fund

Wealth and Investment Management
Asset Allocation (%)
0,12%
2,91%
9,20%
10,40%
10,41%
11,92%
12,07%
13,61%
29,36%
International money market
International bonds
Property
Interest bearing unit trusts
Money market
International equity
Inflation linked bonds
Equity
Fixed & Floating rate bonds
Top share holding (%)
Barclays Africa Group 2.11%Alexander Forbes Group Holdings 1.87%Old Mutual 1.59%Greenbay Prop Ltd 1.51%Foschini 1.36%Reinet Investments 1.35%A V I 1.32%Tongaat 1.29%BHPBil 1.28%SA Corp 1.28%
Quarterly fund commentary as at 30 September 2017The Fund Commentary is provided on a quarterly basis and can be found on www.absa.co.za/WIM under Unit Trusts Minimum Disclosure Documents. The latest quarterly commentaryavailable is for the quarter ending 30 September 2017.
DisclosuresClass A Adviser annual fee is not included in the annual management fee, it is charged by a way of unit reduction.
Costs: Total Expense Ratio (“TER”) is expressed as an annualised percentage of the value of the Class of the portfolio that was incurred as expenses relating to the administration of theportfolio. A higher TER does not necessarily imply a poor return, nor does a lower TER imply a good return. The current TER cannot be regarded as an accurate indication of future TER's.Transaction Costs (“TC”) is expressed as an annualised percentage of the value of the portfolio that was incurred as costs relating to the buying and selling of the assets underlying theportfolio. TC are a necessary cost in administering the portfolio and impact returns. TC should not be considered in isolation as returns may be impacted by many other factors over timeincluding market returns, the type of portfolio, the investment decisions of the investment manager and the TER. Note that the total investment charges (TER+TC) have already been deductedprior to the calculation of the performance figures shown. Effective Annual Cost (“EAC”) is a measure that summarises the total cost that an investor incurs through their investment in aparticular financial product, based on the principles set out in the ASISA EAC standard. EAC data is available on request.
Performance: Performance is calculated for the portfolio⁄class of portfolios. Illustrative performance information is included for illustrative purposes only; individual investor performance maydiffer as a result of initial and ongoing fees, the actual investment date, the date of reinvestment and dividend withholding tax. All figures quoted are from Morningstar and⁄or IRESS, for theperiod ending 31/10/2017 (unless otherwise stated), calculated on a NAV to NAV basis, with income distributions reinvested on the ex-dividend date. Annualised figures refer to the averageyearly return of an investment over a given time period, all actual annual figures (if not shown) are available on request.
Collective Investment Schemes (CIS) are generally medium to long-term investments. The value of participatory interests may go down as well as up and past performance is not necessarilya guide to future performance. Fluctuations or movements in exchange rates may cause the value of underlying international investments in a fund to move up or down. Forward pricing isused. CIS are traded at ruling prices. Absa Fund Managers Limited (AFM) may borrow up to 10% (ten per cent) of the market value of a fund to accommodate insufficient liquidity. Securitiesin a fund may be lent to borrowers. Income from the fund is distributed semi-annually and may only be paid out into an account as nominated by the investor. Prices are calculated on a netasset value (NAV) basis which is the total value of all assets in a fund including any income accrual and less permissible deductions from the fund. Prices are published daily and are availableat www.absa.co.za⁄Absacoza/Indices⁄AbsaUnit-Trusts and in daily newspapers, or from AFM upon request. Fees and charges associated with the most expensive class are available directlyfrom AFM for investment by members of the public, other than financial institutions. CIS are financial products and not investments in insurance policies with an insurer and therefore cooling-off periods do not apply. AFM does not provide any guarantee either with respect to the capital or the return of a fund. The directors and personnel of AFM may be invested in any of thefunds. AFM holds professional indemnity cover. AFM utilises Absa Bank Limited’s electronic and telephone banking platform. All requests for transactions received on or before 16:00 everyday will traded at ruling prices and valued after 16:00 on that day. Investments in funds with foreign securities may involve various material risks, which include potential constraints onliquidity and the repatriation of funds, macroeconomic, political, foreign exchange, tax and settlement risks and potential limitations on the availability of market information and there maybe tax to be levied on certain of the benefits accruing to the investor from the funds and AFM may be required to deduct and pay over to the authorities any such tax from such benefits beforepaying any balance to or for the benefit of the investor. AFM has a right to close the fund to new investors in order to manage it more efficiently in accordance with its mandate. The investorunderstands that the legal and tax environment is continually changing, and that AFM cannot be held responsible for any changes to the law which might have an effect on their investment,and which did not exist at the time their investment was made. Additional information on the fund including, but not limited to, brochures, application forms, annual and half-yearly reportsare available free of charge from the AFM website or from AFM upon request. AFM is a registered Collective Investment Scheme Manager and a full member of the Association for Savingsand Investment SA. This document is a Minimum Disclosure Document (MDD) in terms of the Advertising, Marketing and Information Disclosure Requirements for Collective InvestmentSchemes published by the Financial Services Board. MDD issue date: 15 November 2017
Contact detailsManagement Company
Absa Fund Managers LimitedReg no 1991/000881/06 Absa Sandton South Campus, 15 Alice Lane, Sandton, 2196 Private Bag X10056, Sandton, 2146 Contact Centre: 0860 111 456 Fax: 0860 212 123 Email: [email protected] Website: www.absa.co.za/wim
Trustees
Société Générale Johannesburg BranchPO Box 6872, Johannesburg, 2000
Asset Manager
Absa Asset ManagementAn authorised financial services provider, FSP No: 522 Telephone: +27 (0)11 243 4563 Website:www.absa.co.za/wim
Absa Absolute Fund

Wealth and Investment Management
Absa Absolute Fund Fund Commentary30 September 2017
Commentary DocumentThe Absa Absolute Fund invests in a strategic mix of assets which is designed with the objective of generating a return of CPI plus 4% per annum over a rolling 3year term, while trying to minimize the risk of losing money in any one year. Assets in the fund include: inflation-linked bonds, fixed-interest bonds, money market,equity, property and offshore assets. Assets selected for this fund are chosen carefully, based not only on return, but also with a view to minimize the potentialdownside risk of the portfolio. The last 3 months have been characterized by a strong rebound in commodity prices which was led by a recovery in oil and base metal price. Consequently, strongcommodity prices, weaker exchange rate of the rand against the majors and the suspension of the Mining Charter, led Resources stocks higher and they were amongstthe best performers in the All Share index which subsequently contributed to equities being the best performing asset class in Q32017.Over the past 12 months, the All Share index delivered 10.2% yoy with Industrials (13.3% yoy) and Resources (11.4%) stocks leading the broad index higher whileFinancials (7.6% yoy) lagged behind and performed in line with cash returns ( Stefi 7.6% yoy). The stock market performance was supported by a relatively stableexchange rate of the rand over the past year, strong commodity prices performance and relatively cheap equity valuations. Abroad, the Federal Reserve Banks’ FOMC kept rates steady through the quarter while seeming surprised with stubbornly low inflation against a strong labour market.The tone of the Fed grew more hawkish toward the end of the quarter. They signaled that Federal Reserve balance sheet reduction would commence this year asexpected but the Fed’s tone turned more hawkish than was anticipated signaling the strong possibility of another policy rate hike in the last quarter. The US 10 yearbonds started the quarter at 2.3% yield, moved down to 2.0% and reversed back to end at 2.3% again.The European Central Bank kept its policy rates unchanged at both of its monetary policy meetings and comments from Governor Mario Draghi suggested conditionswere right to begin tapering back on their Quantitative Easing Program in the imminent future. Domestic politics remain a dominant theme driving the volatility in the exchange rate of the rand and the risk premium in the long-end of the bond curve. The centralfocus is the December 2017 ANC Elective Congress that will determine who will take both the party and the country forward amidst both heightened political andeconomic policy uncertainty.For the MPC it was a quarter of surprises for markets. July’s meeting saw the MPC cut rates by 25 basis points in a move that was against consensus. Based on theimproved inflation profile the committee agreed that a cut was required. This trend was not continued at the September meeting as the committee chose to keeprates on hold in a split decision citing increased risks to inflation from the currency into year end. Also, 2Q2017 real GDP figures surprised on the upside with arebound to 2.5% (QoQ SA annualized) thus breaking out of the 1Q2017 recession. Growth is expected to remain weak for the remainder of the year despite animproved global growth backdrop as domestic business and investor confidence remains low amidst political uncertainty.We remain cautious in the Absolute Fund, given the presence of increased political risk and slowdown in the economy. Our equity exposure continues to be focusedon stocks that are trading at (or better than) fair value to the broad equity market, as well as stocks that exhibit above-average earnings growth and dividendyields. The Absa Absolute Fund improved its 1-year performance from a sub-inflation return of 1.75% in 2Q2017 to an inflation beating return of 6.2% in 3Q2017. Thefund still lags behind its target return of CPI+4 in rolling 3-year but the turnaround strategy is yielding positive results, albeit in the short-term. At the time of writing this report, the mix of assets in the Absa Absolute Return Fund was:
Money market 10%Inflation linked bonds 12%Fixed interest bonds & Floating rate bonds 39%Domestic Equity 16%Offshore investments 14%Domestic Property 9% Total 100%
The investment environment remains volatile. Our first aim is always to protect our clients’ money, and to achieve a satisfactory return over a rolling three yearperiod.
Absa Absolute Fund

Wealth and Investment Management
DisclosuresCollective Investment Schemes (CIS) are generally medium to long-term investments. The value of participatory interests may go down as well as up and pastperformance is not necessarily a guide to future performance. Fluctuations or movements in exchange rates may cause the value of underlying internationalinvestments in a fund to move up or down. Forward pricing is used. CIS are traded at ruling prices. Absa Fund Managers Limited (AFM) may borrow up to 10% (tenper cent) of the market value of a fund to accommodate insufficient liquidity. Securities in a fund may be lent to borrowers. Income from the fund is distributed semi-annually and may only be paid out into an account as nominated by the investor. Prices are calculated on a net asset value (NAV) basis which is the total value of allassets in a fund including any income accrual and less permissible deductions from the fund. Prices are published daily and are available at www.absa.co.za⁄Absacoza/Indices⁄AbsaUnit-Trusts and in daily newspapers, or from AFM upon request. Fees and charges associated with the most expensive class are available directly fromAFM for investment by members of the public, other than financial institutions. CIS are financial products and not investments in insurance policies with an insurerand therefore cooling-off periods do not apply. AFM does not provide any guarantee either with respect to the capital or the return of a fund. The directors andpersonnel of AFM may be invested in any of the funds. AFM holds professional indemnity cover. AFM utilises Absa Bank Limited’s electronic and telephone bankingplatform. All requests for transactions received on or before 16:00 every day will traded at ruling prices and valued after 16:00 on that day. Investments in funds withforeign securities may involve various material risks, which include potential constraints on liquidity and the repatriation of funds, macroeconomic, political, foreignexchange, tax and settlement risks and potential limitations on the availability of market information and there may be tax to be levied on certain of the benefitsaccruing to the investor from the funds and AFM may be required to deduct and pay over to the authorities any such tax from such benefits before paying any balanceto or for the benefit of the investor. AFM has a right to close the fund to new investors in order to manage it more efficiently in accordance with its mandate. Theinvestor understands that the legal and tax environment is continually changing, and that AFM cannot be held responsible for any changes to the law which mighthave an effect on their investment, and which did not exist at the time their investment was made. Additional information on the fund including, but not limited to,brochures, application forms, annual and half-yearly reports are available free of charge from the AFM website or from AFM upon request. AFM is a registeredCollective Investment Scheme Manager and a full member of the Association for Savings and Investment SA. This document is a Minimum Disclosure Document(MDD) in terms of the Advertising, Marketing and Information Disclosure Requirements for Collective Investment Schemes published by the Financial Services Board.MDD issue date: 15 November 2017
Contact details
Management Company
Absa Fund Managers LimitedReg no 1991/000881/06 Absa Sandton South Campus, 15 Alice Lane, Sandton, 2196 Private Bag X10056, Sandton, 2146 Contact Centre: 0860 111 456 Fax: 0860 212 123 Email: [email protected] Website: www.absa.co.za/wim
Trustees
Société Générale Johannesburg BranchPO Box 6872, Johannesburg, 2000
Asset Manager
Absa Asset ManagementAn authorised financial services provider, FSP No: 522 Telephone: +27 (0)11 243 4563 Website:www.absa.co.za/wim
Absa Absolute Fund

Wealth and Investment Management
Absa Wealth Preserver Plus Fund Minimum disclosure documentMonth ended 31 October 2017
Fund detailsIndustry category SA - Multi Asset - Medium EquityBenchmark CPI+3% over rolling two year periodsFund launch date 23 April 2015Class A launch Date 23 April 2015Class D launch date 23 April 2015Fund Size R 55.35 MillionJSE code AWPCAFund Manager Chris Watts – B.Bus. Sci (Hons), CFA, FRMAsset Manager Absa Alternative Asset ManagementMinimum lump sum R 2000Minimum Monthly R 200
Income distributions - cents per unit (cpu)Class A Class D
the 6 months ended 31 Dec 2016 0.93 1.05the 6 months ended 30 Jun 2017 1.67 1.58
Income declaration 30 June & 31 DecemberIncome distributions 15 July & 15 January
Fees and Cost ratio (VAT incl.)Fees Class A Class DInitial Fees: Absa: 0% 0%
Adviser: 0-3.42% 0%Annual Fees: Management: 0.86% 0.63%
Adviser: 0-1.14% 0%Performance Fee: No No
Costs (annual, based on period shown) Class A Class DFor the period to 30-06-2017, from: 22-04-2015 22-04-2015Total expense ratio (TER): 1.75% 1.33%Transaction costs (TC): 0.16% 0.16%Total investment charges (TER+TC): 1.91% 1.49%Please refer to Disclosure section on next page for further information on Fees and Costs
PerformancePerformance: cumulative total returns (%)Term Class A Benchmark Sector
AverageRank Class D
Launch 5.47 25.12 13.96 66/68 5.983 month 4.66 1.63 4.87 62/88 4.726 Month 6.21 2.99 6.68 58/86 6.111 Year 7.92 8.21 11.48 79/83 7.97
Benchmark: CPI + 3% lagged by 1 monthSector Average & Rank: applies to the A Class.Please refer to Disclosures section on next page for further information on calculation methodologyand source of all performance data content (tables and/or charts) of this MDD
Fund objectivesThe primary objective of the Absa Wealth Preserver Plus Fund is to provide capitalgrowth through balanced exposure to primarily South African equity, bonds andmoney markets.
Fund strategyThis fund is a quasi-passive fund which invests in securities predominantlythrough indices and will be rebalanced on a regular interval to align with theinvestment philosophy and mandate of the fund. Equity exposure will varybetween 0%-75%. Securities to be included will be assets in liquid form andequity, bonds and money market securities acquired on exchanges (as legislationpermits), listed and unlisted financial instruments and securities that the Act mayfrom time to time allow all to be acquired at fair market prices.
Fund features• Ideal vehicle for medium to long-term investments• Aims to provide consistent positive return above inflation• Offers diversification by providing exposure to multiple asset classes• Strong focus on capital protection• Suitable for retirement fund investments
Fund specific risksInterest rate: The value of fixed income investments (e.g. bonds) tends todecrease when interest rates and/or inflation rises. Multi-asset investment: TheFund is subject to possible financial losses in multiple markets and mayunderperform more focused funds.
Risk profile and advisable minimum termLow Low-Medium Medium Medium-High High
3 Months + 6 Months + 2 Years + 3 Years + 5 Years +
Risk statisticsClass A Since Inception (23 April 2015)Number of positive months 15/30Highest 1 Year Performance 31/10/2017 7.92%Lowest 1 Year Performance 31/10/2016 -3.24%
Cumulative performance (since inception)
Absa Wealth Preserver Plus A Absa Wealth Preserver Plus D CPI + 3%
90
100
110
120
130
140
Apr-15
Jun-15
Dec-15
Jun-16
Dec-16
Jun-17
Oct-17
The chart reflects the value (monthly data points) of a R100 investment made on the 23April 2015
Absa Wealth Preserver Plus Fund

Wealth and Investment Management
Asset Allocation (%)
7,51%
18,36%
19,94%
54,19%
SA Bonds
Global -Multi-Asset
SA Equity
SA CashMoney Market
Top share holding (%)
Coronation Global Capital Plus Fund 18.36%Investec Money Market NCD 9.50%Naspers 4.90%Absa Money Market Fund 4.32%RSA R186 Government Bonds 4.05%RSA R207 Government Bonds 3.46%Richemont (CFR) 2.03%Anglo American 1.43%British American Tobacco 1.27%BHP Billiton 1.20%
Quarterly fund commentary as at 30 September 2017The Fund Commentary is provided on a quarterly basis and can be found on www.absa.co.za/WIM under Unit Trusts Minimum Disclosure Documents. The latest quarterly commentaryavailable is for the quarter ending 30 September 2017.
DisclosuresFees: Class A Adviser annual fee is not included in the annual management fee, it is charged by a way of unit reduction.
Costs: Total Expense Ratio (“TER”) is expressed as an annualised percentage of the value of the class of the portfolio that was incurred as expenses relating to the administration of theportfolio. A higher TER does not necessarily imply a poor return, nor does a lower TER imply a good return. The current TER cannot be regarded as an accurate indication of future TER's.Transaction Costs (“TC”) is expressed as an annualised percentage of the value of the portfolio that was incurred as costs relating to the buying and selling of the assets underlying theportfolio. TC are a necessary cost in administering the portfolio and impact returns. TC should not be considered in isolation as returns may be impacted by many other factors over timeincluding market returns, the type of portfolio, the investment decisions of the investment manager and the TER. Note that the total investment charges (TER+TC) have already been deductedprior to the calculation of the performance figures shown. Effective Annual Cost (“EAC”) is a measure that summarises the total cost that an investor incurs through their investment in aparticular financial product, based on the principles set out in the ASISA EAC standard. EAC data is available on request.
Performance: Performance is calculated for the portfolio⁄class of portfolios. Illustrative performance information is included for illustrative purposes only; individual investor performance maydiffer as a result of initial and ongoing fees, the actual investment date, the date of reinvestment and dividend withholding tax. All figures quoted are from Morningstar and⁄or IRESS, for theperiod ending 31/10/2017 (unless otherwise stated), calculated on a NAV to NAV basis, with income distributions reinvested on the ex-dividend date. Annualised figures refer to the averageyearly return of an investment over a given time period, all actual annual figures (if not shown) are available on request.
Collective Investment Schemes (CIS) are generally medium to long-term investments. the value of participatory interests may go down as well as up and past performance is not necessarilya guide to future performance. Fluctuations or movements in exchange rates may cause the value of underlying international investments In a fund to move up or down. Forward pricing isused. CIS are traded at ruling prices. Absa Fund Managers Limited (AFM) may borrow up to 10% (ten per cent) of the market value of a fund to accommodate insufficient liquidity. Securitiesin a fund may be lent to borrowers. Income from the fund is distributed semi-annually and may only be paid out into an account as nominated by the investor. Prices are calculated on a netasset value (NAV) basis which is the total value of all assets in a fund Including any income accrual and less permissible deductions from the fund. Prices are published daily and are availableat www.absa.co.za⁄Absacoza⁄Indices⁄absaUnit- Trusts and in daily newspapers, or from AFM upon request. Fees and charges associated with the most expensive class are available directlyfrom AFM for Investment by members of the public, other than financial institutions. CIS are financial products and not investments in insurance policies with an insurer and therefore cooling-off periods do not apply. AFM does not provide any guarantee either with respect to the capital or the return of a fund. The directors and personnel of AFM may be invested in any of thefunds. AFM holds professional indemnity cover. AFM utilises Absa Bank Limited’s electronic and telephone banking platform. All requests for transactions received on or before 16:00 everyday will traded at ruling prices and valued after 16:00 on that day. Investments in funds with foreign securities may Involve various material risks, which include potential constraints onliquidity and the repatriation of funds, macroeconomic, political, foreign exchange, tax and Settlement risks and potential limitations on the availability of market information and there maybe tax to be levied on certain of the benefits accruing to the investor from the funds and AFM may be required to deduct and pay over to the authorities any such tax from such benefits beforepaying any balance to or for the benefit of the investor. AFM has a right to close the fund to new investors in order to manage it more efficiently in accordance with its mandate. The investorunderstands that the legal and tax environment is continually changing, and that AFM cannot be held responsible for any changes to the law which might have an effect on their investment,And which did not exist at the time their investment was made. Additional information on the fund including, but not limited to, brochures, application forms, annual and half-yearly reportsare available free of charge from the AFM website or from AFM upon request. AFM is a registered Collective Investment Scheme Manager and a full member of the Association for Savingsand Investment SA. This document is a Minimum Disclosure Document (MDD) in terms of the Advertising, Marketing and Information disclosure requirements for Collective InvestmentSchemes published by the Financial Services Board. MDD issue date: 15 November 2017
Contact detailsManagement Company
Absa Fund Managers LimitedReg no 1991/000881/06 Absa Sandton South Campus, 15 Alice Lane, Sandton, 2196 Private Bag X10056, Sandton, 2146 Contact Centre: 0860 111 456 Fax: 0860 212 123 Email: [email protected] Website: www.absa.co.za/wim
Trustees
Société Générale Johannesburg BranchPO Box 6872, Johannesburg, 2057
Asset Manager
Absa Alternative Asset ManagementAn authorised financial services provider, FSP No: 22877 Telephone: +27 (0)21 927 6406 Website:www.absa.co.za/wim
Absa Wealth Preserver Plus Fund

Wealth and Investment Management
Absa Wealth Preserver Plus Fund Fund Commentary30 September 2017
Commentary DocumentSA equities, represented by the FTSE/ JSE Top 40 Index (Top 40), rose 8.71% in the third quarter of this year, while SA bonds, represented by the South African AllBond Index, rose by 3.68% for the period. Global equities, represented by the MSCI World Index, rose 4.39%. The Rand weakened by 3.70% against the U.S. Dollarin the third quarter. The Fund by comparison rose by 1.84%, in the third quarter. South Africa’s economy recovered in the second quarter of 2017. This is largely attributed to a re-bound in the agriculture sector due to the improved summer rainfalland a mild improvement in the mining sector production. Low confidence amongst the private sector and consumers continues to result in low capital expenditureand tight fiscal policy has hamstrung public and SOE expenditure. Investors are uncertain as to the outcome of the December 2017 ANC leadership conference which sees two factions go head-to-head to elect their leadership. Eachfaction has very different views on what is needed for the economy which removes the prospect of policy certainty for the foreseeable future. The portfolios’ asset allocation is mostly to South African cash (43.36%) and protected equity (30.67%) and offshore assets (18.07%). Despite the recent recoveryin the bond market, given the conservative nature of the fund, the fund managers feel that a combination of the above mentioned asset classes on a protected basisremains the most prudent approach for now. Despite this conservative approach, the portfolio is still positioned to benefit from a rally in the SA and offshore equities.The fund’s allocation to the SA bond market makes up approx. 7.90% of the fund. The portfolios’ offshore allocation was 18.07% at the end of September 2017, returning 3.99% in the third quarter. The offshore allocation continues to benefit froma long term weakening in the Rand and we continue to see potential for equities in developed markets to outperform.
DisclosuresCollective Investment Schemes (CIS) are generally medium to long-term investments. the value of participatory interests may go down as well as up and pastperformance is not necessarily a guide to future performance. Fluctuations or movements in exchange rates may cause the value of underlying international investmentsIn a fund to move up or down. Forward pricing is used. CIS are traded at ruling prices. Absa Fund Managers Limited (AFM) may borrow up to 10% (ten per cent) ofthe market value of a fund to accommodate insufficient liquidity. Securities in a fund may be lent to borrowers. Income from the fund is distributed semi-annually andmay only be paid out into an account as nominated by the investor. Prices are calculated on a net asset value (NAV) basis which is the total value of all assets in a fundIncluding any income accrual and less permissible deductions from the fund. Prices are published daily and are available at www.absa.co.za⁄Absacoza⁄Indices⁄absaUnit-Trusts and in daily newspapers, or from AFM upon request. Fees and charges associated with the most expensive class are available directly from AFM for Investmentby members of the public, other than financial institutions. CIS are financial products and not investments in insurance policies with an insurer and therefore cooling-off periods do not apply. AFM does not provide any guarantee either with respect to the capital or the return of a fund. The directors and personnel of AFM may beinvested in any of the funds. AFM holds professional indemnity cover. AFM utilises Absa Bank Limited’s electronic and telephone banking platform. All requests fortransactions received on or before 16:00 every day will traded at ruling prices and valued after 16:00 on that day. Investments in funds with foreign securities mayInvolve various material risks, which include potential constraints on liquidity and the repatriation of funds, macroeconomic, political, foreign exchange, tax andSettlement risks and potential limitations on the availability of market information and there may be tax to be levied on certain of the benefits accruing to the investorfrom the funds and AFM may be required to deduct and pay over to the authorities any such tax from such benefits before paying any balance to or for the benefit ofthe investor. AFM has a right to close the fund to new investors in order to manage it more efficiently in accordance with its mandate. The investor understands thatthe legal and tax environment is continually changing, and that AFM cannot be held responsible for any changes to the law which might have an effect on theirinvestment, And which did not exist at the time their investment was made. Additional information on the fund including, but not limited to, brochures, applicationforms, annual and half-yearly reports are available free of charge from the AFM website or from AFM upon request. AFM is a registered Collective Investment SchemeManager and a full member of the Association for Savings and Investment SA. This document is a Minimum Disclosure Document (MDD) in terms of the Advertising,Marketing and Information disclosure requirements for Collective Investment Schemes published by the Financial Services Board. MDD issue date: 15 November 2017
Contact details
Management Company
Absa Fund Managers LimitedReg no 1991/000881/06 Absa Sandton South Campus, 15 Alice Lane, Sandton, 2196 Private Bag X10056, Sandton, 2146 Contact Centre: 0860 111 456 Fax: 0860 212 123 Email: [email protected] Website: www.absa.co.za/wim
Trustees
Société Générale Johannesburg BranchPO Box 6872, Johannesburg, 2057
Asset Manager
Absa Alternative Asset ManagementAn authorised financial services provider, FSP No: 22877 Telephone: +27 (0)21 927 6406 Website:www.absa.co.za/wim
Absa Wealth Preserver Plus Fund
Wealth and Investment Management
Absa Balanced Fund Minimum disclosure documentMonth ended 31 October 2017
Fund detailsIndustry category SA - Multi Asset - Medium EquityBenchmark CPI + 5% p.a. over a rolling 60 month periodFund launch date 01 June 1994Class A launch Date 02 October 2000Class C1 launch date 26 March 2013Fund Size R 2.11 BillionJSE code ABBFFund Manager Greg Kettles – B Com (Hons), CA(SA), CFA
Kurt Benn – B.Bus.Sc (Finance), B.Com (Hons), CFA
Asset Manager Absa Asset Management (Pty) LtdMinimum lump sum R 2000Minimum Monthly R 200
Income distributions - cents per unit (cpu)Class A Class C1
the 6 months ended 31 Dec 2016 7.31 8.80the 6 months ended 30 Jun 2017 5.66 7.30
Income declaration 30 June & 31 DecemberIncome distributions 15 July & 15 January
Fees and Cost ratio (VAT incl.)Fees Class A Class C1Initial Fees: Absa: 0% 0%
Adviser: 0 -3.42% 0%Annual Fees: Management: 1.71% 0.97%
Adviser: 0-1.14%Performance Fee: No No
Costs (annual, based on period shown) Class A Class C1For the period to 30-06-2017, from: 01/07/2014 01/07/2014Total expense ratio (TER): 1.82% 0.97%Transaction costs (TC): 0.22% 0.22%Total investment charges (TER+TC): 2.04% 1.19%Please refer to Disclosure section on next page for further information on Fees and Costs
PerformancePerformance: annualised total returns (%)Term Class A Benchmark Sector
AverageRank Class C1
Launch 12.74 10.75 11.51 2/2 9.151 Year 12.20 10.07 11.48 40/84 13.023 Year 6.65 10.27 7.23 48/64 7.505 Year 8.64 10.54 9.42 38/47 -10 Year 7.95 10.98 7.87 21/34 -
Performance Yearly returns (%)1 yr ending: Oct'17 Oct'16 Oct'15 Oct'14 Oct'13 Oct'12 Oct'11 Oct'10Class A 12.20 -0.46 8.62 8.53 14.95 12.71 8.44 12.81Benchmark 10.07 11.13 9.61 10.96 10.93 10.46 10.77 8.05Class C1 13.02 0.33 9.57 9.33 - - - -Benchmark: CPI + 5% lagged by 1 monthSector Average & Rank: applies to the R Class.Please refer to Disclosures section on next page for further information on calculation methodologyand source of all performance data content (tables and/or charts) of this MDD
Fund objectivesThe manager shall seek to achieve an investment medium for investors of theportfolio, which shall have as its main objectives, steady growth of income andcapital, a reasonable level of current income and the maximum possible stabilityfor capital invested.
Fund strategyThe fund will use an active asset allocation strategy by investing in selected JSE-listed shares, quoted property trusts, bonds, money market and internationalassets. The fund is managed according to the guidelines as set out in regulation28 of the pension funds act and is suitable for retirement funds investments.
Fund features• Ideal vehicle for medium to long-term investments• Seeks to achieve real target returns over specific time periods• Offers diversification by providing exposure to multiple asset classes• Strong focus on capital preservation• An actively managed fund for investors seeking exposure to South African
and international markets• Suitable for investors who wish to save for retirement
Fund specific risksInterest rate: The value of fixed income investments (e.g. bonds) tends todecrease when interest rates and/or inflation rises. Multi-asset investment: TheFund is subject to possible financial losses in multiple markets and mayunderperform more focused funds. Property: Investments in real estate securitiescan carry the same risks as investing directly in real estate itself. Real estate pricesrise and fall in response to a variety of factors, including local, regional andnational economic and political conditions, interest rates and tax considerations.
Risk profile and advisable minimum termLow Low-Medium Medium Medium-High High
3 Months + 6 Months + 2 Years + 3 Years + 5 Years +
Risk statisticsClass A Since Inception (02 October 2000)Number of positive months 145/205Highest 1 Year Performance 31/07/2005 42.86%Lowest 1 Year Performance 31/10/2008 -13.34%
Cumulative performance (5 years)
Absa Balanced A CPI(Headline) CPI + 5%
100
120
140
160
180
200
Oct-12
Dec-12
Jun-13
Dec-13
Jun-14
Dec-14
Jun-15
Dec-15
Jun-16
Dec-16
Jun-17
Oct-17
The chart reflects the value (monthly data points) of a R100 investment made on the01/11/2012
Absa Balanced Fund

Wealth and Investment Management
Asset Allocation (%)
0,48%
0,87%
0,94%
1,05%
5,55%
11,60%
20,23%
27,47%
31,80%
Floating rate bonds
Preference shares
International fixedinterest and property
International money market
Money market
Property
Fixed rate bonds
International equity
Equity
Top share holding (%)
Greenbay Prop Ltd 3.59%NEPI Rockcastle PLC 3.01%Naspers 2.90%Sasol 2.52%British American Tobacco 2.47%Atlantic Leaf Properties Ltd 2.04%BHPBil 2.01%MTN Group 1.74%Abinbev 1.72%Anglo 1.71%
Quarterly fund commentary as at 30 September 2017The Fund Commentary is provided on a quarterly basis and can be found on www.absa.co.za/WIM under Unit Trusts Minimum Disclosure Documents. The latest quarterly commentaryavailable is for the quarter ending 30 September 2017.
DisclosuresFees: Class A Adviser annual fee is not included in the annual management fee, it is charged by a way of unit reduction.
Costs: Total Expense Ratio (“TER”) is expressed as an annualised percentage of the value of the Class of the portfolio that was incurred as expenses relating to the administration of theportfolio. A higher TER does not necessarily imply a poor return, nor does a lower TER imply a good return. The current TER cannot be regarded as an accurate indication of future TER's.Transaction Costs (“TC”) is expressed as an annualised percentage of the value of the portfolio that was incurred as costs relating to the buying and selling of the assets underlying theportfolio. TC are a necessary cost in administering the portfolio and impact returns. TC should not be considered in isolation as returns may be impacted by many other factors over timeincluding market returns, the type of portfolio, the investment decisions of the investment manager and the TER. Note that the total investment charges (TER+TC) have already been deductedprior to the calculation of the performance figures shown. Effective Annual Cost (“EAC”) is a measure that summarises the total cost that an investor incurs through their investment in aparticular financial product, based on the principles set out in the ASISA EAC standard. EAC data is available on request.
Performance: Performance is calculated for the portfolio⁄class of portfolios. Illustrative performance information is included for illustrative purposes only; individual investor performance maydiffer as a result of initial and ongoing fees, the actual investment date, the date of reinvestment and dividend withholding tax. All figures quoted are from Morningstar and⁄or IRESS, for theperiod ending 31/10/2017 (unless otherwise stated), calculated on a NAV to NAV basis, with income distributions reinvested on the ex-dividend date. Annualised figures refer to the averageyearly return of an investment over a given time period, all actual annual figures (if not shown) are available on request.
Collective Investment Schemes (CIS) are generally medium to long-term investments. The value of participatory interests may go down as well as up and past Performance is not necessarilya guide to future performance. Fluctuations or movements in exchange rates may cause the value of underlying international investments In a fund to move up or down. Forward pricing isused. CIS are traded at ruling prices. Absa Fund Managers Limited (AFM) may borrow up to 10% (ten per cent) of the market value of a fund to accommodate insufficient liquidity. Securitiesin a fund may be lent to borrowers. Income from the fund is distributed semi-annually and may only be paid out into an account as nominated by the investor. Prices are calculated on a netasset value (NAV) basis which is the total value of all assets in a fund including any income accrual and less permissible deductions from the fund. Prices are published daily and are availableat www.absa.co.za⁄Absacoza⁄Indices⁄AbsaUnit-Trusts and in daily newspapers, or from AFM upon request. Fees and charges associated with the most expensive class are available directlyfrom AFM for Investment by members of the public, other than financial institutions. CIS are financial products and not investments in insurance policies with an insurer and therefore cooling-off periods do not apply. AFM does not provide any guarantee either with respect to the capital or the return of a fund. The directors and personnel of AFM may be invested in any of thefunds. AFM holds professional indemnity cover. AFM utilises Absa Bank Limited’s electronic and telephone banking platform. All requests for transactions received on or before 16:00 everyday will traded at ruling prices and valued after 16:00 on that day. Investments in funds with foreign securities may involve various material risks, which include potential constraints onliquidity and the repatriation of funds, macroeconomic, political, foreign exchange, tax and Settlement risks and potential limitations on the availability of market information and there maybe tax to be levied on certain of the benefits accruing to the investor from the funds and AFM may be required to deduct and pay over to the authorities any such tax from such benefits beforepaying any balance to or for the benefit of the investor. AFM has a right to close the fund to new investors in order to manage it more efficiently in accordance with its mandate. The investorunderstands that the legal and tax environment is continually changing, and that AFM cannot be held responsible for any changes to the law which might have an effect on their investment,and which did not exist at the time their investment was made. Additional information on the fund including, but not limited to, brochures, application forms, annual and half-yearly reportsare available free of charge from the AFM website or from AFM upon request. AFM is a registered Collective Investment Scheme Manager and a full member of the Association for Savingsand Investment SA. This document is a Minimum Disclosure Document (MDD) in terms of the Advertising, Marketing and Information Disclosure requirements for Collective InvestmentSchemes published by the Financial Services Board. MDD issue date: 15 November 2017
Contact detailsManagement Company
Absa Fund Managers LimitedReg no 1991/000881/06 Absa Sandton South Campus, 15 Alice Lane, Sandton, 2196 Private Bag X10056, Sandton, 2146 Contact Centre: 0860 111 456 Fax: 0860 212 123 Email: [email protected] Website: www.absa.co.za/wim
Trustees
Société Générale Johannesburg BranchPO Box 6872, Johannesburg, 2000
Asset Manager
Absa Asset ManagementAn authorised financial services provider, FSP No: 522 Telephone: +27 (0)11 243 4563 Website:www.absa.co.za/wim
Absa Balanced Fund

Wealth and Investment Management
Absa Balanced Fund Fund Commentary30 September 2017
Commentary DocumentGlobal equity markets continued to enjoy the “goldilocks environment” of moderate, but rising global GDP growth and low inflation. If current trends persist, 2017will be the first year since the global financial crisis that the world registers a synchronized growth upswing. Moreover, the US Federal Reserve (Fed), European CentralBank (ECB) and Bank of Japan (BOJ) have remained extremely accommodative in their respective approaches to policy rate normalization. While the Fed commencedits policy normalization process in 2016, the pace of rate hikes has been very slow and US financial conditions still remain extremely supportive of risk assets. TheECB and BOJ have continued fairly aggressively with quantitative easing. The ECB is likely to end its program in December 2017 but interest rates are not expectedto rise in the next 12-18 months. These actions have led to abundant cheap liquidity which has fueled the performance of risk assets globally. The MSCI World Indexis up 17.8% year-to-date while the emerging market equivalent is up 28%. During Q3 2017, emerging markets outperformed developed markets by 3% and registereda total dollar return of 8%. South Africa registered a relatively poor performance against this highly favourable global backdrop. In dollars, the MSCI SA index returned 4% for the quarter and12.7% for the year-to-date. Rand weaknesses played a significant role. During the quarter the Rand was the second worst performing EM currency. South Africacontinues to be impacted by the same old foes: political and policy uncertainty; fiscal mismanagement; very weak growth; poor consumer and business confidence;and the prospect of further ratings downgrades. While the rest of the EM equity complex recorded foreign inflows of more than $60bn, SA experienced outflows ofnearly $6bn. In rand terms, the MSCI SA returned a very respectable 7.2% for the quarter. The return was flattered by Naspers, which contributed two-thirds of the index return.The index was supported by a rally in interest rate sensitive stocks after the SA Reserve Bank (SARB) surprised the market with a rate cut in July. Retailers (+7.9%)and Banks (+6.6%) were the best performing sectors while defensive sectors such as Healthcare (-6.9%) and Food producers (-1.8%) lagged. This rally wasunceremoniously stalled when the SARB surprised yet again by not cutting in September. The All Bond Index (ALBI) had a reasonably strong start to the quarter but the rally lost momentum after the SARB’s decision to hold rates steady in September. Asa result the ALBI returned 3.7%, which was substantially lower than the comparative equity market return during the quarter. The same trend was visible globally,where global bonds lagged global equities. The fund’s quarterly return was therefore hampered by the outperformance of equities (exposure is relatively low) overbonds (exposure is relatively high). Barring any unexpected shocks, 2017 should close on a good note for the global economy. Regrettably, due to much of its own doing, South Africa will miss out onthis bounty. A further downgrade by S&P Global Ratings will potentially lead to massive bond outflows, a weaker rand and higher inflation. Using Brazil, Russia andTurkey as case studies, the impact on domestic growth will be negative and will likely persist for several years. Even in the absence of a downgrade, domestic growthis weak due to poor business and consumer confidence while political uncertainty is deterring foreign investment. Nevertheless, the All Share Index is posting recordhighs. Globally, the economic outlook is looking rosy but after 9 years of rising markets valuation levels of the major asset classes are over-extended. Markets have ignoredthe elevated geopolitical tensions and global macro policy uncertainty to focus on near term economic drivers. Market complacency has hit record levels evidencedby PE ratings and volatility indicators. Historically, these levels have not been sustainable. Against this backdrop our funds continue to be conservatively positionedholding high levels of cash, bonds and defensive, high quality, undervalued equities.
DisclosuresCollective Investment Schemes (CIS) are generally medium to long-term investments. The value of participatory interests may go down as well as up and pastPerformance is not necessarily a guide to future performance. Fluctuations or movements in exchange rates may cause the value of underlying international investmentsIn a fund to move up or down. Forward pricing is used. CIS are traded at ruling prices. Absa Fund Managers Limited (AFM) may borrow up to 10% (ten per cent) ofthe market value of a fund to accommodate insufficient liquidity. Securities in a fund may be lent to borrowers. Income from the fund is distributed semi-annually andmay only be paid out into an account as nominated by the investor. Prices are calculated on a net asset value (NAV) basis which is the total value of all assets in a fundincluding any income accrual and less permissible deductions from the fund. Prices are published daily and are available at www.absa.co.za⁄Absacoza⁄Indices⁄AbsaUnit-Trusts and in daily newspapers, or from AFM upon request. Fees and charges associated with the most expensive class are available directly from AFM for Investmentby members of the public, other than financial institutions. CIS are financial products and not investments in insurance policies with an insurer and therefore cooling-off periods do not apply. AFM does not provide any guarantee either with respect to the capital or the return of a fund. The directors and personnel of AFM may beinvested in any of the funds. AFM holds professional indemnity cover. AFM utilises Absa Bank Limited’s electronic and telephone banking platform. All requests fortransactions received on or before 16:00 every day will traded at ruling prices and valued after 16:00 on that day. Investments in funds with foreign securities mayinvolve various material risks, which include potential constraints on liquidity and the repatriation of funds, macroeconomic, political, foreign exchange, tax andSettlement risks and potential limitations on the availability of market information and there may be tax to be levied on certain of the benefits accruing to the investorfrom the funds and AFM may be required to deduct and pay over to the authorities any such tax from such benefits before paying any balance to or for the benefit ofthe investor. AFM has a right to close the fund to new investors in order to manage it more efficiently in accordance with its mandate. The investor understands thatthe legal and tax environment is continually changing, and that AFM cannot be held responsible for any changes to the law which might have an effect on theirinvestment, and which did not exist at the time their investment was made. Additional information on the fund including, but not limited to, brochures, applicationforms, annual and half-yearly reports are available free of charge from the AFM website or from AFM upon request. AFM is a registered Collective Investment SchemeManager and a full member of the Association for Savings and Investment SA. This document is a Minimum Disclosure Document (MDD) in terms of the Advertising,Marketing and Information Disclosure requirements for Collective Investment Schemes published by the Financial Services Board. MDD issue date: 15 November 2017
Contact details
Management Company
Absa Fund Managers LimitedReg no 1991/000881/06 Absa Sandton South Campus, 15 Alice Lane, Sandton, 2196 Private Bag X10056, Sandton, 2146 Contact Centre: 0860 111 456 Fax: 0860 212 123 Email: [email protected] Website: www.absa.co.za/wim
Trustees
Société Générale Johannesburg BranchPO Box 6872, Johannesburg, 2000
Asset Manager
Absa Asset ManagementAn authorised financial services provider, FSP No: 522 Telephone: +27 (0)11 243 4563 Website:www.absa.co.za/wim
Absa Balanced Fund
Wealth and Investment Management
Absa Managed Fund Minimum disclosure documentMonth ended 31 October 2017
Fund detailsIndustry category SA - Multi Asset - High EquityBenchmark CPI + 6% p.a. over a rolling 5 year periodFund launch date 25 February 2010Class A launch Date 12 April 2010Class C1 launch date 06 June 2013Fund Size R 96.09 MillionJSE code AMFCAFund Manager Greg Kettles – B Com (Hons), CA(SA), CFA
Kurt Benn – B.Bus.Sc (Finance), B.Com (Hons), CFA
Asset Manager Absa Asset Management (Pty) LtdMinimum lump sum R 2000Minimum Monthly R 200
Income distributions - cents per unit (cpu)Class A Class C1
the 6 months ended 31 Dec 2016 2.92 3.93the 6 months ended 30 Jun 2017 2.35 3.04
Income declaration 30 June & 31 DecemberIncome distributions 15 July & 15 January
Fees and Cost ratio (VAT incl.)Fees Class A Class C1Initial Fees: Absa: 0% 0%
Adviser: 0-3.42% 0%Annual Fees: Management: 1.71% 0.97%
Adviser: 0-1.14%Performance Fee: No No
Costs (annual, based on period shown) Class A Class C1For the period to 30-06-2017, from: 01/07/2014 01/07/2014Total expense ratio (TER): 1.81% 0.97%Transaction costs (TC): 0.26% 0.26%Total investment charges (TER+TC): 2.07% 1.23%Please refer to Disclosure section on next page for further information on Fees and Costs
PerformancePerformance: annualised total returns (%)Term Class A Benchmark Sector
AverageRank Class C1
Launch 10.25 11.71 10.03 35/58 9.781 Year 12.72 11.36 12.66 97/177 13.792 Year 5.85 11.93 5.91 84/145 6.783 Year 7.24 11.58 7.65 88/119 8.175 Year 9.61 11.87 10.13 64/87 -
Performance Yearly returns (%)1 yr ending: Oct'17 Oct'16 Oct'15 Oct'14 Oct'13 Oct'12Class A 12.72 -0.59 10.06 9.26 17.42 15.30Benchmark 11.36 12.51 10.88 12.31 12.28 11.80Class C1 13.79 0.20 11.02 10.03 - -Benchmark: CPI + 6% lagged by 1 month Sector Average & Rank: applies to the A Class. Please refer to Disclosuressection on next page for further information on calculation methodology and source of all performance data content(tables and/or charts) of this MDD
Fund objectivesThe main objective of the Absa Managed Fund is to manage the asset allocationstrategy so as to maximise capital growth and income over the long term.
Fund strategyThe fund will use an active asset allocation strategy by investing in selected JSElisted shares, quoted property, bonds, money market and international assets.The portfolio will have a general bias towards equity. The fund is managedaccording to the guidelines as set out in Regulation 28 of the pension funds actand is suitable for retirement funds investments.
Fund features• Ideal vehicle for medium to long-term investments• Aims to provide consistent positive returns above inflation• Offers diversification by providing exposure to multiple asset classes• Strong focus on capital protection• Suitable for retirement fund investments
Fund specific risksInterest rate: The value of fixed income investments (e.g. bonds) tends todecrease when interest rates and/or inflation rises. Multi-asset investment: TheFund is subject to possible financial losses in multiple markets and mayunderperform more focused funds. Property: Investments in real estate securitiescan carry the same risks as investing directly in real estate itself. Real estate pricesrise and fall in response to a variety of factors, including local, regional andnational economic and political conditions, interest rates and tax considerations.
Risk profile and advisable minimum termLow Low-Medium Medium Medium-High High
3 Months + 6 Months + 2 Years + 3 Years + 5 Years +
Risk statisticsClass A Since Inception (12 April 2010)Number of positive months 59/90Highest 1 Year Performance 31/05/2013 21.97%Lowest 1 Year Performance 31/10/2016 -0.59%
Cumulative performance (5 years)
Absa Managed A CPI (Headline) CPI + 6%
100
120
140
160
180
200
Oct-12
Dec-12
Jun-13
Dec-13
Jun-14
Dec-14
Jun-15
Dec-15
Jun-16
Dec-16
Jun-17
Oct-17
The chart reflects the value (monthly data points) of a R100 investment made on the01/11/2012
Absa Managed Fund

Wealth and Investment Management
Asset Allocation (%)
10,29%
11,27%
14,97%
28,40%
35,07%
Money market
Property
Fixed rate bonds
International equity
Equity
Top share holding (%)
Greenbay Prop Ltd 3.99%NEPI Rockcastle PLC 3.19%British American Tobacco 3.06%Sasol 3.04%BHPBil 2.40%MTN Group 2.28%Anglo 2.11%Gfields 2.04%Atlantic Leaf Properties Ltd 1.83%Reinet Investments 1.81%
Quarterly fund commentary as at 30 September 2017The Fund Commentary is provided on a quarterly basis and can be found on www.absa.co.za/WIM under Unit Trusts Minimum Disclosure Documents. The latest quarterly commentaryavailable is for the quarter ending 30 September 2017.
DisclosuresFees: Class A Adviser annual fee is not included in the annual management fee, it is charged by a way of unit reduction.
Costs: Total Expense Ratio (“TER”) is expressed as an annualised percentage of the value of the Class of the portfolio that was incurred as expenses relating to the administration of theportfolio. A higher TER does not necessarily imply a poor return, nor does a lower TER imply a good return. The current TER cannot be regarded as an accurate indication of future TER's.Transaction Costs (“TC”) is expressed as an annualised percentage of the value of the portfolio that was incurred as costs relating to the buying and selling of the assets underlying theportfolio. TC are a necessary cost in administering the portfolio and impact returns. TC should not be considered in isolation as returns may be impacted by many other factors over timeincluding market returns, the type of portfolio, the investment decisions of the investment manager and the TER. Note that the total investment charges (TER+TC) have already been deductedprior to the calculation of the performance figures shown. Effective Annual Cost (“EAC”) is a measure that summarises the total cost that an investor incurs through their investment in aparticular financial product, based on the principles set out in the ASISA EAC standard. EAC data is available on request.
Performance: Performance is calculated for the portfolio⁄class of portfolios. Illustrative performance information is included for illustrative purposes only; individual investor performance maydiffer as a result of initial and ongoing fees, the actual investment date, the date of reinvestment and dividend withholding tax. All figures quoted are from Morningstar and⁄or IRESS, for theperiod ending 31/10/2017 (unless otherwise stated), calculated on a NAV to NAV basis, with income distributions reinvested on the ex-dividend date. Annualised figures refer to the averageyearly return of an investment over a given time period, all actual annual figures (if not shown) are available on request.
Collective Investment Schemes (CIS) are generally medium to long-term investments. The value of participatory interests may go down as well as up and past performance is not necessarilya guide to future performance. Fluctuations or movements in exchange rates may cause the value of underlying international investments in a fund to move up or down. Forward pricing isused. CIS are traded at ruling prices. Absa Fund Managers Limited (AFM) may borrow up to 10% (ten per cent) of the market value of a fund to accommodate insufficient liquidity. Securitiesin a fund may be lent to borrowers. Income from the fund is distributed semi-annually and may only be paid out into an account as nominated by the investor. Prices are calculated on a netasset value (NAV) basis which is the total value of all assets in a fund including any income accrual and less permissible deductions from the fund. Prices are published daily and are availableat www.Absa.co.za⁄Absacoza⁄indices⁄Absaunit-Trusts and in daily newspapers, or from AFM upon request. Fees and charges associated with the most expensive class are available directlyfrom AFM for investment by members of the public, other than financial institutions. CIS are financial products and not investments in insurance policies with an insurer and therefore cooling-off periods do not apply. AFM does not provide any guarantee either with respect to the capital or the return of a fund. The directors and personnel of AFM may be invested in any of thefunds. AFM holds professional indemnity cover. AFM utilises Absa Bank Limited’s electronic and telephone banking platform. All requests for transactions received on or before 16:00 everyday will traded at ruling prices and valued after 16:00 on that day. Investments in funds with foreign securities may involve various material risks, which include potential constraints onliquidity and the repatriation of funds, macroeconomic, political, foreign exchange, tax and settlement risks and potential limitations on the availability of market information and there maybe tax to be levied on certain of the benefits accruing to the investor from the funds and AFM may be required to deduct and pay over to the authorities any such tax from such benefits beforepaying any balance to or for the benefit of the investor. AFM has a right to close the fund to new investors in order to manage it more efficiently in accordance with its mandate. The investorunderstands that the legal and tax environment is continually changing, and that AFM cannot be held responsible for any changes to the law which might have an effect on their investment,and which did not exist at the time their investment was made. Additional information on the fund including, but not limited to, brochures, application forms, annual and half-yearly reportsare available free of charge from the AFM website or from AFM upon request. AFM is a registered Collective Investment Scheme Manager and a full member of the Association for Savingsand Investment SA. This document is a Minimum Disclosure Document (MDD) in terms of the Advertising, Marketing and Information Disclosure requirements for Collective InvestmentSchemes published by the Financial Services Board. MDD issue date: 15 November 2017
Contact detailsManagement Company
Absa Fund Managers LimitedReg no 1991/000881/06 Absa Sandton South Campus, 15 Alice Lane, Sandton, 2196 Private Bag X10056, Sandton, 2146 Contact Centre: 0860 111 456 Fax: 0860 212 123 Email: [email protected] Website: www.absa.co.za/wim
Trustees
Société Générale Johannesburg BranchPO Box 6872, Johannesburg, 2000
Asset Manager
Absa Asset ManagementAn authorised financial services provider, FSP No: 522 Telephone: +27 (0)11 243 4563 Website:www.absa.co.za/wim
Absa Managed Fund

Wealth and Investment Management
Absa Managed Fund Fund Commentary30 September 2017
Commentary DocumentGlobal equity markets continued to enjoy the “goldilocks environment” of moderate, but rising global GDP growth and low inflation. If current trends persist, 2017will be the first year since the global financial crisis that the world registers a synchronized growth upswing. Moreover, the US Federal Reserve (Fed), European CentralBank (ECB) and Bank of Japan (BOJ) have remained extremely accommodative in their respective approaches to policy rate normalization. While the Fed commencedits policy normalization process in 2016, the pace of rate hikes has been very slow and US financial conditions still remain extremely supportive of risk assets. TheECB and BOJ have continued fairly aggressively with quantitative easing. The ECB is likely to end its program in December 2017 but interest rates are not expectedto rise in the next 12-18 months. These actions have led to abundant cheap liquidity which has fueled the performance of risk assets globally. The MSCI World Indexis up 17.8% year-to-date while the emerging market equivalent is up 28%. During Q3 2017, emerging markets outperformed developed markets by 3% and registereda total dollar return of 8%. South Africa registered a relatively poor performance against this highly favourable global backdrop. In dollars, the MSCI SA index returned 4% for the quarter and12.7% for the year-to-date. Rand weaknesses played a significant role. During the quarter the Rand was the second worst performing EM currency. South Africacontinues to be impacted by the same old foes: political and policy uncertainty; fiscal mismanagement; very weak growth; poor consumer and business confidence;and the prospect of further ratings downgrades. While the rest of the EM equity complex recorded foreign inflows of more than $60bn, SA experienced outflows ofnearly $6bn. In rand terms, the MSCI SA returned a very respectable 7.2% for the quarter. The return was flattered by Naspers, which contributed two-thirds of the index return.The index was supported by a rally in interest rate sensitive stocks after the SA Reserve Bank (SARB) surprised the market with a rate cut in July. Retailers (+7.9%)and Banks (+6.6%) were the best performing sectors while defensive sectors such as Healthcare (-6.9%) and Food producers (-1.8%) lagged. This rally wasunceremoniously stalled when the SARB surprised yet again by not cutting in September. The All Bond Index (ALBI) had a reasonably strong start to the quarter but the rally lost momentum after the SARB’s decision to hold rates steady in September. Asa result the ALBI returned 3.7%, which was substantially lower than the comparative equity market return during the quarter. The same trend was visible globally,where global bonds lagged global equities. The fund’s quarterly return was therefore hampered by the outperformance of equities (exposure is relatively low) overbonds (exposure is relatively high). Barring any unexpected shocks, 2017 should close on a good note for the global economy. Regrettably, due to much of its own doing, South Africa will miss out onthis bounty. A further downgrade by S&P Global Ratings will potentially lead to massive bond outflows, a weaker rand and higher inflation. Using Brazil, Russia andTurkey as case studies, the impact on domestic growth will be negative and will likely persist for several years. Even in the absence of a downgrade, domestic growthis weak due to poor business and consumer confidence while political uncertainty is deterring foreign investment. Nevertheless, the All Share Index is posting recordhighs. Globally, the economic outlook is looking rosy but after 9 years of rising markets valuation levels of the major asset classes are over-extended. Markets have ignoredthe elevated geopolitical tensions and global macro policy uncertainty to focus on near term economic drivers. Market complacency has hit record levels evidencedby PE ratings and volatility indicators. Historically, these levels have not been sustainable. Against this backdrop our funds continue to be conservatively positionedholding high levels of cash, bonds and defensive, high quality, undervalued equities.
DisclosuresCollective Investment Schemes (CIS) are generally medium to long-term investments. The value of participatory interests may go down as well as up and pastperformance is not necessarily a guide to future performance. Fluctuations or movements in exchange rates may cause the value of underlying international investmentsin a fund to move up or down. Forward pricing is used. CIS are traded at ruling prices. Absa Fund Managers Limited (AFM) may borrow up to 10% (ten per cent) ofthe market value of a fund to accommodate insufficient liquidity. Securities in a fund may be lent to borrowers. Income from the fund is distributed semi-annually andmay only be paid out into an account as nominated by the investor. Prices are calculated on a net asset value (NAV) basis which is the total value of all assets in a fundincluding any income accrual and less permissible deductions from the fund. Prices are published daily and are available at www.Absa.co.za⁄Absacoza⁄indices⁄Absaunit-Trusts and in daily newspapers, or from AFM upon request. Fees and charges associated with the most expensive class are available directly from AFM for investmentby members of the public, other than financial institutions. CIS are financial products and not investments in insurance policies with an insurer and therefore cooling-off periods do not apply. AFM does not provide any guarantee either with respect to the capital or the return of a fund. The directors and personnel of AFM may beinvested in any of the funds. AFM holds professional indemnity cover. AFM utilises Absa Bank Limited’s electronic and telephone banking platform. All requests fortransactions received on or before 16:00 every day will traded at ruling prices and valued after 16:00 on that day. Investments in funds with foreign securities mayinvolve various material risks, which include potential constraints on liquidity and the repatriation of funds, macroeconomic, political, foreign exchange, tax andsettlement risks and potential limitations on the availability of market information and there may be tax to be levied on certain of the benefits accruing to the investorfrom the funds and AFM may be required to deduct and pay over to the authorities any such tax from such benefits before paying any balance to or for the benefit ofthe investor. AFM has a right to close the fund to new investors in order to manage it more efficiently in accordance with its mandate. The investor understands thatthe legal and tax environment is continually changing, and that AFM cannot be held responsible for any changes to the law which might have an effect on theirinvestment, and which did not exist at the time their investment was made. Additional information on the fund including, but not limited to, brochures, applicationforms, annual and half-yearly reports are available free of charge from the AFM website or from AFM upon request. AFM is a registered Collective Investment SchemeManager and a full member of the Association for Savings and Investment SA. This document is a Minimum Disclosure Document (MDD) in terms of the Advertising,Marketing and Information Disclosure requirements for Collective Investment Schemes published by the Financial Services Board. MDD issue date: 15 November 2017
Contact details
Management Company
Absa Fund Managers LimitedReg no 1991/000881/06 Absa Sandton South Campus, 15 Alice Lane, Sandton, 2196 Private Bag X10056, Sandton, 2146 Contact Centre: 0860 111 456 Fax: 0860 212 123 Email: [email protected] Website: www.absa.co.za/wim
Trustees
Société Générale Johannesburg BranchPO Box 6872, Johannesburg, 2000
Asset Manager
Absa Asset ManagementAn authorised financial services provider, FSP No: 522 Telephone: +27 (0)11 243 4563 Website:www.absa.co.za/wim
Absa Managed Fund

Wealth and Investment Management
Absa Smart Alpha Defensive Fund Minimum disclosure documentMonth ended 31 October 2017
Fund detailsIndustry category SA - Multi Asset - Low EquityBenchmark STeFi Composite + 3% over a rolling 3 year periodFund launch date 09 January 2017Class A launch Date 09 January 2017Class D launch date 09 January 2017Fund Size R 57.08 MillionJSE code AAFCAFund Manager Chris Watts – B.Bus. Sci (Hons), CFA, FRM
St John Bunkell – MSc Chem.EngAsset Manager Absa Alternative Asset ManagementMinimum lump sum R 2000Minimum Monthly R 200
Income distributions - cents per unit (cpu)Class A Class D
the 6 months ended 31 Dec 2016 1.48 1.55the 6 months ended 30 Jun 2017 2.04 2.16
Income declaration 30 June & 31 DecemberIncome distributions 15 July & 15 January
Fees and Cost ratio (VAT incl.)Fees Class A Class DInitial Fees: Absa: 0% 0%
Adviser: 0-3.42% 0%Annual Fees: Management: 0.86% 0.63%
Adviser: 0-1.14% 0%Performance Fee: No No
Costs (annual, based on period shown) Class A Class DFor the period to 30-06-2017, from: 09-01-2017 09-01-2017Total expense ratio (TER): 1.64% 1.14%Transaction costs (TC): 0.25% 0.25%Total investment charges (TER+TC): 1.89% 1.39%Please refer to Disclosure section on next page for further information on Fees and Costs
PerformancePerformance cummulative total returns (%)Term Class A Benchmark Sector
AverageRank Class D
Launch 10.16 8.62 8.40 18/143 10.381 Month 2.83 0.86 2.18 17/151 2.853 month 5.12 2.59 3.87 6/151 5.186 Month 7.09 5.29 5.59 16/148 7.21
Sector Average & Rank: applies to the A Class.Please refer to Disclosures section on next page for further information on calculation methodologyand source of all performance data content (tables and/or charts) of this MDD
Fund objectivesThe Fund aims to provide investors with sustainable and stable capitalappreciation over the medium to long term
Fund strategyThe fund will invest in a spectrum of investments in the equity, bond, money orproperty markets as a Multi Asset portfolio. Maximum equity exposure on theportfolio will be 40%. The fund is a quasi-passive fund which invests in securitiespredominantly through indices while generating Alpha using quantitative assetallocation techniques. securities to be included will be assets in liquid form andequity securities acquired on exchanges (as legislation permits) and any otherinterest bearing instruments, listed and unlisted financial instruments andsecurities that the Act may form time ti time allow to be acquired at fair marketprice.
Fund features• Ideal vehicle for medium to long-term investments• Aims to provide consistent positive return above inflation• Offers diversification by providing exposure to multiple asset classes• Provides a source of income and offers potential for capital appreciation• Potential higher return and with more volatility than money market and
traditional income funds• Suitable for pre and post-retirement investments
Fund specific risksInterest rate: The value of fixed income investments (e.g. bonds) tends todecrease when interest rates and/or inflation rises. Multi-asset investment:TheFund is subject to possible financial losses in multiple markets and mayunderperform more focused funds. Property: Investments in real estate securitiescan carry the same risks as investing directly in real estate itself. Real estate pricesrise and fall in response to a variety of factors, including local, regional andnational economic and political conditions, interest rates and tax considerations.
Risk profile and advisable minimum termLow Low-Medium Medium Medium-High High
3 Months + 6 Months + 2 Years + 3 Years + 5 Years +
Risk statisticsClass A Since Inception (09 January 2017)Number of positive months 7/9No highest/lowest one year performance data disclosed due to the length of thetime the fund has been in existence.
Cumulative performance (since inception)
Absa Smart Alpha Defensive A Absa Smart Alpha Defensive D South African - Mutli Asset - Low Equity STeFi Composite + 3%
97
100
103
106
109
112
Jan-17
Mar-17
Jun-17
Oct-17
The chart reflects the value (monthly data points) of a R100 investment made on the 09January 2017
Absa Smart Alpha Defensive Fund

Wealth and Investment Management
Asset Allocation (%)
1,61%
3,92%
9,73%
14,21%
16,27%
24,05%
30,21%
Global Cash/ Money Market
SA Inflation Linked Bonds
SA Listed Property
SA Fixed Rate Bonds
SA Equity
Global Equities
SA Cash|Money Market
Top share holding (%)
SYGWD - MSCI World Index ETF 19.43%Absa Money Market Fund 19.00%Naspers 3.99%SYG-USA (SYGUS) 2.97%RSA 8.75% 280248 2.11%RSA 8.00% 310130 1.69%Absa USD Income Fund 1.61%Growthpoint Properties 1.58%RSA 7.00% 280231 1.57%RSA 8.50% 310137 1.49%
Quarterly fund commentary as at 30 September 2017The Fund Commentary is provided on a quarterly basis and can be found on www.absa.co.za/WIM under Unit Trusts Minimum Disclosure Documents. The latest quarterly commentaryavailable is for the quarter ending 30 September 2017.
DisclosuresCosts: Total Expense Ratio (“TER”) is expressed as an annualised percentage of the value of the Class of the portfolio that was incurred as expenses relating to the administration of theportfolio. A higher TER does not necessarily imply a poor return, nor does a lower TER imply a good return. The current TER cannot be regarded as an accurate indication of future TER's.Transaction Costs (“TC”) is expressed as an annualised percentage of the value of the portfolio that was incurred as costs relating to the buying and selling of the assets underlying theportfolio. TC are a necessary cost in administering the portfolio and impact returns. TC should not be considered in isolation as returns may be impacted by many other factors over timeincluding market returns, the type of portfolio, the investment decisions of the investment manager and the TER. Note that the total investment charges (TER+TC) have already been deductedprior to the calculation of the performance figures shown. Effective Annual Cost (“EAC”) is a measure that summarises the total cost that an investor incurs through their investment in aparticular financial product, based on the principles set out in the ASISA EAC standard. EAC data is available on request.
Performance: Performance is calculated for the portfolio⁄class of portfolios. Illustrative performance information is included for illustrative purposes only; individual investor performance maydiffer as a result of initial and ongoing fees, the actual investment date, the date of reinvestment and dividend withholding tax. All figures quoted are from Morningstar and⁄or IRESS, for theperiod ending 31/10/2017 (unless otherwise stated), calculated on a NAV to NAV basis, with income distributions reinvested on the ex-dividend date. Annualised figures refer to the averageyearly return of an investment over a given time period, all actual annual figures (if not shown) are available on request.
The Absa Smart Alpha Defensive Fund was formerly the Absa Smart Alpha Flexible fund. The name change and conversion to a feeder fund took effect from 07 January 2017. CollectiveInvestment Schemes (CIS) are generally medium to long-term investments. The value of participatory interests may go down as well as up and past performance is not necessarily a guideto future performance. Fluctuations or movements in exchange rates may cause the value of underlying international investments in a fund to move up or down. Forward pricing is used. CISare traded at ruling prices. Absa Fund Managers Limited (AFM) may borrow up to 10% (ten per cent) of the market value of a fund to accommodate insufficient liquidity. Securities in a fundmay be lent to borrowers. Income from the fund is distributed semi-annually and may only be paid out into an account as nominated by the investor. Prices are calculated on a net asset value(NAV) basis which is the total value of all assets in a fund including any income accrual and less permissible deductions from the fund. Prices are published daily and are available atwww.Absa.co.za/Absacoza/indices/Absa-unit-trusts and in daily newspapers, or from AFM upon request. Fees and charges associated with the most expensive class are available directlyfrom AFM for investment by members of the public, other than financial institutions. CIS are financial products and not investments in insurance policies with an insurer and therefore cooling-off periods do not apply. AFM does not provide any guarantee either with respect to the capital or the return of a fund. The directors and personnel of AFM may be invested in any of thefunds. AFM holds professional indemnity cover. AFM utilises Absa Bank Limited’s electronic and telephone banking platform. All requests for transactions received on or before 16:00 everyday will traded at ruling prices and valued after 16:00 on that day. Investments in funds with foreign securities may involve various material risks, which include potential constraints onliquidity and the repatriation of funds, macroeconomic, political, foreign exchange, tax and settlement risks and potential limitations on the availability of market information and there maybe tax to be levied on certain of the benefits accruing to the investor from the funds and AFM may be required to deduct and pay over to the authorities any such tax from such benefits beforepaying any balance to or for the benefit of the investor. AFM has a right to close the fund to new investors in order to manage it more efficiently in accordance with its mandate. The investorunderstands that the legal and tax environment is continually changing, and that AFM cannot be held responsible for any changes to the law which might have an effect on their investment,and which did not exist at the time their investment was made. Additional information on the fund including, but not limited to, brochures, application forms, annual and half-yearly reportsare available free of charge from the AFM website or from AFM upon request. AFM is a registered Collective Investment Scheme Manager and a full member of the Association for Savingsand Investment SA. This document is a Minimum Disclosure Document (MDD) in terms of the Advertising, Marketing and Information Disclosure Requirements for Collective InvestmentSchemes published by the Financial Services Board. MDD issue date: 15 November 2017
Contact detailsManagement Company
Absa Fund Managers LimitedReg no 1991/000881/06 Absa Sandton South Campus, 15 Alice Lane, Sandton, 2196 Private Bag X10056, Sandton, 2146 Contact Centre: 0860 111 456 Fax: 0860 212 123 Email: [email protected] Website: www.absa.co.za/wim
Trustees
Société Générale Johannesburg BranchPO Box 6872, Johannesburg, 2000
Asset Manager
Absa Alternative Asset ManagementAn authorised financial services provider, FSP No: 2877 Telephone: +27 (0)21 927 6404 Website:www.absa.co.za/wim
Absa Smart Alpha Defensive Fund
Wealth and Investment Management
Absa Smart Alpha Defensive Fund Fund Commentary30 September 2017
Commentary DocumentSA equities, represented by the FTSE/ JSE Top 40 Index (Top 40), rose 8.71% in the third quarter of this year, while SA bonds, represented by the South African AllBond Index, rose by 3.68% for the period. Global equities, represented by the MSCI World Index, rose 4.39%. The Rand weakened by 3.70% against the U.S. Dollarin the third quarter. SA listed property, represented by the FTSE/ JSE SA Listed Property Index, rose 3.48 in the third quarter of this year. The Fund by comparisonrose by 4.72%, in the third quarter. South Africa’s economy recovered in the second quarter of 2017. This is largely attributed to a re-bound in the agriculture sector due to the improved summer rainfalland a mild improvement in the mining sector. Low confidence amongst the private sector and consumers continues to result in low capital expenditure and tightfiscal policy has hamstrung public and SOE expenditure. Investors are uncertain as to the outcome of the December 2017 ANC leadership conference which sees two factions go head-to-head to elect their leadership. Eachfaction has very different views on what is needed for the economy which removes the prospect of policy certainty for the foreseeable future. The portfolios’ offshore allocation was 25.53% at the end of September 2017. The offshore allocation continues to benefit from a long term weakening in the Randand we continue to see potential for equities in developed markets to outperform.
DisclosuresThe Absa Smart Alpha Defensive Fund was formerly the Absa Smart Alpha Flexible fund. The name change and conversion to a feeder fund took effect from 07 January2017. Collective Investment Schemes (CIS) are generally medium to long-term investments. The value of participatory interests may go down as well as up and pastperformance is not necessarily a guide to future performance. Fluctuations or movements in exchange rates may cause the value of underlying international investmentsin a fund to move up or down. Forward pricing is used. CIS are traded at ruling prices. Absa Fund Managers Limited (AFM) may borrow up to 10% (ten per cent) ofthe market value of a fund to accommodate insufficient liquidity. Securities in a fund may be lent to borrowers. Income from the fund is distributed semi-annually andmay only be paid out into an account as nominated by the investor. Prices are calculated on a net asset value (NAV) basis which is the total value of all assets in a fundincluding any income accrual and less permissible deductions from the fund. Prices are published daily and are available at www.Absa.co.za/Absacoza/indices/Absa-unit-trusts and in daily newspapers, or from AFM upon request. Fees and charges associated with the most expensive class are available directly from AFM forinvestment by members of the public, other than financial institutions. CIS are financial products and not investments in insurance policies with an insurer and thereforecooling-off periods do not apply. AFM does not provide any guarantee either with respect to the capital or the return of a fund. The directors and personnel of AFMmay be invested in any of the funds. AFM holds professional indemnity cover. AFM utilises Absa Bank Limited’s electronic and telephone banking platform. All requestsfor transactions received on or before 16:00 every day will traded at ruling prices and valued after 16:00 on that day. Investments in funds with foreign securities mayinvolve various material risks, which include potential constraints on liquidity and the repatriation of funds, macroeconomic, political, foreign exchange, tax andsettlement risks and potential limitations on the availability of market information and there may be tax to be levied on certain of the benefits accruing to the investorfrom the funds and AFM may be required to deduct and pay over to the authorities any such tax from such benefits before paying any balance to or for the benefit ofthe investor. AFM has a right to close the fund to new investors in order to manage it more efficiently in accordance with its mandate. The investor understands thatthe legal and tax environment is continually changing, and that AFM cannot be held responsible for any changes to the law which might have an effect on theirinvestment, and which did not exist at the time their investment was made. Additional information on the fund including, but not limited to, brochures, applicationforms, annual and half-yearly reports are available free of charge from the AFM website or from AFM upon request. AFM is a registered Collective Investment SchemeManager and a full member of the Association for Savings and Investment SA. This document is a Minimum Disclosure Document (MDD) in terms of the Advertising,Marketing and Information Disclosure Requirements for Collective Investment Schemes published by the Financial Services Board. MDD issue date: 15 November 2017
Contact details
Management Company
Absa Fund Managers LimitedReg no 1991/000881/06 Absa Sandton South Campus, 15 Alice Lane, Sandton, 2196 Private Bag X10056, Sandton, 2146 Contact Centre: 0860 111 456 Fax: 0860 212 123 Email: [email protected] Website: www.absa.co.za/wim
Trustees
Société Générale Johannesburg BranchPO Box 6872, Johannesburg, 2000
Asset Manager
Absa Alternative Asset ManagementAn authorised financial services provider, FSP No: 2877 Telephone: +27 (0)21 927 6404 Website:www.absa.co.za/wim
Absa Smart Alpha Defensive Fund

Wealth and Investment Management
Absa Property Equity Fund Minimum disclosure documentMonth ended 31 October 2017
Fund detailsIndustry category SA - Real Estate - GeneralBenchmark FTSE/JSE SA Listed Property IndexFund launch date 14 August 2006Class A launch Date 14 August 2006Class C1 launch date 04 October 2013Fund Size R 4.03 BillionJSE code ABPEFund Manager Fayyaz Mottiar – B.Econ.Sc, CFAAsset Manager Absa Asset Management (Pty) LtdMinimum lump sum R 2000Minimum Monthly R 200
Income distributions - cents per unit (cpu)Class A Class C1
the 3 months ended 31 Dec 2016 3.97 4.44the 3 months ended 31 Mar 2017 4.08 4.57the 3 months ended 30 Jun 2017 3.42 3.97the 3 months ended 30 Sep 2017 3.18 3.75
Income declaration 31 Mar, 30 Jun, 30 Sep & 31 DecIncome distributions 15 Apr, 15 Jul, 15 Oct & 15 Jan
Fees and Cost ratio (VAT incl.)Fees Class A Class C1Initial Fees: Absa: 0% 0%
Adviser: 0-3.42% 0%Annual Fees: Management: 1.71% 1.14%
Adviser: 0-1.14%Performance Fee: No No
Costs (annual, based on period shown) Class A Class C1For the period to 30-06-2017, from: 01/07/2014 01/07/2014Total expense ratio (TER): 1.73% 1.16%Transaction costs (TC): 0.53% 0.53%Total investment charges (TER+TC): 2.26% 1.69%Please refer to Disclosure section on next page for further information on Fees and Costs
PerformancePerformance: annualised total returns (%)Term Class A Benchmark Sector
AverageRank Class C1
Launch 19.88 17.28 15.40 1/13 25.401 Year 22.26 11.13 10.62 2/39 22.973 Year 22.48 10.92 10.34 1/29 23.175 Year 22.81 14.06 13.25 1/22 -10 Year 16.89 13.62 12.20 1/16 -
Performance Yearly returns (%)1 yr ending: Oct'17 Oct'16 Oct'15 Oct'14 Oct'13 Oct'12 Oct'11 Oct'10Class A 22.26 8.57 38.41 29.19 17.69 26.67 10.50 24.59Benchmark 11.13 2.16 20.21 19.38 18.47 28.30 9.56 29.90Class C1 22.97 9.18 39.18 29.90 - - - -Sector Average & Rank: applies to the A Class.Please refer to Disclosures section on next page for further information on calculation methodologyand source of all performance data content (tables and/or charts) of this MDD
Fund objectivesThe fund aims to provide investors with income and growth over the medium tolonger term at medium to high risk, predominantly obtained in the South Africanlisted property market
Fund strategyThe majority of its assets will be invested in South African investment markets atall times and will predominantly be invested in securities of a property equitynature traded on South African exchanges, participatory interests that deriveincome and growth of a property nature, as well as non- equity securities
Fund features• A specialist fund, ideal for medium to long-term investments• Diversification from general equity shares• Aims to provide capital growth over the medium to long term• Higher risk than the traditional fixed-interest or income fund• Suitable for investors who seek exposure to the JSE-listed property sector
Fund specific risksLiquidity: There may be insufficient buyers or sellers of particular investmentsgiving rise to delays in trading and being able to make settlements from the Fundand/or large fluctuations in the value of the Fund which may lead to largerfinancial losses than anticipated. Property: Investments in real estate securitiescan carry the same risks as investing directly in real estate itself. Real estate pricesrise and fall in response to a variety of factors, including local, regional andnational economic and political conditions, interest rates and tax considerations.
Risk profile and advisable minimum termLow Low-Medium Medium Medium-High High
3 Months + 6 Months + 2 Years + 3 Years + 5 Years +
Risk statisticsClass A Since Inception (14 August 2006)Number of positive months 94/134Highest 1 Year Performance 28/02/2015 67.92%Lowest 1 Year Performance 30/06/2008 -22.51%
Cumulative performance (5 years)
Absa Property Equity A FTSE/JSE Listed Property Index
100
140
180
220
260
300
Oct-12
Dec-12
Mar-13
Jun-13
Sep-13
Dec-13
Mar-14
Jun-14
Sep-14
Dec-14
Mar-15
Jun-15
Sep-15
Dec-15
Mar-16
Jun-16
Sep-16
Dec-16
Mar-17
Jun-17
Oct-17
The chart reflects the value (monthly data points) of a R100 investment made on the01/11/2012
Absa Property Equity Fund

Wealth and Investment Management
Asset Allocation (%)
9,60%
90,40%
Money market
Property
Top share holding (%)
Arrowhead Properties Lim AEquites Property FundFortressbGreenbay Prop LtdHypropInvestec PropertyMas Real Estate Inc / OrdNEPI Rockcastle PLCResilientVukile
Quarterly fund commentary as at 30 September 2017The Fund Commentary is provided on a quarterly basis and can be found on www.absa.co.za/WIM under Unit Trusts Minimum Disclosure Documents. The latest quarterly commentaryavailable is for the quarter ending 30 September 2017.
DisclosuresFees: Class A Adviser annual fee is not included in the annual management fee, it is charged by a way of unit reduction.
Costs: Total Expense Ratio (“TER”) is expressed as an annualised percentage of the value of the Class of the portfolio that was incurred as expenses relating to the administration of theportfolio. A higher TER does not necessarily imply a poor return, nor does a lower TER imply a good return. The current TER cannot be regarded as an accurate indication of future TER's.Transaction Costs (“TC”) is expressed as an annualised percentage of the value of the portfolio that was incurred as costs relating to the buying and selling of the assets underlying theportfolio. TC are a necessary cost in administering the portfolio and impact returns. TC should not be considered in isolation as returns may be impacted by many other factors over timeincluding market returns, the type of portfolio, the investment decisions of the investment manager and the TER. Note that the total investment charges (TER+TC) have already been deductedprior to the calculation of the performance figures shown. Effective Annual Cost (“EAC”) is a measure that summarises the total cost that an investor incurs through their investment in aparticular financial product, based on the principles set out in the ASISA EAC standard. EAC data is available on request.
Performance: Performance is calculated for the portfolio⁄class of portfolios. Illustrative performance information is included for illustrative purposes only; individual investor performance maydiffer as a result of initial and ongoing fees, the actual investment date, the date of reinvestment and dividend withholding tax. All figures quoted are from Morningstar and⁄or IRESS, for theperiod ending 31/10/2017 (unless otherwise stated), calculated on a NAV to NAV basis, with income distributions reinvested on the ex-dividend date. Annualised figures refer to the averageyearly return of an investment over a given time period, all actual annual figures (if not shown) are available on request.
Collective Investment Schemes (CIS) are generally medium to long-term investments. The value of participatory interests may go down as well as up and past performance is not necessarilya guide to future performance. Fluctuations or movements in exchange rates may cause the value of underlying international investments in a fund to move up or down. Forward pricing isused. CIS are traded at ruling prices. Absa Fund Managers Limited (AFM) may borrow up to 10% (ten per cent) of the market value of a fund to accommodate insufficient liquidity. Securitiesin a fund may be lent to borrowers. Income from the fund is distributed quarterly and may only be paid out into an account as nominated by the investor. Prices are calculated on a net assetvalue (NAV) basis which is the total value of all assets in a fund including any income accrual and less permissible deductions from the fund. Prices are published daily and are available atwww.Absa.co.za/Absacoza/indices/Absa-unit-trusts and in daily newspapers, or from AFM upon request. Fees and charges associated with the most expensive class are available directlyfrom AFM for investment by members of the public, other than financial institutions. CIS are financial products and not investments in insurance policies with an insurer and therefore cooling-off periods do not apply. AFM does not provide any guarantee either with respect to the capital or the return of a fund. The directors and personnel of AFM may be invested in any of thefunds. AFM holds professional indemnity cover. AFM utilises Absa Bank Limited’s electronic and telephone banking platform. All requests for transactions received on or before 16:00 everyday will traded at ruling prices and valued after 16:00 on that day. Investments in funds with foreign securities may involve various material risks, which include potential constraints onliquidity and the repatriation of funds, macroeconomic, political, foreign exchange, tax and settlement risks and potential limitations on the availability of market information and there maybe tax to be levied on certain of the benefits accruing to the investor from the funds and AFM may be required to deduct and pay over to the authorities any such tax from such benefits beforepaying any balance to or for the benefit of the investor. AFM has a right to close the fund to new investors in order to manage it more efficiently in accordance with its mandate. The investorunderstands that the legal and tax environment is continually changing, and that AFM cannot be held responsible for any changes to the law which might have an effect on their investment,and which did not exist at the time their investment was made. Additional information on the fund including, but not limited to, brochures, application forms, annual and half-yearly reportsare available free of charge from the AFM website or from AFM upon request. AFM is a registered Collective Investment Scheme Manager and a full member of the Association for Savingsand Investment SA. This document is a Minimum Disclosure Document (MDD) in terms of the Advertising, Marketing and Information Disclosure requirements for Collective InvestmentSchemes published by the Financial Services Board. MDD issue date: 15 November 2017
Contact detailsManagement Company
Absa Fund Managers LimitedReg no 1991/000881/06 Absa Sandton South Campus, 15 Alice Lane, Sandton, 2196 Private Bag X10056, Sandton, 2146 Contact Centre: 0860 111 456 Fax: 0860 212 123 Email: [email protected] Website: www.absa.co.za/wim
Trustees
Société Générale Johannesburg BranchPO Box 6872, Johannesburg, 2000
Asset Manager
Absa Asset ManagementAn authorised financial services provider, FSP No: 522 Telephone: +27 (0)11 243 4563 Website:www.absa.co.za/wim
Absa Property Equity Fund

Wealth and Investment Management
Absa Property Equity Fund Fund Commentary30 September 2017
Commentary DocumentThe fund delivered a total return of 10.15% for the third quarter of 2017. This equates to an outperformance of 4.42% above the listed property index for the quarter.On a year to date basis, the fund has generated 18.16% total return, outperforming both the median manager and the index by over 10%. In terms of relative asset class performance, the SA Listed Property sector delivered positive growth in the third quarter of 2017 with a 5.7% total return performance,underperforming Equities (8.9%) but outperforming Bonds (3.7%) and Cash (1.8%). However, over the longer period, listed property has continued to be one ofthe best performing asset classes, returning 13.9% p.a. over the last 10 years, beating the returns on Equities (9.5%), Bonds (8.4%) and Cash (7.2%). As at the end of the third quarter of 2017, the listed property sector traded on a historical yield of 6.75% and a projected forward yield of 7.35%. The sector is expectedto deliver between 8% and 9% distribution growth over the next twelve months. This growth outlook against a subdued economic backdrop, political instability andmarket uncertainty results in the SA listed property sector remaining as an attractive investment choice.
DisclosuresCollective Investment Schemes (CIS) are generally medium to long-term investments. The value of participatory interests may go down as well as up and pastperformance is not necessarily a guide to future performance. Fluctuations or movements in exchange rates may cause the value of underlying international investmentsin a fund to move up or down. Forward pricing is used. CIS are traded at ruling prices. Absa Fund Managers Limited (AFM) may borrow up to 10% (ten per cent) ofthe market value of a fund to accommodate insufficient liquidity. Securities in a fund may be lent to borrowers. Income from the fund is distributed quarterly and mayonly be paid out into an account as nominated by the investor. Prices are calculated on a net asset value (NAV) basis which is the total value of all assets in a fundincluding any income accrual and less permissible deductions from the fund. Prices are published daily and are available at www.Absa.co.za/Absacoza/indices/Absa-unit-trusts and in daily newspapers, or from AFM upon request. Fees and charges associated with the most expensive class are available directly from AFM forinvestment by members of the public, other than financial institutions. CIS are financial products and not investments in insurance policies with an insurer and thereforecooling-off periods do not apply. AFM does not provide any guarantee either with respect to the capital or the return of a fund. The directors and personnel of AFMmay be invested in any of the funds. AFM holds professional indemnity cover. AFM utilises Absa Bank Limited’s electronic and telephone banking platform. All requestsfor transactions received on or before 16:00 every day will traded at ruling prices and valued after 16:00 on that day. Investments in funds with foreign securities mayinvolve various material risks, which include potential constraints on liquidity and the repatriation of funds, macroeconomic, political, foreign exchange, tax andsettlement risks and potential limitations on the availability of market information and there may be tax to be levied on certain of the benefits accruing to the investorfrom the funds and AFM may be required to deduct and pay over to the authorities any such tax from such benefits before paying any balance to or for the benefit ofthe investor. AFM has a right to close the fund to new investors in order to manage it more efficiently in accordance with its mandate. The investor understands thatthe legal and tax environment is continually changing, and that AFM cannot be held responsible for any changes to the law which might have an effect on theirinvestment, and which did not exist at the time their investment was made. Additional information on the fund including, but not limited to, brochures, applicationforms, annual and half-yearly reports are available free of charge from the AFM website or from AFM upon request. AFM is a registered Collective Investment SchemeManager and a full member of the Association for Savings and Investment SA. This document is a Minimum Disclosure Document (MDD) in terms of the Advertising,Marketing and Information Disclosure requirements for Collective Investment Schemes published by the Financial Services Board. MDD issue date: 15 November 2017
Contact details
Management Company
Absa Fund Managers LimitedReg no 1991/000881/06 Absa Sandton South Campus, 15 Alice Lane, Sandton, 2196 Private Bag X10056, Sandton, 2146 Contact Centre: 0860 111 456 Fax: 0860 212 123 Email: [email protected] Website: www.absa.co.za/wim
Trustees
Société Générale Johannesburg BranchPO Box 6872, Johannesburg, 2000
Asset Manager
Absa Asset ManagementAn authorised financial services provider, FSP No: 522 Telephone: +27 (0)11 243 4563 Website:www.absa.co.za/wim
Absa Property Equity Fund

Wealth and Investment Management
Absa Smart Alpha Property Fund Minimum disclosure documentMonth ended 31 October 2017
Fund detailsIndustry category SA - Real Estate - GeneralBenchmark FTSE/JSE SA Listed Property IndexFund launch date 23 June 2015Class A launch Date 23 June 2015Class D launch date 23 June 2015Fund Size R 71.35 MillionJSE code ASPCAFund Manager St John Bunkell – MSc Chem.EngAsset Manager Absa Alternative Asset ManagementMinimum lump sum R 2000Minimum Monthly R 200
Income distributions - cents per unit (cpu)Class A Class D
the 6 months ended 31 Dec 2016 2.27 2.42the 6 months ended 30 Jun 2017 2.60 2.73
Income declaration 30 June & 31 DecemberIncome distributions 15 July & 15 January
Fees and Cost ratio (VAT incl.)Fees Class A Class DInitial Fees: Absa: 0% 0%
Adviser: 0-3.42% 0%Annual Fees: Management: 0.86% 0.63%
Adviser: 0-1.14% 0%Performance Fee: No No
Costs (annual, based on period shown) Class A Class DFor the period to 30-06-2017, from: 22-06-2015 22-06-2015Total expense ratio (TER): 1.72% 1.28%Transaction costs (TC): 0.09% 0.09%Total investment charges (TER+TC): 1.81% 1.37%Please refer to Disclosure section on next page for further information on Fees and Costs
PerformancePerformance: cumulative total returns (%)Term Class A Benchmark Sector
AverageRank Class D
Launch 19.17 25.06 21.29 24/33 19.953 month 5.32 3.99 3.60 5/43 5.386 Month 9.22 8.27 7.15 8/41 9.359 Month 8.67 8.53 7.88 18/39 8.881 Year 11.33 11.13 10.62 17/39 11.60
Sector Average & Rank: applies to the A Class.Please refer to the Disclosure section on the next page for further information on calculation methodology and source ofall performance data content (tables and/or charts) of this MDD.
Fund objectivesThe Absa Smart Alpha Property Fund aims to provide sustainable capitalappreciation over the long term. The Fund will invest directly in the individualsecurities in the constituents of the FTSE/JSE Africa SA Property Yield Index
Fund strategyThis fund is a quasi-passive fund which invests in securities predominantlythrough indices whilst generating Alpha using quantitative asset allocationtechniques. Securities to be included in the Absa Smart Alpha Property Fund willconsist of non-equity securities, financial instruments only in the form ofwarrants, property equity and property-related securities listed on exchanges,securities listed in the Real Estate Sector on South African exchanges and propertyshares, property loan stock and participatory interests in Collective InvestmentSchemes in Property listed on South African exchanges as well as cash and cashequivalent securities, listed and unlisted financial instruments to the extentallowed by the Act.
Fund features• A specialist fund, ideal for medium to long-term investments• Diversification from general equity shares• Aims to provide capital growth over the medium to long term• Higher risk than the traditional fixed-interest or income fund• Suitable for investors who seek exposure to the JSE-listed property sector
Fund specific risksLiquidity: There may be insufficient buyers or sellers of particular investmentsgiving rise to delays in trading and being able to make settlements from the Fundand/or large fluctuations in the value of the Fund which may lead to largerfinancial losses than anticipated. Property: Investments in real estate securitiescan carry the same risks as investing directly in real estate itself. Real estate pricesrise and fall in response to a variety of factors, including local, regional andnational economic and political conditions, interest rates and tax considerations.
Risk profile and advisable minimum termLow Low-Medium Medium Medium-High High
3 Months + 6 Months + 2 Years + 3 Years + 5 Years +
Risk statisticsClass A Since Inception (23 June 2015)Number of positive months 17/28Highest 1 Year Performance 31/10/2017 11.33%Lowest 1 Year Performance 30/11/2016 -4.96%
Cumulative performance (since inception)
Absa Smart Alpha Property A Absa Smart Alpha Property D FTSE/JSE SA Listed Property (J253T)
90
100
110
120
130
140
Jun-15
Dec-15
Jun-16
Dec-16
Jun-17
Oct-17
The chart reflects the value (monthly data points) of a R100 investment made on the 23June 2015
Absa Smart Alpha Property Fund

Wealth and Investment Management
Asset Allocation (%)
3,13%
32,08%
64,79%
Cash & Money Market
Real Estate Inv & Securities
Real EstateInvestment Trusts
Top share holding (%)
NEPIROCK (NRP) 18.40%Growpnt 14.28%Resilient 12.55%Fortressb 10.55%Hyprop 9.13%Redefine Properties 7.30%MAS (MSP) 5.81%ATTACQ Limited 2.86%STANDARD BANK CALL 2.12%Greenbay Prop Ltd 2.03%
Quarterly fund commentary as at 30 September 2017The Fund Commentary is provided on a quarterly basis and can be found on www.absa.co.za/WIM under Unit Trusts Minimum Disclosure Documents. The latest quarterly commentaryavailable is for the quarter ending 30 September 2017.
DisclosuresFees: Class A Adviser annual fee is not included in the annual management fee, it is charged by a way of unit reduction.
Costs: Total Expense Ratio (“TER”) is expressed as an annualised percentage of the value of the Class of the portfolio that was incurred as expenses relating to the administration of theportfolio. A higher TER does not necessarily imply a poor return, nor does a lower TER imply a good return. The current TER cannot be regarded as an accurate indication of future TER's.Transaction Costs (“TC”) is expressed as an annualised percentage of the value of the portfolio that was incurred as costs relating to the buying and selling of the assets underlying theportfolio. TC are a necessary cost in administering the portfolio and impact returns. TC should not be considered in isolation as returns may be impacted by many other factors over timeincluding market returns, the type of portfolio, the investment decisions of the investment manager and the TER. Note that the total investment charges (TER+TC) have already been deductedprior to the calculation of the performance figures shown. Effective Annual Cost (“EAC”) is a measure that summarises the total cost that an investor incurs through their investment in aparticular financial product, based on the principles set out in the ASISA EAC standard. EAC data is available on request.
Performance: Performance is calculated for the portfolio⁄class of portfolios. Illustrative performance information is included for illustrative purposes only; individual investor performance maydiffer as a result of initial and ongoing fees, the actual investment date, the date of reinvestment and dividend withholding tax. All figures quoted are from Morningstar and⁄or IRESS, for theperiod ending 31/10/2017 (unless otherwise stated), calculated on a NAV to NAV basis, with income distributions reinvested on the ex-dividend date. Annualised figures refer to the averageyearly return of an investment over a given time period, all actual annual figures (if not shown) are available on request.
Collective Investment Schemes (CIS) are generally medium to long-term investments. The value of participatory interests may go down as well as up and past performance is not necessarilya guide to future performance. Fluctuations or movements in exchange rates may cause the value of underlying international investments In a fund to move up or down. Forward pricing isused. CIS are traded at ruling prices. Absa Fund Managers Limited (AFM) may borrow up to 10% (ten per cent) of the market value of a fund to accommodate insufficient liquidity. Securitiesin a fund may be lent to borrowers. Income from the fund is distributed semi-annually and may only be paid out into an account as nominated by the investor. Prices are calculated on a netasset value (NAV) basis which is the total value of all assets in a fund Including any income accrual and less permissible deductions from the fund. Prices are published daily and are availableat www.absa.co.za⁄Absacoza⁄Indices⁄AbsaUnit-Trusts and in daily newspapers, or from AFM upon request. Fees and charges associated with the most expensive class are available directlyfrom AFM for Investment by members of the public, other than financial institutions. CIS are financial products and not investments in insurance policies with an insurer and therefore cooling-off periods do not apply. AFM does not provide any guarantee either with respect to the capital or the return of a fund. The directors and personnel of AFM may be invested in any of thefunds. AFM holds professional indemnity cover. AFM utilises Absa Bank Limited’s electronic and telephone banking platform. All requests for transactions received on or before 16:00 everyday will traded at ruling prices and valued after 16:00 on that day. Investments in funds with foreign securities may Involve various material risks, which include potential constraints onliquidity and the repatriation of funds, macroeconomic, political, foreign exchange, tax and settlement risks and potential limitations on the availability of market information and there maybe tax to be levied on certain of the benefits accruing to the investor From the funds and AFM may be required to deduct and pay over to the authorities any such tax from such benefitsbefore paying any balance to or for the benefit of the Investor. AFM has a right to close the fund to new investors in order to manage it more efficiently in accordance with its mandate. Theinvestor understands that the legal and tax environment is continually changing, and that AFM cannot be held responsible for any changes to the law which might have an effect on theirinvestment, And which did not exist at the time their investment was made. Additional information on the fund including, but not limited to, brochures, application forms, annual and Half-yearly reports are available free of charge from the AFM website or from AFM upon request. AFM is a registered Collective Investment Scheme Manager and a full member of the Associationfor Savings and Investment SA. This document is a Minimum Disclosure Document (MDD) in terms of the Advertising, Marketing and Information Disclosure requirements for CollectiveInvestment Schemes published by the Financial Services Board. MDD issue date: 15 November 2017
Contact detailsManagement Company
Absa Fund Managers LimitedReg no 1991/000881/06 Absa Sandton South Campus, 15 Alice Lane, Sandton, 2196 Private Bag X10056, Sandton, 2146 Contact Centre: 0860 111 456 Fax: 0860 212 123 Email: [email protected] Website: www.absa.co.za/wim
Trustees
Société Générale Johannesburg BranchPO Box 6872, Johannesburg, 2000
Asset Manager
Absa Alternative Asset ManagementAn authorised financial services provider, FSP No:22877 Telephone: +27 (0)21 927 6404 Website: www.absa.co.za/wim
Absa Smart Alpha Property Fund

Wealth and Investment Management
Absa Smart Alpha Property Fund Fund Commentary30 September 2017
Commentary Document
SA property, represented by the FTSE/JSE JSAPYTR Index, rose by 5.73%. SA equities, represented by the FTSE/ JSE Top 40 Index (Top 40), rose 8.71% in the thirdquarter of this year, while SA bonds, represented by the South African All Bond Index, rose by 3.68% for the period. Global equities, represented by the MSCI WorldIndex, rose 4.39%. The Rand weakened by 3.70% against the U.S. Dollar in the third quarter. The Fund by comparison rose by 6.48%, in the third quarter net of allcosts and fees. South Africa’s economy recovered in the second quarter of 2017. This is largely attributed to a re-bound in the agriculture sector due to the improved summer rainfalland a mild improvement in the mining sector production. Low confidence amongst the private sector and consumers continues to result in low capital expenditureand tight fiscal policy has hamstrung public and SOE expenditure. Investors are uncertain as to the outcome of the December 2017 ANC leadership conference which sees two factions go head-to-head to elect their leadership. Eachfaction has very different views on what is needed for the economy which removes the prospect of policy certainty for the foreseeable future. The Smart Alpha Property portfolio allocates to several factors that tend to drive listed property market returns, such as business cyclicality across various sectors(industrial, retail and office), vacancy rates and relative earning yield analysis (earnings and dividend differentials) . AAM has a number of over and under-weightpositions relative to the index so as to attempt to generate alpha. Several of these over-weights delivered well: Mas Real Estate Inc, with an overweight of 3.64%relative to index delivered a return of 22.60% for the quarter and Fortress Income Fund Ltd, with an overweight of 3.08% relative to index delivered a return of 11.67%for the quarter. The portfolio is well positioned to take advantage of potential excess return drivers into the fourth quarter.
DisclosuresCollective Investment Schemes (CIS) are generally medium to long-term investments. The value of participatory interests may go down as well as up and pastperformance is not necessarily a guide to future performance. Fluctuations or movements in exchange rates may cause the value of underlying international investmentsIn a fund to move up or down. Forward pricing is used. CIS are traded at ruling prices. Absa Fund Managers Limited (AFM) may borrow up to 10% (ten per cent) ofthe market value of a fund to accommodate insufficient liquidity. Securities in a fund may be lent to borrowers. Income from the fund is distributed semi-annually andmay only be paid out into an account as nominated by the investor. Prices are calculated on a net asset value (NAV) basis which is the total value of all assets in a fundIncluding any income accrual and less permissible deductions from the fund. Prices are published daily and are available at www.absa.co.za⁄Absacoza⁄Indices⁄AbsaUnit-Trusts and in daily newspapers, or from AFM upon request. Fees and charges associated with the most expensive class are available directly from AFM for Investmentby members of the public, other than financial institutions. CIS are financial products and not investments in insurance policies with an insurer and therefore cooling-off periods do not apply. AFM does not provide any guarantee either with respect to the capital or the return of a fund. The directors and personnel of AFM may beinvested in any of the funds. AFM holds professional indemnity cover. AFM utilises Absa Bank Limited’s electronic and telephone banking platform. All requests fortransactions received on or before 16:00 every day will traded at ruling prices and valued after 16:00 on that day. Investments in funds with foreign securities mayInvolve various material risks, which include potential constraints on liquidity and the repatriation of funds, macroeconomic, political, foreign exchange, tax andsettlement risks and potential limitations on the availability of market information and there may be tax to be levied on certain of the benefits accruing to the investorFrom the funds and AFM may be required to deduct and pay over to the authorities any such tax from such benefits before paying any balance to or for the benefit ofthe Investor. AFM has a right to close the fund to new investors in order to manage it more efficiently in accordance with its mandate. The investor understands thatthe legal and tax environment is continually changing, and that AFM cannot be held responsible for any changes to the law which might have an effect on theirinvestment, And which did not exist at the time their investment was made. Additional information on the fund including, but not limited to, brochures, applicationforms, annual and Half-yearly reports are available free of charge from the AFM website or from AFM upon request. AFM is a registered Collective Investment SchemeManager and a full member of the Association for Savings and Investment SA. This document is a Minimum Disclosure Document (MDD) in terms of the Advertising,Marketing and Information Disclosure requirements for Collective Investment Schemes published by the Financial Services Board. MDD issue date: 15 November 2017
Contact details
Management Company
Absa Fund Managers LimitedReg no 1991/000881/06 Absa Sandton South Campus, 15 Alice Lane, Sandton, 2196 Private Bag X10056, Sandton, 2146 Contact Centre: 0860 111 456 Fax: 0860 212 123 Email: [email protected] Website: www.absa.co.za/wim
Trustees
Société Générale Johannesburg BranchPO Box 6872, Johannesburg, 2000
Asset Manager
Absa Alternative Asset ManagementAn authorised financial services provider, FSP No:22877 Telephone: +27 (0)21 927 6404 Website: www.absa.co.za/wim
Absa Smart Alpha Property Fund

Wealth and Investment Management
Absa SA Core Equity Fund Minimum disclosure documentMonth ended 31 October 2017
Fund detailsIndustry category SA - Equity - GeneralBenchmark FTSE/JSE Shareholder Weighted Index (SWIX)Fund launch date 25 January 2016Class A launch Date 25 January 2016Fund Size R 45.49 MillionJSE code ASCFAFund Manager Stephen Arthur – B.Sc. Eng Mining, CFA
Cornette van Zyl – BCom Acc (Hons), CA (SA),CFAAsset Manager Absa Asset Management (Pty) LtdMinimum lump sum R 2000Minimum Monthly R 200
Income distributions - cents per unit (cpu)Class A
the 6 months ended 31 Dec 2016 0.82the 6 months ended 30 Jun 2017 1.31
Income declaration 30 June & 31 DecemberIncome distributions 15 July & 15 January
Fees and Cost ratio (VAT incl.)Fees Class AInitial Fees: Absa: 0%
Adviser: 0-3.42%Annual Fees: Management: 0.86%
Adviser: 0-1.14%Performance Fee: No
Costs (annual, based on period shown) Class AFor the period to 30-06-2017, from: 27-01-2016Total expense ratio (TER): 1.76%Transaction costs (TC): 0.59%Total investment charges (TER+TC): 2.35%Please refer to Disclosure section on next page for further information on Fees and Costs
PerformancePerformance cummulative total returns (%)Term Class A Benchmark Sector Average RankLaunch 25.22 30.67 22.60 51/1463 month 6.77 7.20 6.19 79/1846 Month 8.05 9.56 6.86 68/1741 Year 16.64 17.27 13.04 41/167
Sector Average & Rank: applies to the A Class.Please refer to Disclosures section on next page for further information on calculation methodologyand source of all performance data content (tables and/or charts) of this MDD
Cumulative performance (since inception)
Absa SA Core Equity A FTSE/JSE Shareholder Weighted Index (SWIX)
100
110
120
130
140
150
Jan-16
Jun-16
Dec-16
Jun-17
Oct-17
The chart reflects the value (monthly data points) of a R100 investment made on the 25 January 2016
Fund objectivesThe Absa SA Core Equity Fund aims to provide investors with competitive andsustainable risk adjusted returns over the medium to long term by investing inlisted equities.
Fund strategyThe fund is actively managed and will mainly invest in JSE-listed equities. Theinvestment team applies a bottom up, stock picking based approach, predicatedon strong conviction ideas and attractive relative valuations. The portfolioconstruction will be based on the majority of the top 100 shares listed on the JSE.The portfolio managers give consideration to other factors such as marketcapitalisation and liquidity when constructing the portfolio. Exposure to shareswill exceed 75% of the fund at any point in time and the fund may include assetsin liquid form as well as listed and unlisted financial instruments. Securities to beincluded will be predominantly JSE acquired shares, assets in liquid form, listedand unlisted financial instruments, all to be acquired at fair market prices. Thefund will have no offshore exposure.
Fund features• Suitable for investors seeking long term capital growth by investing in a
portfolio of actively managed listed equities.
• Managed using a consistent and proven investment process implementedby a team of experienced investment professionals.
• A fund which represents the ABAM research team’s best investment ideas,offering investors the benefit of our combined experience and effort.
Fund specific risksConcentration: Investments may be primarily concentrated in specific areas (e.g.countries/geographical regions and/or industry sectors), in terms of investmentstyle (e.g. income or growth), in individual holdings and/or in a number of otherways. This may mean the value of the Fund may decrease whilst more broadlyinvested funds might grow. Equity investment: The value of equities (e.g. shares)and equity-related investments may vary according to company profits andfuture prospects as well as more general market factors. In the event of a companydefault (e.g. bankruptcy), the owners of their equity rank last in terms of anyfinancial payment from that company. Liquidity: There may be insufficient buyersor sellers of particular investments giving rise to delays in trading and being ableto make settlements from the Fund and/or large fluctuations in the value of theFund which may lead to larger financial losses than anticipated.
Risk profile and advisable minimum termLow Low-Medium Medium Medium-High High
3 Months + 6 Months + 2 Years + 3 Years + 5 Years +
Risk statisticsClass A Since Inception (25 January 2016)Number of positive months 11/21No highest/lowest one year performance data disclosed due to the length of thetime the fund has been in existence.
Absa SA Core Equity Fund

Wealth and Investment Management
Sector Allocation (%)
1,53%
2,61%
4,65%
5,20%
6,91%
10,38%
16,13%
24,38%
28,21%
Technology
Health Care
Oil & Gas
Telecommunications
Industrials
Basic Materials
Consumer Goods
Financials
Consumer Services
Top share holding (%)
Naspers 18.34%British American Tobacco 5.91%Sasol 4.65%MTN Group 4.32%Firstrand 3.87%Steinhoff 3.78%Investec Plc / Ord 3.45%Sanlam / Ord 3.31%Standard Bank 3.19%Anglo 2.70%
Asset Allocation (%)
Equity 99.00%Money market 1.00%
Quarterly fund commentary as at 30 September 2017The Fund Commentary is provided on a quarterly basis and can be found on www.absa.co.za/WIM under Unit Trusts Minimum Disclosure Documents. The latest quarterly commentaryavailable is for the quarter ending 30 September 2017.
DisclosuresFees: Class A Annual management fee reduction, from 1% (plus VAT) to 0.75% (plus VAT), with effect from 10th June 2016. Adviser annual fee is not included in the annual managementfee, it is charged by a way of unit reduction.
Costs: Total Expense Ratio (“TER”) is expressed as an annualised percentage of the value of the Class of the portfolio that was incurred as expenses relating to the administration of theportfolio. A higher TER does not necessarily imply a poor return, nor does a lower TER imply a good return. The current TER cannot be regarded as an accurate indication of future TER's.Transaction Costs (“TC”) is expressed as an annualised percentage of the value of the portfolio that was incurred as costs relating to the buying and selling of the assets underlying theportfolio. TC are a necessary cost in administering the portfolio and impact returns. TC should not be considered in isolation as returns may be impacted by many other factors over timeincluding market returns, the type of portfolio, the investment decisions of the investment manager and the TER. Where the class/portfolio is less than 1 year old the TER and TC cannot bedetermined accurately because of the short life span, calculations are based on actual data where possible and best estimates where actual data is not available. Note that the Total InvestmentCharges (TER+TC) have already been deducted prior to the calculation of the performance figures shown. Effective Annual Cost (“EAC”) is a measure that summarises the total cost that aninvestor incurs through their investment in a particular financial product, based on the principles set out in the ASISA EAC Standard. EAC data is available on request.
Performance: Performance is calculated for the portfolio⁄ class of portfolios. Illustrative performance information is included for illustrative purposes only; individual investor performance maydiffer as a result of initial and ongoing fees, the actual investment date, the date of reinvestment and dividend withholding tax. All figures quoted are from Morningstar and⁄ or IRESS, for theperiod ending 31/10/2017 (unless otherwise stated), calculated on a NAV to NAV basis, with income distributions reinvested on the ex-dividend date. Annualised figures refer to the averageyearly return of an investment over a given time period, all actual annual figures (if not shown) are available on request.
Collective Investment Schemes (CIS) are generally medium to long-term investments. The value of participatory interests may go down as well as up and past performance is not necessarilya guide to future performance. Fluctuations or movements in exchange rates may cause the value of underlying international investments in a fund to move up or down. Forward pricing isused. CIS are traded at ruling prices. Absa Fund Managers Limited (AFM) may borrow up to 10% (ten per cent) of the market value of a fund to accommodate insufficient liquidity. Securitiesin a fund may be lent to borrowers. Income from the fund is distributed semi-annually and may only be paid out into an account as nominated by the investor. Prices are calculated on a netasset value (NAV) basis which is the total value of all assets in a fund including any income accrual and less permissible deductions from the fund. Prices are published daily and are availableat www.Absa.co.za⁄Absacoza⁄indices⁄Absaunit-Trusts and in daily newspapers, or from AFM upon request. Fees and charges associated with the most expensive class are available directlyfrom AFM for investment by members of the public, other than financial institutions. CIS are financial products and not investments in insurance policies with an insurer and therefore cooling-off periods do not apply. AFM does not provide any guarantee either with respect to the capital or the return of a fund. The directors and personnel of AFM may be invested in any of thefunds. AFM holds professional indemnity cover. AFM utilises Absa Bank Limited’s electronic and telephone banking platform. All requests for transactions received on or before 16:00 everyday will traded at ruling prices and valued after 16:00 on that day. Investments in funds with foreign securities may involve various material risks, which include potential constraints onliquidity and the repatriation of funds, macroeconomic, political, foreign exchange, tax and settlement risks and potential limitations on the availability of market information and there maybe tax to be levied on certain of the benefits accruing to the investor from the funds and AFM may be required to deduct and pay over to the authorities any such tax from such benefits beforepaying any balance to or for the benefit of the investor. AFM has a right to close the fund to new investors in order to manage it more efficiently in accordance with its mandate. The investorunderstands that the legal and tax environment is continually changing, and that AFM cannot be held responsible for any changes to the law which might have an effect on their investment,And which did not exist at the time their investment was made. Additional information on the fund including, but not limited to, brochures, application forms, annual and half-yearly reportsare available free of charge from the AFM website or from AFM upon request. AFM is a registered Collective Investment Scheme Manager and a full member of the Association for Savingsand Investment SA. This document is a Minimum Disclosure Document (MDD) in terms of the Advertising, Marketing and Information Disclosure Requirements for Collective InvestmentSchemes published by the Financial Services Board. MDD issue date: 15 November 2017
Contact detailsManagement Company
Absa Fund Managers LimitedReg no 1991/000881/06 Absa Sandton South Campus, 15 Alice Lane, Sandton, 2196 Private Bag X10056, Sandton, 2146 Contact Centre: 0860 111 456 Fax: 0860 212 123 Email: [email protected] Website: www.absa.co.za/wim
Trustees
Société Générale Johannesburg BranchPO Box 6872, Johannesburg, 2000
Asset Manager
Absa Asset ManagementAn authorised financial services provider, FSP No: 522 Telephone: +27 (0)11 243 4563 Website:www.absa.co.za/wim
Absa SA Core Equity Fund

Wealth and Investment Management
Absa SA Core Equity Fund Fund Commentary30 September 2017
Commentary DocumentOn the back of a surprise interest rate cut by the SARB in July, the equity market rallied 7% this quarter. However, this rally might be short lived. Just as the marketadjusted its expectations, pricing in further interest rate cuts, the SARB surprised again in September. This time by keeping rates on hold, causing the market tocorrect more than 2% post the rate announcement. Amidst this volatility the ABSA SA Core Equity fund performed in line with its benchmark for the quarter, deliveringa total return of 10.50% year to date. The Rand traded as low as R12.80 to the US Dollar in the beginning of September, but weakened to above R13.60 by quarter end. With the fund holding meaningfulpositions in typical Rand hedge counters, overweight positions in Glencore, Greenbay Properties and Old Mutual aided performance, as did positions in Super Groupand Fortress B Property Income Fund. By applying our investment approach of not investing in a stock just because it screens cheaply, but to perform detailed research to understand the fundamentalsof the company, our underweight positions in Barclays Africa, Remgro and Life Health stood us in good stead. A large detractor from the fund’s performance was once again our structural underweight position in Naspers. It remains our largest holding, with more than 16%of the fund invested in the counter. We continue to manage concentration risk in this regard, as it now constitutes 21% of our index. Other detractors included our holdings in EOH, Pioneer Foods and Steinhoff. Pioneer and EOH were weighed down along with most SA focussed stocks as localeconomic pressures remain elevated and no further interest rate cuts materialised post July. However, we continue to hold these names as they have robust businessmodels and solid management teams. We believe Steinhoff offers attractive fundamental valuation upside at current levels and we remain holders of the name.
DisclosuresCollective Investment Schemes (CIS) are generally medium to long-term investments. The value of participatory interests may go down as well as up and pastperformance is not necessarily a guide to future performance. Fluctuations or movements in exchange rates may cause the value of underlying international investmentsin a fund to move up or down. Forward pricing is used. CIS are traded at ruling prices. Absa Fund Managers Limited (AFM) may borrow up to 10% (ten per cent) ofthe market value of a fund to accommodate insufficient liquidity. Securities in a fund may be lent to borrowers. Income from the fund is distributed semi-annually andmay only be paid out into an account as nominated by the investor. Prices are calculated on a net asset value (NAV) basis which is the total value of all assets in a fundincluding any income accrual and less permissible deductions from the fund. Prices are published daily and are available at www.Absa.co.za⁄Absacoza⁄indices⁄Absaunit-Trusts and in daily newspapers, or from AFM upon request. Fees and charges associated with the most expensive class are available directly from AFM for investmentby members of the public, other than financial institutions. CIS are financial products and not investments in insurance policies with an insurer and therefore cooling-off periods do not apply. AFM does not provide any guarantee either with respect to the capital or the return of a fund. The directors and personnel of AFM may beinvested in any of the funds. AFM holds professional indemnity cover. AFM utilises Absa Bank Limited’s electronic and telephone banking platform. All requests fortransactions received on or before 16:00 every day will traded at ruling prices and valued after 16:00 on that day. Investments in funds with foreign securities mayinvolve various material risks, which include potential constraints on liquidity and the repatriation of funds, macroeconomic, political, foreign exchange, tax andsettlement risks and potential limitations on the availability of market information and there may be tax to be levied on certain of the benefits accruing to the investorfrom the funds and AFM may be required to deduct and pay over to the authorities any such tax from such benefits before paying any balance to or for the benefit ofthe investor. AFM has a right to close the fund to new investors in order to manage it more efficiently in accordance with its mandate. The investor understands thatthe legal and tax environment is continually changing, and that AFM cannot be held responsible for any changes to the law which might have an effect on theirinvestment, And which did not exist at the time their investment was made. Additional information on the fund including, but not limited to, brochures, applicationforms, annual and half-yearly reports are available free of charge from the AFM website or from AFM upon request. AFM is a registered Collective Investment SchemeManager and a full member of the Association for Savings and Investment SA. This document is a Minimum Disclosure Document (MDD) in terms of the Advertising,Marketing and Information Disclosure Requirements for Collective Investment Schemes published by the Financial Services Board. MDD issue date: 15 November 2017
Contact details
Management Company
Absa Fund Managers LimitedReg no 1991/000881/06 Absa Sandton South Campus, 15 Alice Lane, Sandton, 2196 Private Bag X10056, Sandton, 2146 Contact Centre: 0860 111 456 Fax: 0860 212 123 Email: [email protected] Website: www.absa.co.za/wim
Trustees
Société Générale Johannesburg BranchPO Box 6872, Johannesburg, 2000
Asset Manager
Absa Asset ManagementAn authorised financial services provider, FSP No: 522 Telephone: +27 (0)11 243 4563 Website:www.absa.co.za/wim
Absa SA Core Equity Fund
Wealth and Investment Management
Absa Select Equity Fund Minimum disclosure documentMonth ended 31 October 2017
Fund detailsIndustry category SA - Equity - GeneralBenchmark FTSE/JSE All Share IndexFund launch date 23 February 2004Class C1 launch date 05 March 2013Fund Size R 3.23 BillionJSE code ASEFFund Manager Stephen Arthur – B.Sc. Eng Mining, CFA
Kurt Benn – B.Bus.Sc (Finance), B.Com (Hons), CFAAsset Manager Absa Asset Management (Pty) LtdMinimum lump sum R 2000Minimum Monthly R 200
Income distributions - cents per unit (cpu)Class A Class C1
the 6 months ended 31 Dec 2016 4.32 5.89the 6 months ended 30 Jun 2017 3.53 5.13
Income declaration 30 June & 31 DecemberIncome distributions 15 July & 15 January
Fees and Cost ratio (VAT incl.)Fees Class A Class C1Initial Fees: Absa: 0% 0%
Adviser: 0-3.42% 0%Annual Fees: Management: 1.71% 1.14%
Adviser: 0-1.14%Performance Fee: No No
Costs (annual, based on period shown) Class A Class C1For the period to 30-06-2017, from: 01/07/2014 01/07/2014Total expense ratio (TER): 1.71% 1.04%Transaction costs (TC): 0.09% 0.09%Total investment charges (TER+TC): 1.80% 1.13%Please refer to Disclosure section on next page for further information on Fees and Costs
PerformancePerformance: annualised total returns (%)Term Class A Benchmark Sector
AverageRank Class C1
Launch 16.67 16.38 14.76 9/38 8.071 Year 11.66 20.11 13.04 109/167 12.293 Year 3.48 9.00 5.75 111/130 3.845 Year 7.96 12.97 9.98 87/100 -10 Year 9.21 9.70 7.62 22/61 -
Performance Yearly returns (%)1 yr ending: Oct'17 Oct'16 Oct'15 Oct'14 Oct'13 Oct'12 Oct'11 Oct'10Class A 11.66 -6.27 5.88 10.71 19.56 19.17 7.99 20.03Benchmark 20.11 -3.42 11.64 12.54 26.23 18.59 9.40 18.31Class C1 12.29 -6.59 6.74 11.23 - - - -Sector Average & Rank: applies to the A Class.Please refer to Disclosures section on next page for further information on calculation methodologyand source of all performance data content (tables and/or charts) of this MDD
Fund objectivesThe Absa Select Equity Fund will be a general fund that will invest the majority ofits assets in South African investment markets at all times and will predominantlyinvest in securities of an equity nature traded on the South African registeredexchanges.
Fund strategyThe fund is focused on stock selection and will invest primarily in South African-listed equities. Additional securities which may be included are non- equitysecurities, assets in liquid form and other income-bearing instruments andsecurities. A minimum of 75% of the fund’s assets will be invested in equities atall times.
Fund features• Ideal vehicle for long-term investments• Offers exposure to JSE-listed equities, with emphasis on stock selection• Unconstrained value-based investment philosophy• A fund with a proven track record and investment style that has delivered
superior performance over the long term• Suitable for investors who seek long-term capital growth from equity
exposure
Fund specific risksConcentration: Investments may be primarily concentrated in specific areas (e.g.countries/geographical regions and/or industry sectors), in terms of investmentstyle (e.g. income or growth), in individual holdings and/or in a number of otherways. This may mean the value of the Fund may decrease whilst more broadlyinvested funds might grow. Equity investment: The value of equities (e.g. shares)and equity-related investments may vary according to company profits andfuture prospects as well as more general market factors. In the event of a companydefault (e.g. bankruptcy), the owners of their equity rank last in terms of anyfinancial payment from that company. Liquidity: There may be insufficient buyersor sellers of particular investments giving rise to delays in trading and being ableto make settlements from the Fund and/or large fluctuations in the value of theFund which may lead to larger financial losses than anticipated.
Risk profile and advisable minimum termLow Low-Medium Medium Medium-High High
3 Months + 6 Months + 2 Years + 3 Years + 5 Years +
Risk statisticsClass A Since Inception (23 February 2004)Number of positive months 108/164Highest 1 Year Performance 30/04/2006 67.09%Lowest 1 Year Performance 31/10/2008 -20.97%
Cumulative performance (5 years)
Absa Select Equity A FTSE/JSE All Share Index
100
120
140
160
180
200
Oct-12
Dec-12
Jun-13
Dec-13
Jun-14
Dec-14
Jun-15
Dec-15
Jun-16
Dec-16
Jun-17
Oct-17
The chart reflects the value (monthly data points) of a R100 investment made on the01/11/2012
Absa Select Equity Fund

Wealth and Investment Management
Sector Allocation (%)
2,59%
4,48%
4,64%
5,15%
16,60%
17,80%
19,85%
28,88%
Health Care
Telecommunications
Industrials
Oil & Gas
Basic Materials
Consumer Goods
Consumer Services
Financials
Top share holding (%)
Anglo 5.50%Sasol 5.15%British American Tobacco 4.58%MTN Group 4.48%Standard Bank 4.41%Old Mutual 4.40%Reinet Investments 4.19%Bid Corp Ltd 4.14%BHPBil 3.84%Firstrand 3.80%
Asset Allocation (%)Equity 98.89%Money market 1.07%International money market 0.04%
Quarterly fund commentary as at 30 September 2017The Fund Commentary is provided on a quarterly basis and can be found on www.absa.co.za/WIM under Unit Trusts Minimum Disclosure Documents. The latest quarterly commentaryavailable is for the quarter ending 30 September 2017.
DisclosuresFees: Class A Adviser annual fee is not included in the annual management fee, it is charged by a way of unit reduction.
Costs: Total Expense Ratio (“TER”) is expressed as an annualised percentage of the value of the Class of the portfolio that was incurred as expenses relating to the administration of theportfolio. A higher TER does not necessarily imply a poor return, nor does a lower TER imply a good return. The current TER cannot be regarded as an accurate indication of future TER's.Transaction Costs (“TC”) is expressed as an annualised percentage of the value of the portfolio that was incurred as costs relating to the buying and selling of the assets underlying theportfolio. TC are a necessary cost in administering the portfolio and impact returns. TC should not be considered in isolation as returns may be impacted by many other factors over timeincluding market returns, the type of portfolio, the investment decisions of the investment manager and the TER. Note that the Total Investment Charges (TER+TC) have already been deductedprior to the calculation of the performance figures shown. Effective Annual Cost (“EAC”) is a measure that summarises the total cost that an investor incurs through their investment in aparticular financial product, based on the principles set out in the ASISA EAC Standard. EAC data is available on request.
Performance: Performance is calculated for the portfolio⁄ class of portfolios. Illustrative performance information is included for illustrative purposes only; individual investor performance maydiffer as a result of initial and ongoing fees, the actual investment date, the date of reinvestment and dividend withholding tax. All figures quoted are from Morningstar and⁄ or IRESS, for theperiod ending 31/10/2017 (unless otherwise stated), calculated on a NAV to NAV basis, with income distributions reinvested on the ex-dividend date. Annualised figures refer to the averageyearly return of an investment over a given time period, all actual annual figures (if not shown) are available on request.
Collective Investment Schemes (CIS) are generally medium to long-term investments. The value of participatory interests may go down as well as up and past performance is not necessarilya guide to future performance. Fluctuations or movements in exchange rates may cause the value of underlying international investments in a fund to move up or down. Forward pricing isused. CIS are traded at ruling prices. Absa Fund Managers Limited (AFM) may borrow up to 10% (ten per cent) of the market value of a fund to accommodate insufficient liquidity. Securitiesin a fund may be lent to borrowers. Income from the fund is distributed semi-annually and may only be paid out into an account as nominated by the investor. Prices are calculated on a netasset value (NAV) basis which is the total value of all assets in a fund including any income accrual and less permissible deductions from the fund. Prices are published daily and are availableat www.Absa.co.za/Absacoza/indices/Absa-unit-trusts and in daily newspapers, or from AFM upon request. Fees and charges associated with the most expensive class are available directlyfrom AFM for investment by members of the public, other than financial institutions. CIS are financial products and not investments in insurance policies with an insurer and therefore cooling-off periods do not apply. AFM does not provide any guarantee either with respect to the capital or the return of a fund. The directors and personnel of AFM may be invested in any of thefunds. AFM holds professional indemnity cover. AFM utilises Absa Bank Limited’s electronic and telephone banking platform. All requests for transactions received on or before 16:00 everyday will traded at ruling prices and valued after 16:00 on that day. Investments in funds with foreign securities may involve various material risks, which include potential constraints onliquidity and the repatriation of funds, macroeconomic, political, foreign exchange, tax and settlement risks and potential limitations on the availability of market information and there maybe tax to be levied on certain of the benefits accruing to the investor from the funds and AFM may be required to deduct and pay over to the authorities any such tax from such benefits beforepaying any balance to or for the benefit of the investor. AFM has a right to close the fund to new investors in order to manage it more efficiently in accordance with its mandate. The investorunderstands that the legal and tax environment is continually changing, and that AFM cannot be held responsible for any changes to the law which might have an effect on their investment,and which did not exist at the time their investment was made. Additional information on the fund including, but not limited to, brochures, application forms, annual and half-yearly reportsare available free of charge from the AFM website or from AFM upon request. AFM is a registered Collective Investment Scheme Manager and a full member of the Association for Savingsand Investment SA. This document is a Minimum Disclosure Document (MDD) in terms of the Advertising, Marketing and Information Disclosure Requirements for Collective InvestmentSchemes published by the Financial Services Board. MDD issue date: 15 November 2017
Contact detailsManagement Company
Absa Fund Managers LimitedReg no 1991/000881/06 Absa Sandton South Campus, 15 Alice Lane, Sandton, 2196 Private Bag X10056, Sandton, 2146 Contact Centre: 0860 111 456 Fax: 0860 212 123 Email: [email protected] Website: www.absa.co.za/wim
Trustees
Société Générale Johannesburg BranchPO Box 6872, Johannesburg, 2000
Asset Manager
Absa Asset ManagementAn authorised financial services provider, FSP No: 522 Telephone: +27 (0)11 243 4563 Website:www.absa.co.za/wim
Absa Select Equity Fund
Wealth and Investment Management
Absa Select Equity Fund Fund Commentary30 September 2017
Commentary DocumentEconomic pressures locally combined with a benign inflation outlook resulted in the SARB cutting interest rates by 25 bps in July. The local equity market respondedpositively, with the JSE All Share Index returning just shy of 9% in the quarter. The ABSA Select Equity Fund returned 7.3%. In particular, the resource sector performed excellently over the last three months, rallying 18% on higher commodity prices. This aided the performance of the fund.Overweight positions in Anglo American and Glencore, which rallied 42% and 27% respectively, stood it in good stead. Similarly, remaining true to our pragmatic value approach by identifying investment ideas that we believe will deliver superior risk-adjusted returns through theinvestment cycle, resulted in our core overweight positions in Standard Bank and Mr Price generating positive outperformance. Underweight positions in Remgroand Vodacom, counters that we believe are overvalued at current levels and which came under pressure in the quarter, added to the fund’s relative performance. The fund typically maintains a value and mid-market capitalization share bias, resulting in underweights in stocks like Naspers and Richemont. With the Randweakening towards the end of the quarter, aforementioned positions detracted from relative performance. Since 2008, worldwide governments and central banks have created a generally positive backdrop for risky assets by means of accommodative monetary policy.When these global ultra-low interest rates reverse, a process which has already started in the US and likely to accelerate, it could have a devastating effect on financialmarkets, including South Africa.
DisclosuresCollective Investment Schemes (CIS) are generally medium to long-term investments. The value of participatory interests may go down as well as up and pastperformance is not necessarily a guide to future performance. Fluctuations or movements in exchange rates may cause the value of underlying international investmentsin a fund to move up or down. Forward pricing is used. CIS are traded at ruling prices. Absa Fund Managers Limited (AFM) may borrow up to 10% (ten per cent) ofthe market value of a fund to accommodate insufficient liquidity. Securities in a fund may be lent to borrowers. Income from the fund is distributed semi-annually andmay only be paid out into an account as nominated by the investor. Prices are calculated on a net asset value (NAV) basis which is the total value of all assets in a fundincluding any income accrual and less permissible deductions from the fund. Prices are published daily and are available at www.Absa.co.za/Absacoza/indices/Absa-unit-trusts and in daily newspapers, or from AFM upon request. Fees and charges associated with the most expensive class are available directly from AFM forinvestment by members of the public, other than financial institutions. CIS are financial products and not investments in insurance policies with an insurer and thereforecooling-off periods do not apply. AFM does not provide any guarantee either with respect to the capital or the return of a fund. The directors and personnel of AFMmay be invested in any of the funds. AFM holds professional indemnity cover. AFM utilises Absa Bank Limited’s electronic and telephone banking platform. All requestsfor transactions received on or before 16:00 every day will traded at ruling prices and valued after 16:00 on that day. Investments in funds with foreign securities mayinvolve various material risks, which include potential constraints on liquidity and the repatriation of funds, macroeconomic, political, foreign exchange, tax andsettlement risks and potential limitations on the availability of market information and there may be tax to be levied on certain of the benefits accruing to the investorfrom the funds and AFM may be required to deduct and pay over to the authorities any such tax from such benefits before paying any balance to or for the benefit ofthe investor. AFM has a right to close the fund to new investors in order to manage it more efficiently in accordance with its mandate. The investor understands thatthe legal and tax environment is continually changing, and that AFM cannot be held responsible for any changes to the law which might have an effect on theirinvestment, and which did not exist at the time their investment was made. Additional information on the fund including, but not limited to, brochures, applicationforms, annual and half-yearly reports are available free of charge from the AFM website or from AFM upon request. AFM is a registered Collective Investment SchemeManager and a full member of the Association for Savings and Investment SA. This document is a Minimum Disclosure Document (MDD) in terms of the Advertising,Marketing and Information Disclosure Requirements for Collective Investment Schemes published by the Financial Services Board. MDD issue date: 15 November 2017
Contact details
Management Company
Absa Fund Managers LimitedReg no 1991/000881/06 Absa Sandton South Campus, 15 Alice Lane, Sandton, 2196 Private Bag X10056, Sandton, 2146 Contact Centre: 0860 111 456 Fax: 0860 212 123 Email: [email protected] Website: www.absa.co.za/wim
Trustees
Société Générale Johannesburg BranchPO Box 6872, Johannesburg, 2000
Asset Manager
Absa Asset ManagementAn authorised financial services provider, FSP No: 522 Telephone: +27 (0)11 243 4563 Website:www.absa.co.za/wim
Absa Select Equity Fund

Wealth and Investment Management
Absa Smart Alpha Equity Fund Minimum disclosure documentMonth ended 31 October 2017
Fund detailsIndustry category SA - Equity - GeneralBenchmark FTSE/JSE Shareholder Weighted Index (SWIX)Fund launch date 23 April 2015Class A launch Date 23 April 2015Class D launch date 23 April 2015Fund Size R 796.68 MillionJSE code ASECAFund Manager St John Bunkell – MSc Chem.Eng
Asset Manager Absa Alternative Asset ManagementMinimum lump sum R 2000Minimum Monthly R 200
Income distributions - cents per unit (cpu)Class A Class D
the 6 months ended 31 Dec 2016 0.39 0.53the 6 months ended 30 Jun 2017 1.04 1.16
Income declaration 30 June & 31 DecemberIncome distributions 15 July & 15 January
Fees and Cost ratio (VAT incl.)Fees Class A Class DInitial Fees: Absa: 0% 0%
Adviser: 0-3.42% 0%Annual Fees: Management: 0.86% 0.63%
Adviser: 0-1.14% 0%Performance Fee: No No
Costs (annual, based on period shown) Class A Class DFor the period to 30-06-2017, from: 22-04-2015 22-04-2015Total expense ratio (TER): 1.46% 0.96%Transaction costs (TC): 0.40% 0.40%Total investment charges (TER+TC): 1.86% 1.36%Please refer to Disclosure section on next page for further information on Fees and Costs
PerformancePerformance cummulative total returns (%)Term Class A Benchmark Sector
AverageRank Class D
Launch 2.38 13.97 7.36 118/137 3.173 month 9.46 7.20 6.19 10/184 9.526 Month 11.23 9.56 6.86 9/174 11.359 Month 14.91 14.82 9.74 19/169 15.121 Year 15.16 17.27 13.04 60/167 15.45
Sector Average & Rank: applies to the A Class.Please refer to Disclosures section on next page for further information on calculation methodologyand source of all performance data content (tables and/or charts) of this MDD
Fund objectivesThe Absa Smart Alpha Equity Fund aims to provide investors with sustainablecapital growth over the medium to long term
Fund strategyThe fund is a domestic, general equity fund, using a proprietary quantitativeprocess. Securities that will be included in the portfolio will fall into the large andmid-cap segment of the market. The fund will be allowed to invest into securitieslisted in South Africa on the JSE as well as the equities listed on internationalexchanges and in accordance with the exchange controls regulations. The fundis a quasi-passive fund which invests in securities predominantly through indiceswhilst generating Alpha using quantitative asset allocation techniques.
Fund features• Ideal vehicle for long-term investments• Offers exposure to JSE-listed equities• The fund will use a number of investment styles, including Momentum,
Defensive and Value• Suitable for investors who seek long-term capital growth from equity
exposure
Fund specific risksConcentration: Investments may be primarily concentrated in specific areas (e.g.countries/geographical regions and/or industry sectors), in terms ofinvestmentstyle (e.g. income or growth), in individual holdings and/or in a number of otherways. This may mean the value of the Fund may decreasewhilst more broadlyinvested funds might grow. Equity investment: The value of equities (e.g. shares)and equity-related investments may vary according to company profits andfuture prospects as well as more general market factors. In the event of a companydefault (e.g. bankruptcy), the owners of their equity rank last in terms of anyfinancial payment from that company. Liquidity: There may be insufficient buyersor sellers of particular investments giving rise to delays in trading and being ableto make settlements from the Fund and/or large fluctuations in the value of theFund which may lead to larger financial losses than anticipated.
Risk profile and advisable minimum termLow Low-Medium Medium Medium-High High
3 Months + 6 Months + 2 Years + 3 Years + 5 Years +
Risk statisticsClass A Since Inception (23 April 2015)Number of positive months 13/30Highest 1 Year Performance 31/10/2017 15.16%Lowest 1 Year Performance 31/10/2016 -6.96%
Cumulative performance (since inception)
Absa Smart Alpha Equity A Absa Smart Alpha Equity D FTSE/JSE All Share SWIX (J403T)
85
90
95
100
105
110
115
Apr-15
Jun-15
Dec-15
Jun-16
Dec-16
Jun-17
Oct-17
The chart reflects the value (monthly data points) of a R100 investment made on the 23April 2015
Absa Smart Alpha Equity Fund

Wealth and Investment Management
Sector Allocation (%)
1,03%
3,33%
3,34%
3,54%
3,64%
10,41%
16,35%
27,24%
31,11%
Energy
Telecommunication Services
Health Care
Industrials
Real Estate
Consumer Staples
Financials
Materials
Consumer Discretionary
Top share holding (%)
NASPERS LTD-N SHS 23.14%BRITISH AMERICAN TOBACCO PLC 5.20%SASOL LTD 4.66%ANGLO AMERICAN PLC 3.55%STEINHOFF INTERNATIONAL H NV 3.52%FINANCIERE RICHEMONT-DEP REC 3.37%STANDARD BANK GROUP LTD 3.13%ASPEN PHARMACARE HOLDINGS LT 2.72%OLD MUTUAL PLC 2.66%BHP BILLITON PLC 2.45%
Asset Allocation (%)
0,72%
99,28%
Cash
Equity
Quarterly fund commentary as at 30 September 2017The Fund Commentary is provided on a quarterly basis and can be found on www.absa.co.za/WIM under Unit Trusts Minimum Disclosure Documents. The latest quarterly commentaryavailable is for the quarter ending 30 September 2017.
DisclosuresFees: Class A Adviser annual fee is not included in the annual management fee, it is charged by a way of unit reduction.
Costs: Total Expense Ratio (“TER”) is expressed as an annualised percentage of the value of the Class of the portfolio that was incurred as expenses relating to the administration of theportfolio. A higher TER does not necessarily imply a poor return, nor does a lower TER imply a good return. The current TER cannot be regarded as an accurate indication of future TER's.Transaction Costs (“TC”) is expressed as an annualised percentage of the value of the portfolio that was incurred as costs relating to the buying and selling of the assets underlying theportfolio. TC are a necessary cost in administering the portfolio and impact returns. TC should not be considered in isolation as returns may be impacted by many other factors over timeincluding market returns, the type of portfolio, the investment decisions of the investment manager and the TER. Note that the total investment charges (TER+TC) have already been deductedprior to the calculation of the performance figures shown. Effective Annual Cost (“EAC”) is a measure that summarises the total cost that an investor incurs through their investment in aparticular financial product, based on the principles set out in the ASISA EAC standard. EAC data is available on request.
Performance: Performance is calculated for the portfolio⁄class of portfolios. Illustrative performance information is included for illustrative purposes only; individual investor performance maydiffer as a result of initial and ongoing fees, the actual investment date, the date of reinvestment and dividend withholding tax. All figures quoted are from Morningstar and⁄or IRESS, for theperiod ending 31/10/2017 (unless otherwise stated), calculated on a NAV to NAV basis, with income distributions reinvested on the ex-dividend date. Annualised figures refer to the averageyearly return of an investment over a given time period, all actual annual figures (if not shown) are available on request.
Collective Investment Schemes (CIS) are generally medium to long-term investments. The value of participatory interests may go down as well as up and past performance is not necessarilya guide to future performance. Fluctuations or movements in exchange rates may cause the value of underlying international investments In a fund to move up or down. Forward pricing isused. CIS are traded at ruling prices. Absa Fund Managers Limited (AFM) may borrow up to 10% (ten per cent) of the market value of a fund to accommodate insufficient liquidity. Securitiesin a fund may be lent to borrowers. Income from the fund is distributed semi-annually and may only be paid out into an account as nominated by the investor. Prices are calculated on a netasset value (NAV) basis which is the total value of all assets in a fund Including any income accrual and less permissible deductions from the fund. Prices are published daily and are availableat www.absa.co.za⁄Absacoza⁄indices⁄AbsaUnit-Trusts and in daily newspapers, or from AFM upon request. Fees and charges associated with the most expensive class are available directlyfrom AFM for Investment by members of the public, other than financial institutions. CIS are financial products and not investments in insurance policies with an insurer and thereforeCooling-off periods do not apply. AFM does not provide any guarantee either with respect to the capital or the return of a fund. The directors and personnel of AFM may be invested in any of thefunds. AFM holds professional indemnity cover. AFM utilises Absa Bank Limited’s electronic and telephone banking platform. All requests for transactions received on or before 16:00 everyday will traded at ruling prices and valued after 16:00 on that day. Investments in funds with foreign securities may Involve various material risks, which include potential constraints onliquidity and the repatriation of funds, macroeconomic, political, foreign exchange, tax and settlement risks and potential limitations on the availability of market information and there maybe tax to be levied on certain of the benefits accruing to the investor from the funds and AFM may be required to deduct and pay over to the authorities any such tax from such benefits beforepaying any balance to or for the benefit of the investor. AFM has a right to close the fund to new investors in order to manage it more efficiently in accordance with its mandate. The investorunderstands that the legal and tax environment is continually changing, and that AFM cannot be held responsible for any changes to the law which might have an effect on their investment,And which did not exist at the time their investment was made. Additional information on the fund including, but not limited to, brochures, application forms, annual and half-yearly reportsare available free of charge from the AFM website or from AFM upon request. AFM is a registered Collective Investment Scheme Manager and a full member of the Association for Savingsand Investment SA. This document is a Minimum Disclosure Document (MDD) in terms of the Advertising, Marketing and Information Disclosure requirements for Collective InvestmentSchemes published by the Financial Services Board. MDD issue date: 15 November 2017
Contact detailsManagement Company
Absa Fund Managers LimitedReg no 1991/000881/06 Absa Sandton South Campus, 15 Alice Lane, Sandton, 2196 Private Bag X10056, Sandton, 2146 Contact Centre: 0860 111 456 Fax: 0860 212 123 Email: [email protected] Website: www.absa.co.za/wim
Trustees
Société Générale Johannesburg BranchPO Box 6872, Johannesburg, 2000
Asset Manager
Absa Alternative Asset ManagementAn authorised financial services provider, FSP No: 2877 Telephone: +27 (0)21 927 6404 Website:www.absa.co.za/wim
Absa Smart Alpha Equity Fund

Wealth and Investment Management
Absa Smart Alpha Equity Fund Fund Commentary30 September 2017
Commentary Document SA equities, represented by the FTSE/ JSE Top 40 Index (Top 40), rose 8.71% in the third quarter of this year, while SA bonds, represented by the South African AllBond Index, rose by 3.68% for the period. Global equities, represented by the MSCI World Index, rose 4.39%. The Rand weakened by 3.70% against the U.S. Dollarin the third quarter. The Fund by comparison rose by 9.17%, in the third quarter net of all costs and fees. South Africa’s economy recovered in the second quarter of 2017. This is largely attributed to a re-bound in the agriculture sector due to the improved summer rainfalland a mild improvement in the mining sector production. Low confidence amongst the private sector and consumers continues to result in low capital expenditureand tight fiscal policy has hamstrung public and SOE expenditure. Investors are uncertain as to the outcome of the December 2017 ANC leadership conference which sees two factions go head-to-head to elect their leadership. Eachfaction has very different views on what is needed for the economy which removes the prospect of policy certainty for the foreseeable future. The Smart Alpha Equity portfolio allocates to several factors that tend to drive equity market return including Momentum, Value and Quality. AAM has a largenumber of over and under-weight positions relative to the index so as to attempt to generate smoothed excess return; several of these over-weights delivered wellhowever, these include; Assore (42.2%), Exxaro (32.1%) and Murray and Roberts (22.4%). The portfolio is well positioned to take advantage of potential excessreturn drivers in the multi factor space into the fourth quarter.
DisclosuresCollective Investment Schemes (CIS) are generally medium to long-term investments. The value of participatory interests may go down as well as up and pastperformance is not necessarily a guide to future performance. Fluctuations or movements in exchange rates may cause the value of underlying international investmentsIn a fund to move up or down. Forward pricing is used. CIS are traded at ruling prices. Absa Fund Managers Limited (AFM) may borrow up to 10% (ten per cent) ofthe market value of a fund to accommodate insufficient liquidity. Securities in a fund may be lent to borrowers. Income from the fund is distributed semi-annually andmay only be paid out into an account as nominated by the investor. Prices are calculated on a net asset value (NAV) basis which is the total value of all assets in a fundIncluding any income accrual and less permissible deductions from the fund. Prices are published daily and are available at www.absa.co.za⁄Absacoza⁄indices⁄AbsaUnit-Trusts and in daily newspapers, or from AFM upon request. Fees and charges associated with the most expensive class are available directly from AFM for Investmentby members of the public, other than financial institutions. CIS are financial products and not investments in insurance policies with an insurer and thereforeCooling-off periods do not apply. AFM does not provide any guarantee either with respect to the capital or the return of a fund. The directors and personnel of AFM may beinvested in any of the funds. AFM holds professional indemnity cover. AFM utilises Absa Bank Limited’s electronic and telephone banking platform. All requests fortransactions received on or before 16:00 every day will traded at ruling prices and valued after 16:00 on that day. Investments in funds with foreign securities mayInvolve various material risks, which include potential constraints on liquidity and the repatriation of funds, macroeconomic, political, foreign exchange, tax andsettlement risks and potential limitations on the availability of market information and there may be tax to be levied on certain of the benefits accruing to the investorfrom the funds and AFM may be required to deduct and pay over to the authorities any such tax from such benefits before paying any balance to or for the benefit ofthe investor. AFM has a right to close the fund to new investors in order to manage it more efficiently in accordance with its mandate. The investor understands thatthe legal and tax environment is continually changing, and that AFM cannot be held responsible for any changes to the law which might have an effect on theirinvestment, And which did not exist at the time their investment was made. Additional information on the fund including, but not limited to, brochures, applicationforms, annual and half-yearly reports are available free of charge from the AFM website or from AFM upon request. AFM is a registered Collective Investment SchemeManager and a full member of the Association for Savings and Investment SA. This document is a Minimum Disclosure Document (MDD) in terms of the Advertising,Marketing and Information Disclosure requirements for Collective Investment Schemes published by the Financial Services Board. MDD issue date: 15 November 2017
Contact details
Management Company
Absa Fund Managers LimitedReg no 1991/000881/06 Absa Sandton South Campus, 15 Alice Lane, Sandton, 2196 Private Bag X10056, Sandton, 2146 Contact Centre: 0860 111 456 Fax: 0860 212 123 Email: [email protected] Website: www.absa.co.za/wim
Trustees
Société Générale Johannesburg BranchPO Box 6872, Johannesburg, 2000
Asset Manager
Absa Alternative Asset ManagementAn authorised financial services provider, FSP No: 2877 Telephone: +27 (0)21 927 6404 Website:www.absa.co.za/wim
Absa Smart Alpha Equity Fund

Wealth and Investment Management
Absa Large Cap Fund Minimum disclosure documentMonth ended 31 October 2017
Fund detailsIndustry category SA - Equity - Large CapBenchmark FTSE/JSE Top 40 IndexFund launch date 28 September 2001Class A launch Date 28 September 2001Fund Size R 1.11 BillionJSE code ABRFFund Manager Stephen Arthur – B.Sc. Eng Mining, CFA
Dale Hutcheson – BCom, Dip (Acc), HDip (Tax), CA (SA)Asset Manager Absa Asset Management (Pty) LtdMinimum lump sum R 2000Minimum Monthly R 200
Income distributions - cents per unit (cpu)Class A
the 6 months ended 31 Dec 2016 7.44the 6 months ended 30 Jun 2017 6.05
Income declaration 30 June & 31 DecemberIncome distributions 15 July & 15 January
Fees and Cost ratio (VAT incl.)Fees Class AInitial Fees: Absa: 0%
Adviser: 0-3.42%Annual Fees: Management: 1.14%
Adviser: 0-1.14%Performance Fee: No
Costs (annual, based on period shown) Class AFor the period to 30-06-2017, from: 01/07/2014Total expense ratio (TER): 1.16%Transaction costs (TC): 0.61%Total investment charges (TER+TC): 1.77%Please refer to Disclosure section on next page for further information on Fees and Costs
PerformancePerformance: annualised total returns (%)Term Class A Benchmark Sector Average RankLaunch 16.69 16.05 15.16 1/51 Year 18.68 22.92 18.28 9/113 Year 9.83 8.89 6.12 1/105 Year 13.54 12.98 10.41 1/810 Year 11.21 9.37 8.21 1/6
Performance Yearly returns (%)1 yr ending: Oct'17 Oct'16 Oct'15 Oct'14 Oct'13 Oct'12 Oct'11 Oct'10Class A 18.68 -4.07 16.36 12.59 26.51 15.96 11.25 15.38Benchmark 22.92 -6.48 12.33 12.37 26.84 17.41 10.22 17.01Sector Average & rank: applies to the A Class.Please refer to Disclosure section on the next page for further information on calculation methodology and source of allperformance data content (tables and/or charts) of this MDD.
Fund objectivesThe Absa Large Cap Fund is in the domestic equity large sector and invest majorityof its assets in the South African investment markets at all times
Fund strategyThe majority of the equity securities will be large capitalisation shares from theFTSE/JSE Africa top 40 index.The fund will predominantly invest in securities ofan equity nature. Our equity investment process is primarily bottom-up stock-picking and valuation focused. The portfolios are managed in line with ourpragmatic value investment approach, with the objective of providing real returnsto clients.
Fund features• A fund ideally suited as part of a long-term investor’s core South African
equity exposure• Actively managed with potential capital growth opportunities• Access to a broadly diversified selection of the largest companies listed on
the JSE• Suitable for investors who seek exposure to the top 40 listed equity shares
Fund specific risksConcentration: Investments may be primarily concentrated in specific areas (e.g.countries/geographical regions and/or industry sectors), in terms of investmentstyle (e.g. income or growth), in individual holdings and/or in a number of otherways. This may mean the value of the Fund may decrease whilst more broadlyinvested funds might grow. Equity investment: The value of equities (e.g. shares)and equity-related investments may vary according to company profits andfuture prospects as well as more general market factors. In the event of a companydefault (e.g. bankruptcy), the owners of their equity rank last in terms of anyfinancial payment from that company. Liquidity: There may be insufficient buyersor sellers of particular investments giving rise to delays in trading and being ableto make settlements from the Fund and/or large fluctuations in the value of theFund which may lead to larger financial losses than anticipated.
Risk profile and advisable minimum termLow Low-Medium Medium Medium-High High
3 Months + 6 Months + 2 Years + 3 Years + 5 Years +
Risk statisticsClass A Since Inception (28 September 2001)Number of positive months 121/193Highest 1 Year Performance 30/04/2006 74.48%Lowest 1 Year Performance 28/02/2009 -32.05%
Cumulative performance (5 years)
Absa Large Cap A FTSE/JSE Top 40 Index
100
120
140
160
180
200
Oct-12
Dec-12
Jun-13
Dec-13
Jun-14
Dec-14
Jun-15
Dec-15
Jun-16
Dec-16
Jun-17
Oct-17
The chart reflects the value (monthly data points) of a R100 investment made on the01/11/2012
Absa Large Cap Fund

Wealth and Investment Management
Sector Allocation (%)
0,89%
1,05%
1,07%
3,70%
4,26%
20,88%
21,19%
22,21%
24,75%
Additional
Health Care
Technology
Telecommunications
Oil & Gas
Basic Materials
Consumer Services
Financials
Consumer Goods
Top share holding (%)
Naspers 16.31%BHPBil 8.81%British American Tobacco 8.47%Richemont 6.79%Steinhoff 5.72%Sasol 4.26%Firstrand 3.65%NEPI Rockcastle PLC 3.62%Old Mutual 3.57%Mondi Plc 3.34%
Asset Allocation (%)Equity 96.39%Money market 3.61%
Quarterly fund commentary as at 30 September 2017The Fund Commentary is provided on a quarterly basis and can be found on www.absa.co.za/WIM under Unit Trusts Minimum Disclosure Documents. The latest quarterly commentaryavailable is for the quarter ending 30 September 2017.
DisclosuresFees: Class A Adviser annual fee is not included in the annual management fee, it is charged by a way of unit reduction.
Costs: Total Expense Ratio (“TER”) is expressed as an annualised percentage of the value of the Class of the portfolio that was incurred as expenses relating to the administration of theportfolio. A higher TER does not necessarily imply a poor return, nor does a lower TER imply a good return. The current TER cannot be regarded as an accurate indication of future TER's.Transaction Costs (“TC”) is expressed as an annualised percentage of the value of the portfolio that was incurred as costs relating to the buying and selling of the assets underlying theportfolio. TC are a necessary cost in administering the portfolio and impact returns. TC should not be considered in isolation as returns may be impacted by many other factors over timeincluding market returns, the type of portfolio, the investment decisions of the investment manager and the TER. Note that the total investment charges (TER+TC) have already been deductedprior to the calculation of the performance figures shown. Effective Annual Cost (“EAC”) is a measure that summarises the total cost that an investor incurs through their investment in aparticular financial product, based on the principles set out in the ASISA EAC standard. EAC data is available on request.
Performance: Performance is calculated for the portfolio⁄class of portfolios. Illustrative performance information is included for illustrative purposes only; individual investor performance maydiffer as a result of initial and ongoing fees, the actual investment date, the date of reinvestment and dividend withholding tax. All figures quoted are from Morningstar and⁄or IRESS, for theperiod ending 31/10/2017 (unless otherwise stated), calculated on a NAV to NAV basis, with income distributions reinvested on the ex-dividend date. Annualised figures refer to the averageyearly return of an investment over a given time period, all actual annual figures (if not shown) are available on request.
Collective Investment Schemes (CIS) are generally medium to long-term investments. The value of participatory interests may go down as well as up and past performance is not necessarilya guide to future performance. Fluctuations or movements in exchange rates may cause the value of underlying international investments in a fund to move up or down. Forward pricing isused. CIS are traded at ruling prices. Absa Fund Managers Limited (AFM) may borrow up to 10% (ten per cent) of the market value of a fund to accommodate insufficient liquidity. Securitiesin a fund may be lent to borrowers. Income from the fund is distributed semi-annually and may only be paid out into an account as nominated by the investor. Prices are calculated on a netasset value (NAV) basis which is the total value of all assets in a fund including any income accrual and less permissible deductions from the fund. Prices are published daily and are availableat www.Absa.co.za⁄Absacoza⁄indices⁄Absaunit-Trusts and in daily newspapers, or from AFM upon request. Fees and charges associated with the most expensive class are available directlyfrom AFM for Investment by members of the public, other than financial institutions. CIS are financial products and not investments in insurance policies with an insurer and therefore cooling-off periods do not apply. AFM does not provide any guarantee either with respect to the capital or the return of a fund. The directors and personnel of AFM may be invested in any of thefunds. AFM holds professional indemnity cover. AFM utilises Absa Bank Limited’s electronic and telephone banking platform. All requests for transactions received on or before 16:00 everyday will traded at ruling prices and valued after 16:00 on that day. Investments in funds with foreign securities may involve various material risks, which include potential constraints onliquidity and the repatriation of funds, macroeconomic, political, foreign exchange, tax and settlement risks and potential limitations on the availability of market information and there maybe tax to be levied on certain of the benefits accruing to the investor from the funds and AFM may be required to deduct and pay over to the authorities any such tax from such benefits beforepaying any balance to or for the benefit of the investor. AFM has a right to close the fund to new investors in order to manage it more efficiently in accordance with its mandate. The investorunderstands that the legal and tax environment is continually changing, and that AFM cannot be held responsible for any changes to the law which might have an effect on their investment,and which did not exist at the time their investment was made. Additional information on the fund including, but not limited to, brochures, application forms, annual and half-yearly reportsare available free of charge from the AFM website or from AFM upon request. AFM is a registered Collective Investment Scheme Manager and a full member of the Association for Savingsand Investment SA. This document is a Minimum Disclosure Document (MDD) in terms of the Advertising, Marketing and Information Disclosure requirements for Collective InvestmentSchemes published by the Financial Services Board. MDD issue date: 15 November 2017
Contact detailsManagement Company
Absa Fund Managers LimitedReg no 1991/000881/06 Absa Sandton South Campus, 15 Alice Lane, Sandton, 2196 Private Bag X10056, Sandton, 2146 Contact Centre: 0860 111 456 Fax: 0860 212 123 Email: [email protected] Website: www.absa.co.za/wim
Trustees
Société Générale Johannesburg BranchPO Box 6872, Johannesburg, 2000
Asset Manager
Absa Asset ManagementAn authorised financial services provider, FSP No: 522 Telephone: +27 (0)11 243 4563 Website:www.absa.co.za/wim
Absa Large Cap Fund

Wealth and Investment Management
Absa Large Cap Fund Fund Commentary30 September 2017
Commentary DocumentThe Absa Large Cap Fund had a relatively soft third quarter with the fund returning 7.7% compared to its benchmark which delivered 10.0%. We however, continueto strive to deliver long term performance as demonstrated by the 10 year annualized relative performance of 10.9% when compared to its benchmark of 9.2%. Contributing positively to relative performance this quarter where overweight positions in Greenbay and Glencor and underweight positions in Remgro, Vodacomand Intu Properties. The third quarter was another exciting period for world markets as we saw US politics unfold, the US Fed single the unwind of its balance sheet, US Korean tensionsand German elections. Markets shrugged off concerns around geopolitics, instead seeing signs of a more synchronized global growth recovery led by the US, whichhas seen the S&P 500 recording new highs. Although we are still in a world of very accommodating monetary policy, the tide has turned and as was signaled by the US Fed there are further rate hikes to come,with one perhaps in December this year. Global markets have continued to perform well after the reasonable start to the year in the first half of the year and therehas been support for the “risk on trade”. This has been driven by a more positive view of global growth, and strong performances in the technology sector. The oilprice has found support around current levels despite concerns around demand and the commitment of Opec members to stick to agreed cuts in production, whilethe rig count in the US showed a strong recovery. Global geopolitics remains a risk for markets with the uncertainty of the Trump presidency, Brexit negotiationsand US tensions with North Korea. There is some concern building for commodities as we have seen inflation in China rise while money supply tightens and thiscould lead to softness in fixed capital investment in China. In the third quarter SA economic news was dominated by politics, rating downgrades and rand volatility. The rand traded a range of between R12.74 to R13.71 tothe US dollar during the quarter. Inflation pressures may have continued to ease in the quarter as demand remains soft in the economy and we emerged from thedrought in parts of the country, but currency volatility remains a risk to inflation looking ahead. We saw the South African Reserve Bank cut rates in July by 0.25%but it did not continue to cut rates at the September MPC meeting. Retail sales reported at the start of the quarter for July were a disappointment with a year-on-year contraction of 1.8%, following a strong end to the second quarter. However, business confidence is poor due to political and policy uncertainty and this sawthe economy official go into recession this year. Therefore despite economists anticipating a recovery in GDP for SA driven off the weak base of 2016 theseexpectations have moderated. On a long-term basis industrial equities are looking relatively expensive, while financials seem to be offering some value. Banks rallied in the quarter after the interestrate cut, but towards the end of the quarter they gave some of this performance back. The outlook for resources is perhaps mixed depending on particular commodityexposures with some concerns around iron ore.
DisclosuresCollective Investment Schemes (CIS) are generally medium to long-term investments. The value of participatory interests may go down as well as up and pastperformance is not necessarily a guide to future performance. Fluctuations or movements in exchange rates may cause the value of underlying international investmentsin a fund to move up or down. Forward pricing is used. CIS are traded at ruling prices. Absa Fund Managers Limited (AFM) may borrow up to 10% (ten per cent) ofthe market value of a fund to accommodate insufficient liquidity. Securities in a fund may be lent to borrowers. Income from the fund is distributed semi-annually andmay only be paid out into an account as nominated by the investor. Prices are calculated on a net asset value (NAV) basis which is the total value of all assets in a fundincluding any income accrual and less permissible deductions from the fund. Prices are published daily and are available at www.Absa.co.za⁄Absacoza⁄indices⁄Absaunit-Trusts and in daily newspapers, or from AFM upon request. Fees and charges associated with the most expensive class are available directly from AFM for Investmentby members of the public, other than financial institutions. CIS are financial products and not investments in insurance policies with an insurer and therefore cooling-off periods do not apply. AFM does not provide any guarantee either with respect to the capital or the return of a fund. The directors and personnel of AFM may beinvested in any of the funds. AFM holds professional indemnity cover. AFM utilises Absa Bank Limited’s electronic and telephone banking platform. All requests fortransactions received on or before 16:00 every day will traded at ruling prices and valued after 16:00 on that day. Investments in funds with foreign securities mayinvolve various material risks, which include potential constraints on liquidity and the repatriation of funds, macroeconomic, political, foreign exchange, tax andsettlement risks and potential limitations on the availability of market information and there may be tax to be levied on certain of the benefits accruing to the investorfrom the funds and AFM may be required to deduct and pay over to the authorities any such tax from such benefits before paying any balance to or for the benefit ofthe investor. AFM has a right to close the fund to new investors in order to manage it more efficiently in accordance with its mandate. The investor understands thatthe legal and tax environment is continually changing, and that AFM cannot be held responsible for any changes to the law which might have an effect on theirinvestment, and which did not exist at the time their investment was made. Additional information on the fund including, but not limited to, brochures, applicationforms, annual and half-yearly reports are available free of charge from the AFM website or from AFM upon request. AFM is a registered Collective Investment SchemeManager and a full member of the Association for Savings and Investment SA. This document is a Minimum Disclosure Document (MDD) in terms of the Advertising,Marketing and Information Disclosure requirements for Collective Investment Schemes published by the Financial Services Board. MDD issue date: 15 November 2017
Contact details
Management Company
Absa Fund Managers LimitedReg no 1991/000881/06 Absa Sandton South Campus, 15 Alice Lane, Sandton, 2196 Private Bag X10056, Sandton, 2146 Contact Centre: 0860 111 456 Fax: 0860 212 123 Email: [email protected] Website: www.absa.co.za/wim
Trustees
Société Générale Johannesburg BranchPO Box 6872, Johannesburg, 2000
Asset Manager
Absa Asset ManagementAn authorised financial services provider, FSP No: 522 Telephone: +27 (0)11 243 4563 Website:www.absa.co.za/wim
Absa Large Cap Fund

Wealth and Investment Management
Absa Euro Income Fund Minimum disclosure documentMonth ended 31 October 2017
Fund detailsIndustry category Regional - Interest Bearing - Short TermBenchmark Euro 3 Months Interest Settlement RateFund launch date 20 November 2006Class A launch Date 20 November 2006Fund Size R 20.1 MillionJSE code ABEIFund Manager Greg Kettles – B Com (Hons), CA(SA), CFA
Juan Bekker – SAIFMAsset Manager Absa Asset Management (Pty) LtdMinimum lump sum R 2000Minimum Monthly R 200
Income distributions - cents per unit (cpu)Class A
the 3 months ended 31 Dec 2016 0the 3 months ended 31 Mar 2017 0the 3 months ended 30 Jun 2017 1.43the 3 months ended 30 Sep 2017 2.01
Income declaration 31 Mar, 30 Jun, 30 Sep & 31 DecIncome distributions 15 Apr, 15 Jul, 15 Oct & 15 Jan
Fees and Cost ratio (VAT incl.)Fees Class AInitial Fees: Absa: 0%
Adviser: 1.14%Annual Fees: Management: 0.86%
Adviser: 1.14%Performance Fee: No
Costs (annual, based on period shown) Class AFor the period to 30-06-2017, from: 01/07/2014Total expense ratio (TER): 0.88%Transaction costs (TC): 0.06%Total investment charges (TER+TC): 0.94%Please refer to Disclosure section on next page for further information on Fees and Costs
PerformancePerformance: annualised total returns (%)Term Class A Benchmark Sector
AverageRank Rand/Euro
Launch 5.43 6.53 5.26 4/6 6.581 Year 9.76 10.94 6.92 2/6 10.943 Year 5.02 5.73 5.27 4/6 5.725 Year 6.87 7.78 7.50 4/6 7.7810 Year 5.67 6.62 5.82 4/6 6.61
Performance Yearly returns (%)1 yr ending: Oct'17 Oct'16 Oct'15 Oct'14 Oct'13 Oct'12 Oct'11 Oct'10Class A 9.76 -4.05 9.98 0.53 19.74 3.60 12.82 -15.21Benchmark 10.94 -3.11 9.96 1.33 21.47 2.61 14.83 -14.99Rand/Euro 10.94 -3.12 9.95 1.32 21.48 2.56 14.84 -14.97Sector Average & Rank: applies to the A Class.Please refer to the Disclosure section on the next page for further information on calculation methodology and sourceof all performance data content (tables and/or charts) of this MDD.
Fund objectivesThe Absa Euro Income Fund will be an income portfolio with its primary objectiveto provide the investor with a consistent foreign income that is higher thandeposits in Euro-trading banks in the form of interest as well as currency ratemovement income opportunities over the short to medium terms.
Fund strategyThe Absa Euro Income fund is a rand denominated income fund, which investsin Euro-denominated interest-bearing securities. Both capital and interest will beexposed to currency fluctuations. The majority of the securities included in thefund will consist of foreign non-equity securities denominated in European Unioneuro. Capital invested in Euros will be protected whilst its movement against theRand could be speculative at a medium to high risk to investors. The portfolio willpurchase securities in Euro currency but the participatory interests of the portfoliowill be denominated in South African Rand.
Fund features• Rand-denominated offshore fund, which offers protection against
depreciating Rand• Offers currency and geographical diversification• Investor capital is exposed to currency movement risk• Suitable for investors who require income and seek offshore exposure to the
euro market
Fund specific risksConcentration: Investments may be primarily concentrated in specific areas (e.g.countries/geographical regions and/or industry sectors), in terms of investmentstyle (e.g. income or growth), in individual holdings and/or in a number of otherways. This may mean the value of the Fund may decrease whilst more broadlyinvested funds might grow. Currency exchange: Changes in the relative values ofdifferent currencies may adversely affect the value of the Fund's investments andany related income. Interest rate: The value of fixed income investments (e.g.bonds) tends to decrease when interest rates and/or inflation rises.
Risk profile and advisable minimum termLow Low-Medium Medium Medium-High High
3 Months + 6 Months + 2 Years + 3 Years + Varies*
Risk statisticsClass A Since Inception (20 Novermber 2006)Number of positive months 71/131Highest 1 Year Performance 31/10/2008 38.99%Lowest 1 Year Performance 28/02/2017 -20.91%
Cumulative performance (5 years)
Absa Euro Income Fund A Euro/Rand Euro 3 Month Interest Settlement Rate
85
100
115
130
145
160
Oct-12
Dec-12
Jun-13
Dec-13
Jun-14
Dec-14
Jun-15
Dec-15
Jun-16
Dec-16
Jun-17
Oct-17
The chart reflects the value (monthly data points) of a R100 investment made on the01/11/2012
Absa Euro Income Fund

Wealth and Investment Management
Asset Allocation (%)
3,20%
96,80%
RSA cash
Euro cash
Issuer Exposure (%)Nedcor Ltd 84.43HSBC 14.09JPMorgan 1.48
Quarterly fund commentary as at 30 September 2017The Fund Commentary is provided on a quarterly basis and can be found on www.absa.co.za/WIM under Unit Trusts Minimum Disclosure Documents. The latest quarterly commentaryavailable is for the quarter ending 30 September 2017.
DisclosuresClass A Adviser annual fee is not included in the annual management fee, it is charged by a way of unit reduction.
Costs: Total Expense Ratio (“TER”) is expressed as an annualised percentage of the value of the Class of the portfolio that was incurred as expenses relating to the administration of theportfolio. A higher TER does not necessarily imply a poor return, nor does a lower TER imply a good return. The current TER cannot be regarded as an accurate indication of future TER's.Transaction Costs (“TC”) is expressed as an annualised percentage of the value of the portfolio that was incurred as costs relating to the buying and selling of the assets underlying theportfolio. TC are a necessary cost in administering the portfolio and impact returns. TC should not be considered in isolation as returns may be impacted by many other factors over timeincluding market returns, the type of portfolio, the investment decisions of the investment manager and the TER. Note that the total investment charges (TER+TC) have already been deductedprior to the calculation of the performance figures shown. Effective Annual Cost (“EAC”) is a measure that summarises the total cost that an investor incurs through their investment in aparticular financial product, based on the principles set out in the ASISA EAC standard. EAC data is available on request.
Performance: Performance is calculated for the portfolio⁄class of portfolios. Illustrative performance information is included for illustrative purposes only; individual investor performance maydiffer as a result of initial and ongoing fees, the actual investment date, the date of reinvestment and dividend withholding tax. All figures quoted are from Morningstar and⁄or IRESS, for theperiod ending 31/10/2017 (unless otherwise stated), calculated on a NAV to NAV basis, with income distributions reinvested on the ex-dividend date. Annualised figures refer to the averageyearly return of an investment over a given time period, all actual annual figures (if not shown) are available on request.
Collective Investment Schemes (CIS) are generally medium to long-term investments. The value of participatory interests may go down as well as up and past performance is not necessarilya guide to future performance. Fluctuations or movements in exchange rates may cause the value of underlying international investments in a fund to move up or down. Forward pricing isused. CIS are traded at ruling prices. Absa Fund Managers Limited (AFM) may borrow up to 10% (ten per cent) of the market value of a fund to accommodate insufficient liquidity. Securitiesin a fund may be lent to borrowers. Income from the fund is distributed quarterly and may only be paid out into an account as nominated by the investor. Prices are calculated on a net assetvalue (NAV) basis which is the total value of all assets in a fund including any income accrual and less permissible deductions from the fund. Prices are published daily and are available atwww.absa.co.za/Absacoza/Indices/AbsaUnit-Trusts and in daily newspapers, or from AFM upon request. Fees and charges associated with the most expensive class are available directlyfrom AFM for investment by members of the public, other than financial institutions. CIS are financial products and not investments in insurance policies with an insurer and therefore cooling-off periods do not apply. AFM does not provide any guarantee either with respect to the capital or the return of a fund. The directors and personnel of AFM may be invested in any of thefunds. AFM holds professional indemnity cover. AFM utilises Absa Bank Limited’s electronic and telephone banking platform. All requests for transactions received on or before 16:00 everyday will traded at ruling prices and valued after 16:00 on that day. Investments in funds with foreign securities may involve various material risks, which include potential constraints onliquidity and the repatriation of funds, macroeconomic, political, foreign exchange, tax and settlement risks and potential limitations on the availability of market information and there maybe tax to be levied on certain of the benefits accruing to the investor from the funds and AFM may be required to deduct and pay over to the authorities any such tax from such benefits beforepaying any balance to or for the benefit of the investor. AFM has a right to close the fund to new investors in order to manage it more efficiently in accordance with its mandate. The investorunderstands that the legal and tax environment is continually changing, and that AFM cannot be held responsible for any changes to the law which might have an effect on their investment,and which did not exist at the time their investment was made. Additional information on the fund including, but not limited to, brochures, application forms, annual and half-yearly reportsare available free of charge from the AFM website or from AFM upon request. AFM is a registered Collective Investment Scheme Manager and a full member of the Association for Savingsand Investment SA. This document is a Minimum Disclosure Document (MDD) in terms of the Advertising, Marketing and Information Disclosure requirements for Collective InvestmentSchemes published by the Financial Services Board. MDD issue date: 15 November 2017
Contact detailsManagement Company
Absa Fund Managers LimitedReg no 1991/000881/06 Absa Sandton South Campus, 15 Alice Lane, Sandton, 2196 Private Bag X10056, Sandton, 2146 Contact Centre: 0860 111 456 Fax: 0860 212 123 Email: [email protected] Website: www.absa.co.za/wim
Trustees
Société Générale Johannesburg BranchPO Box 6872, Johannesburg, 2000
Asset Manager
Absa Asset ManagementAn authorised financial services provider, FSP No: 522 Telephone: +27 (0)11 243 4563 Website:www.absa.co.za/wim
Absa Euro Income Fund

Wealth and Investment Management
Absa Euro Income Fund Fund Commentary30 September 2017
Commentary DocumentAt its June meeting the European Central Bank (ECB) kept its deposit rate unchanged at -0.4% and confirmed that its monthly asset purchase programme wouldcontinue at 60bn Euros a month until at least December this year. Subsequent comments from President Draghi that he sees room for paring stimulus without tightening policy suggested that the ECB is preparing to taper itsquantitative easing programme in response to accelerating growth. His comments were perceived to be largely hawkish by the markets, which led to a global bondyield sell off while the Euro soared. Consequently the market has now brought forward the expectation of the first 10 basis point rate increase to the September 2018meeting, as opposed to the previous forecast in January 2018. The ECB’s inflation forecast this year is at 1.5% down from a previous forecast of 1.7% and still short of its target of 2.0% The Euro soared against the US Dollar from around 1.065 to 1.143 at the beginning of the quarter. The Rand strengthened marginally against the Euro to close at14.30 from 14.35. Short term rates sold off sharply on the hawkish interpretation of ECB President Draghi’s comments.
DisclosuresCollective Investment Schemes (CIS) are generally medium to long-term investments. The value of participatory interests may go down as well as up and pastperformance is not necessarily a guide to future performance. Fluctuations or movements in exchange rates may cause the value of underlying international investmentsin a fund to move up or down. Forward pricing is used. CIS are traded at ruling prices. Absa Fund Managers Limited (AFM) may borrow up to 10% (ten per cent) ofthe market value of a fund to accommodate insufficient liquidity. Securities in a fund may be lent to borrowers. Income from the fund is distributed quarterly and mayonly be paid out into an account as nominated by the investor. Prices are calculated on a net asset value (NAV) basis which is the total value of all assets in a fundincluding any income accrual and less permissible deductions from the fund. Prices are published daily and are available at www.absa.co.za/Absacoza/Indices/AbsaUnit-Trusts and in daily newspapers, or from AFM upon request. Fees and charges associated with the most expensive class are available directly from AFM forinvestment by members of the public, other than financial institutions. CIS are financial products and not investments in insurance policies with an insurer and thereforecooling-off periods do not apply. AFM does not provide any guarantee either with respect to the capital or the return of a fund. The directors and personnel of AFMmay be invested in any of the funds. AFM holds professional indemnity cover. AFM utilises Absa Bank Limited’s electronic and telephone banking platform. All requestsfor transactions received on or before 16:00 every day will traded at ruling prices and valued after 16:00 on that day. Investments in funds with foreign securities mayinvolve various material risks, which include potential constraints on liquidity and the repatriation of funds, macroeconomic, political, foreign exchange, tax andsettlement risks and potential limitations on the availability of market information and there may be tax to be levied on certain of the benefits accruing to the investorfrom the funds and AFM may be required to deduct and pay over to the authorities any such tax from such benefits before paying any balance to or for the benefit ofthe investor. AFM has a right to close the fund to new investors in order to manage it more efficiently in accordance with its mandate. The investor understands thatthe legal and tax environment is continually changing, and that AFM cannot be held responsible for any changes to the law which might have an effect on theirinvestment, and which did not exist at the time their investment was made. Additional information on the fund including, but not limited to, brochures, applicationforms, annual and half-yearly reports are available free of charge from the AFM website or from AFM upon request. AFM is a registered Collective Investment SchemeManager and a full member of the Association for Savings and Investment SA. This document is a Minimum Disclosure Document (MDD) in terms of the Advertising,Marketing and Information Disclosure requirements for Collective Investment Schemes published by the Financial Services Board. MDD issue date: 15 November 2017
Contact details
Management Company
Absa Fund Managers LimitedReg no 1991/000881/06 Absa Sandton South Campus, 15 Alice Lane, Sandton, 2196 Private Bag X10056, Sandton, 2146 Contact Centre: 0860 111 456 Fax: 0860 212 123 Email: [email protected] Website: www.absa.co.za/wim
Trustees
Société Générale Johannesburg BranchPO Box 6872, Johannesburg, 2000
Asset Manager
Absa Asset ManagementAn authorised financial services provider, FSP No: 522 Telephone: +27 (0)11 243 4563 Website:www.absa.co.za/wim
Absa Euro Income Fund

Wealth and Investment Management
Absa Sterling Income Fund Minimum disclosure documentMonth ended 31 October 2017
Fund detailsIndustry category Regional - Interest Bearing - Short TermBenchmark UK 3 Month BBA Interest Settlement RateFund launch date 20 November 2006Class A launch Date 20 November 2006Fund Size R 107.92 MillionJSE code ABPSFund Manager Greg Kettles – B Com (Hons), CA(SA), CFA
Juan Bekker – SAIFMAsset Manager Absa Asset Management (Pty) LtdMinimum lump sum R 2000Minimum Monthly R 200
Income distributions - cents per unit (cpu)Class A
the 3 months ended 31 Dec 2016 0the 3 months ended 31 Mar 2017 0the 3 months ended 30 Jun 2017 0.17the 3 months ended 30 Sep 2017 3.69
Income declaration 31 Mar, 30 Jun, 30 Sep & 31 DecIncome distributions 15 Apr, 15 Jul, 15 Oct & 15 Jan
Fees and Cost ratio (VAT incl.)Fees Class AInitial Fees: Absa: 0%
Adviser: 1.14%Annual Fees: Management: 0.86%
Adviser: 0-1.14%Performance Fee: No
Costs (annual, based on period shown) Class AFor the period to 30-06-2017, from: 01/07/2014Total expense ratio (TER): 0.88%Transaction costs (TC): 0.03%Total investment charges (TER+TC): 0.91%Please refer to Disclosure section on next page for further information on Fees and Costs
PerformancePerformance: annualised total returns (%)Term Class A Benchmark Sector
AverageRank Rand/Sterling
Launch 3.34 4.57 5.26 6/6 4.581 Year 12.30 14.28 6.92 1/6 14.283 Year 1.80 2.55 5.27 6/6 2.555 Year 5.56 6.57 7.50 6/6 6.5710 Year 3.50 4.53 5.82 6/6 4.53
Performance Yearly returns (%)1 yr ending: Oct'17 Oct'16 Oct'15 Oct'14 Oct'13 Oct'12 Oct'11 Oct'10Class A 12.30 -22.13 20.66 9.02 13.94 12.03 12.39 -13.05Benchmark 14.28 -22.24 21.37 9.97 15.90 10.30 14.96 -12.12Rand/Sterling 14.28 -22.25 21.38 9.97 15.90 10.29 14.97 -12.10Sector Average & Rank: applies to the A Class.Please refer to Disclosures section on next page for further information on calculation methodologyand source of all performance data content (tables and/or charts) of this MDD
Fund objectivesThe primary objective of the fund is to provide the investor with a consistentforeign income that is higher than deposits in Sterling Pound trading banks in theform of interest as well as currency rate movement income opportunities overthe short to medium term.
Fund strategyThe fund invests mainly in British pound-denominated interest-bearingsecurities. Both capital and interest will be exposed to currency fluctuations. Themajority of securities included in the fund will consist of foreign non- equitysecurities denominated in United Kingdom (UK) Pound Sterling. Capital investedin UK Pound Sterling will be protected, while its movement against the rand couldbe speculative at a medium to high-risk to investors. The fund will purchasesecurities in UK Sterling Pound currency, but the participatory interests in theportfolio will be denominated in South African Rand
Fund features• Rand-denominated offshore fund, which offers protection against
depreciating Rand• Offers currency and geographical diversification• Investor’s capital is exposed to currency movement risk• Suitable for investors who require income and seek offshore exposure to the
Pound Sterling market
Fund specific risksConcentration: Investments may be primarily concentrated in specific areas (e.g.countries/geographical regions and/or industry sectors), in terms of investmentstyle (e.g. income or growth), in individual holdings and/or in a number of otherways. This may mean the value of the Fund may decrease whilst more broadlyinvested funds might grow. Currency exchange: Changes in the relative values ofdifferent currencies may adversely affect the value of the Fund's investments andany related income. Interest rate: The value of fixed income investments (e.g.bonds) tends to decrease when interest rates and/or inflation rises.
Risk profile and advisable minimum termLow Low-Medium Medium Medium-High High
3 Months + 6 Months + 2 Years + 3 Years + 5 Years +
Risk statisticsClass A Since Inception (20 November 2006)Number of positive months 66/131Highest 1 Year Performance 31/01/2014 30.58%Lowest 1 Year Performance 28/02/2017 -26.69%
Cumulative performance (5 years)
Absa Sterling Income A Rand/Sterling UK 3m BBA ISR/Stlg 90d Deposit (in ZAR)
80
100
120
140
160
180
Oct-12
Dec-12
Mar-13
Jun-13
Sep-13
Dec-13
Mar-14
Jun-14
Sep-14
Dec-14
Mar-15
Jun-15
Sep-15
Dec-15
Mar-16
Jun-16
Sep-16
Dec-16
Mar-17
Jun-17
Oct-17
The chart reflects the value (monthly data points) of a R100 investment made on the01/11/2012
Absa Sterling Income Fund

Wealth and Investment Management
Asset Allocation (%)
10,20%
89,80%
RSA cash
Sterling cash
Issuer Exposure (%)Absa Group Ltd 38.63Standard Bank of SA 29.02Nedcor Ltd 28.99JPMorgan 2.84HSBC 0.52
Quarterly fund commentary as at 30 September 2017The Fund Commentary is provided on a quarterly basis and can be found on www.absa.co.za/WIM under Unit Trusts Minimum Disclosure Documents. The latest quarterly commentaryavailable is for the quarter ending 30 September 2017.
DisclosuresFees: Class A Adviser annual fee is not included in the annual management fee, it is charged by a way of unit reduction.
Costs: Total Expense Ratio (“TER”) is expressed as an annualised percentage of the value of the Class of the portfolio that was incurred as expenses relating to the administration of theportfolio. A higher TER does not necessarily imply a poor return, nor does a lower TER imply a good return. The current TER cannot be regarded as an accurate indication of future TER's.Transaction Costs (“TC”) is expressed as an annualised percentage of the value of the portfolio that was incurred as costs relating to the buying and selling of the assets underlying theportfolio. TC are a necessary cost in administering the portfolio and impact returns. TC should not be considered in isolation as returns may be impacted by many other factors over timeincluding market returns, the type of portfolio, the investment decisions of the investment manager and the TER. Note that the total investment charges (TER+TC) have already been deductedprior to the calculation of the performance figures shown. Effective Annual Cost (“EAC”) is a measure that summarises the total cost that an investor incurs through their investment in aparticular financial product, based on the principles set out in the ASISA EAC standard. EAC data is available on request.
Performance: Performance is calculated for the portfolio⁄class of portfolios. Illustrative performance information is included for illustrative purposes only; individual investor performance maydiffer as a result of initial and ongoing fees, the actual investment date, the date of reinvestment and dividend withholding tax. All figures quoted are from Morningstar and⁄or IRESS, for theperiod ending 31/10/2017 (unless otherwise stated), calculated on a NAV to NAV basis, with income distributions reinvested on the ex-dividend date. Annualised figures refer to the averageyearly return of an investment over a given time period, all actual annual figures (if not shown) are available on request.
Collective Investment Schemes (CIS) are generally medium to long-term investments. The value of participatory interests may go down as well as up and past performance is not necessarilya guide to future performance. Fluctuations or movements in exchange rates may cause the value of underlying international investments In a fund to move up or down. Forward pricing isused. CIS are traded at ruling prices. Absa Fund Managers Limited (AFM) may borrow up to 10% (ten per cent) of the market value of a fund to accommodate insufficient liquidity. Securitiesin a fund may be lent to borrowers. Income from the fund is distributed quarterly and may only be paid out into an account as nominated by the investor. Prices are calculated on a net assetvalue (NAV) basis which is the total value of all assets in a fund including any income accrual and less permissible deductions from the fund. Prices are published daily and are available atwww.absa.co.za/Absacoza/Indices/Absa-Unit-Trusts And in daily newspapers, or from AFM upon request. Fees and charges associated with the most expensive class are available directlyfrom AFM for investment by members of the public, other than financial institutions. CIS are financial products and not investments in insurance policies with an insurer and therefore cooling-off periods do not apply. AFM does not provide any guarantee either with respect to the capital or the return of a fund. The directors and personnel of AFM may be invested In any of thefunds. AFM holds professional indemnity cover. AFM utilises Absa Bank Limited’s electronic and telephone banking platform. All requests for transactions received on or before 16:00 everyday will traded at ruling prices and valued after 16:00 on that day. Investments in funds with foreign securities may involve various material risks, which include potential constraints onliquidity and the repatriation of funds, macroeconomic, political, foreign exchange, tax and settlement risks and Potential limitations on the availability of market information and there maybe tax to be levied on certain of the benefits accruing to the investor from the funds and AFM may be required to deduct and pay over to the authorities any such tax from such benefits beforepaying any balance to or for the benefit of the investor. AFM has a right to close the fund to new investors in order to manage it more efficiently in accordance with its mandate. The investorunderstands that the legal and tax environment is continually changing, and that AFM cannot be held responsible for any changes to the law which might have an effect on their investment,and which did not exist at the time their investment was made. Additional information on the fund including, but not limited to, brochures, application forms, annual and half-yearly reportsare available free of charge from the AFM website or from AFM upon request. AFM is a registered Collective Investment Scheme Manager and a full member of the Association for Savingsand Investment SA. This document is a Minimum Disclosure Document (MDD) in terms of the Advertising, Marketing and Information Disclosure requirements for Collective InvestmentSchemes published by the Financial Services Board. MDD issue date: 15 November 2017
Contact detailsManagement Company
Absa Fund Managers LimitedReg no 1991/000881/06 Absa Sandton South Campus, 15 Alice Lane, Sandton, 2196 Private Bag X10056, Sandton, 2146 Contact Centre: 0860 111 456 Fax: 0860 212 123 Email: [email protected] Website: www.absa.co.za/wim
Trustees
Société Générale Johannesburg BranchPO Box 6872, Johannesburg, 2000
Asset Manager
Absa Asset ManagementAn authorised financial services provider, FSP No: 522 Telephone: +27 (0)11 243 4563 Website:www.absa.co.za/wim
Absa Sterling Income Fund

Wealth and Investment Management
Absa Sterling Income Fund Fund Commentary30 September 2017
Commentary DocumentThe Bank of England’s Monetary Policy Committee (MPC) kept rates on hold in September as expected with a 7-2 split in the vote to keep rates unchanged at 0.25%.The accompanying statement however was quiet hawkish, with the Bank reiterating that monetary policy could be tightened “by a somewhat greater extent” thanmarket rates implied. The Central Bank added that it would target reducing stimulus in the months to come. The British Pound rallied and bond yields spiked higher after the Bank of England’s hawkish rhetoric, as market moved to fully discount an interest rate hike early in2018. The US Dollar traded 1.34 against the Pound from 1.30 at the beginning of the quarter. The Rand therefore weakened against the Pound ending the quarterat 18.16 from 17.03. Short term interest rates also traded higher over the quarter.
DisclosuresCollective Investment Schemes (CIS) are generally medium to long-term investments. The value of participatory interests may go down as well as up and pastperformance is not necessarily a guide to future performance. Fluctuations or movements in exchange rates may cause the value of underlying international investmentsIn a fund to move up or down. Forward pricing is used. CIS are traded at ruling prices. Absa Fund Managers Limited (AFM) may borrow up to 10% (ten per cent) ofthe market value of a fund to accommodate insufficient liquidity. Securities in a fund may be lent to borrowers. Income from the fund is distributed quarterly and mayonly be paid out into an account as nominated by the investor. Prices are calculated on a net asset value (NAV) basis which is the total value of all assets in a fundincluding any income accrual and less permissible deductions from the fund. Prices are published daily and are available at www.absa.co.za/Absacoza/Indices/Absa-Unit-Trusts And in daily newspapers, or from AFM upon request. Fees and charges associated with the most expensive class are available directly from AFM forinvestment by members of the public, other than financial institutions. CIS are financial products and not investments in insurance policies with an insurer and thereforecooling-off periods do not apply. AFM does not provide any guarantee either with respect to the capital or the return of a fund. The directors and personnel of AFMmay be invested In any of the funds. AFM holds professional indemnity cover. AFM utilises Absa Bank Limited’s electronic and telephone banking platform. All requestsfor transactions received on or before 16:00 every day will traded at ruling prices and valued after 16:00 on that day. Investments in funds with foreign securities mayinvolve various material risks, which include potential constraints on liquidity and the repatriation of funds, macroeconomic, political, foreign exchange, tax andsettlement risks and Potential limitations on the availability of market information and there may be tax to be levied on certain of the benefits accruing to the investorfrom the funds and AFM may be required to deduct and pay over to the authorities any such tax from such benefits before paying any balance to or for the benefit ofthe investor. AFM has a right to close the fund to new investors in order to manage it more efficiently in accordance with its mandate. The investor understands thatthe legal and tax environment is continually changing, and that AFM cannot be held responsible for any changes to the law which might have an effect on theirinvestment, and which did not exist at the time their investment was made. Additional information on the fund including, but not limited to, brochures, applicationforms, annual and half-yearly reports are available free of charge from the AFM website or from AFM upon request. AFM is a registered Collective Investment SchemeManager and a full member of the Association for Savings and Investment SA. This document is a Minimum Disclosure Document (MDD) in terms of the Advertising,Marketing and Information Disclosure requirements for Collective Investment Schemes published by the Financial Services Board. MDD issue date: 15 November 2017
Contact details
Management Company
Absa Fund Managers LimitedReg no 1991/000881/06 Absa Sandton South Campus, 15 Alice Lane, Sandton, 2196 Private Bag X10056, Sandton, 2146 Contact Centre: 0860 111 456 Fax: 0860 212 123 Email: [email protected] Website: www.absa.co.za/wim
Trustees
Société Générale Johannesburg BranchPO Box 6872, Johannesburg, 2000
Asset Manager
Absa Asset ManagementAn authorised financial services provider, FSP No: 522 Telephone: +27 (0)11 243 4563 Website:www.absa.co.za/wim
Absa Sterling Income Fund

Wealth and Investment Management
Absa US Dollar Income Fund Minimum disclosure documentMonth ended 31 October 2017
Fund detailsIndustry category Regional - Interest Bearing - Short TermBenchmark US Dollar 90 Day Deposit RateFund launch date 20 November 2006Class A launch Date 20 November 2006Fund Size R 103.78 MillionJSE code ABUDFund Manager Greg Kettles – B Com (Hons), CA(SA), CFA
Juan Bekker – SAIFMAsset Manager Absa Asset Management (Pty) LtdMinimum lump sum R 2000Minimum Monthly R 200
Income distributions - cents per unit (cpu)Class A
the 3 months ended 31 Dec 2016 0the 3 months ended 31 Mar 2017 0.21the 3 months ended 30 Jun 2017 0the 3 months ended 30 Sep 2017 0
Income declaration 31 Mar, 30 Jun, 30 Sep & 31 DecIncome distributions 15 Apr, 15 Jul, 15 Oct & 15 Jan
Fees and Cost ratio (VAT incl.)Fees Class AInitial Fees: Absa: 0%
Adviser: 1.14%Annual Fees: Management: 0.86%
Adviser: 0-1.14%Performance Fee: No
Costs (annual, based on period shown) Class AFor the period to 30-06-2017, from: 01/07/2014Total expense ratio (TER): 0.88%Transaction costs (TC): 0.03%Total investment charges (TER+TC): 0.91%Please refer to Disclosure section on next page for further information on Fees and Costs
PerformancePerformance: annualised total returns (%)Term Class A Benchmark Sector
AverageRank Rand/US
DollarLaunch 6.67 7.51 5.26 1/6 7.861 Year 5.27 5.72 6.92 4/6 5.723 Year 8.62 9.16 5.27 2/6 9.165 Year 9.92 10.66 7.50 1/6 10.6610 Year 8.09 8.78 5.82 1/6 8.77
Performance Yearly returns (%)1 yr ending: Oct'17 Oct'16 Oct'15 Oct'14 Oct'13 Oct'12 Oct'11 Oct'10Class A 5.27 -2.24 24.53 9.35 14.52 10.51 11.34 -10.09Benchmark 5.72 -1.94 25.49 9.75 16.24 9.40 14.19 -10.26Rand/US Dollar 5.72 -1.95 25.48 9.76 16.23 9.45 14.20 -10.26Sector Average & Rank: applies to the A Class.Please refer to Disclosures section on next page for further information on calculation methodologyand source of all performance data content (tables and/or charts) of this MDD
Fund objectivesThe primary objective is to provide the investor with a consistent foreign incomethat is higher than deposits in United States Dollar trading banks. Income will bein the form of interest as well as currency rate movement income opportunitiesover the short to medium terms through investment in non- equity securitiesdenominated in United States of America Dollars.
Fund strategyThe fund invests mainly in US dollar-denominated interest-bearing securities.Both capital and interest will be exposed to currency fluctuations. The portfoliowill purchase securities in United States of America Dollars currency but theparticipatory interests of the portfolio will be denominated in South African Rand.Capital invested in United States Dollars will be protected whilst movementagainst the rand would be speculative at a medium to high risk to investors.
Fund features• Rand-denominated offshore fund, which offers protection against
depreciating Rand• Offers currency and geographical diversification• Investor’s capital is exposed to currency movement risk• Suitable for investors who require income and seek offshore exposure to the
US Dollar market
Fund specific risksConcentration: Investments may be primarily concentrated in specific areas (e.g.countries/geographical regions and/or industry sectors), in terms of investmentstyle (e.g. income or growth), in individual holdings and/or in a number of otherways. This may mean the value of the Fund may decrease whilst more broadlyinvested funds might grow. Currency exchange: Changes in the relative values ofdifferent currencies may adversely affect the value of the Fund's investments andany related income. Interest rate: The value of fixed income investments (e.g.bonds) tends to decrease when interest rates and/or inflation rises.
Risk profile and advisable minimum termLow Low-Medium Medium Medium-High High
3 Months + 6 Months + 2 Years + 3 Years + 5 Years +
Risk statisticsClass A Since Inception (20 November 2006)Number of positive months 68/131Highest 1 Year Performance 31/10/2008 56.49%Lowest 1 Year Performance 31/01/2010 -25.28%
Cumulative performance (5 years)
Absa US Dollar Income A Rand/US Dollar
70
100
130
160
190
220
Oct-12
Dec-12
Mar-13
Jun-13
Sep-13
Dec-13
Mar-14
Jun-14
Sep-14
Dec-14
Mar-15
Jun-15
Sep-15
Dec-15
Mar-16
Jun-16
Sep-16
Dec-16
Mar-17
Jun-17
Oct-17
The chart reflects the value (monthly data points) of a R100 investment made on the01/11/2012
Absa US Dollar Income Fund

Wealth and Investment Management
Asset Allocation (%)
2,76%
97,24%
RSA cash
USD cash
Issuer Exposure (%)Nedcor Ltd 70.77Standard Bank of SA 28.26HSBC 0.65JPMorgan 0.33
Quarterly fund commentary as at 30 September 2017The Fund Commentary is provided on a quarterly basis and can be found on www.absa.co.za/WIM under Unit Trusts Minimum Disclosure Documents. The latest quarterly commentaryavailable is for the quarter ending 30 September 2017.
DisclosuresFees: Class A Adviser annual fee is not included in the annual management fee, it is charged by a way of unit reduction.
Costs: Total Expense Ratio (“TER”) is expressed as an annualised percentage of the value of the Class of the portfolio that was incurred as expenses relating to the administration of theportfolio. A higher TER does not necessarily imply a poor return, nor does a lower TER imply a good return. The current TER cannot be regarded as an accurate indication of future TER's.Transaction Costs (“TC”) is expressed as an annualised percentage of the value of the portfolio that was incurred as costs relating to the buying and selling of the assets underlying theportfolio. TC are a necessary cost in administering the portfolio and impact returns. TC should not be considered in isolation as returns may be impacted by many other factors over timeincluding market returns, the type of portfolio, the investment decisions of the investment manager and the TER. Note that the total investment charges (TER+TC) have already been deductedprior to the calculation of the performance figures shown. Effective Annual Cost (“EAC”) is a measure that summarises the total cost that an investor incurs through their investment in aparticular financial product, based on the principles set out in the ASISA EAC standard. EAC data is available on request.
Performance: Performance is calculated for the portfolio⁄class of portfolios. Illustrative performance information is included for illustrative purposes only; individual investor performance maydiffer as a result of initial and ongoing fees, the actual investment date, the date of reinvestment and dividend withholding tax. All figures quoted are from Morningstar and⁄or IRESS, for theperiod ending 31/10/2017 (unless otherwise stated), calculated on a NAV to NAV basis, with income distributions reinvested on the ex-dividend date. Annualised figures refer to the averageyearly return of an investment over a given time period, all actual annual figures (if not shown) are available on request.
Collective Investment Schemes (CIS) are generally medium to long-term investments. The value of participatory interests may go down as well as up and past performance is not necessarilya guide to future performance. Fluctuations or movements in exchange rates may cause the value of underlying international investments In a fund to move up or down. Forward pricing isused. CIS are traded at ruling prices. Absa Fund Managers Limited (AFM) may borrow up to 10% (ten per cent) of the market value of a fund to accommodate insufficient liquidity. Securitiesin a fund may be lent to borrowers. Income from the fund is distributed quarterly and may only be paid out into an account as nominated by the investor. Prices are calculated on a net assetvalue (NAV) basis which is the total value of all assets in a fund including any income accrual and less permissible deductions from the fund. Prices are published daily and are available atwww.absa.co.za/Absacoza/Indices/Absa-Unit-Trusts and in daily newspapers, or from AFM upon request. Fees and charges associated with the most expensive class are available directlyfrom AFM for investment by Members of the public, other than financial institutions. CIS are financial products and not investments in insurance policies with an insurer and therefore cooling-off periods do not apply. AFM does not provide any guarantee either with respect to the capital or the return of a fund. The directors and personnel of AFM may be invested In any of thefunds. AFM holds professional indemnity cover. AFM utilises Absa Bank Limited’s electronic and telephone banking platform. All requests for transactions received on or before 16:00 everyday will traded at ruling prices and valued after 16:00 on that day. Investments in funds with foreign securities may involve various material risks, which include potential constraints onliquidity and the repatriation of funds, macroeconomic, political, foreign exchange, tax and settlement risks and Potential limitations on the availability of market information and there maybe tax to be levied on certain of the benefits accruing to the investor from the funds and AFM may be required to deduct and pay over to the authorities any such tax from such benefits beforepaying any balance to or for the benefit of the investor. AFM has a right to close the fund to new investors in order to manage it more efficiently in accordance with its mandate. The investorunderstands that the legal and tax environment is continually changing, and that AFM cannot be held responsible for any changes to the law which might have an effect on their investment,and which did not exist at the time their investment was made. Additional information on the fund including, but not limited to, brochures, application forms, annual and half-yearly reportsare available free of charge from the AFM website or from AFM upon request. AFM is a registered Collective Investment Scheme Manager and a full Member of the Association for Savingsand Investment SA. This document is a Minimum Disclosure Document (MDD) in terms of the Advertising, Marketing and Information Disclosure requirements for Collective InvestmentSchemes published by the Financial Services Board. MDD issue date: 15 November 2017
Contact detailsManagement Company
Absa Fund Managers LimitedReg no 1991/000881/06 Absa Sandton South Campus, 15 Alice Lane, Sandton, 2196 Private Bag X10056, Sandton, 2146 Contact Centre: 0860 111 456 Fax: 0860 212 123 Email: [email protected] Website: www.absa.co.za/wim
Trustees
Société Générale Johannesburg BranchPO Box 6872, Johannesburg, 2000
Asset Manager
Absa Asset ManagementAn authorised financial services provider, FSP No: 522 Telephone: +27 (0)11 243 4563 Website:www.absa.co.za/wim
Absa US Dollar Income Fund

Wealth and Investment Management
Absa US Dollar Income Fund Fund Commentary30 September 2017
Commentary DocumentThe FOMC left its benchmark interest rate unchanged in a range of 1% to 1.25% at its meeting in September, and formally announced October as the start date forits balance sheet reduction programme. US core Personal consumption expenditure (PCE) price index surprised to the downside in August, printed at 1.3% year on year from 1.4% in July, below the Fed’s2.0% goal. The continued improvement in the economy and a strong labor market has allowed the Fed to maintain a hawkish rhetoric, despite the lower inflationprint. The announcement from the Trump administration of potential tax cuts is however seen as inflationary. The Federal Reserve Bank indicated that the Bank wason track to raise interest rates again this year, with three more 25 basis point rate hikes expected in 2018. US unemployment rate has fallen to 4.2% in September from 4.4% previously. The hawkish Fed statement led to a higher conviction of a rate hike in December. This pushed bond yields and the dollar higher. The strong Dollar thus kept the Randunder pressure. The Euro rose against the US Dollar. The Dollar ended the quarter at 1.18 from around 1.14. Rand ended the quarter weaker on the back of the strongDollar to trade at 13.55 from 13.07. US 10 year treasury yield ended the quarter at 2.33% from a low of 2.04%. Short term interest rates were also pushed higher.
DisclosuresCollective Investment Schemes (CIS) are generally medium to long-term investments. The value of participatory interests may go down as well as up and pastperformance is not necessarily a guide to future performance. Fluctuations or movements in exchange rates may cause the value of underlying international investmentsIn a fund to move up or down. Forward pricing is used. CIS are traded at ruling prices. Absa Fund Managers Limited (AFM) may borrow up to 10% (ten per cent) ofthe market value of a fund to accommodate insufficient liquidity. Securities in a fund may be lent to borrowers. Income from the fund is distributed quarterly and mayonly be paid out into an account as nominated by the investor. Prices are calculated on a net asset value (NAV) basis which is the total value of all assets in a fundincluding any income accrual and less permissible deductions from the fund. Prices are published daily and are available at www.absa.co.za/Absacoza/Indices/Absa-Unit-Trusts and in daily newspapers, or from AFM upon request. Fees and charges associated with the most expensive class are available directly from AFM forinvestment by Members of the public, other than financial institutions. CIS are financial products and not investments in insurance policies with an insurer and thereforecooling-off periods do not apply. AFM does not provide any guarantee either with respect to the capital or the return of a fund. The directors and personnel of AFMmay be invested In any of the funds. AFM holds professional indemnity cover. AFM utilises Absa Bank Limited’s electronic and telephone banking platform. All requestsfor transactions received on or before 16:00 every day will traded at ruling prices and valued after 16:00 on that day. Investments in funds with foreign securities mayinvolve various material risks, which include potential constraints on liquidity and the repatriation of funds, macroeconomic, political, foreign exchange, tax andsettlement risks and Potential limitations on the availability of market information and there may be tax to be levied on certain of the benefits accruing to the investorfrom the funds and AFM may be required to deduct and pay over to the authorities any such tax from such benefits before paying any balance to or for the benefit ofthe investor. AFM has a right to close the fund to new investors in order to manage it more efficiently in accordance with its mandate. The investor understands thatthe legal and tax environment is continually changing, and that AFM cannot be held responsible for any changes to the law which might have an effect on theirinvestment, and which did not exist at the time their investment was made. Additional information on the fund including, but not limited to, brochures, applicationforms, annual and half-yearly reports are available free of charge from the AFM website or from AFM upon request. AFM is a registered Collective Investment SchemeManager and a full Member of the Association for Savings and Investment SA. This document is a Minimum Disclosure Document (MDD) in terms of the Advertising,Marketing and Information Disclosure requirements for Collective Investment Schemes published by the Financial Services Board. MDD issue date: 15 November 2017
Contact details
Management Company
Absa Fund Managers LimitedReg no 1991/000881/06 Absa Sandton South Campus, 15 Alice Lane, Sandton, 2196 Private Bag X10056, Sandton, 2146 Contact Centre: 0860 111 456 Fax: 0860 212 123 Email: [email protected] Website: www.absa.co.za/wim
Trustees
Société Générale Johannesburg BranchPO Box 6872, Johannesburg, 2000
Asset Manager
Absa Asset ManagementAn authorised financial services provider, FSP No: 522 Telephone: +27 (0)11 243 4563 Website:www.absa.co.za/wim
Absa US Dollar Income Fund
Wealth and Investment Management
Absa Global Core Equity Feeder Fund Minimum disclosure documentMonth ended 31 October 2017
Fund detailsIndustry category Global - Equity - GeneralBenchmark MSCI World IndexFund launch date 20 August 2015Class A launch Date 19 October 2015Fund Size R 7.45 BillionJSE code ABFFCAFund Manager This fund invests up to 100% in a portfolio that
is managed by SchrodersMinimum lump sum R 2000Minimum Monthly R 200
Income distributions - cents per unit (cpu)Class A
the 6 months ended 31 Dec 2016 0.34the 6 months ended 30 Jun 2017 0
Income declaration 31 DecemberIncome distributions 15 January
Fees and Cost ratio (VAT incl.)Fees Class AInitial Fees: Absa: 0%
Adviser: 0-3.42%Annual Fees: Management: 0.46%
Adviser: 0-1.14%Performance Fee: No
Costs (annual, based on period shown) Class AFor the period to 30-06-2017, from: 16-10-2015Total expense ratio (TER): 0.98%Transaction costs (TC): 0.07%Total investment charges (TER+TC): 1.05%Please refer to Disclosure section on next page for further information on Fees and Costs
PerformanceTerm Class A Benchmark Sector Average RankLaunch 14.45 16.83 14.44 20/403 month 10.69 11.94 10.90 28/556 Month 12.85 16.02 14.54 38/549 Month 16.27 21.62 20.24 42/521 Year 23.62 29.49 25.55 33/49
Performance Yearly returns (%)1 yr ending: Oct'17 Oct'16Class A 23.62 -0.82Benchmark 29.49 -0.60Sector Average & rank: applies to the A Class.Please refer to Disclosure section on the next page for further information on calculation methodology and source of allperformance data content (tables and/or charts) of this MDD.
Cumulative performance (since inception)
Absa Global Core Equity FF A MSCI World GR USD
100
110
120
130
140
150
Oct-15
Dec-15
Jun-16
Dec-16
Jun-17
Oct-17
The chart reflects the value (monthly data points) of a R100 investment made on the 19 October 2015
Fund objectivesThe Absa Global Core Equity Feeder Fund aims to provide capital growth primarilythrough investment in equity securities of companies worldwide by investing ina broadly diversified portfolio of securities selected through the application ofanalytical techniques
Fund strategyThe portfolio is a domestic feeder fund that will consist of exchange rate swaps,assets in liquid form and participatory interest of the Schroder InternationalSelection Fund QEP Global Core. The Schroder ISF QEP Global Core will providecapital growth primarily through investment in equity securities of companiesworldwide, it will invest internationally in equities quoted on recognised stockexchanges and may also invest in a wide range of investments includingtransferable securities, collective investment schemes, warrants and moneymarket instruments. The portfolio will also have exposure to the listed andunlisted financial instruments and foreign investment exposure as permitted bythe Act.
Fund features• Investor’s capital is exposed to currency risk in addition to normal
fluctuations associated with investments in shares. Therefore this fund is anideal vehicle for long term investors who can tolerate a high level of risk
• Offers geographic and currency diversification• Rand-denominated offshore fund, which offers protection against
depreciating Rand• Suitable for investors who seek exposure to offshore markets
Fund specific risksConcentration: Investments may be primarily concentrated in specific areas (e.g.countries/geographical regions and/or industry sectors), in terms of investmentstyle (e.g. income or growth), in individual holdings and/or in a number of otherways. This may mean the value of the Fund may decrease whilst more broadlyinvested funds might grow. Currency exchange: Changes in the relative values ofdifferent currencies may adversely affect the value of the Fund's investments andany related income. Equity investment: The value of equities (e.g. shares) andequity-related investments may vary according to company profits and futureprospects as well as more general market factors. In the event of a companydefault (e.g. bankruptcy), the owners of their equity rank last in terms of anyfinancial payment from that company.
Risk profile and advisable minimum termLow Low-Medium Medium Medium-High High
3 Months + 6 Months + 2 Years + 3 Years + 5 Years +
Risk statisticsClass A Since Inception (19 October 2015)Number of positive months 15/24Highest 1 Year Performance 31/10/2017 23.62%Lowest 1 Year Performance 31/05/2017 -4.61%
Absa Global Core Equity Feeder Fund
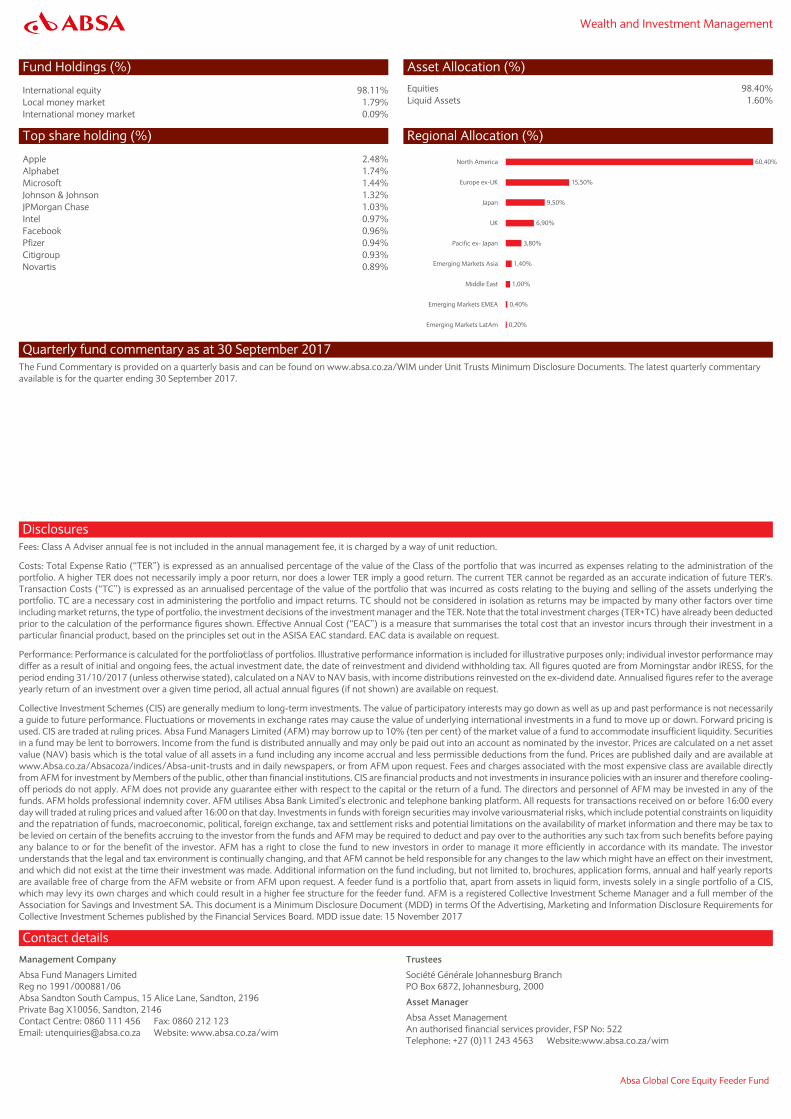
Wealth and Investment Management
Fund Holdings (%)
International equity 98.11%Local money market 1.79%International money market 0.09%
Asset Allocation (%)Equities 98.40%Liquid Assets 1.60%
Top share holding (%)
Apple 2.48%Alphabet 1.74%Microsoft 1.44%Johnson & Johnson 1.32%JPMorgan Chase 1.03%Intel 0.97%Facebook 0.96%Pfizer 0.94%Citigroup 0.93%Novartis 0.89%
Regional Allocation (%)
0,20%
0,40%
1,00%
1,40%
3,80%
6,90%
9,50%
15,50%
60,40%
Emerging Markets LatAm
Emerging Markets EMEA
Middle East
Emerging Markets Asia
Pacific ex- Japan
UK
Japan
Europe ex-UK
North America
Quarterly fund commentary as at 30 September 2017The Fund Commentary is provided on a quarterly basis and can be found on www.absa.co.za/WIM under Unit Trusts Minimum Disclosure Documents. The latest quarterly commentaryavailable is for the quarter ending 30 September 2017.
DisclosuresFees: Class A Adviser annual fee is not included in the annual management fee, it is charged by a way of unit reduction.
Costs: Total Expense Ratio (“TER”) is expressed as an annualised percentage of the value of the Class of the portfolio that was incurred as expenses relating to the administration of theportfolio. A higher TER does not necessarily imply a poor return, nor does a lower TER imply a good return. The current TER cannot be regarded as an accurate indication of future TER's.Transaction Costs (“TC”) is expressed as an annualised percentage of the value of the portfolio that was incurred as costs relating to the buying and selling of the assets underlying theportfolio. TC are a necessary cost in administering the portfolio and impact returns. TC should not be considered in isolation as returns may be impacted by many other factors over timeincluding market returns, the type of portfolio, the investment decisions of the investment manager and the TER. Note that the total investment charges (TER+TC) have already been deductedprior to the calculation of the performance figures shown. Effective Annual Cost (“EAC”) is a measure that summarises the total cost that an investor incurs through their investment in aparticular financial product, based on the principles set out in the ASISA EAC standard. EAC data is available on request.
Performance: Performance is calculated for the portfolio⁄class of portfolios. Illustrative performance information is included for illustrative purposes only; individual investor performance maydiffer as a result of initial and ongoing fees, the actual investment date, the date of reinvestment and dividend withholding tax. All figures quoted are from Morningstar and⁄or IRESS, for theperiod ending 31/10/2017 (unless otherwise stated), calculated on a NAV to NAV basis, with income distributions reinvested on the ex-dividend date. Annualised figures refer to the averageyearly return of an investment over a given time period, all actual annual figures (if not shown) are available on request.
Collective Investment Schemes (CIS) are generally medium to long-term investments. The value of participatory interests may go down as well as up and past performance is not necessarilya guide to future performance. Fluctuations or movements in exchange rates may cause the value of underlying international investments in a fund to move up or down. Forward pricing isused. CIS are traded at ruling prices. Absa Fund Managers Limited (AFM) may borrow up to 10% (ten per cent) of the market value of a fund to accommodate insufficient liquidity. Securitiesin a fund may be lent to borrowers. Income from the fund is distributed annually and may only be paid out into an account as nominated by the investor. Prices are calculated on a net assetvalue (NAV) basis which is the total value of all assets in a fund including any income accrual and less permissible deductions from the fund. Prices are published daily and are available atwww.Absa.co.za/Absacoza/indices/Absa-unit-trusts and in daily newspapers, or from AFM upon request. Fees and charges associated with the most expensive class are available directlyfrom AFM for investment by Members of the public, other than financial institutions. CIS are financial products and not investments in insurance policies with an insurer and therefore cooling-off periods do not apply. AFM does not provide any guarantee either with respect to the capital or the return of a fund. The directors and personnel of AFM may be invested in any of thefunds. AFM holds professional indemnity cover. AFM utilises Absa Bank Limited’s electronic and telephone banking platform. All requests for transactions received on or before 16:00 everyday will traded at ruling prices and valued after 16:00 on that day. Investments in funds with foreign securities may involve variousmaterial risks, which include potential constraints on liquidityand the repatriation of funds, macroeconomic, political, foreign exchange, tax and settlement risks and potential limitations on the availability of market information and there may be tax tobe levied on certain of the benefits accruing to the investor from the funds and AFM may be required to deduct and pay over to the authorities any such tax from such benefits before payingany balance to or for the benefit of the investor. AFM has a right to close the fund to new investors in order to manage it more efficiently in accordance with its mandate. The investorunderstands that the legal and tax environment is continually changing, and that AFM cannot be held responsible for any changes to the law which might have an effect on their investment,and which did not exist at the time their investment was made. Additional information on the fund including, but not limited to, brochures, application forms, annual and half yearly reportsare available free of charge from the AFM website or from AFM upon request. A feeder fund is a portfolio that, apart from assets in liquid form, invests solely in a single portfolio of a CIS,which may levy its own charges and which could result in a higher fee structure for the feeder fund. AFM is a registered Collective Investment Scheme Manager and a full member of theAssociation for Savings and Investment SA. This document is a Minimum Disclosure Document (MDD) in terms Of the Advertising, Marketing and Information Disclosure Requirements forCollective Investment Schemes published by the Financial Services Board. MDD issue date: 15 November 2017
Contact detailsManagement Company
Absa Fund Managers LimitedReg no 1991/000881/06 Absa Sandton South Campus, 15 Alice Lane, Sandton, 2196 Private Bag X10056, Sandton, 2146 Contact Centre: 0860 111 456 Fax: 0860 212 123 Email: [email protected] Website: www.absa.co.za/wim
Trustees
Société Générale Johannesburg BranchPO Box 6872, Johannesburg, 2000
Asset Manager
Absa Asset ManagementAn authorised financial services provider, FSP No: 522 Telephone: +27 (0)11 243 4563 Website:www.absa.co.za/wim
Absa Global Core Equity Feeder Fund

Wealth and Investment Management
Absa Global Value Feeder Fund Minimum disclosure documentMonth ended 31 October 2017
Fund detailsIndustry category Global - Equity - GeneralBenchmark MSCI $ World IndexFund launch date 01 November 1994Class A launch Date 02 October 2000Class R Launch Date 01 November 1994Fund Size R 976.93 MillionJSE code ABIFFund Manager This fund invests up to 100% in a portfolio that
is managed by SchrodersMinimum lump sum R 2000Minimum Monthly R 200
Income distributions - cents per unit (cpu)Class A Class R
the 6 months ended 31 Dec 2016 2.15 4.75the 6 months ended 30 Jun 2017 0 0
Income declaration 31 DecemberIncome distributions 15 January
Fees and Cost ratio (VAT incl.)Fees Class A Class RInitial Fees: Absa: 0% 0%
Adviser: 0-3.42% 0-3.42%Annual Fees: Management: 1.71% 1.14%
Adviser: 0-1.14%Performance Fee: No No
Costs (annual, based on period shown) Class A Class RFor the period to 30-06-2017, from: 01/07/2014 01/07/2014Total expense ratio (TER): 2.19% 1.62%Transaction costs (TC): 0.14% 0.14%Total investment charges (TER+TC): 2.33% 1.76%Please refer to Disclosure section on next page for further information on Fees and Costs
PerformancePerformance: annualised total returns (%)Term Class A Benchmark Sector
AverageRank Class R
Launch 6.12 9.37 7.34 1/1 9.901 Year 25.98 29.49 25.55 11/49 26.643 Year 18.56 18.08 15.31 4/34 19.165 Year 21.87 23.64 19.75 4/24 22.4610 Year 9.94 13.09 9.81 7/16 10.50
Performance Yearly returns (%)1 yr ending: Oct'17 Oct'16 Oct'15 Oct'14 Oct'13 Oct'12 Oct'11 Oct'10Class A 25.98 3.73 27.52 13.82 41.72 22.44 14.04 -8.03Benchmark 29.49 -0.60 27.90 20.62 45.47 21.30 16.12 0.73Class R 26.64 4.30 28.11 14.39 42.27 22.97 14.58 -7.53Sector Average & Rank: applies to the R Class.Please refer to Disclosures section on next page for further information on calculation methodologyand source of all performance data content (tables and/or charts) of this MDD
Cumulative performance (5 years)
Absa Global Value FF A Absa Global Value FF R MSCI $ World Index
100
140
180
220
260
300
Oct-12
Dec-12
Jun-13
Dec-13
Jun-14
Dec-14
Jun-15
Dec-15
Jun-16
Dec-16
Jun-17
Oct-17
The chart reflects the value (monthly data points) of a R100 investment made on the 01/11/2012
Fund objectivesThe Absa Global Value Feeder Fund aims to provide long term capital growth byinvesting in equity securities of companies worldwide. The Investment Managerwill invest in a select portfolio of securities and will not be restricted by size orsector.
Fund strategyThe portfolio is a domestic feeder fund that will consist of exchange rate swaps,assets in liquid form and participatory interest of the Schroder InternationalSelection Fund Global Recovery. The Schroder ISF Global Recovery will investprimarily in equity and equity related securities of companies worldwide. Theportfolio will also have exposure to listed and unlisted financial instruments andforeign investment exposure as permitted by the Act.
Fund features• Investor’s capital is exposed to currency risk in addition to normal
fluctuations associated with investments in shares. Therefore this fund is anideal vehicle for long term investors who can tolerate a high level of risk
• Offers geographic and currency diversification• Rand-denominated offshore fund, which offers protection against
depreciating Rand• Suitable for investors who seek exposure to offshore markets
Fund specific risksConcentration: Investments may be primarily concentrated in specific areas (e.g.countries/geographical regions and/or industry sectors), in terms of investmentstyle (e.g. income or growth), in individual holdings and/or in a number of otherways. This may mean the value of the Fund may decrease whilst more broadlyinvested funds might grow. Currency exchange: Changes in the relative values ofdifferent currencies may adversely affect the value of the Fund's investments andany related income. Equity investment: The value of equities (e.g. shares) andequity-related investments may vary according to company profits and futureprospects as well as more general market factors. In the event of a companydefault (e.g. bankruptcy), the owners of their equity rank last in terms of anyfinancial payment from that company.
Risk profile and advisable minimum termLow Low-Medium Medium Medium-High High
3 Months + 6 Months + 2 Years + 3 Years + 5 Years +
Risk statisticsClass A Since Inception (02 October 2000)Number of positive months 116/205Highest 1 Year Performance 31/12/2013 53.94%Lowest 1 Year Performance 31/03/2003 -46.26%
Absa Global Value Feeder Fund

Wealth and Investment Management
Fund Holdings (%)
Equity 95.15%Money market 3.36%International money market 1.49%
Asset Allocation (%)Equities 89.40%Liquid Assets 6.09%Schroders Funds 4.51%
Top share holding (%)
Schroder ISF US Dollar Liquidity 4.51%Royal Bank of Scotland 4.17%Citigroup 4.06%Coface 4.01%South32 3.74%Intel 3.37%Standard Chartered 3.37%HSBC Holdings 3.19%American International Group 3.11%Anglo American 3.11%
Regional Allocation (%)
2,70%
3,50%
3,60%
4,00%
29,50%
56,60%
Liquid Assets
Africa
Asia
Oceania
Americas
Europe
Quarterly fund commentary as at 30 September 2017The Fund Commentary is provided on a quarterly basis and can be found on www.absa.co.za/WIM under Unit Trusts Minimum Disclosure Documents. The latest quarterly commentaryavailable is for the quarter ending 30 September 2017.
DisclosuresFees: Class A Adviser annual fee is not included in the annual management fee, it is charged by a way of unit reduction.
Costs: Total Expense Ratio (“TER”) is expressed as an annualised percentage of the value of the Class of the portfolio that was incurred as expenses relating to the administration of theportfolio. A higher TER does not necessarily imply a poor return, nor does a lower TER imply a good return. The current TER cannot be regarded as an accurate indication of future TER's.Transaction Costs (“TC”) is expressed as an annualised percentage of the value of the portfolio that was incurred as costs relating to the buying and selling of the assets underlying theportfolio. TC are a necessary cost in administering the portfolio and impact returns. TC should not be considered in isolation as returns may be impacted by many other factors over timeincluding market returns, the type of portfolio, the investment decisions of the investment manager and the TER. Note that the total investment charges (TER+TC) have already been deductedprior to the calculation of the performance figures shown. Effective Annual Cost (“EAC”) is a measure that summarises the total cost that an investor incurs through their investment in aparticular financial product, based on the principles set out in the ASISA EAC standard. EAC data is available on request.
Performance: Performance is calculated for the portfolio⁄class of portfolios. Illustrative performance information is included for illustrative purposes only; individual investor performance maydiffer as a result of initial and ongoing fees, the actual investment date, the date of reinvestment and dividend withholding tax. All figures quoted are from Morningstar and⁄or IRESS, for theperiod ending 31/10/2017 (unless otherwise stated), calculated on a NAV to NAV basis, with income distributions reinvested on the ex-dividend date. Annualised figures refer to the averageyearly return of an investment over a given time period, all actual annual figures (if not shown) are available on request.
Collective Investment Schemes (CIS) are generally medium to long-term investments. The value of participatory interests may go down as well as up and past performance is not necessarilya guide to future performance. Fluctuations or movements in exchange rates may cause the value of underlying international investments in a fund to move up or down. Forward pricing isused. CIS are traded at ruling prices. Absa Fund Managers Limited (AFM) may borrow up to 10% (ten per cent) of the market value of a fund to accommodate insufficient liquidity. Securitiesin a fund may be lent to borrowers. Income from the fund is distributed annually and may only be paid out into an account as nominated by the investor. Prices are calculated on a net assetvalue (NAV) basis which is the total value of all assets in a fund including any income accrual and less permissible deductions from the fund. Prices are published daily and are available atwww.Absa.co.za/Absacoza/indices/Absa-unit-trusts and in daily newspapers, or from AFM upon request. Fees and charges associated with the most expensive class are available directlyfrom AFM for investment by members of the public, other than financial institutions. CIS are financial products and not investments in insurance policies with an insurer and therefore cooling-off periods do not apply. AFM does not provide any guarantee either with respect to the capital or the return of a fund. The directors and personnel of AFM may be invested in any of thefunds. AFM holds professional indemnity cover. AFM utilises Absa Bank Limited’s electronic and telephone banking platform. All requests for transactions received on or before 16:00 everyday will traded at ruling prices and valued after 16:00 on that day. Investments in funds with foreign securities may involve various material risks, which include potential constraints onliquidity and the repatriation of funds, macroeconomic, political, foreign exchange, tax and settlement risks and potential limitations on the availability of market information and there maybe tax to be levied on certain of the benefits accruing to the investor from the funds and AFM may be required to deduct and pay over to the authorities any such tax from such benefits beforepaying any balance to or for the benefit of the investor. AFM has a right to close the fund to new investors in order to manage it more efficiently in accordance with its mandate. The investorunderstands that the legal and tax environment is continually changing, and that AFM cannot be held responsible for any changes to the law which might have an effect on their investment,and which did not exist at the time their investment was made. Additional information on the fund including, but not limited to, brochures, application forms, annual and half-yearly reportsare available free of charge from the AFM website or from AFM upon request. A feeder fund is a portfolio that, apart from assets in liquid form, invests solely in a single portfolio of a CIS,which may levy its own charges and which could result in a higher fee structure for the feeder fund. AFM is a registered Collective Investment Scheme Manager and a full member of theAssociation for Savings and Investment SA. This document is a Minimum Disclosure Document (MDD) in terms of the Advertising, Marketing and Information Disclosure Requirements forCollective Investment Schemes published by the Financial Services Board. MDD issue date: 15 November 2017
Contact detailsManagement Company
Absa Fund Managers LimitedReg no 1991/000881/06 Absa Sandton South Campus, 15 Alice Lane, Sandton, 2196 Private Bag X10056, Sandton, 2146 Contact Centre: 0860 111 456 Fax: 0860 212 123 Email: [email protected] Website: www.absa.co.za/wim
Trustees
Société Générale Johannesburg BranchPO Box 6872, Johannesburg, 2000
Asset Manager
Absa Asset ManagementAn authorised financial services provider, FSP No: 522 Telephone: +27 (0)11 243 4563 Website:www.absa.co.za/wim
Absa Global Value Feeder Fund

Wealth and Investment Management
Absa Global Multi Asset Feeder Fund Minimum disclosure documentMonth ended 31 October 2017
Fund detailsIndustry category Global - Multi Asset - Low EquityBenchmark USD 3-month LIBOR+2%Fund launch date 13 October 2016Class A launch Date 13 October 2016Fund Size R 1.16 BillionJSE code AGFCAFund Manager This fund invests up to 100% in a portfolio that
is managed by SchrodersMinimum lump sum R 2000Minimum Monthly R 200
Income distributions - cents per unit (cpu)Class A
the 3 months ended 31 Dec 2016 0the 3 months ended 31 Mar 2017 0.37the 3 months ended 30 Jun 2017 1.25the 3 months ended 30 Sep 2017 1.04
Income declaration 31 Mar, 30 Jun, 30 Sep & 31 DecIncome distributions 15 Apr, 15 Jul, 15 Oct & 15 Jan
Fees and Cost ratio (VAT incl.)Fees Class AInitial Fees: Absa: 0%
Adviser: 0-3.42%Annual Fees: Management: 0.86%
Adviser: 0-1.14%Performance Fee: No
Costs (annual, based on period shown) Class AFor the period to 30-06-2017, from: 13-10-2016Total expense ratio (TER): 2.63%Transaction costs (TC): 0.19%Total investment charges (TER+TC): 2.82%Please refer to Disclosure section on next page for further information on Fees and Costs
PerformancePerformance cummulative total returns (%)Term Class A Benchmark Sector Average RankLaunch 2.84 2.25 4.27 8/101 Month 5.54 5.03 4.73 2/103 month 8.17 8.09 7.55 4/106 Month 7.42 7.42 8.66 7/109 Month 8.01 - 10.50 9/10
Sector Average & Rank: applies to the A Class.Please refer to Disclosures section on next page for further information on calculation methodologyand source of all performance data content (tables and/or charts) of this MDD
Cumulative performance (since inception)
Absa Global Multi Asset FF A USD 3-month LIBOR+2%
91
94
97
100
103
106
Oct-16
Dec-16
Mar-17
Jun-17
Oct-17
The chart reflects the value (monthly data points) of a R100 investment made on the 13 October 2016
Fund objectivesThe Absa Global Multi-Asset Feeder Fund aims to provide investors withsustainable and competitive risk adjusted returns over the medium to long term
Fund strategyThe portfolio is a domestic feeder fund that will consist of exchange rate rateswaps, assets in liquid form and participatory interest of the Schroder ISF GlobalMulti-Asset Income Fund. The Schroder fund aims to provide income and capitalgrowth over the medium to longer term by investing primarily in global equitiesand global fixed income securities directly or indirectly through the use ofinvestment funds or financial derivative instruments and will seek to achieve theobjective by actively allocating between equity securities of companies globally.
Fund features• Rand-denominated offshore fund, which offers protection against
depreciating Rand• Investor capital is exposed to currency movement and market risk dueto its
international exposure• Ideal vehicle for medium to long term investments• The structure of the fund is flexible• Suitable for investors who seek diversification through offshore investments
– with exposure to foreign currencies, markets and securities
Fund specific risksConcentration: Investments may be primarily concentrated in specific areas (e.g.countries/geographical regions and/or industry sectors), in terms of investmentstyle (e.g. income or growth), in individual holdings and/or in a number of otherways. This may mean the value of the Fund may decrease whilst more broadlyinvested funds might grow. Currency exchange: Changes in the relative values ofdifferent currencies may adversely affect the value of the Fund's investments andany related income. Multi-asset investment: The Fund is subject to possiblefinancial losses in multiple markets and may underperform more focused funds
Risk profile and advisable minimum termLow Low-Medium Medium Medium-High High
3 Months + 6 Months + 2 Years + 3 Years + 5 Years +
Risk statisticsClass A Since Inception (13 October 2016)Number of positive months 7/12No highest/lowest one year performance data disclosed due to the length of thetime the fund has been in existence.
Absa Global Multi Asset Feeder Fund

Wealth and Investment Management
Fund Holdings (%)
International equity 96.82%International cash and money market 1.64%Money market 1.54%
Asset Allocation (%)Equity 41.67%US High Yield 17.55%EM Local Currency 12.92%EM USD Sovereign 6.38%EM USD Corporates 6.17%Infrastructure 4.77%US Investment Grade 3.83%Property 3.57%Catastrophe Bonds 2.89%Cash & Income 0.25%
Top share holding (%)
Federative Republic Of Brazil 10% 01/01/2023 1.02%Apple Inc 0.70%Microsoft Corporation 0.53%Republic of Turkey 8.5% 14/09/2022 0.52%Starwood European Real Estate Finance Limited 0.48%Russian Federation 7.6% 20/07/2022 0.47%Schroder REIT 0.47%GCP Infrastructure Investments 0.46%JPMorgan Chase & Co 0.46%Thailand Government Bond 1.875% 17/06/2022 0.46%
Regional Allocation (%)
2,48%
3,57%
5,75%
7,83%
10,52%
31,50%
38,35%
Japan
Asia Pacific ex-Japan
Europe
UK
Other
Emerging Markets
North America
Quarterly fund commentary as at 30 September 2017The Fund Commentary is provided on a quarterly basis and can be found on www.absa.co.za/WIM under Unit Trusts Minimum Disclosure Documents. The latest quarterly commentaryavailable is for the quarter ending 30 September 2017.
DisclosuresFees: Class A Adviser annual fee is not included in the annual management fee, it is charged by a way of unit reduction.
Costs: Total Expense Ratio (“TER”) is expressed as an annualised percentage of the value of the Class of the portfolio that was incurred as expenses relating to the administration of theportfolio. A higher TER does not necessarily imply a poor return, nor does a lower TER imply a good return. The current TER cannot be regarded as an accurate indication of future TER's.Transaction Costs (“TC”) is expressed as an annualised percentage of the value of the portfolio that was incurred as costs relating to the buying and selling of the assets underlying theportfolio. TC are a necessary cost in administering the portfolio and impact returns. TC should not be considered in isolation as returns may be impacted by many other factors over timeincluding market returns, the type of portfolio, the investment decisions of the investment manager and the TER. Where the class/portfolio is less than 1 year old the TER and TC cannot bedetermined accurately because of the short life span, calculations are based on actual data where possible and best estimates where actual data is not available. Note that the Total InvestmentCharges (TER+TC) have already been deducted prior to the calculation of the performance figures shown. Effective Annual Cost (“EAC”) is a measure that summarises the total cost that aninvestor incurs through their investment in a particular financial product, based on the principles set out in the ASISA EAC Standard. EAC data is available on request.
Performance: Performance is calculated for the portfolio⁄ class of portfolios. Illustrative performance information is included for illustrative purposes only; individual investor performance maydiffer as a result of initial and ongoing fees, the actual investment date, the date of reinvestment and dividend withholding tax. All figures quoted are from Morningstar and⁄ or IRESS, for theperiod ending 31/10/2017 (unless otherwise stated), calculated on a NAV to NAV basis, with income distributions reinvested on the ex-dividend date. Annualised figures refer to the averageyearly return of an investment over a given time period, all actual annual figures (if not shown) are available on request.
Collective Investment Schemes (CIS) are generally medium to long-term investments. The value of participatory interests may go down as well as up and past performance is not necessarilya guide to future performance. Fluctuations or movements in exchange rates may cause the value of underlying international investments in a fund to move up or down. Forward pricing isused. CIS are traded at ruling prices. Absa Fund Managers Limited (AFM) may borrow up to 10% (ten per cent) of the market value of a fund to accommodate insufficient liquidity. Securitiesin a fund may be lent to borrowers. Income from the fund is distributed quarterly and may only be paid out into an account as nominated by the investor. Prices are calculated on a net assetvalue (NAV) basis which is the total value of all assets in a fund including any income accrual and less permissible deductions from the fund. Prices are published daily and are available atwww.Absa.co.za/Absacoza/indices/Absa-unit-trusts and in daily newspapers, or from AFM upon request. Fees and charges associated with the most expensive class are available directlyfrom AFM for investment by members of the public, other than financial institutions. CIS are financial products and not investments in insurance policies with an insurer and therefore cooling-off periods do not apply. AFM does not provide any guarantee either with respect to the capital or the return of a fund. The directors and personnel of AFM may be invested in any of thefunds. AFM holds professional indemnity cover. AFM utilises Absa Bank Limited’s electronic and telephone banking platform. All requests for transactions Received on or before 16:00 everyday will traded at ruling prices and valued after 16:00 on that day. Investments in funds with foreign securities may involve various material risks, which include potential constraints onliquidity and the repatriation of funds, macroeconomic, political, foreign exchange, tax and settlement risks and Potential limitations on the availability of market information and there maybe tax to be levied on certain of the benefits accruing to the investor from the funds and AFM may be required to deduct and pay over to the authorities any such tax from such benefits beforepaying any balance to or for the benefit of the investor. AFM has A right to close the fund to new investors in order to manage it more efficiently in accordance with its mandate. The investorunderstands that the legal and tax environment is continually changing, and that AFM cannot be held responsible for any changes to the law which might have an effect on their investment,and which did not exist at the time their investment was made. Additional information on the fund including, but not limited to, brochures, application forms, annual and half-yearly Reportsare available free of charge from the AFM website or from AFM upon request. A feeder fund is a portfolio that, apart from assets in liquid form, invests Solely in a single portfolio of a CIS,which may levy its own charges and which could result in a higher fee structure for the feeder fund. AFM is a registered Collective Investment Scheme Manager and a full member of theAssociation for Savings and Investment SA. This document is a Minimum Disclosure Document (MDD) in terms of the Advertising, Marketing and Information Disclosure Requirements forCollective Investment Schemes published by the Financial Services Board. MDD issue date: 15 November 2017
Contact detailsManagement Company
Absa Fund Managers LimitedReg no 1991/000881/06 Absa Sandton South Campus, 15 Alice Lane, Sandton, 2196 Private Bag X10056, Sandton, 2146 Contact Centre: 0860 111 456 Fax: 0860 212 123 Email: [email protected] Website: www.absa.co.za/wim
Trustees
Société Générale Johannesburg BranchPO Box 6872, Johannesburg, 2000
Asset Manager
Absa Asset ManagementAn authorised financial services provider, FSP No: 522 Telephone: +27 (0)11 243 4563 Website:www.absa.co.za/wim
Absa Global Multi Asset Feeder Fund

Wealth and Investment Management
Absa Global Property Feeder Fund Minimum disclosure documentMonth ended 31 October 2017
Fund detailsIndustry category Global - Real Estate - GeneralBenchmark FTSE EPRA NAREIT Developed IndexFund launch date 13 October 2016Class A launch Date 13 October 2016Fund Size R 107.14 MillionJSE code AGPFAFund Manager This fund invests up to 100% in a portfolio that
is managed by SchrodersMinimum lump sum R 2000Minimum Monthly R 200
Income distributions - cents per unit (cpu)Class A
the 6 months ended 31 Dec 2016 0the 6 months ended 30 Jun 2017 0
Income declaration 31 DecemberIncome distributions 15 January
Fees and Cost ratio (VAT incl.)Fees Class AInitial Fees: Absa: 0%
Adviser: 0-3.42%Annual Fees: Management: 0.14%
Adviser: 1.14%Performance Fee: No
Costs (annual, based on period shown) Class AFor the period to 30-06-2017, from: 13-10-2016Total expense ratio (TER): 2.77%Transaction costs (TC): 0.10%Total investment charges (TER+TC): 2.87%Please refer to Disclosure section on next page for further information on Fees and Costs
PerformancePerformance cummulative total returns (%)Term Class A Benchmark Sector Average RankLaunch 4.70 4.85 4.40 6/151 Month 5.81 4.26 4.73 2/183 month 6.93 6.67 6.28 9/186 Month 8.53 9.09 8.97 9/179 Month 13.58 11.43 12.81 7/16
Sector Average & Rank: applies to the A Class.Please refer to Disclosures section on next page for further information on calculation methodologyand source of all performance data content (tables and/or charts) of this MDD
Cumulative performance (since inception)
Absa Global Property FF A FTSE EPRA NAREIT Developed Index
88
91
94
97
100
103
106
Oct-16
Dec-16
Mar-17
Jun-17
Oct-17
The chart reflects the value (monthly data points) of a R100 investment made on the 13 October 2016
Fund objectivesThe Absa Global Property Feeder Fund aims to provide investors with sustainableand competitive risk adjusted returns over the medium to long term
Fund strategyThe portfolio is a domestic feeder fund that will consist of exchange rate swaps,assets in liquid form and participatory interest of the Schroder ISF Global PropertyFund. The Schroder fund will provide a total return through investment in equitysecurities of the property companies worldwide. At least two-thirds of the fund(excluding cash) will be invested in equity and non-equity securities of propertycompanies worldwide
Fund features• Rand-denominated offshore fund, which offers protection against
depreciating Rand• Investor capital is exposed to currency movement and market risk dueto its
international exposure• Offers geographic and currency diversification• Suitable for investors who seek diversification through offshore investments
– with exposure to foreign currencies, markets and securities
Fund specific risksConcentration: Investments may be primarily concentrated in specific areas (e.g.countries/geographical regions and/or industry sectors), in terms of investmentstyle (e.g. income or growth), in individual holdings and/or in a number of otherways. This may mean the value of the Fund may decrease whilst more broadlyinvested funds might grow. Currency exchange: Changes in the relative values ofdifferent currencies may adversely affect the value of the Fund's investments andany related income. Equity investment: The value of equities (e.g. shares) andequity-related investments may vary according to company profits and futureprospects as well as more general market factors. In the event of a companydefault (e.g. bankruptcy), the owners of their equity rank last in terms of anyfinancial payment from that company
Risk profile and advisable minimum termLow Low-Medium Medium Medium-High High
3 Months + 6 Months + 2 Years + 3 Years + 5 Years +
Risk statisticsClass A Since Inception (13 October 2016)Number of positive months 8/12No highest/lowest one year performance data disclosed due to the length of thetime the fund has been in existence.
Absa Global Property Feeder Fund

Wealth and Investment Management
Fund Holdings (%)
International equity 51.21%International cash and money market 46.14%Money market 2.65%
Asset Allocation (%)Equities 98.18%Liquid Assets 1.82%
Top share holding (%)
Sun Hung Kai 3.40%The Link REIT 3.30%Alexandria Real Estate Equities 3.04%Interxion Holding 2.79%Healthcare Trust of America 2.76%Howard Hughes 2.76%Rexford Industrial Realty 2.66%Hudson Pacific Properties 2.57%Mirvac Group 2.49%Great Portland Estates 2.44%
Regional Allocation (%)
0,50%
1,70%
5,30%
8,70%
13,20%
15,10%
55,60%
Emerging Markets
Liquid Assets
United Kingdom
Japan
Europe ex- UK/Middle East
Pacific ex-Japan
Americas
Quarterly fund commentary as at 30 September 2017The Fund Commentary is provided on a quarterly basis and can be found on www.absa.co.za/WIM under Unit Trusts Minimum Disclosure Documents. The latest quarterly commentaryavailable is for the quarter ending 30 September 2017.
DisclosuresFees: Class A Adviser annual fee is not included in the annual management fee, it is charged by a way of unit reduction.
Costs: Total Expense Ratio (“TER”) is expressed as an annualised percentage of the value of the Class of the portfolio that was incurred as expenses relating to the administration of theportfolio. A higher TER does not necessarily imply a poor return, nor does a lower TER imply a good return. The current TER cannot be regarded as an accurate indication of future TER's.Transaction Costs (“TC”) is expressed as an annualised percentage of the value of the portfolio that was incurred as costs relating to the buying and selling of the assets underlying theportfolio. TC are a necessary cost in administering the portfolio and impact returns. TC should not be considered in isolation as returns may be impacted by many other factors over timeincluding market returns, the type of portfolio, the investment decisions of the investment manager and the TER. Where the class/portfolio is less than 1 year old the TER and TC cannot bedetermined accurately because of the short life span, calculations are based on actual data where possible and best estimates where actual data is not available. Note that the Total InvestmentCharges (TER+TC) have already been deducted prior to the calculation of the performance figures shown. Effective Annual Cost (“EAC”) is a measure that summarises the total cost that aninvestor incurs through their investment in a particular financial product, based on the principles set out in the ASISA EAC Standard. EAC data is available on request.
Performance: Performance is calculated for the portfolio⁄ class of portfolios. Illustrative performance information is included for illustrative purposes only; individual investor performance maydiffer as a result of initial and ongoing fees, the actual investment date, the date of reinvestment and dividend withholding tax. All figures quoted are from Morningstar and⁄ or IRESS, for theperiod ending 31/10/2017 (unless otherwise stated), calculated on a NAV to NAV basis, with income distributions reinvested on the ex-dividend date. Annualised figures refer to the averageyearly return of an investment over a given time period, all actual annual figures (if not shown) are available on request.
Collective Investment Schemes (CIS) are generally medium to long-term investments. The value of participatory interests may go down as well as up and past performance is not necessarilya guide to future performance. Fluctuations or movements in exchange rates may cause the value of underlying international investments in a fund to move up or down. Forward pricing isused. CIS are traded at ruling prices. Absa Fund Managers Limited (AFM) may borrow up to 10% (ten per cent) of the market value of a fund to accommodate insufficient liquidity. Securitiesin a fund may be lent to borrowers. Income from the fund is distributed annually and may only be paid out into an account as nominated by the investor. Prices are calculated on a net assetvalue (NAV) basis which is the total value of all assets in a fund including any income accrual and less permissible deductions from the fund. Prices are published daily and are available atwww.Absa.co.za/Absacoza/indices/Absa-unit-trusts and in daily newspapers, or from AFM upon request. Fees and charges associated with the most expensive class are available directlyfrom AFM for investment by members of the public, other than financial institutions. CIS are financial products and not investments in insurance policies with an insurer and therefore cooling-off periods do not apply. AFM does not provide any guarantee either with respect to the capital or the return of a fund. The directors and personnel of AFM may be invested in any of thefunds. AFM holds professional indemnity cover. AFM utilises Absa Bank Limited’s electronic and telephone banking platform. All requests for transactions received on or before 16:00 everyday will traded at ruling prices and valued after 16:00 on that day. Investments in funds with foreign securities may involve various material risks, which include potential constraints onliquidity and the repatriation of funds, macroeconomic, political, foreign exchange, tax and settlement risks and potential limitations on the availability of market information and there maybe tax to be levied on certain of the benefits accruing to the investor from the funds and AFM may be required to deduct and pay over to the authorities any such tax from such benefits beforepaying any balance to or for the benefit of the investor. AFM has a right to close the fund to new investors in order to manage it more efficiently in accordance with its mandate. The investorunderstands that the legal and tax environment is continually changing, and that AFM cannot be held responsible for any changes to the law which might have an effect on their investment,and which did not exist at the time their investment was made. Additional information on the fund including, but not limited to, brochures, application forms, annual and half-yearly peportsare available free of charge from the AFM website or from AFM upon request. A feeder fund is a portfolio that, apart from assets in liquid form, invests solely in a single portfolio of a CIS,which may levy its own charges and which could result in a higher fee structure for the feeder fund. AFM is a registered Collective Investment Scheme Manager and a full member of theAssociation for Savings and Investment SA. This document is a Minimum Disclosure Document (MDD) in terms of the Advertising, Marketing and Information Disclosure Requirements forCollective Investment Schemes published by the Financial Services Board. MDD issue date: 15 November 2017
Contact detailsManagement Company
Absa Fund Managers LimitedReg no 1991/000881/06 Absa Sandton South Campus, 15 Alice Lane, Sandton, 2196 Private Bag X10056, Sandton, 2146 Contact Centre: 0860 111 456 Fax: 0860 212 123 Email: [email protected] Website: www.absa.co.za/wim
Trustees
Société Générale Johannesburg BranchPO Box 6872, Johannesburg, 2000
Asset Manager
Absa Asset ManagementAn authorised financial services provider, FSP No: 522 Telephone: +27 (0)11 243 4563 Website:www.absa.co.za/wim
Absa Global Property Feeder Fund

Wealth and Investment Management
Absa Africa Equity Feeder Fund Minimum disclosure documentMonth ended 31 October 2017
Fund detailsIndustry category Regional - Equity - GeneralBenchmark MSCI Emerging Frontier Markets Africa ex South Africa IndexFund launch date 14 April 2014Class A launch Date 14 April 2014Fund Size R 473.35 MillionJSE code AAECAFund Manager Godfrey Mwanza – B.Sc. (Economics) (Hons) CFA
Roy MutooniAsset Manager Absa Asset Management (Pty) LtdMinimum lump sum R 2000Minimum Monthly R 200
Income distributions - cents per unit (cpu)Class A
the 6 months ended 31 Dec 2016 0the 6 months ended 30 Jun 2017 0
Income declaration 30 June & 31 DecemberIncome distributions 15 July & 15 January
Fees and Cost ratio (VAT incl.)Fees Class AInitial Fees: Absa: 0%
Adviser: 0 -3.42%Annual Fees: Management: 1.71%
Adviser: 0-1.14%Performance Fee: No
Costs (annual, based on period shown) Class AFor the period to 30-06-2017, from: 01/07/2014Total expense ratio (TER): 1.78%Transaction costs (TC): 1.44%Total investment charges (TER+TC): 3.22%Please refer to Disclosure section on next page for further information on Fees and Costs
PerformancePerformance: annualised total returns (%)Term Class A BenchmarkLaunch 0.86 3.901 Year 8.81 16.722 Year 0.80 4.653 Year 0.50 1.74
Please refer to Disclosures section on next page for further information on calculation methodologyand source of all performance data content (tables and/or charts) of this MDD
Cumulative performance (since inception)
Absa Africa Equity FF A MSCI EFM Africa Ex South Africa
50
60
70
80
90
100
110
120
130
140
Apr-14
Jun-14
Dec-14
Jun-15
Dec-15
Jun-16
Dec-16
Jun-17
Oct-17
The chart reflects the value (monthly data points) of a R100 investment made on the 14 April 2014
Fund objectivesThe Absa Africa Equity Feeder Fund aims to provide long-term capital growththrough exposure to African equity securities of companies which are eitherdomiciled in Africa or are established in another continent but derive a significantproportion of their earnings from African countries.
Fund strategyThe portfolio is a domestic feeder fund that will consist of exchange rate swaps,assets in liquid form and participatory interest of the Absa Africa Equity Fund(“Master Fund”) which is established under the Sanlam Universal Funds Plc. TheMaster Fund aims to provide long-term capital growth through exposure toAfrican equity securities by investing in equity securities listed on recognisedstock exchanges across the African continent as well as equities that may be listedand/or traded in recognised exchanges outside of Africa. Investment in securitieslisted in South Africa will be limited to 20% of the Net Asset Value of the MasterFund.
Fund features• A specialist fund, ideal for long-term investments• Provides exposure to a range of developing countries in Africa• An actively managed fund with potential high return opportunities• Offers currency and geographic diversification• Suitable for investors who wish to invest in Africa’s equity market• Has currency risk relative to domestic equity investments. Therefore suitable
for aggressive risk profiled investor.
Fund specific risksConcentration: Investments may be primarily concentrated in specific areas (e.g.countries/geographical regions and/or industry sectors), in terms of investmentstyle (e.g. income or growth), in individual holdings and/or in a number of otherways. This may mean the value of the Fund may decrease whilst more broadlyinvested funds might grow. Equity investment: The value of equities (e.g. shares)and equity-related investments may vary according to company profits andfuture prospects as well as more general market factors. In the event of a companydefault (e.g. bankruptcy), the owners of their equity rank last in terms of anyfinancial payment from that company. Liquidity: There may be insufficient buyersor sellers of particular investments giving rise to delays in trading and being ableto make settlements from the Fund and/or large fluctuations in the value of theFund which may lead to larger financial losses than anticipated. Currencyexchange: Changes in the relative values of different currencies may adverselyaffect the value of the Fund's investments and any related income. Developingmarket: Some of the countries in which the Fund invests may have less developedlegal, political, economic and/or other systems. These markets carry a higher riskof financial loss than those in countries generally regarded as being moredeveloped.
Risk profile and advisable minimum termLow Low-Medium Medium Medium-High High
3 Months + 6 Months + 2 Years + 3 Years + 5 Years +
Risk statisticsClass A Since Inception (14 April 2014)Number of positive months 22/42Highest 1 Year Performance 31/10/2017 8.81%Lowest 1 Year Performance 31/12/2016 -22.32%
Absa Africa Equity Feeder Fund

Wealth and Investment Management
Sector Allocation (%)
0,32%
1,43%
2,32%
2,35%
5,82%
8,00%
8,50%
11,71%
18,62%
40,94%
Materials
Cash
Health Care
Consumer Discretionary
Utilities
Energy
Bonds
Telecommunication Services
Consumer Staples
Financials
Country Allocation (%)
0,32%
1,02%
2,08%
2,42%
5,30%
5,61%
10,76%
12,58%
17,21%
42,69%
Zambia
Tanzania
South Africa
Namibia
Mauritius
Senegal
Morocco
Kenya
Nigeria
Egypt
Asset Allocation (%)International equity 90.08%International bonds 8.50%Cash/Money market 1.43%
Quarterly fund commentary as at 30 September 2017The Fund Commentary is provided on a quarterly basis and can be found on www.absa.co.za/WIM under Unit Trusts Minimum Disclosure Documents. The latest quarterly commentaryavailable is for the quarter ending 30 September 2017.
DisclosuresCosts: Total Expense Ratio (“TER”) is expressed as an annualised percentage of the value of the Class of the portfolio that was incurred as expenses relating to the administration of theportfolio. A higher TER does not necessarily imply a poor return, nor does a lower TER imply a good return. The current TER cannot be regarded as an accurate indication of future TER's.Transaction Costs (“TC”) is expressed as an annualised percentage of the value of the portfolio that was incurred as costs relating to the buying and selling of the assets underlying theportfolio. TC are a necessary cost in administering the portfolio and impact returns. TC should not be considered in isolation as returns may be impacted by many other factors over timeincluding market returns, the type of portfolio, the investment decisions of the investment manager and the TER. Note that the total investment charges (TER+TC) have already been deductedprior to the calculation of the performance figures shown. Effective Annual Cost (“EAC”) is a measure that summarises the total cost that an investor incurs through their investment in aparticular financial product, based on the principles set out in the ASISA EAC standard. EAC data is available on request.
Performance: Performance is calculated for the portfolio⁄class of portfolios. Illustrative performance information is included for illustrative purposes only; individual investor performance maydiffer as a result of initial and ongoing fees, the actual investment date, the date of reinvestment and dividend withholding tax. All figures quoted are from Morningstar and⁄or IRESS, for theperiod ending 31/10/2017 (unless otherwise stated), calculated on a NAV to NAV basis, with income distributions reinvested on the ex-dividend date. Annualised figures refer to the averageyearly return of an investment over a given time period, all actual annual figures (if not shown) are available on request.
The Absa Africa Equity Feeder Fund was formerly the Absa Africa Equity Fund. The name change and conversion to a feeder fund took effect from 15 November 2016. Collect InvestmentSchemes (CIS) are generally medium to long-term investments. The value of participatory interests may go down as well as up and past performance is not necessarily a guide to futureperformance. Fluctuations or movements in exchange rates may cause the value of underlying international investments in a fund to move up or down. Forward pricing is used. CIS are tradedat ruling prices. Absa Fund Managers Limited (AFM) may borrow up to 10% (ten per cent) of the market value of a fund to accommodate insufficient liquidity. Securities in a fund may belent to borrowers. Income from the fund is distributed semi-annually and may only be paid out into an account as nominated by the investor. Prices are calculated on a net asset value (NAV)basis which is the total value of all assets in a fund including any income accrual and less permissible deductions from the fund. Prices are published daily and are available at www.absa.co.za/Absacoza/Indices/Absa-Unit-Trusts and in daily newspapers, or from AFM upon request. Fees and charges associated with the most expensive class are available directly from AFM forinvestment by members of the public, other than financial institutions. CIS are financial products and not investments in insurance policies with an insurer and therefore cooling-off periodsdo not apply. AFM does not provide any guarantee either with respect to the capital or the return of a fund. The directors and personnel of AFM may be invested in any of the funds. AFMholds professional indemnity cover. AFM utilises Absa Bank Limited’s electronic and telephone banking platform. All requests for transactions received on or before 16:00 every day will tradedat ruling prices and valued after 16:00 on that day. Investments in funds with foreign securities may involve various material risks, which include potential constraints on liquidity and therepatriation of funds, macroeconomic, political, foreign exchange, tax and settlement risks and potential limitations on the availability of market information and there may be tax to be leviedon certain of the benefits accruing to the investor from the funds and AFM may be required to deduct and pay over to the authorities any such tax from such benefits before paying anybalance to or for the benefit of the investor. AFM has a right to close the fund to new investors in order to manage it more efficiently in accordance with its mandate. The investor understandsthat the legal and tax environment is continually changing, and that AFM cannot be held responsible for any changes to the law which might have an effect on their investment, and whichdid not exist at the time their investment was made. Additional information on the fund including, but not limited to, brochures, application forms, annual and half-yearly reports are availablefree of charge from the AFM website or from AFM upon request. AFM is a registered Collective Investment Scheme Manager and a full member of the Association for Savings and InvestmentSA. This document is a Minimum Disclosure Document (MDD) in terms of the Advertising, Marketing and Information Disclosure Requirements for Collective Investment Schemes publishedby the Financial Services Board. MDD issue date: 15 November 2017
Contact detailsManagement Company
Absa Fund Managers LimitedReg no 1991/000881/06 Absa Sandton South Campus, 15 Alice Lane, Sandton, 2196 Private Bag X10056, Sandton, 2146 Contact Centre: 0860 111 456 Fax: 0860 212 123 Email: [email protected] Website: www.absa.co.za/wim
Trustees
Société Générale Johannesburg BranchPO Box 6872, Johannesburg, 2000
Asset Manager
Absa Asset ManagementAn authorised financial services provider, FSP No: 522 Telephone: +27 (0)11 243 4563 Website:www.absa.co.za/wim
Absa Africa Equity Feeder Fund

Wealth and Investment Management
Absa Africa Equity Feeder Fund Fund Commentary30 September 2017
Commentary DocumentThe third quarter of 2017 saw broadly positive performances in the large Sub-Saharan African and North African markets. The Egyptian Index continued to performwell, rallying 6.5% in US Dollar terms during the quarter (15.6% year to date). Morocco was up 3.4% in the quarter and 10.8% for the year. The Nigerian All ShareIndex declined 3.9% for the quarter and 15.7% for the year in USD terms. Kenya rallied 7.4% in 3Q17 (+19.9% year to date). The South African Rand depreciated by3.7% against the US Dollar in 3Q17. In Rand terms, the MSCI EFM Africa ex-South Africa price index was up 10.4% in 3Q17 and up 17.5% for the year. The AbsaAfrica Fund was up 9.8% in the quarter and up 17.0% year to date. Egypt and Nigeria make up nearly half of the MSCI EFM Africa ex-SA index that the Absa Africa fund measures itself against. In recent years both markets havewitnessed macroeconomic and political challenges triggered largely by tumbling oil prices in Nigeria, a populist revolution in Egypt and a resurgent US Dollar. In coping with these challenges both countries took a wait and see approach to economic policy, delaying the necessary adjustment to a changed global financialenvironment. This was exemplified by both countries maintaining unsustainable fixed exchange rate regimes which negatively impacted local businesses and marketsentiment. However, in November 2016 reality finally set in and Egypt moved to free float its currency. In April 2017 Nigeria opened a new foreign-exchange tradingwindow for bond and stock investors as well as exporters where currencies sell at market-determined rates. Sentiment improved dramatically following these policy shifts with both indices immediately entering cyclical bull markets. In the two months after their respectivedecisions the Egyptian index rallied 43% and the Nigerian was up 34% (both in local currency terms). This provided some relief among Africa ex-SA investors whountil then had suffered a three year bear market. It has also led foreign and domestic capital allocators to ask the question, is the timing right to up-weight “Africa”and has led us to ask the question, is it time to up-weight Nigeria (we have already up-weighted Egypt)? Our answer to both is yes, but proceed with caution.
DisclosuresThe Absa Africa Equity Feeder Fund was formerly the Absa Africa Equity Fund. The name change and conversion to a feeder fund took effect from 15 November 2016.Collect Investment Schemes (CIS) are generally medium to long-term investments. The value of participatory interests may go down as well as up and past performanceis not necessarily a guide to future performance. Fluctuations or movements in exchange rates may cause the value of underlying international investments in a fundto move up or down. Forward pricing is used. CIS are traded at ruling prices. Absa Fund Managers Limited (AFM) may borrow up to 10% (ten per cent) of the marketvalue of a fund to accommodate insufficient liquidity. Securities in a fund may be lent to borrowers. Income from the fund is distributed semi-annually and may onlybe paid out into an account as nominated by the investor. Prices are calculated on a net asset value (NAV) basis which is the total value of all assets in a fund includingany income accrual and less permissible deductions from the fund. Prices are published daily and are available at www.absa.co.za/Absacoza/Indices/Absa-Unit-Trustsand in daily newspapers, or from AFM upon request. Fees and charges associated with the most expensive class are available directly from AFM for investment bymembers of the public, other than financial institutions. CIS are financial products and not investments in insurance policies with an insurer and therefore cooling-offperiods do not apply. AFM does not provide any guarantee either with respect to the capital or the return of a fund. The directors and personnel of AFM may be investedin any of the funds. AFM holds professional indemnity cover. AFM utilises Absa Bank Limited’s electronic and telephone banking platform. All requests for transactionsreceived on or before 16:00 every day will traded at ruling prices and valued after 16:00 on that day. Investments in funds with foreign securities may involve variousmaterial risks, which include potential constraints on liquidity and the repatriation of funds, macroeconomic, political, foreign exchange, tax and settlement risks andpotential limitations on the availability of market information and there may be tax to be levied on certain of the benefits accruing to the investor from the funds andAFM may be required to deduct and pay over to the authorities any such tax from such benefits before paying any balance to or for the benefit of the investor. AFMhas a right to close the fund to new investors in order to manage it more efficiently in accordance with its mandate. The investor understands that the legal and taxenvironment is continually changing, and that AFM cannot be held responsible for any changes to the law which might have an effect on their investment, and whichdid not exist at the time their investment was made. Additional information on the fund including, but not limited to, brochures, application forms, annual and half-yearly reports are available free of charge from the AFM website or from AFM upon request. AFM is a registered Collective Investment Scheme Manager and a fullmember of the Association for Savings and Investment SA. This document is a Minimum Disclosure Document (MDD) in terms of the Advertising, Marketing andInformation Disclosure Requirements for Collective Investment Schemes published by the Financial Services Board. MDD issue date: 15 November 2017
Contact details
Management Company
Absa Fund Managers LimitedReg no 1991/000881/06 Absa Sandton South Campus, 15 Alice Lane, Sandton, 2196 Private Bag X10056, Sandton, 2146 Contact Centre: 0860 111 456 Fax: 0860 212 123 Email: [email protected] Website: www.absa.co.za/wim
Trustees
Société Générale Johannesburg BranchPO Box 6872, Johannesburg, 2000
Asset Manager
Absa Asset ManagementAn authorised financial services provider, FSP No: 522 Telephone: +27 (0)11 243 4563 Website:www.absa.co.za/wim
Absa Africa Equity Feeder Fund

Wealth and Investment Management
Head Office : Barclays Sandton South Campus
15 Alice Lane, Sandton, 2196
[email protected] www.absa.co.za/wim
Unit Trusts
Telephone: 0860 111 456
Absa SM Fund Map