sitc international holdings company limited - … · sitc international holdings company limited...
TRANSCRIPT

SITC International Holdings Company Limited
October 2010

This document does not constitute an offer to sell or issue or the solicitation of an offer to buy or acquire securities of SITC
International Holdings Company Limited (the “Company”) in any jurisdiction or an inducement to enter into investment activity,
nor may it or any part of it form the basis of or be relied on in connection with any contract or commitment whatsoever.
Specifically, this document does not constitute a “prospectus” within the meaning of the U.S. Securities Act of 1933 or the
Hong Kong Companies Ordinance (Chapter 32 of the Laws of Hong Kong), as amended. Any decision to purchase securities
in the Company shall only be made at your own assessment of the market and the market position of the Company and at
your own risk. Shareholders and investors are reminded to exercise caution when dealing in the securities of the Company.
This document has been prepared by the Company solely for the reference of the shareholders and investors. The
information contained in this presentation has not been independently verified. No representation, warranty or undertaking,
express or implied, is made as to, and no reliance should be placed on, the fairness, accuracy, completeness or correctness
of the information or the opinions contained herein. The information contained in this document should be considered in the
context of the circumstances prevailing at the time and has not been, and will not be, updated to reflect material developments
which may occur after the date of the document. These materials do not contain all of the relevant information relating to the
Company or its securities. None of the Company or any of its affiliates, advisors or representatives will be liable (in negligence
or otherwise) for any loss howsoever arising from any use of this document or its contents or otherwise arising in connection
therewith. The Company may alter, modify or otherwise change in any manner the content of this document, without obligation
to notify any person of such revision or changes.
Any information on the past performance of the Company is not necessarily indicative of its future performance. This
document contains statements that constitute forward-looking statements that are based on current assumptions and beliefs
as well as information currently available to the Company. These statements include descriptions regarding the intent, belief or
current expectations of the Company or its officers with respect to the consolidated results of operations and financial
condition of the Company. These statements can be recognized by the use of words such as “expects,” “plans,” “will,”
“estimates,” “projects,” “intends,” or words of similar meaning. Such forward-looking statements are not guarantees of future
performance and involve risks and uncertainties, and actual results may differ significantly from those in the forward-looking
statements as a result of various factors and assumptions. The Company has no obligation and does not undertake to revise
forward-looking statements to reflect future events or circumstances.
Disclaimer

Contents
Company Overview
Business Highlights
Business Strategy
Financial Information
1
2
3
4
1
1. Company Overview

Our Business
Container shipping
Trucking
Freight forwarding
Ship agency
Depot and Warehousing
We are a leading shipping logistics company in the PRC, exclusively focused on the intra-Asia market,
providing integrated transportation solutions to our customers.
Largest Non-State-
Owned Shipping
Logistics Company in
the PRC
3rd Largest Container
Shipping Company in
the PRC
4th Largest Container
Shipping Company in
the Intra-Asia Market
1st 3rd 4th
Source: Drewry.
2 Company Overview

Our Corporate Milestones
SITC has achieved a leading market position within a short period of 19 years since its establishment in
1991.
SITC Corp was established to operate freight forwarding
business
1991
Purchased first vessel and started serving PRC-Japan
trade lane
Began our depot and warehousing services
1992
Expanded into ASEAN Market2004
Strategically relocated operating center
from Qingdao to Shanghai
2007
Became market leader along PRC-
Japan route2008
Became market leader along
PRC-Vietnam and PRC-
Philippines routes
2009
Established Qingdao logistics park2003
Signed strategic cooperation
agreement with Shanghai Port and
Dinh Vu Port in Vietnam to jointly
develop depot, warehousing and
other logistics businesses
2010
2006 Became largest PRC-based non-state-
owned shipping logistics company
3 Company Overview

2. Business Highlights

Business Highlights
Exclusively Focused on the Fast Growing Intra-Asia Market1
Integrated “One-Stop” Logistics Services 2
Distinctive High Frequency, High Density Service Model3
Stable and Experienced Management Team4
4 Business Highlights
Intra-Asia Market: Largest and Fastest Growing
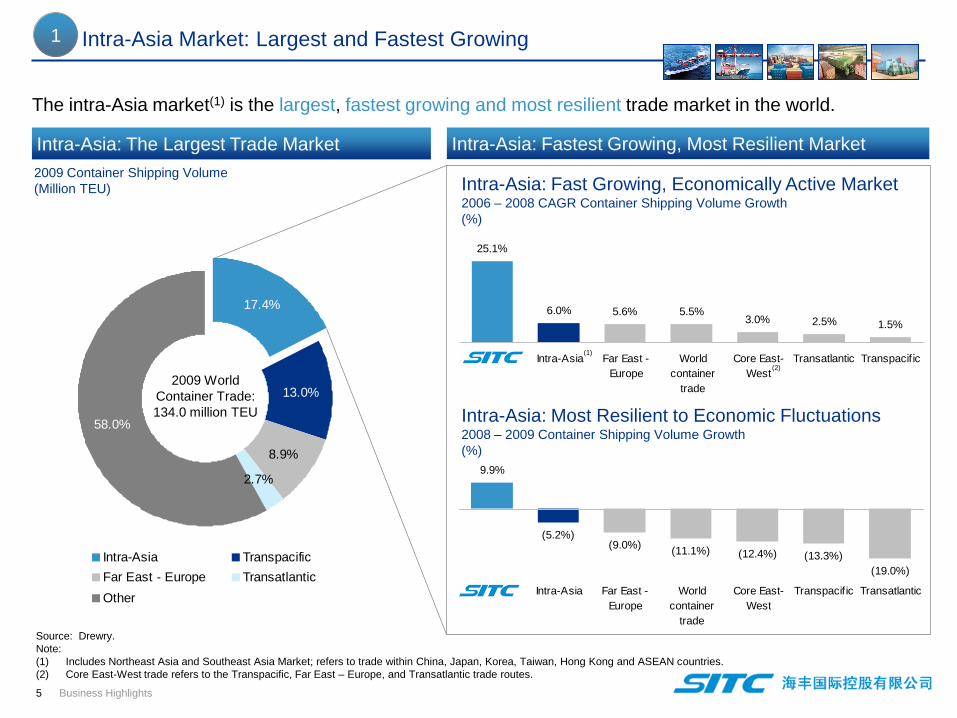
25.1%
6.0% 5.6% 5.5%3.0% 2.5% 1.5%
Intra-Asia Far East -
Europe
World
container
trade
Core East-
West
Transatlantic Transpacific
9.9%
(5.2%)(9.0%)
(11.1%) (12.4%) (13.3%)
(19.0%)
Intra-Asia Far East -
Europe
World
container
trade
Core East-
West
Transpacific Transatlantic
Intra-Asia: Fastest Growing, Most Resilient MarketIntra-Asia: The Largest Trade Market
17.4%
13.0%
58.0%
2.7%
8.9%
Intra-Asia Transpacific
Far East - Europe Transatlantic
Other
2009 World
Container Trade:
134.0 million TEU
Source: Drewry.
Note:
(1) Includes Northeast Asia and Southeast Asia Market; refers to trade within China, Japan, Korea, Taiwan, Hong Kong and ASEAN countries.
(2) Core East-West trade refers to the Transpacific, Far East – Europe, and Transatlantic trade routes.
The intra-Asia market(1) is the largest, fastest growing and most resilient trade market in the world.
2009 Container Shipping Volume
(Million TEU) Intra-Asia: Fast Growing, Economically Active Market2006 – 2008 CAGR Container Shipping Volume Growth
(%)
Intra-Asia: Most Resilient to Economic Fluctuations2008 – 2009 Container Shipping Volume Growth
(%)
(2)
1
(1)
5 Business Highlights

7,743 7,730
8,057
7,519
8,239
2006 2007 2008 2009 2010E
Our Leading Position in the Intra-Asia Market
845
1,080
1,187
995
2007 2008 2009 9M 2010
14,134
15,760
16,543
15,806
17,349
2006 2007 2008 2009 2010E
Southeast Asia Market (1)
Northeast Asia Market (1)
Growth driven by strong
economic growth in Southeast
Asia countries, especially
Thailand and Vietnam
The Northeast Asia Market is mature and has stable growth while the Southeast Asia Market is fast growing and
emerging. We have a leading position in the Northeast Asia Market. Since 2004, we entered into the Southeast
Asia Market and have achieved strong growth.
Connects the PRC and Japan,
the second and third largest
economies in the world,
respectively
These countries have fast
growing industrial sectors with
high import demand for raw
materials
Lower tariffs from China –
ASEAN Free Trade Agreement
in January 2010 to further
boost trade between PRC and
ASEAN countries
(Thousand TEU)
1
Our Container Shipping Volume
(Thousand TEU)
(Thousand TEU)
Source: Drewry.
(1) The Northeast Asia Market refers to trade solely between the PRC, Japan and China while the Southeast Asia Market
refers to trade within intra-Asia that involves Taiwan, Hong Kong or ASEAN countries6 Business Highlights

Integrated “One-Stop” Logistics Services
Our integrated “one-stop” services provide high quality and convenient supply chain solutions for our
customers.
Our sea freight logistics and land-based logistics business are closely interconnected and are equally important profit drivers
for our business.
Our ability to provide one-stop shop services is crucial to maintaining our long-term customer relationships.
Our presence along the logistics value chain allows us to provide high quality and consistent service.
2
Manufacturer Retailer
Land
TransportationDepot and
Warehousing
Freight
Forwarding ShippingCustoms
Clearance
Ship
Agency
7 Business Highlights
Extensive Logistics Service Network2
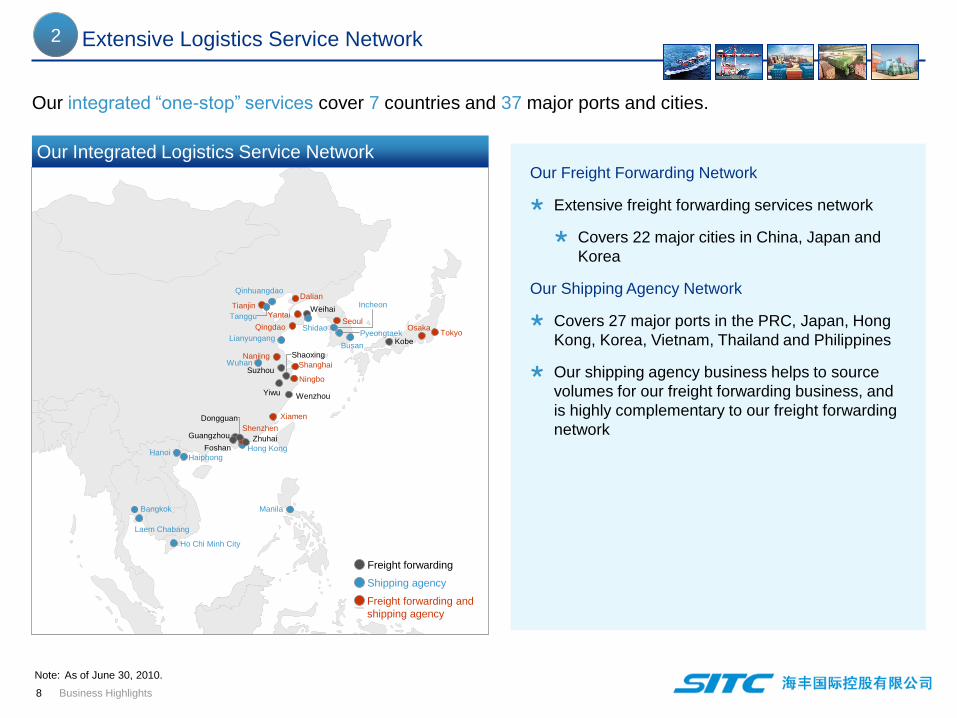
Our integrated “one-stop” services cover 7 countries and 37 major ports and cities.
Our Freight Forwarding Network
Extensive freight forwarding services network
Covers 22 major cities in China, Japan and
Korea
Our Shipping Agency Network
Covers 27 major ports in the PRC, Japan, Hong
Kong, Korea, Vietnam, Thailand and Philippines
Our shipping agency business helps to source
volumes for our freight forwarding business, and
is highly complementary to our freight forwarding
network
Freight forwarding
Shipping agency
Freight forwarding and
shipping agency
Our Integrated Logistics Service Network
Lianyungang
Hong Kong
Qinhuangdao
Manila
Ho Chi Minh City
ShidaoTokyo
Haiphong
Wenzhou
Guangzhou
Seoul
Hanoi
Bangkok
Kobe
Weihai
Dalian
Qingdao
Tianjin
Shanghai
Yantai
Ningbo
Xiamen
Nanjing
Shenzhen
Suzhou
Yiwu
Shaoxing
Osaka
Busan
ZhuhaiFoshan
Dongguan
Incheon
Pyeongtaek
Laem Chabang
Tanggu
Wuhan
8 Business Highlights
Note: As of June 30, 2010.

Highly Efficient Integrated Logistics Park Business Model
Description
Joint ventures with international and PRC-based blue-chip
companies
Include Maersk, Tsingdao Beer, Singamas, Itochu, and
Hanjin
Approximately 480,000m2 of depot and 47,000m2 of
warehousing space
Real-time monitoring of warehousing operations and
inventory management systems
Qingdao Logistics Park
Our Qingdao Logistics Park was awarded the PRC Logistics
Award for Best Solution Design from the China
Communications and Transport Association
Formed joint ventures with blue chip customers to provide
tailored logistics services, enhancing customer loyalty
Warehouses equipped with computer systems that enable
real-time operations management and allow customers to
make service inquiries online
Proximity to port, major expressway and train station
Facilitates interaction between parties involved in the supply
chain
We enhance customer loyalty through win-win partnerships to provide depot and warehousing services with
our domestic and international blue chip customers.
JV Partner JV Description
Warehousing and value-
added (e.g. goods inspection)
services
Depot and warehousing
services
Depot and warehousing
services
Location
Qingdao
Qingdao
Qingdao
Refrigerated warehousing
services
Qingdao
Depot and warehousing
services
Qingdao
Depot and warehousing
services
Shanghai
2
9 Business Highlights
Note: As of June 30, 2010.
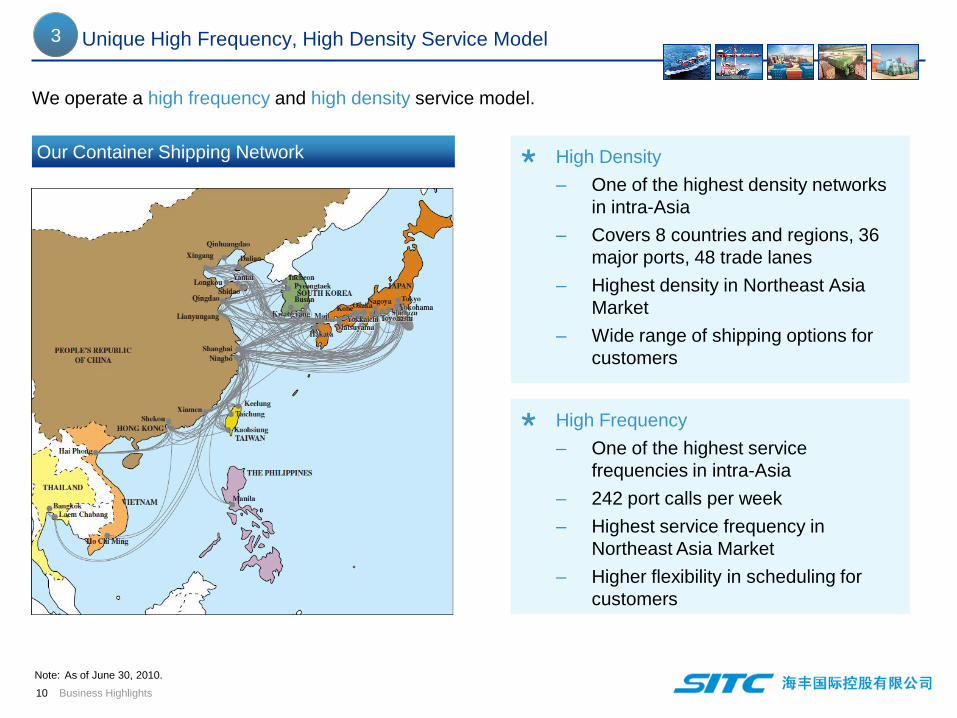
Unique High Frequency, High Density Service Model
High Density
– One of the highest density networks
in intra-Asia
– Covers 8 countries and regions, 36
major ports, 48 trade lanes
– Highest density in Northeast Asia
Market
– Wide range of shipping options for
customers
High Frequency
– One of the highest service
frequencies in intra-Asia
– 242 port calls per week
– Highest service frequency in
Northeast Asia Market
– Higher flexibility in scheduling for
customers
Our Container Shipping Network
We operate a high frequency and high density service model.
3
10 Business Highlights
Note: As of June 30, 2010.

Manila
Tokyo
Advantage of Our Network Driven Model
Hong Kong
Shanghai
Bangkok
Ho Chi Ming
Model Network Driven Model Hub-Spoke Model
Players SITC Other container shipping companies
Illustrative
Diagram
Objective Maximize overall vessel load factors Fill large vessel on the long-haul route using small
feeder vessels
Resilience Adapt shipping routes to achieve optimal
overall load factors
Profitability may be affected due to inability to fill
large vessels during industry downturn
Routes Uses a combination of point-to-point,
continuous loop and network services
Able to flexibly combine different service
formats within network
Relatively linear routes that call at major ports
In contrast to many long-haul carriers and feeder service providers that use the hub-spoke shipping model,
our model seeks to optimize efficiency and profitability through our high-frequency, high-density short-haul
service network
Hong Kong
(Hub)
Feeder lines
connect various
points within
network to the hub
New York
(Hub)
Source: Drewry.
3
Pyeongtaek
Haiphong
11 Business Highlights

Single-Typed, Flexible Fleet Drives Our Network Driven Model
Our single-typed fleet provides us with higher flexibility and lower vessel costs, and is fundamental to our
network driven model.
3
86%
14%
Young fleet with average age of 5.7 years. Younger
vessels are more efficient, technologically advanced and
have lower maintenance cost
1,000 TEU type vessel best suits our business model in
terms of space utilization, operating efficiency and speed
Lower operating cost from lower port charges and lower
maintenance cost as a result of fleet standardization
Uniformed fleet provides higher flexibility in allocating
vessels along different routes1,000 TEU type
Other
36 of 42 Vessels are 1,000 TEU Type
Self owned
Chartered
15 Out of 42 Vessels Are Self Owned
Able to flexibly adjust fleet size to respond to changing
demand, with large proportion of chartered vessels on
one year charters
Self owned vessels purchased at relatively low cost,
providing long term cost advantage
36%
64%
12 Business Highlights
Note: As of June 30, 2010.
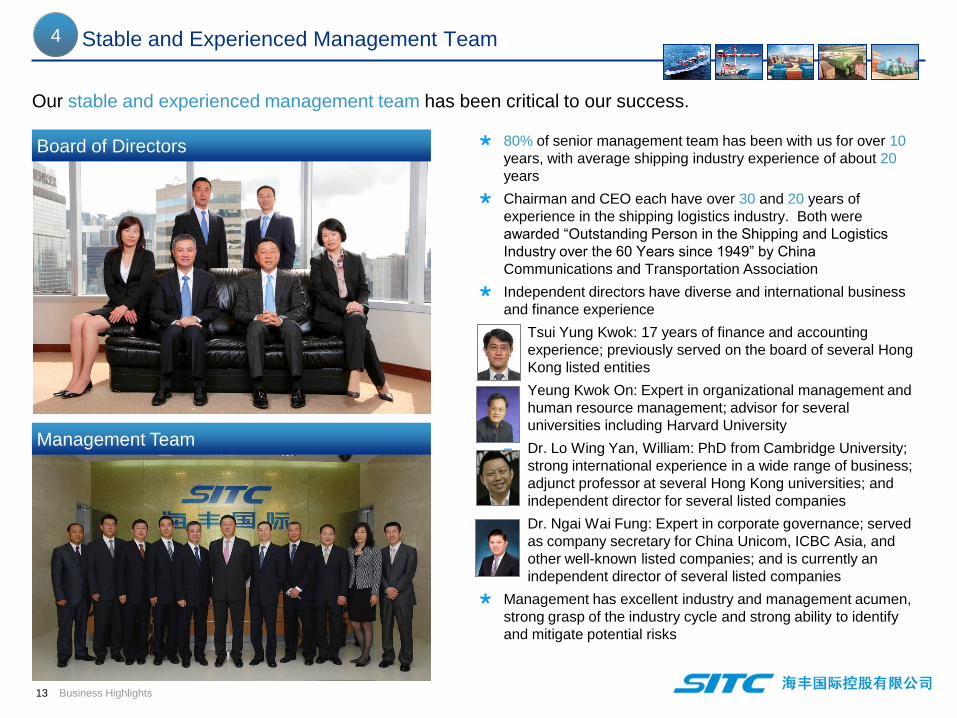
Stable and Experienced Management Team
80% of senior management team has been with us for over 10
years, with average shipping industry experience of about 20
years
Chairman and CEO each have over 30 and 20 years of
experience in the shipping logistics industry. Both were
awarded “Outstanding Person in the Shipping and Logistics
Industry over the 60 Years since 1949” by China
Communications and Transportation Association
Independent directors have diverse and international business
and finance experience
– Tsui Yung Kwok: 17 years of finance and accounting
experience; previously served on the board of several Hong
Kong listed entities
– Yeung Kwok On: Expert in organizational management and
human resource management; advisor for several
universities including Harvard University
– Dr. Lo Wing Yan, William: PhD from Cambridge University;
strong international experience in a wide range of business;
adjunct professor at several Hong Kong universities; and
independent director for several listed companies
– Dr. Ngai Wai Fung: Expert in corporate governance; served
as company secretary for China Unicom, ICBC Asia, and
other well-known listed companies; and is currently an
independent director of several listed companies
Management has excellent industry and management acumen,
strong grasp of the industry cycle and strong ability to identify
and mitigate potential risks
Our stable and experienced management team has been critical to our success.
4
Board of Directors
Management Team
13 Business Highlights

Management Team Has Strong Grasp of Industry Cycle
1,000 – 1,100 TEU New-Build Prices
10
15
20
25
30
1998 1999 2000 2001 2002 2003 2004 2005 2006 2007 2008 2009 2010
Source: Clarksons, Company.
Our management team has strong grasp of the industry cycle, purchasing a majority of our vessels at
relatively low prices, giving us a long term cost advantage
(US$ million)
4
Purchased 2
ships in 2001
1,694 TEU
Purchased 4
ships in 2004
3,628 TEU
Purchased 1
ship in 2007
938 TEU
Purchased 3
ships in 2003
2,493 TEU
40%
drop
Purchased 3
ships in 2009
3,048 TEU
Purchased 2
ships in 1998
1,574 TEU
14 Business Highlights

3. Business Strategy

Business Strategy
Strengthen and Expand Our Intra-Asia Service Network, and Replicate Our Integrated Services Model
Throughout Our Network1
Expand Fleet and Optimize Composition2
Seek Opportunities for Complementary Acquisitions and Partnerships3
Northeast Asia Market: Solidify our leading position and create additional headroom for growth. Expand into
South China and Northeast Asia countries trade
Southeast Asia Market: Capture growth opportunities through route and network expansion
Acquire new sites to build warehousing and other logistics facilities near ports
Replicate integrated services model throughout intra-Asia network, beginning with Ningbo, Shanghai and
Vietnam.
Enhance Information Technology Systems4
Take advantage of attractive new build prices to expand our fleet and further solidify our long term cost
advantage
Expand self-owned fleet by 15 to 25 vessels by 2013
Our long term objective is to be a world-class integrated logistics service provider.
15 Business Strategy

4. Financial Information

6.0%10.3%
4.9%
14.1% 14.6% 16.1%
15.4%
15.3%
Financial Snapshot
(US$ million)
Net Income and Net Income Margin
Gross Profit and Gross Profit Margin
88.634.3 35.4 37.1
32.5
4.6
2007 2008 2009 9M 2010
6.0%4.6%
13.7%
5.3%
Share based
compensation
Profit from continuing
operationsMargin
(US$ million) Sea Freight Logistics Land-Based Logistics
24.459.6 77.031.8
40.7
43.8
47.756.2
100.4
70.0
124.7
26.2
2007 2008 2009 9M 2010
16 Financial Information
353.7497.0
346.1
222.7
274.9264.0
301.3
576.4
771.9694.2
647.4
430.1
2007 2008 2009 9M 2010
Revenue
(US$ million) Sea Freight Logistics Land-Based Logistics
(%)
Return on Equity and Return on Assets
85.1%
42.6%
32.6%41.1%
13.6% 11.3% 10.2%14.8%
2007 2008 2009 1H 2010
Return on equity Return on assets

Sea Freight Logistics Revenue and Profitability
11.7%
58.4%29.9%
Equipment and cargo transportation
Voyage
Vessel
Container Shipping Volume and Freight Rate
845
1,0801,187
846995
2007 2008 2009 9M
2009
9M
2010
300
400
500
600
2007 2008 2009 9M
2009
9M
2010
Container Shipping Volume
(Thousand TEU)
Average Freight Rate
(US$/TEU)
(1) Revenue before inter-segment elimination.
Cost of Sales Breakdown
Container handling costs
Container rental and
depreciation
Slot swap expenses
Other container handling
and equipment related
costs
Time-charter fees
Vessel crew
expenses
Vessel depreciation
and maintenance
24.4
59.6
26.2
4.0
77.0
4.9%
15.4%
6.0%
10.3%1.1%
2007 2008 2009 9M 2009 9M 2010
Margin
Gross Profit and Margin
Fuel
Port charges
9M 2010 Cost of Sales Breakdown
(%)(US$ million)
408.1
580.1534.1
373.0
499.7
2007 2008 2009 9M 2009 9M 2010
Sea Freight Logistics Revenue(1)
(US$ million)
17 Financial Information
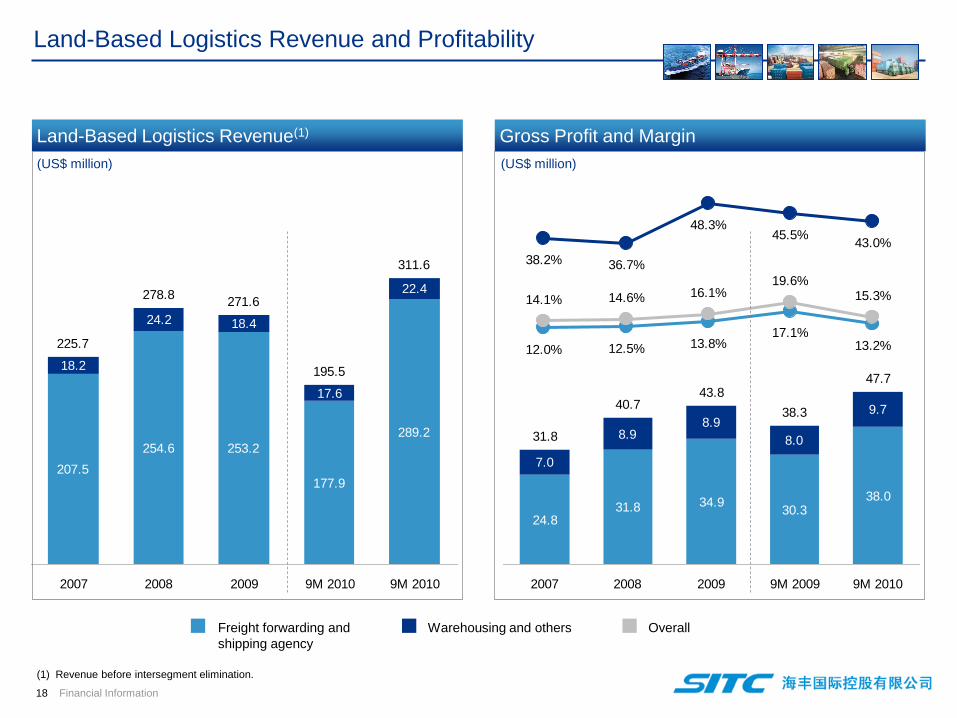
12.0% 12.5% 13.8%17.1%
13.2%
38.2% 36.7%
48.3%45.5%
43.0%
14.1% 14.6% 16.1%19.6%
15.3%
Land-Based Logistics Revenue and Profitability
24.831.8 30.3
38.0
7.0
8.9 8.0
9.7
31.8
40.743.8
38.3
47.7
34.9
8.9
2007 2008 2009 9M 2009 9M 2010
Land-Based Logistics Revenue(1)
207.5
254.6
177.9
289.2
18.2
24.2 18.4
17.6
22.4
225.7
278.8271.6
195.5
311.6
253.2
2007 2008 2009 9M 2010 9M 2010
Freight forwarding and
shipping agency
Warehousing and others
(US$ million)
Gross Profit and Margin
Overall
(US$ million)
(1) Revenue before intersegment elimination.
18 Financial Information