site-dependent free energy barrier for proton reduction on mos2
TRANSCRIPT

LLNL-JRNL-639087
Site-dependent free energybarrier for proton reduction onMoS2 edges
W. Choi, B. C. Wood, E. Schwegler, T. Ogitsu
June 14, 2013
Journal of Physical Chemistry C

Disclaimer
This document was prepared as an account of work sponsored by an agency of the United States government. Neither the United States government nor Lawrence Livermore National Security, LLC, nor any of their employees makes any warranty, expressed or implied, or assumes any legal liability or responsibility for the accuracy, completeness, or usefulness of any information, apparatus, product, or process disclosed, or represents that its use would not infringe privately owned rights. Reference herein to any specific commercial product, process, or service by trade name, trademark, manufacturer, or otherwise does not necessarily constitute or imply its endorsement, recommendation, or favoring by the United States government or Lawrence Livermore National Security, LLC. The views and opinions of authors expressed herein do not necessarily state or reflect those of the United States government or Lawrence Livermore National Security, LLC, and shall not be used for advertising or product endorsement purposes.

1
Site-dependent free energy barrier for proton
reduction on MoS2 edges
Woon Ih Choi, Brandon C. Wood, Eric Schwegler, Tadashi Ogitsu*
Quantum Simulations Group, Lawrence Livermore National Laboratory, Livermore CA 94550
KEYWORDS: Hydrogen Evolution Reaction, Catalyst, MoS2, DFT, Volmer Reaction
We calculated the adiabatic free energy surface of the proton reduction reaction on catalytically
active MoS2 edge atoms by combining density functional theory with the Anderson-Newns
model, which accounts for solvent fluctuation and charge transfer in the context of Marcus
theory. This framework combines three different contributions to the associated reaction
energetics and kinetics, namely, the relevant electronic orbitals of the substrate, the possibility of
surface relaxation upon adsorption, and the impact of solvation. Under the assumption of fixed
edge geometry throughout the reaction, we calculate the free energy barriers on edge S and Mo
sites to be 0.65 and 0.01 eV, respectively. However, if we consider surface relaxation, the barrier
on the edge S site is lowered by more than half. On edge Mo sites, the dz2 orbital is responsible
not only for the strength of binding but also for the low free energy barrier. On edge S sites, the
bound hydrogen atom always retains some finite positive charge, which indicates that it remains
partially solvated even after surface binding. In this case, it is crucial to account for the solvation
energy in addition to the gas-phase adsorption energy when assessing hydrogen catalysis.

2
INTRODUCTION
Solar hydrogen production using photoelectrochemical (PEC) cells provides an efficient way
to convert sunlight directly into a storable form of fuel [1,2,3,4,5]. To reach economically viable
cost and efficiency, we need to have proper electrode materials that satisfy several design
requirements [1,6]. A good photoelectrode should absorb as much light as possible from the solar
spectrum with the constraint of water redox potentials. It should also efficiently separate charge
carriers from the photogenerated electron-hole pairs and drive them towards the corresponding
interfaces for the desired gas evolution reactions. For example, in a photocathode, electrons are
pushed to the electrolyte interface, where they drive the hydrogen evolution reaction (HER),
whereas holes are directed toward the counter electrode for oxygen evolution. Unfortunately,
most photoelectrode materials that are good light absorbers and have high carrier mobilities are
poor catalysts for the HER. Accordingly, co-catalyst nanoparticles are commonly deposited on
the cathode surface to make it catalytically active [2]. However, the best HER catalysts, such as
Pt, tend to be expensive and available only in limited quantities.
In the search for earth-abundant and inexpensive materials to replace precious metal HER
catalysts, MoS2 has been drawing a great deal of attention [10,11,12]. MoS2 has a layered
structure consisting of a central Mo layer sandwiched by two S layers, each chemically bound to
the Mo atoms. This repeating trilayer unit forms the basis of bulk MoS2, where it binds via weak
van der Waals interactions. Single-layered MoS2 nanoparticles with triangular shapes have been
synthesized on Au(111) surfaces using physical vapor deposition (PVD) [10,11]. Scanning
tunneling microscopy (STM) together with electronic structure calculations showed that these
particles have metallic edge states, which were demonstrated to be the catalytically active sites
[8,9]. Recently, Kibsgaard et al. synthesized nanoporous double-gyroid MoS2 structures, which

3
have more exposed active edge sites than MoS2 nanoparticles [11]. In addition, Li et al.
developed solvothermal synthesis of MoS2 nanoparticles on reduced graphene oxide (RGO) in
order to improve electrical coupling with the supporting charge transport layer [12]. They
suggested that the HER on RGO-supported MoS2 occurs via a Volmer-Heyrovsky reaction, as
indicated by a Tafel slop of ~ 41 mV/decade. Nevertheless, a more detailed theoretical
understanding grounded in an atomistic and orbital picture would prove extremely beneficial for
engineering MoS2 towards further improved catalytic properties.
The relative free energy of surface hydrogen in vacuum with respect to a gas-phase H2
molecule is often used as a theoretical descriptor of HER catalysis. However, there could be
different free energy barriers for different hydrogen binding sites if the relevant orbital state
varies. For instance, in MoS2, Mo and S have different orbital states (4d and 3p) that are
responsible for H binding. Accordingly, we may expect different charge transfer barriers for each
site. In addition, a vacuum-based model does not account for changes in the solvation energy,
which could significantly affect calculated adsorption energies and barriers.
In order to calculate the site-dependent charge transfer barrier while implicitly accounting
for solvation effects, we adopt the method suggested by Santos et al. [13], which combines
density functional theory (DFT) calculations with model equations. They previously applied their
method to the Volmer reaction on several metallic systems where the proton discharge step is
considered to be rate limiting, and were able to obtain zero-bias exchange current densities that
were comparable to available experimental values [13]. Using this method, we calculate the
adiabatic free energy surface (FES) of the first step of the HER—the proton discharging step
(Volmer reaction). Although the Tafel slope suggests that the subsequent Heyrovsky step limits

4
the overall HER rate on MoS2 [12], we have chosen the Volmer step to illustrate how the charge
transfer barrier changes depending on binding sites.
1. COMPUTATIONAL DETAILS
2.1 Model equations
For completeness, we first describe the method [13,17-19] we used to construct the
adiabatic free energy surfaces for the Volmer reaction. When considering proton discharge at the
electrode/electrolyte interface, there are two different kinds of interactions that should be taken
into account. The first is the chemical interaction between the electronic states of an approaching
H, H+, or hydrogen with some intermediate charge state (H/H
+ hereafter), and the surface states.
The Anderson-Newns model [14,15] describes this component. The second is the solvent
dynamics surrounding H/H+, which is included in model equations derived from the Marcus
theory of charge transfer [16]. From an atomistic point of view, individual solvent molecules
fluctuate around the H/H+. On average, these fluctuations can be represented in a statistical sense
as an effective solvent coordinate q. The solvent coordinate can also be understood as the
effective dipolar screening charge contributed by the solvation shell of H/H+ at equilibrium,
which is directly contrary to the charge on the solvated hydrogen. Therefore, q varies from 0 (H)
to -1 (H+) as the net dipole interaction with the solvation shell increases.
Solvent effects in this model raise the electronic energy of hydrogen since they mimic a
negative dipole directed toward H/H+. If solvent effects push a certain portion of electron density
above the Fermi level, then there is a gain in solvation energy proportional to that charge portion.
A negative solvent coordinate always increases the electronic energy; however, it results in
solvation energy gain only if some portion of electronic density crosses the Fermi level. These
5
two competing effects result in different equilibria depending on the density of states of
hydrogen, which in turn is determined by the chemical interaction with relevant surface states.
Since the chemical interaction itself is a function of the distance from the surface, mapping out
the adiabatic free energy surface equates to examining solvent effects (q) at various distances (d).
As explained above, the chemical interaction and solvent effects are intimately coupled
during the charge transfer reaction. Santos et al. established equations that couple these effects
by solving the total Hamiltonian using the Green’s function method [13,17,18]. The resulting
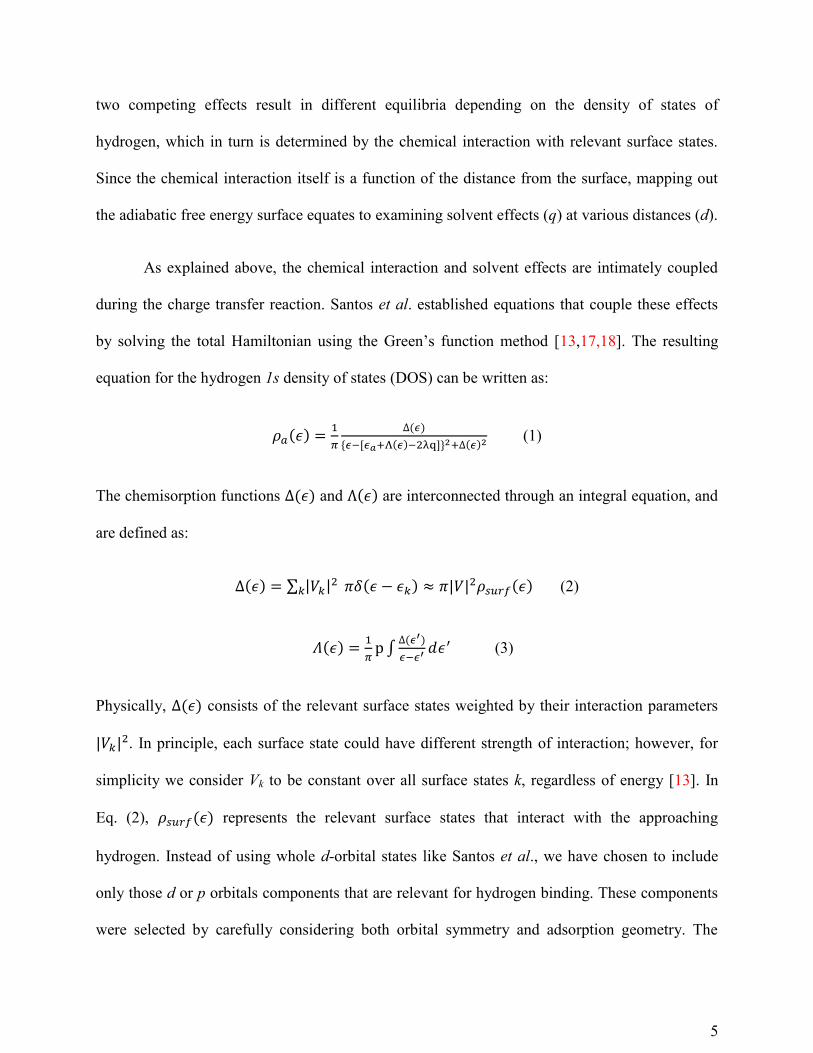
equation for the hydrogen 1s density of states (DOS) can be written as:
( )
( )
( ) ( ) (1)
The chemisorption functions ( ) and ( ) are interconnected through an integral equation, and
are defined as:
( ) ∑ | |
( ) | | ( ) (2)
( )
∫
( )
(3)
Physically, ( ) consists of the relevant surface states weighted by their interaction parameters
| | . In principle, each surface state could have different strength of interaction; however, for
simplicity we consider Vk to be constant over all surface states k, regardless of energy [13]. In
Eq. (2), ( ) represents the relevant surface states that interact with the approaching
hydrogen. Instead of using whole d-orbital states like Santos et al., we have chosen to include
only those d or p orbitals components that are relevant for hydrogen binding. These components
were selected by carefully considering both orbital symmetry and adsorption geometry. The
6
electronic energy shift of the hydrogen level due to chemical interaction with the relevant surface
states is described by ( ), which is calculated using Eq (3). The p in Eq. (3) indicates the
principal number.
Because Eq. (1) has a lorentzian form, the interaction constant ultimately determines
the broadening of the DOS. In addition, from Eq. (1), we note that the electronic energy level ( )
can shift not only through the chemical interaction ( ( )) but also by solvent fluctuations (q or
2 q). To estimate the solvation energy ( ), we followed the position-dependent scheme
suggested by Santos et al.[13]. In this scheme, in Eq. (1) varies from 1.5 eV (representing half
solvation at the surface) to 3 eV (representing full solvation away from the surface). The total
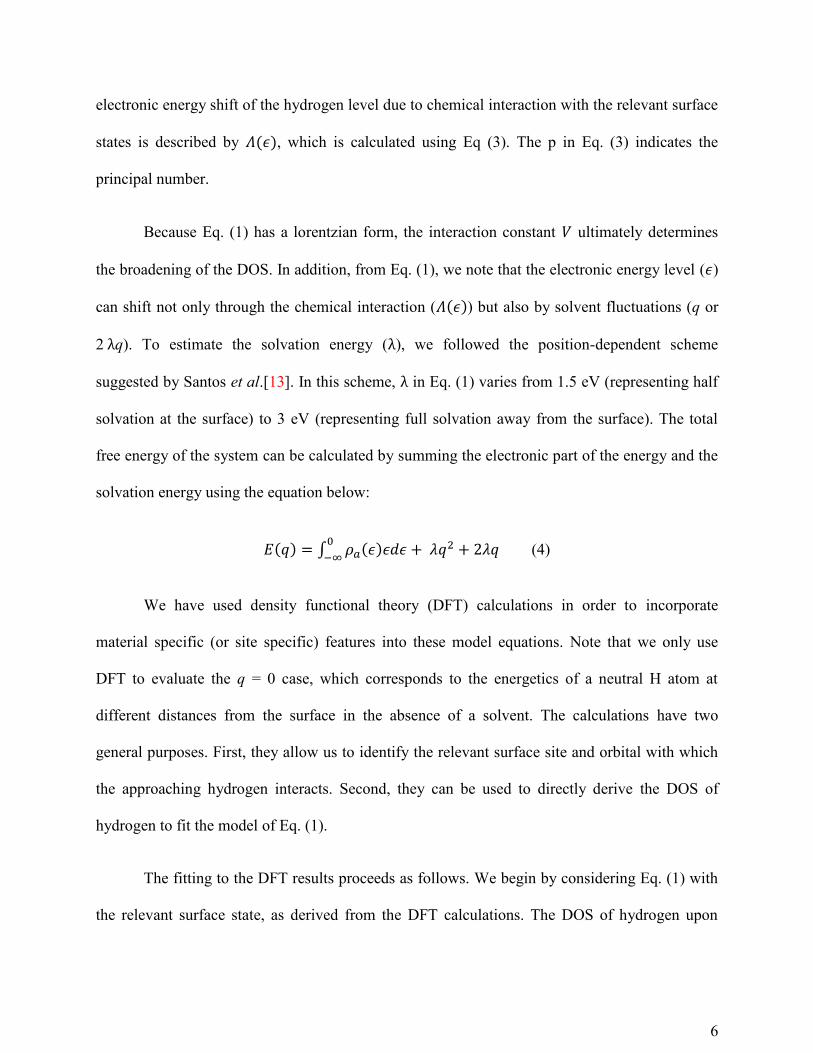
free energy of the system can be calculated by summing the electronic part of the energy and the
solvation energy using the equation below:
( ) ∫ ( )
(4)
We have used density functional theory (DFT) calculations in order to incorporate
material specific (or site specific) features into these model equations. Note that we only use
DFT to evaluate the q = 0 case, which corresponds to the energetics of a neutral H atom at
different distances from the surface in the absence of a solvent. The calculations have two
general purposes. First, they allow us to identify the relevant surface site and orbital with which
the approaching hydrogen interacts. Second, they can be used to directly derive the DOS of
hydrogen to fit the model of Eq. (1).
The fitting to the DFT results proceeds as follows. We begin by considering Eq. (1) with
the relevant surface state, as derived from the DFT calculations. The DOS of hydrogen upon

7
interaction with this surface state is then extracted as a function of the unknown parameters V
and . These parameters are varied at each discrete distance from the surface at 0.1 Å intervals,
and fitted to approximate the DFT-derived hydrogen DOS at each distances. Once proper values
of and have been selected for the q = 0 case, we are able to implicitly include the solvent
effects simply by changing solvent coordinate q from 0 to -1. For details (including some
correction terms) we invite the reader to refer to the original paper by Santos et al. [13].
2.2 DFT calculations
Here we include the details of the DFT calculations used to calculate the projected density of
states of hydrogen, as well as the relevant surface state at each of the binding sites. For the
exchange-correlation functional, we used the Perdew-Burke-Ernzerhof (PBE) [20] version of the
generalized gradient approximation (GGA). Rappe-Rabe-Kaxiras-Joannopoulos (RRKJ)
pseudopotentials [21] were used, as implemented in the Quantum-Espresso package [22]. For
molybdenum, we considered 14 electrons in the valence, including the semi-core 4s and 4p. In
order to describe the ionic character of the Mo—S bond, we also considered an empty 5p state.
We used 50 and 500 Rydberg cutoffs for the kinetic energy of the plane-wave basis and charge
density, respectively.
We examined three different edge terminations. The first was bare Mo-atom-terminated edge
in a ribbon-like MoS2 single layer with exposed zigzag edges, one of which was terminated by
Mo atoms and the other by S atoms. In addition, we considered edge geometries where the Mo
edge was 50% and 100% S atom terminated, since these terminations have been observed in
experiments [10,24,25]. High resolution tunneling electron microscope (HRTEM) measurements
confirmed that 50% S-terminated Mo edge exists when nanoparticles are synthesized on the

8
graphitic support [24]. Mo edges with 100% S terminated are also found when nanoparticles are
grown on the Au(111) surface. [10,26,27]
We first optimized the geometry and cell size of our primitive unit, consisting of 19 atoms with
1.7 nm width perpendicular to the ribbon direction. We then expanded this cell by repeating it
four times along the ribbon direction. Due to the ionic character of Mo-S bond, there are surface
dipoles at ribbon edges that induce a spurious electric field between exposed edges across
periodic images. These effects were eliminated by application of a dipole correction [23]. For a
well-resolved DOS, we sampled 8 k-points along the ribbon direction, which is equivalent to 32
k-points in the primitive cell.
2. RESULTS AND DISCUSSION
For the 100% S-terminated Mo edge, the bonding between the two S atoms at a Mo site is
broken upon the adsorption of hydrogen on either of the S atoms, as shown in Fig 1(d). This
releases a great deal of energy accompanying binding of the first hydrogen. However, once the
S—S bond has been broken, the apparent binding energy of a second hydrogen on the paired S
site will be quite different. As such, the binding energy of hydrogen on 100% S-terminated Mo
edges is ambiguously defined. We therefore focus on evaluating the free energy of the proton
discharging step on the remaining two edge configurations: the bare Mo edge and the 50% S-
terminated Mo edge.
We use the DFT calculations to confirm which edge-site orbitals are primarily
responsible for the adsorption of hydrogen on each site, by projecting onto atomic orbitals. The
relevant Kohn-Sham eigenstates are plotted in Fig 1. Regardless of H coverage, the dz2 orbital is
responsible for the binding of hydrogen on Mo, as shown in Fig. 1 (a) and (b). Note that blue and
9
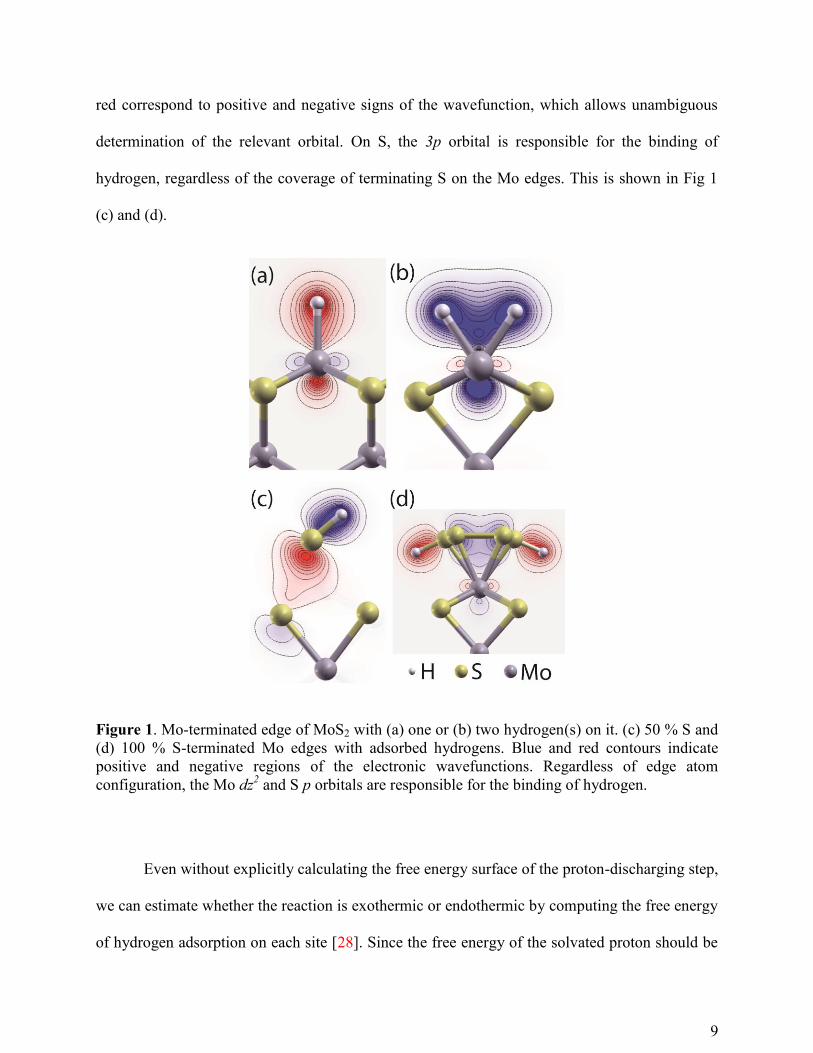
red correspond to positive and negative signs of the wavefunction, which allows unambiguous
determination of the relevant orbital. On S, the 3p orbital is responsible for the binding of
hydrogen, regardless of the coverage of terminating S on the Mo edges. This is shown in Fig 1
(c) and (d).
Figure 1. Mo-terminated edge of MoS2 with (a) one or (b) two hydrogen(s) on it. (c) 50 % S and
(d) 100 % S-terminated Mo edges with adsorbed hydrogens. Blue and red contours indicate
positive and negative regions of the electronic wavefunctions. Regardless of edge atom
configuration, the Mo dz2 and S p orbitals are responsible for the binding of hydrogen.
Even without explicitly calculating the free energy surface of the proton-discharging step,
we can estimate whether the reaction is exothermic or endothermic by computing the free energy
of hydrogen adsorption on each site [28]. Since the free energy of the solvated proton should be

10
the same as H2 gas under equilibrium conditions, usually we compare the relative energy of
surface hydrogen with H2 gas. On top of the static DFT binding energy, we need to consider the
entropic contribution (-TS, T: temperature, S: entropy) of H2 gas, which is -0.41 eV/H2 at room
temperature [28]. We should also consider the zero point energy (ZPE) correction. We find that
the ZPE difference between an isolated H2 molecule and surface hydrogen on a Mo site is almost
negligible (1 meV), whereas on a S site the ZPE is greater than that of H2 by 0.102 eV. We
choose the 50% coverage of hydrogen on 50% S-terminated edge sites since it is known to be
catalytically active [7]. For comparison, we also choose the same coverage for Mo edge. After
considering these corrections, we calculate the free energy of hydrogen adsorption to be -0.48 eV
and +0.14 on Mo and S, respectively. If we rely only on this information, we may judge that the
S sites have better catalytic activity. However, this assumption does not account for the
possibility of different charge transfer barriers for the two sites. With this motivation, we applied
the method we outlined above.
Using DFT, we first calculate the electronic structure of the bare surface for the specific
orbital state we identified. In doing so, we also consider the adsorption geometry. For example,
for the edge S atom, we start with the 3Pz orbital for the adsorption geometry shown in Fig 2(a).
We then fit the electronic DOS of hydrogen obtained by substituting the surface 3Pz orbital state
into Eqs. (1), (2), and (3), to that derived directly from DFT in order to extract reliable model
parameters for proper description of the chemical interaction. We obtain qualitative agreement
between the two formulations of the DOS, as shown for hydrogen at the S edge site in Fig 2(b).
11
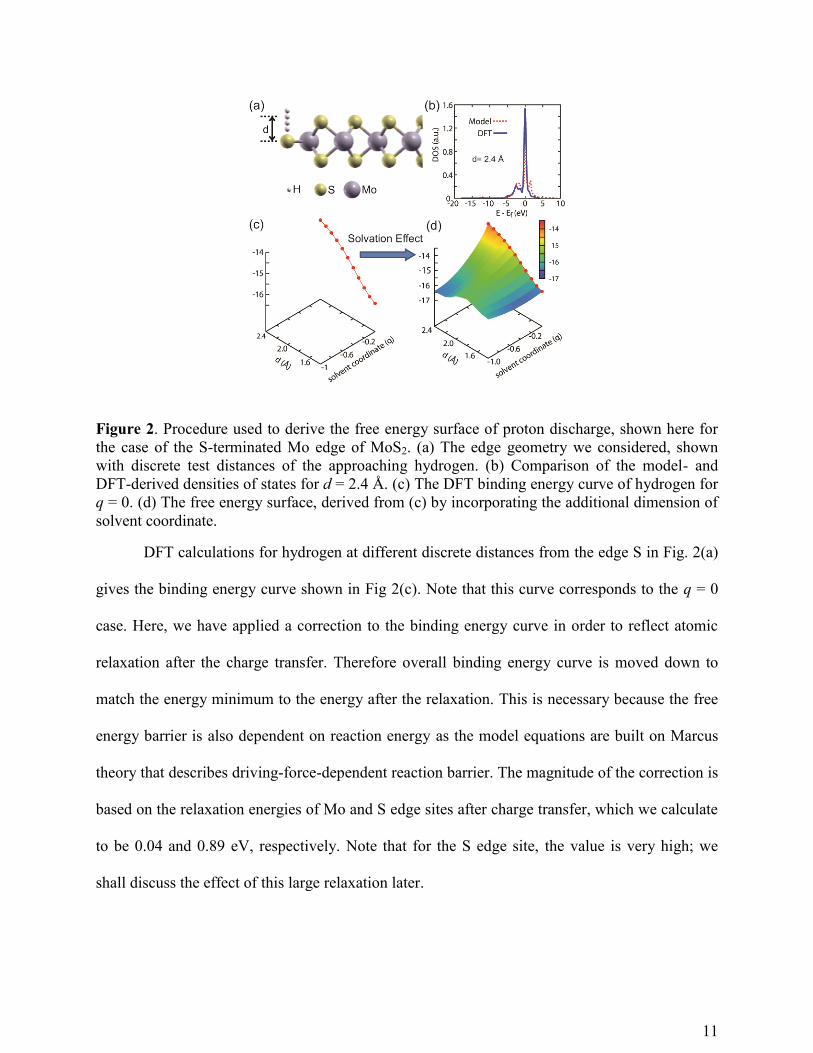
Figure 2. Procedure used to derive the free energy surface of proton discharge, shown here for
the case of the S-terminated Mo edge of MoS2. (a) The edge geometry we considered, shown
with discrete test distances of the approaching hydrogen. (b) Comparison of the model- and
DFT-derived densities of states for d = 2.4 Å. (c) The DFT binding energy curve of hydrogen for
q = 0. (d) The free energy surface, derived from (c) by incorporating the additional dimension of
solvent coordinate.
DFT calculations for hydrogen at different discrete distances from the edge S in Fig. 2(a)
gives the binding energy curve shown in Fig 2(c). Note that this curve corresponds to the q = 0
case. Here, we have applied a correction to the binding energy curve in order to reflect atomic
relaxation after the charge transfer. Therefore overall binding energy curve is moved down to
match the energy minimum to the energy after the relaxation. This is necessary because the free
energy barrier is also dependent on reaction energy as the model equations are built on Marcus
theory that describes driving-force-dependent reaction barrier. The magnitude of the correction is
based on the relaxation energies of Mo and S edge sites after charge transfer, which we calculate
to be 0.04 and 0.89 eV, respectively. Note that for the S edge site, the value is very high; we
shall discuss the effect of this large relaxation later.

12
Having fitted the interaction parameters at every distance we want to examine, we next
proceed to include solvation effects through the effective solvent coordinate q in order to extract
the full adiabatic free energy surface. This is shown for the S edge site in Fig 2(d). We
immediately notice that there are two minima for the free energy surface. The first is at 1.4 Å
with q = -0.2, and is indicative of chemisorbed hydrogen at the surface. The second is at 2.4 Å
with q = -1, which represents the solvated proton at the maximum tested distance.
Figure 3. Adiabatic free energy surfaces for the proton discharge step (Volmer reaction) on edge
(a) Mo and (b) S sites. The calculated free energy barriers are 0.01 and 0.65 eV, respectively.
Repeating the entire procedure for edge Mo site and comparing with the edge S site
yields the results presented in Fig 3(a) and (b). Note that in each case, we have adjusted the zero
of energy to coincide with the fully solvated proton case (d = 2.4 Å; q = -1). We conclude that
the Volmer reaction on the Mo edge is exothermic but has a very low free energy barrier
(0.01eV) due to the d-orbital character of the Mo atom. In contrast, the reaction energy on the S
edge is small but has a relatively large free energy barrier (0.65 eV).
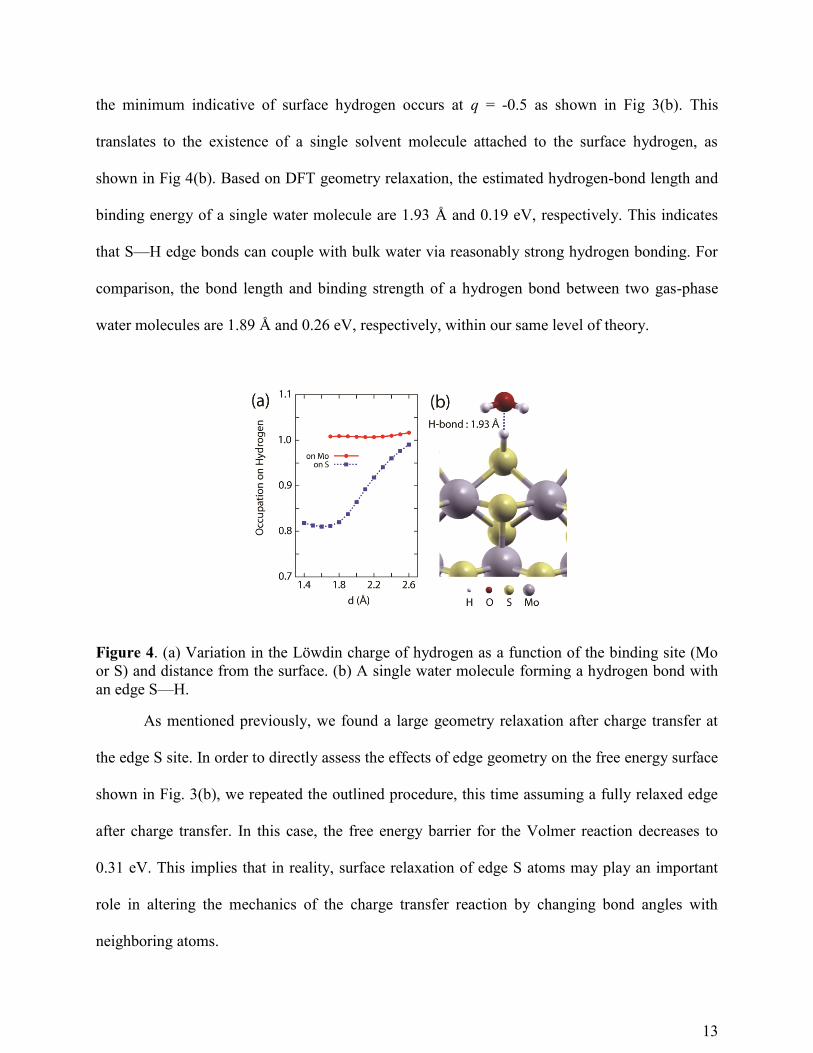
We also paid attention to the DFT-derived charge state of hydrogen at all tested distances
for q = 0. This dependence is shown in Fig 4(a) for the edge Mo and edge S sites. In contrast to
the almost constant charge of hydrogen on the edge Mo site, the charge state on the edge S site
varies significantly with distance. Applying our model for the edge S case, it turns out that one of
13
the minimum indicative of surface hydrogen occurs at q = -0.5 as shown in Fig 3(b). This
translates to the existence of a single solvent molecule attached to the surface hydrogen, as
shown in Fig 4(b). Based on DFT geometry relaxation, the estimated hydrogen-bond length and
binding energy of a single water molecule are 1.93 Å and 0.19 eV, respectively. This indicates
that S—H edge bonds can couple with bulk water via reasonably strong hydrogen bonding. For
comparison, the bond length and binding strength of a hydrogen bond between two gas-phase
water molecules are 1.89 Å and 0.26 eV, respectively, within our same level of theory.
Figure 4. (a) Variation in the Löwdin charge of hydrogen as a function of the binding site (Mo
or S) and distance from the surface. (b) A single water molecule forming a hydrogen bond with
an edge S—H.
As mentioned previously, we found a large geometry relaxation after charge transfer at
the edge S site. In order to directly assess the effects of edge geometry on the free energy surface
shown in Fig. 3(b), we repeated the outlined procedure, this time assuming a fully relaxed edge
after charge transfer. In this case, the free energy barrier for the Volmer reaction decreases to
0.31 eV. This implies that in reality, surface relaxation of edge S atoms may play an important
role in altering the mechanics of the charge transfer reaction by changing bond angles with
neighboring atoms.

14
We also investigated the dependence of the free energy barrier on hydrogen binding
geometry by examining an in-plane hydrogen approach. In this case, it turns out that free energy
barrier increases to 1.2 eV. This indicates that there is a favored approach direction for protons to
move from the electrolyte to the catalytic edge S site. Any preferred directionality is likely to be
closely related to the electronic structure of the edge, or to the orbital hybridization.
In trying to access the catalytic activity of certain material, the most common approach
has been to simply calculate the free energy of adsorption in vacuum, and then judge how close
this energy is to zero. However, our simulations indicate that solvation effects need to be
considered in addition to the adsorption energy in vacuum, especially when the binding site is an
anion. In fact, our simulations suggest that the energy of surface hydrogen can be lowered by the
order of hydrogen-bond energy in the solvent, compared to the calculated energy in vacuum. We
believe that the common approach for assessing catalytic activity based only on hydrogen
binding energy in vacuum may still have validity at metal atom sites; this seems to be supported
by our results for the Mo site. However, the surfaces of such materials are often intentionally or
unintentionally decorated with metal oxide or anionic functional groups such as surface
hydroxyl. In these instances, solvation effects of surface hydrogen on anionic sites including
surface hydroxyl are still likely to be important, and should therefore be considered in realistic
models [29].
3. CONCLUSION
We have adopted the method of Santos et al., which combines DFT with the Anderson-
Newns model, to calculate the adiabatic free energy barriers for proton discharge on catalytically
active MoS2 edge sites. Bare Mo sites have a small charge transfer barrier, connected to the

15
presence of the Mo dz2 orbital. Nevertheless, the binding energy of H on these sites is quite
strong when compared with the energy of the H2 molecule. In contrast, 50% S-terminated Mo
sites have a large charge transfer barrier if one assumes fixed positions of edge S atoms during
charge transfer, even though the binding energy is closer to the optimal. If we instead account for
relaxation of the edge geometry of the S edge atoms, then the energy barrier of proton discharge
decreases significantly. Our results suggest that edge relaxation of S atoms could play a vital role
in catalytic hydrogen evolution by coupling the surface to the dynamics of bulk water via
hydrogen bonding. In this regard, investigating the geometrical degrees of freedom explored by
the edge S atoms could provide valuable insight into the catalytic activity; this would be an
interesting avenue for a future quantum molecular dynamics study. In addition, the Mo dz2
orbital plays an important role in reducing the charge transfer barrier, as well as in determining
the binding strength. Together, the insights provided by our simulations should prove beneficial
for efforts towards further optimization of the catalytic properties of MoS2 by tuning the
electronic properties or modifying the edge chemistry.
AUTHOR INFORMATION
Corresponding Author
Tel: +1-925-422-8511, Email: *[email protected]
ACKNOWLEDGMENT
The authors acknowledge helpful discussions with E. Santos (U. of Ulm, Germany).
Computing support came from the Lawrence Livermore National Laboratory (LLNL)
Institutional Computing Grand Challenge program. This work was performed under the auspices
of the U.S. Department of Energy by LLNL under Contract DE-AC52-07NA27344.
16
REFERENCES
1. Bak, T.; Nowotny, J.; Rekas, M.; Sorrell, C. C. Int. J. of Hyd. Energy 2002, 27, 991
2. Walter, M. G.; Warren, E. L.; McKone J. R.; Boettcher, S. W.; Elizabeth, Q. M.; Santori,
A.; Lewis, N. S. Chem. Rev. 2010, 110, 6446
3. Lewis, N. S.; Nocera, D. G. Proc. Natl. Acad. Sci. USA 2006, 103, 15729–15735
4. Gratzel, M. Nature 2001, 414, 338
5. Khaselev, O.; Turner, J. A. Science 1998, 280, 425
6. Turner, J.; Sverdrup, G.; Mann, M. K.; Maness, P.-C.; Kroposki, B.; Ghirardi, M.; Evans,
R. J.; Blake, D. Int. J. Energy Res. 2008, 32, 379–407
7. Hinnemann, B.; Moses, P. G.; Bonde, J.; Jorgensen, K. P.; Nielsen, J. H.; Horch, S.;
Chorkendorff, I.; Nørskov, J. K. J. Am. Chem. Soc. 2005, 127, 5308.
8. Jaramillo, T. F.; Jørgensen, K. P.; Bonde, J.; Nielsen J. H.; Horch, S.; Chorkendorff, I.
Science 2007, 317, 100
9. Helveg, S.; Lauritsen, J. V.; Lægsgaard, E.Stensgaard, I.; Nørskov, J. K.; Clausen, B. S.;
Topsøe, H.; Besenbacher, F. Phys. Rev. Lett. 2000, 84, 951
10. Lauritsen, J. V.; Kibsgaard, J.; Helveg, S.; Topsøe, H.; Clausen, B. S.; Lægsgaard, E.;
Besenbacher, F. Nature Nanotech. 2007, 2, 53
11. Kibsgaard, J.; Chen, Z.; Reinecke, B. N.; Jaramillo, F. J. Nature Mater. 2012, 11, 963
12. Li, Y.; Wang, H.; Xie, L.; Yongye, L.; Hong, G. Dai, H. J. Am. Chem. Soc. 2011, 133,
7296
13. Santos, E.; Lundin, A.; Pötting, K.; Quaino, P.; Schmickler, W. Phys. Rev. B 2009, 79,
235436
14. Anderson, P. W. Phys. Rev. 1961, 124, 41

17
15. Newns, D. M. Phys. Rev. 1969, 178, 1123
16. Marcus, R. A. J. Chem. Phys. 1956, 24, 966
17. Santos, E.; Schmickler, W. Chem. Phys. 2007, 332, 39
18. Santos, E.; Quaino, P.; Schmickler, W. Phys. Chem. Chem. Phys. 2012, 14, 11224-11233
19. Santos, E.; Lundin, A.; Pötting, K.; Quaino, P.; Schmickler, W. 2009, 13, 1101-1109
20. Perdew, J. P.; Burke, K.; Ernzerhof, M. Phys. Rev. Lett. 1996, 77, 3865–3868
21. Rappe, A. M.; Rabe, K. M.; Kaxiras, E.; Joannopoulos, J. D. Phys. Rev. B 1990, 41, 1227
22. Giannozzi, P.; Baroni, S.; Bonini, N.; Calandra, M.; Car, R.; Cavazzoni, C.; Ceresoli,
D.;Chiarotti, G. L.; Cococcioni, M.; Dabo, I.;et al. J. Phys.: Condens. Matter. 2009, 21,
395502.
23. Bengtsson, L. Phys. Rev. B 1999, 59, 12301
24. Hansen, L. P.; Ramasse, Q. M.; Kisielowski, C.; Brorson, M.; Johnson, E.; Topsøe, H.;
Helveg, S. Angew. Chem. 2011, 50, 10153
25. Bollinger, M. V.; Jacobsen, K. W.; Nørskov, J. K. Phys. Rev. B 2003, 67, 085410
26. Lauritsen, J. V.; Bollinger, M. V.; Lægsgaard, E.; Jacobsen, K. W.; Nørskov, J. K.;
Clausen, B. S.; Topsøe, H.; Besenbacher, F. J. of Catalysis 2004, 221, 510
27. Li, T.; Galli G. J. Phys. Chem. C 2007, 111, 16192
28. Nørskov, J. K.; Bligaard, T.; Logadottir, A.; Kitchin, J. R.; Chen, J. G.; Pandelov, S.;
Stimming, U. J. Electrochem. Soc. 2005, 152, J23
29. Wood, B. C.; Ogitsu, T.; Schwegler, E. J. Photon. Energy 2011, 1, 016002.

18
TOC