site%specific bioalkylation* of* rapamycin* by* the* rapm ... · pdf filesite%specific...
TRANSCRIPT

S1
Site-‐specific Bioalkylation of Rapamycin by the RapM 16-‐O-‐Methyltransferase.
Brian J. C. Law,a Anna-‐Winona Struck,a Matthew R. Bennett,a Barrie Wilkinson,b,c and Jason Micklefielda* a School of Chemistry and Manchester Institute of Biotechnology, The University of Manchester, 131 Princess Street, Manchester, M1 7DN, United Kingdom b Department of Molecular Microbiology, John Innes Centre, Norwich, NR4 7UH, United Kingdom c Isomerase Therapeutics Ltd, Science Village, Chesterford Research Park, Cambridge, CB10 1XL, United Kingdom * Email: [email protected]
Supporting Information
Supplementary Methods
All chemicals and reagents were purchased from Sigma Aldrich unless otherwise stated.
HPLC and MS analyses of rapalogs. All enzyme assays were analysed using a Shimadzu
Prominence UFLC XR HPLC system unless otherwise stated. The rapalogs BC231 7, BC204 8 and
BC207 9 were analysed using a Shimadzu C8 Shim-‐pack XR-‐ODS column (2.2 μm, 3.0 x 50 mm
column, flow rate 1 mL/min, wavelength 277 nm) with the following gradient: 0-‐8 min (5% B-‐85% B),
8.1-‐9 min (95% B), 9.1-‐10.2 min (5% B), mobile phase A (H2O + 0.05% TFA), mobile phase B
(acetonitrile + 0.05% TFA). The column was maintained at 15 °C. The rapalog BC150 2 was analysed on
a Phenomenex Kinetex XB-‐C18 column (5 μm, 4.6 x 150 mm column, flow rate 0.85 mL/min,
wavelength 277 nm) with the following gradient: 0-‐0.5 min (5% B), 0.5-‐2 min (5% B-‐80% B), 2-‐10.1
min (80% B-‐95% B), 10.1-‐11 min (95% B), 11.1-‐12.2 min (5% B), mobile phase A (H2O), mobile phase B
(methanol). The column was maintained at 25 °C. The rapalog substrates and product peaks were
isolated and purified from the assay mixtures by fraction collection using C18 RP-‐HPLC: Agilent
Eclipse plus C18 column (3.5 μm, 4.6 x 100 mm column, flow rate 1 mL/min, wavelength 277 nm) on an
Agilent Infinity 1200 LC system with the following method: 0-‐3 min (5% B-‐80% B), 3.1-‐10 min (80% B-‐
Electronic Supplementary Material (ESI) for Chemical Science.This journal is © The Royal Society of Chemistry 2015

S2
95% B), 10.1-‐12 min (5% B), mobile phase A (H2O), mobile phase B (methanol) and analysed by ES+
MS using a Bruker amaZon ETD. Samples were injected by direct infusion using a Hamilton syringe
pump. For high resolution MS, the samples were run on a Waters micromass LCT (ES+).
HPLC and MS analyses of AdoMet analogues. The AdoMet analogues generated by the hMAT2A
assays were analysed using a Phenomenex Luna HILIC column (5 μm, 4.6 x 150 mm column, flow rate
1 mL/min, wavelength 260 nm) with the following gradient: 0-‐1 min (10% B), 1-‐3 min (10% B-‐35% B), 3-‐
8 min (35% B-‐60% B), 8-‐10 min (60% B), 10.2-‐11.6 min (10% B), mobile phase A (acetonitrile), mobile
phase B (ammonium formate 5 mM, pH 3.3). The AdoMet analogues were verified by LC-‐MS, using an
Agilent 1100 LC-‐MSD SL system with an Agilent Eclipse plus C18 column (3.5 μm, 4.6 x 100 mm
column, flow rate 1 mL/min, wavelength 260 nm) and the following gradient: 0-‐6 min (5% B-‐25% B),
6-‐7 min (25% B-‐95% B), 7 -‐9 min (95% B), 9.1-‐11 min (5% B), mobile phase A (H2O + 0.1% formic acid),
mobile phase B (acetonitrile + 0.1% formic acid). High resolution LC-‐MS was carried out using a
Waters Acquity UPLC system (column: Waters C18 BEH 1.7 µm, 2.1 x 100 mm, flow rate 0.3 µL/min)
with the following gradient: 0-‐6 min (5% B-‐70% B), 6-‐7 min (70% B-‐95% B), 7 -‐8 min (95% B), 8-‐9
min (95% B-‐5% B), 9-‐10 min (5% B) mobile phase A (H2O + 0.1% formic acid), mobile phase B
(acetonitrile + 0.1% formic acid). The MS was a Thermo Scientific LTQ Orbitrap XL.
Synthesis, purification and characterisation of the methionine analogue S-‐allyl-‐L-‐
homocysteine.43 L-‐homocystine (268 mg, 1 mmol) was dissolved in liquid ammonia (30 mL) at -‐78 °C
in a dry ice/acetone bath. Sodium metal (100 mg) was added until a dark blue colour persisted for 15
minutes. Ammonium chloride was added (20 mg) until the dark blue colour of the mixture faded.
Allyl bromide (0.26 g, 186 μL, 2.15 mmol) was added and the mixture was stirred at -‐78 °C for 2 hrs.
The cooling bath was removed, in order to allow NH3 to evaporate. The resulting white solid was
dissolved in water (30 mL) and extracted with diethyl ether (2 x 10 mL). The pH of the aqueous phase
was adjusted to pH 6 with 4 M HCl and 1 M NaOH and the volume was reduced under reduced
pressure. The solution was left for crystallisation to give the title compound (120 mg, 0.685 mmol, 45
%) as a white solid. M. Pt: 243-‐245 °C (lit:33 244-‐245 °C); δH (400 MHz, D2O/NaOD) 5.62-‐5.51 (1 H, m,
H-‐6), 4.95-‐ 4.90 (2 H, m, H-‐7, H-‐7'), 3.97 (1 H, t, J 6.3 Hz, H-‐2), 2.97 (2 H, d, J 7.3 Hz, H-‐5, H-‐5'), 2.42
(2 H, t, J 7.7 Hz, H-‐4, H-‐4'), 2.05-‐1.90 (2 H, m, H-‐3, H-‐3'); δC (100 MHz, D2O) 171.38 (C-‐ 1), 133.64 (C-‐6),
117.27 (C-‐7), 51.6 (C-‐2), 33.21 (C-‐5), 29.17 (C-‐3), 24.90 (C-‐4); Vmax/cm-‐1; 3297.14 (N-‐H), 2871.22 (C-‐H),
1667.19 (C=C), 1522.19, 1372.71, 1178.56, 1023.78, 941.23, 845.63, 796.41, 786.69, 612.31, 546.79; m/z (ES+)
176 [M+H]+, m/z (ES-‐) 174 [M-‐H]-‐ (C7H12NO2S requires 174.24).

S3
RapM assays with pre-‐prepared AdoMet analogues. Comparison of RapM activity with the
AdoMet and analogues, in the absence of hMAT2A, was carried out. Accordingly, AdoMet, SAE and
SAAH were prepared using the hMAT2A (I322V) enzyme (15 μM), which was incubated with 1 mM L-‐
methionine, L-‐ethionine or S-‐allyl-‐L-‐homocysteine (Sahc) in phosphate buffer (pH 7.4) containing 1
mM DTT, 3 mM MgCl2, 1 mM ATP, for 60 min at 30 °C, 800 rpm. The assays were transferred into
Amicon® Ultra-‐0.5 centrifugal filter devices (3,000 MWCO) and centrifuged at 14,000 x g, 30 min to
remove the enzyme. The flowthroughs containing AdoMet, SAE or SAAH were immediately injected
onto HILIC-‐HPLC and quantified against an AdoMet calibration curve (Figure S16). The AdoMet
analogues were adjusted to the same starting concentration as AdoMet, with phosphate buffer
containing DTT and MgCl2, and RapM (15 μM) and BC231 7 (0.2 mM) were added to initiate individual
alkyltransferase reactions. The assays were run and terminated as previously described. Whilst the
conversions of 7 to 7m and 7e were similar to those observed with the tandem assays, the formation
of 7a was over five-‐fold lower when using pre-‐prepared SAAH compared with the in situ formation of
SAAH in tandem assays (Figure S17).
Competitive assays involving co-‐incubation of AdoMet with SAE or SAAH. The enzymatically
prepared AdoMet analogues SAE and SAAH, prepared as described above, were separately spiked
with an equimolar amount of AdoMet prior to addition of RapM and BC231 7. A control assay was set
up with AdoMet alone with RapM and BC231 7, and the competitive assays were run as previously
described. The reactions were monitored by RP-‐HPLC, showing that SAE does not affect the RapM
methylation of 7, but the presence of SAAH reduces the conversion to 7m by three-‐fold (Figure S18).
The AdoMet analogue SAAH was found to degrade more readily than AdoMet or SAE, and LC-‐HRMS
of an SAAH sample indeed showed significant formation of a 5´-‐S-‐allyl-‐5´-‐thioadenosine (ATA)
degradation product consistent with previous studies29,42,43 (Figure S16). Thus, it suggested that either
SAAH, or its degradation product ATA, inhibit the RapM catalysed methylation of 7, at higher
concentrations.
Optimisation of tandem hMAT2A/RapM allylation of BC231 (7). In light of the observed
inhibitory effects of SAAH/ATA on the RapM catalysed methylation of 7, tandem assays were set up
to minimise the amount of ‘free’ SAAH formed during the allylation of 7 . The assays were set up as
described previously, except hMAT2A (I322V) was used at either 2 μM or 15 μM concentration, with 15
μM RapM. The formation of 7a was monitored by RP-‐HPLC at 0, 30, 60, 120, 210 and 1110 min time
points. The assays containing 2 μM hMAT2A reached 72% conversion of 7 to 7a at the final time
point, whereas the assays containing 15 μM hMAT2A reached 52% under the same conditions (Figure
S19). Presumably, the excess of RapM relative to hMAT2A ensures that any SAAH formed is turned

S4
over by the methyltransferase, preventing build-‐up of SAAH and degradation to ATA which could
potentially inhibit RapM activity.

S5
Supplementary Figures and Tables
Figure S1. A: NdeI and XhoI restriction double digest of pET28a-‐rapM showing presence of the rapM insert; B: SDS PAGE gel of purified His6-‐RapM soluble recombinant protein (37.3 kDa).
Table S1. HRMS of rapalogs.
Rapalogue Ion Formula Calculated m/z Observed m/z
7 BC231 [M+Na]+ C48H73NNaO13+ 894.4974 894.4955
7m Methyl-‐BC231 [M+Na]+ C49H75NNaO13+ 908.5131 908.5156
7e Ethyl-‐BC231 [M+Na]+ C50H77NNaO13+ 922.5287 922.5298
7a Allyl-‐BC231 [M+Na]+ C51H77NNaO13+ 934.5287 934.5317
2 BC150 [M+Na]+ C48H75NNaO11+ 864.5232 864.5233
2* BC150 [M+Na]+ C48H75NNaO11+ 864.5232 864.5239
2m Methyl-‐BC150 [M+Na]+ C49H77NNaO11+ 878.5389 878.5408
2m* Methyl-‐BC150 [M+Na]+ C49H77NNaO11+ 878.5389 878.5366
2e Ethyl-‐BC150 [M+Na]+ C50H79NNaO11+ 892.5545 892.5523
2e* Ethyl-‐BC150 [M+Na]+ C50H79NNaO11+ 892.5545 892.5568
2a Allyl-‐BC150 [M+Na]+ C51H79NNaO11+ 904.5545 904.5513
2a* Allyl-‐BC150 [M+Na]+ C51H79NNaO11+ 904.5545 904.5486

S6
Figure S2. Separation of the rotamers of A: BC150 (2, 2*) and B: 16-‐O-‐methyl-‐BC150 (2m, 2m*) by RP-‐HPLC. Each rotamer
peak was isolated and left at room temperature (21 °C) for 16 h before analysing by HPLC. The chromatograms show that
each individual peak re-‐equilibrates to the original ratio of rotamers when left in solution.
Figure S3. MS2 analysis of the [M+K]+ ions of BC231 (7) and 16-‐O-‐methyl-‐BC231 (7m). The [M+K]+ ions (P) for 7 and 7m were
selected for fragmentation. The identities of fragments f1, f2 and f3 are as previously described, with the 7m ions showing +14
where methylation is present on the 16-‐O-‐position. Ions that appear in both the 7 and 7m spectra with the same m/z are
highlighted in blue and have been assigned as ‘e’ ions and form a fragmentation profile for rapamycin. The ‘em’ ions found
only in the 7m spectrum reflect a mass increase in the fragment ions containing the 16-‐O-‐position due to methylation.
Losses of H2O, CO2, CH3OH and pipecolic acid are denoted by arrows (see key). Comparison of fragment ion clusters
between 7 and 7m show additional losses of CH3OH where methylation is present in the 7m sample.
S7
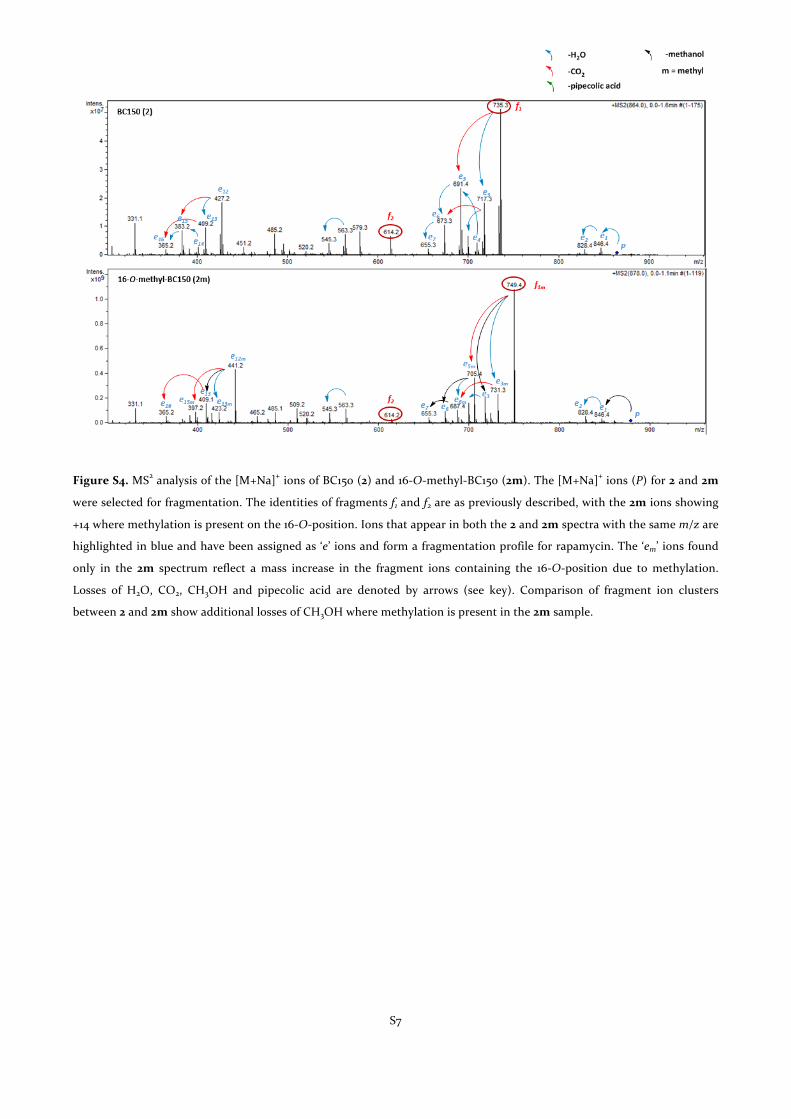
Figure S4. MS2 analysis of the [M+Na]+ ions of BC150 (2) and 16-‐O-‐methyl-‐BC150 (2m). The [M+Na]+ ions (P) for 2 and 2m
were selected for fragmentation. The identities of fragments f1 and f2 are as previously described, with the 2m ions showing
+14 where methylation is present on the 16-‐O-‐position. Ions that appear in both the 2 and 2m spectra with the same m/z are
highlighted in blue and have been assigned as ‘e’ ions and form a fragmentation profile for rapamycin. The ‘em’ ions found
only in the 2m spectrum reflect a mass increase in the fragment ions containing the 16-‐O-‐position due to methylation.
Losses of H2O, CO2, CH3OH and pipecolic acid are denoted by arrows (see key). Comparison of fragment ion clusters
between 2 and 2m show additional losses of CH3OH where methylation is present in the 2m sample.

S8
Figure S5. RapM activity with rapalogs BC204 (8) and BC207 (9). A: RapM assay with AdoMet and BC204 8 possessing C16-‐
OH and C27-‐OH, showing conversion to 9; B: RapM assay with AdoMet and BC207 9 possessing C16-‐OCH3 and C27-‐OH,
showing no conversion of substrate.

S9
Table S2. Spectral δ 1H partial assignments for 16-‐O-‐methyl-‐BC231 (7m) compared with rapamycin (1). The carbon numbering for (7m) and (1) are shown below. The δ 1H assignments for 1 (in DMSO-‐d6) are as described by Pagano.47
C δ1H methyl-‐BC231 (7m)
δ1H rapamycin (1) C δ1H
methyl-‐BC231 (7m) δ1H rapamycin (1)
1 -‐ -‐ 28 -‐ 3.99
2 -‐ 4.92 28-‐OH -‐ 5.23
3 -‐ 2.08, 1.56 29 -‐ -‐
4 -‐ 1.65, 1.38 30 5.10 5.08
5 -‐ 1.55, 1.26 31 3.24 3.27
6 -‐ 3.41, 3.15 32 -‐ -‐
7 -‐ -‐ 33 -‐ 2.72, 2.37
8 -‐ -‐ 34 4.95 4.97
9 -‐ -‐ 35 1.64 1.66
10 -‐ -‐ 36 1.26, 0.99 1.03, 0.94
10-‐OH -‐ 6.43 37 -‐ 1.23
11 2.02 2.01 38 -‐ 1.88, 0.58
12 1.52 1.51, 0.83 39 -‐ 2.81
13 -‐ 1.80, 1.16 39-‐OH -‐ -‐
14 -‐ 3.99 40 -‐ 3.16
15 -‐ 1.83, 1.24 40-‐OH -‐ -‐
16 -‐ 3.61 41 -‐ 1.73, 1.15
17 -‐ -‐ 42 -‐ 1.52
18 -‐ 6.10 43 0.75 0.72
19 6.24 6.39 44 1.64 1.62
20 6.40 6.21 45 0.98 0.97
21 6.12 6.12 46 0.84 0.82
22 5.45 5.45 47 1.78 1.73
23 2.25 2.20 48 0.88 0.86
24 1.39, 1.02 49 0.78 0.77
25 2.46 2.39 50 3.06 3.04
26 -‐ -‐ 51 -‐ 3.15
27 -‐ 3.92 52 -‐ 3.31
27-‐OH -‐ -‐

S10
Figure S6. H,H COSY NMR of 16-‐O-‐methyl-‐BC231 (7m) with Watergate solvent-‐suppression of the DMSO-‐d6 signal.
The spectrum was recorded with a total number of scans NS = 16 and with TD(F2) = 4096 and TD(F1) = 512.

S11
Figure S7. H,H COSY NMR of 16-‐O-‐methyl-‐BC231 (7m) with preset-‐suppression of the DMSO-‐d6 signal.
The spectrum was recorded with a total number of scans NS = 16 and with TD(F2) = 2048 and TD(F1) = 512.

S12
Figure S8. H,H TOCSY NMR of 16-‐O-‐methyl-‐BC231 (7m) with Watergate solvent-‐suppression of the DMSO-‐d6 signal.
The spectrum was recorded with a total number of scans NS = 16 and with TD(F2) = 4096 and TD(F1) = 512.

S13
Figure S9. Comparison of hMAT2A wild-‐type and mutant enzyme activity. The enzymes were assayed with L-‐methionine, L-‐
ethionine and S-‐allyl-‐L-‐homocysteine, and analysed by HILIC-‐HPLC under identical conditions. The integrated HPLC peak
areas for AdoMet, SAE and SAAH were compared between wild-‐type and mutant hMAT2A as a measure of relative activity.
The I322V mutant was selected for RapM/MAT tandem assays due to its greater acceptance of methionine analogues
compared with the wild-‐type and other mutants.
0
100000
200000
300000
400000
500000
600000
700000
WT I117V V121A I322F I322V
HPLC Peak Area
hMAT2A enzyme
L-‐methionine L-‐ethionine S-‐allyl-‐L-‐homocysteine
S14
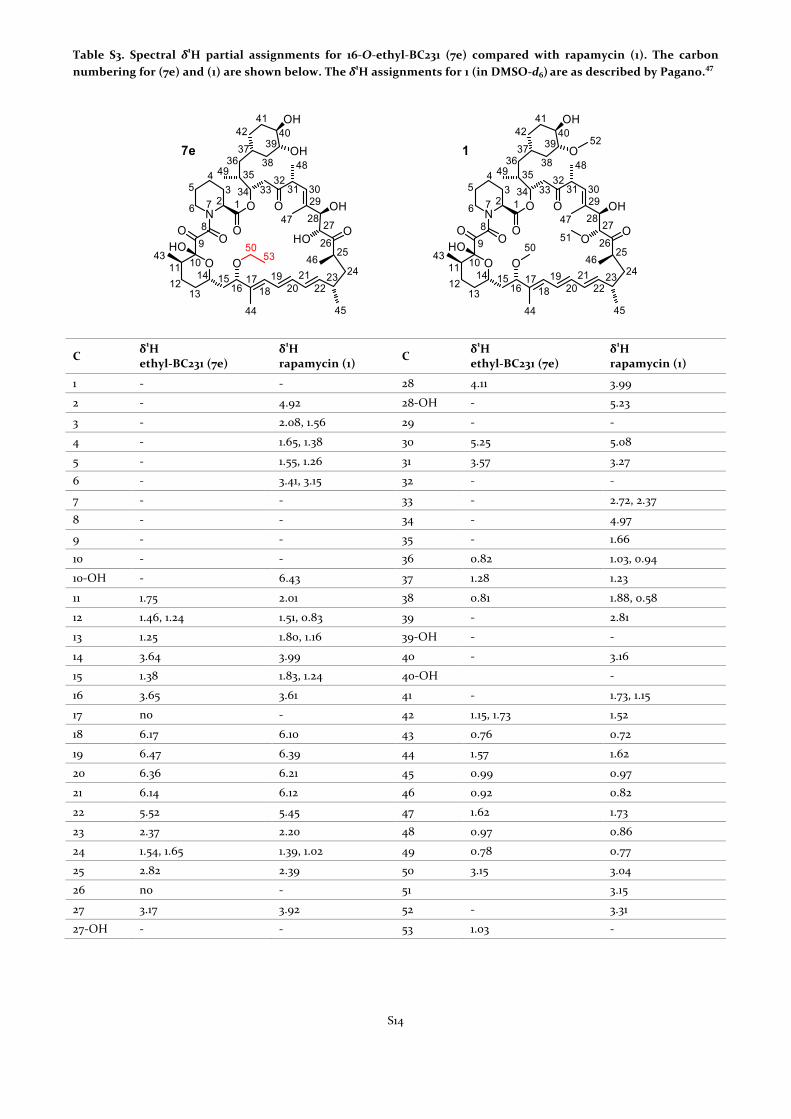
Table S3. Spectral δ1H partial assignments for 16-‐O-‐ethyl-‐BC231 (7e) compared with rapamycin (1). The carbon numbering for (7e) and (1) are shown below. The δ1H assignments for 1 (in DMSO-‐d6) are as described by Pagano.
47
C δ1H ethyl-‐BC231 (7e)
δ1H rapamycin (1) C δ1H
ethyl-‐BC231 (7e) δ1H rapamycin (1)
1 -‐ -‐ 28 4.11 3.99
2 -‐ 4.92 28-‐OH -‐ 5.23
3 -‐ 2.08, 1.56 29 -‐ -‐
4 -‐ 1.65, 1.38 30 5.25 5.08
5 -‐ 1.55, 1.26 31 3.57 3.27
6 -‐ 3.41, 3.15 32 -‐ -‐
7 -‐ -‐ 33 -‐ 2.72, 2.37
8 -‐ -‐ 34 -‐ 4.97
9 -‐ -‐ 35 -‐ 1.66
10 -‐ -‐ 36 0.82 1.03, 0.94
10-‐OH -‐ 6.43 37 1.28 1.23
11 1.75 2.01 38 0.81 1.88, 0.58
12 1.46, 1.24 1.51, 0.83 39 -‐ 2.81
13 1.25 1.80, 1.16 39-‐OH -‐ -‐
14 3.64 3.99 40 -‐ 3.16
15 1.38 1.83, 1.24 40-‐OH -‐
16 3.65 3.61 41 -‐ 1.73, 1.15
17 no -‐ 42 1.15, 1.73 1.52
18 6.17 6.10 43 0.76 0.72
19 6.47 6.39 44 1.57 1.62
20 6.36 6.21 45 0.99 0.97
21 6.14 6.12 46 0.92 0.82
22 5.52 5.45 47 1.62 1.73
23 2.37 2.20 48 0.97 0.86
24 1.54, 1.65 1.39, 1.02 49 0.78 0.77
25 2.82 2.39 50 3.15 3.04
26 no -‐ 51 3.15
27 3.17 3.92 52 -‐ 3.31
27-‐OH -‐ -‐ 53 1.03 -‐

S15
Table S4. Spectral δC assignments for 16-‐O-‐ethyl-‐BC231 (7e) compared with rapamycin (1). The carbon numbering for (7e) and (1) are shown below. The δC assignments for 1 are as described by Pagano.47
C δC ethyl-‐BC231 (7e)
δC rapamycin (1) C δC
ethyl-‐BC231 (7e) δC rapamycin (1)
1 -‐ 169.18 28 -‐ 75.72
2 -‐ 50.74 28-‐OH -‐ -‐
3 -‐ 26.41 29 -‐ 137.12
4 -‐ 20.35 30 -‐ 124.93
5 -‐ 24.45 31 -‐ 45.19
6 -‐ 43.48 32 -‐ 207.52
7 -‐ 33 -‐ 39.94
8 -‐ 166.97 34 -‐ 73.56
9 -‐ 198.87 35 -‐ 33.35
10 -‐ 98.99 36 40.33 38.39
10-‐OH -‐ 37 33.67 32.51
11 35.44 34.78 38 31.88 35.43
12 27.32 26.22 39 -‐ 83.73
13 29.16 29.61 39-‐OH -‐ -‐
14 66.33 66.19 40 -‐ 73.21
15 40.26 40.13 40-‐OH -‐ -‐
16 80.82 82.24 41 -‐ 32.88
17 -‐ 137.84 42 32.9 31.09
18 -‐ 126.97 43 16.48 15.52
19 -‐ 127.02 44 11.28 10.45
20 128.36 132.30 45 20.05 21.63
21 127.11 130.41 46 16.24 13.39
22 -‐ 139.28 47 15 13.39
23 33.93 35.18 48 16.94 15.56
24 21.72 39.62 49 15.7 14.71
25 -‐ 39.57 50 -‐ 55.44
26 -‐ 210.49 51 -‐ 56.92
27 -‐ 85.52 52 -‐ 56.73
27-‐OH -‐ -‐ 53 15.7 -‐

S16
Figure S10. H,H COSY NMR of 16-‐O-‐ethyl-‐BC231 (7e) with Watergate solvent-‐suppression of the DMSO-‐d6 signal.
The spectrum was recorded with a total number of scans NS = 16 and with TD(F2) = 2048 and TD(F1) = 512.

S17
Figure S11. H,H COSY NMR of 16-‐O-‐ethyl-‐BC231 (7e) with preset-‐suppression of the DMSO-‐d6 signal.
The spectrum was recorded with a total number of scans NS = 16 and with TD(F2) = 2048 and TD(F1) = 512.

S18
Figure S12. H,H TOCSY NMR of 16-‐O-‐ethyl-‐BC231 (7e) with Watergate solvent-‐suppression of the DMSO-‐d6 signal.
The spectrum was recorded with a total number of scans NS = 16 and with TD(F2) = 2048 and TD(F1) = 512.

S19
Figure S13. H,H NOESY NMR of 16-‐O-‐ethyl-‐BC231 (7e) with Watergate solvent-‐suppression of the DMSO-‐d6 signal.
The spectrum was recorded with a total number of scans NS = 16 and with TD(F2) = 2048 and TD(F1) = 512.

S20
Figure S14. HSQC of 16-‐O-‐ethyl-‐BC231 (7e). The spectrum was recorded with a total number of scans NS = 56 and with
TD(F2) = 4096 and TD(F1) = 512.

S21
Figure S15. Relative activities of RapM with BC150 2 and BC231 7. Tandem assays of RapM/hMAT2A (I322V) with L-‐
methionine, L-‐ethionine and S-‐allyl-‐L-‐homocysteine were carried out with either 2 or 7 as the substrate for RapM. The assays
were quenched after 60 min and the activities of RapM with both substrates compared.
0
10
20
30
40
50
60
70
80
90
100
L-‐met L-‐eth Sahc
Conversio
n (%
)
BC150 (2) BC231 (7)

S22
Figure S16. Enzymatic preparation of AdoMet, SAE and SAAH. A: AdoMet, SAE and SAAH were produced by hMAT2A
(I322V), isolated using a centricon to remove the enzyme and analysed by HILIC HPLC. Retention times are: AdoMet (7.21
min); SAE (7.09 min); SAAH (7.02 min); 5ʹ′-‐S-‐allyl-‐5ʹ′-‐thioadenosine (ATA) (6.10 min). The SAAH sample clearly shows
significant formation of the degradation product ATA (indicated by arrow) compared with the AdoMet and SAE samples; B:
Calibration curve for AdoMet used to quantify AdoMet analogues. Injections of known concentrations of AdoMet (0, 62.5,
125, 250, 500, 1000 µM) were used to generate the calibration; C: The mechanism for the degradation of SAAH to ATA.29,42,43
SAAH was incubated at 37 °C for 60 min and analysed by LC-‐HRMS: D: HRMS of SAAH showing m/z 425.1573 (calculated
m/z 425.1602); E: HRMS of the degradation product ATA showing m/z 324.1102 (calculated m/z 324.1125).
y = 4,820,610x R² = 1
0
1000000
2000000
3000000
4000000
5000000
0 0.2 0.4 0.6 0.8 1
HPLC Peak Area
AdoMet concentra1on (mM) Relativ
e ab
sorban
ce (2
60 nm)
AdoMet
SAE
SAAH A ATA
D:\Orbitrap data\SAAH_std
RT: 0.00 - 9.99
0 2 4 6 8Time (min)
0
10
20
30
40
50
60
70
80
90
100
Rel
ativ
e A
bund
ance
0.94
2.49
1.359.44
9.326.095.043.62 6.222.267.077.58
8.54
NL:2.03E9TIC MS SAAH_std
SAAH_std #84-128 RT: 0.65-0.99 AV: 45 NL: 3.54E8T: FTMS + p ESI Full ms [80.00-1100.00]
380 400 420 440 460m/z
0
10
20
30
40
50
60
70
80
90
100
Rel
ativ
e A
bund
ance
425.1573
428.1560
401.1209 465.1876450.5462420.1173
391.2817 439.5189
D
D:\Orbitrap data\SAAH_std
RT: 1.50 - 3.79
2.0 2.5 3.0 3.5Time (min)
0
10
20
30
40
50
60
70
80
90
100
Rel
ativ
e A
bund
ance
2.49
2.50
3.622.60 2.702.262.12 2.95 3.242.06
NL:1.66E9TIC MS SAAH_std
SAAH_std #312-323 RT: 2.43-2.52 AV: 12 NL: 4.63E8T: FTMS + p ESI Full ms [80.00-1100.00]
260 280 300 320 340 360 380m/z
0
10
20
30
40
50
60
70
80
90
100
Rel
ativ
e A
bund
ance
324.1103
364.1406318.1512
327.5216
276.0245
341.3317
384.0395
262.4873
E
B
C
ATA [M+H]+ C13H18N5O3S
+
SAAH [M]+ C17H25N6O5S
+

S23
Figure S17. Activity of RapM with isolated AdoMet analogues. AdoMet, SAE and SAAH were generated enzymatically by
hMAT2A (I322V), purified and quantified. Equal concentrations of each analogue were incubated with RapM and BC231 7.
Conversion to 7m, 7e and 7a reached 98%, 47% and 6% respectively, whereas in the tandem assays conversion reached 99%,
51% and 33%. The low conversion with pre-‐prepared SAAH suggests that SAAH or its degradation product 5ʹ′-‐S-‐allyl-‐5ʹ′-‐
thioadenosine (ATA) may be inhibitory of RapM.
Figure S18. Effect of SAE and SAAH on RapM methylation of BC231 7. Incubation of RapM with BC231 7 and either AdoMet
(125 μM), AdoMet + SAE (125 μM each) or AdoMet + SAAH (125 μM each) show that SAAH is inhibitory of the methylation
reaction, whereas SAE is not. No ethylated or allylated products were observed within the time period of the competitive
assays (60 min).
0 10 20 30 40 50 60 70 80 90 100
AdoMet SAE SAAH
Conversio
n (%
)
AdoMet analogue
Pre-‐prepared AdoMet analogue Tandem assay
0
10
20
30
40
50
60
70
80
90
100
AdoMet AdoMet + SAE AdoMet + SAAH
Conversio
n to 7m (%
)
Co-‐incuba[on of AdoMet analogues

S24
Figure S19. Effect of reduced hMAT2A concentration on rapalog allylation. The tandem assays of RapM (15 μM) with
hMAT2A (I322V) (2 μM, 15 μM), and BC231 7, S-‐allyl-‐L-‐homocysteine and ATP, show that slower formation of the unstable
SAAH co-‐factor results in higher overall allylated product.
Table S5. Primers used in this study.
Primer Sequence 5′-‐3′ bp
His6-‐rapM F AAAAAACATATGATGATCCAACCCGACGTCGTG 33
His6-‐rapM R AAAAAAAAGCTTTTGTCTCCGTTCACACGCGGAC 34
hMAT2A I117KYT ACAGTCACCAGATKYTGCTCAAGGTGTTC 29
hMAT2A V121KYT TGCTCAAGGTKYTCATCTTGACAGAAATG 29
hMAT2A I322KYT GTCTCTTATGCTKYTGGAGTTTCTCATCC 29
0
10
20
30
40
50
60
70
80
90
100
0 2 4 6 8 10 12 14 16 18 20
Conversio
n to 7a (%
)
Time (hours)
2 µM hMAT2A 15 µM hMAT2A

S25
Figure S20. HRMS (ES+) of BC231 (7) m/z [M+Na]+ = 894.4955 (calculated: 894.4974).
Figure S21. HRMS (ES+) of 16-‐O-‐methyl-‐BC231 (7m) m/z [M+Na]+ = 908.5156 (calculated: 908.5131).

S26
Figure S22. HRMS (ES+) of 16-‐O-‐ethyl-‐BC231 (7e) m/z [M+Na]+ = 922.5298 (calculated: 922.5250).
Figure S23. HRMS (ES+) of 16-‐O-‐allyl-‐BC231 (7a) m/z [M+Na]+ = 934.5317 (calculated: 934.5287).

S27
Figure S24. HRMS (ES+) of BC150 (2) m/z [M+Na]+ = 864.5233, 864.5239 (calculated: 864.5232).

S28
Figure S25. HRMS (ES+) of 16-‐O-‐methyl-‐BC150 (2m) m/z [M+Na]+ = 878.5408, 878.5366 (calculated: 878.5389).

S29
Figure S26. HRMS (ES+) of 16-‐O-‐ethyl-‐BC150 (2e) m/z [M+Na]+ = 892.5523, 892.5568 (calculated: 892.5545).

S30
Figure S27. HRMS (ES+) of 16-‐O-‐allyl-‐BC150 (2a) m/z [M+Na]+ = 904.5513, 904. 5486 (calculated: 904.5545).