six sigma
DESCRIPTION
TRANSCRIPT

PS&J Software Six SigmaPS&J Software Six Sigma
Six Sigma & Software Process Improvement
Six Sigma & Software Process Improvement
Ellen GeorgeSteve Janiszewski
March 20, 2002

PS&J Software Six Sigma
Copyright © 2002, PS&J Software Six SigmaAll rights reserved.
2
March 20, 2002
ScopeScope
• PS&J Software Six Sigma
• Introduction to Six Sigma
• Applying Six Sigma Techniques to Software ProcessImprovement
• Variation and Statistical Process Control
• Run Charts
• Optimizing and inspection Process
• Controlling Product Quality
• Integrating Six Sigma and the Capability Maturity Model
• PSP and TSP and Six Sigma
• Six Sigma Deployment

PS&J Software Six Sigma
Copyright © 2002, PS&J Software Six SigmaAll rights reserved.
3
March 20, 2002
PS&J Software Six SigmaPS&J Software Six Sigma
• Our mission is to provide our customer with the managementexpertise to– Successfully plan and execute their software development
projects– Systematically improve productivity and cycle time– Get the optimum return from their SPI activities
• We– Guide our customers through the jungle of conflicting claims
about SPI– Help them create links between their SPI activities and
measurable business results
If you can’t measure a positive return on your SPI investment within a year, it’s probably not worth doing !
If you can’t measure a positive return on your SPI investment within a year, it’s probably not worth doing !

PS&J Software Six Sigma
Copyright © 2002, PS&J Software Six SigmaAll rights reserved.
4
March 20, 2002
ExperienceExperience
• Core team of four professionals with a total of over 100 yearsexperience in software development, management, and processimprovement– Defense, Aerospace, Industrial Automation & Controls, Medical
Instrumentation, Financial Services, Telecommunications• Moved an organization of 150 software engineers from CMM Level 1
to 4 in less than 5 years – first level 4 organization in AlliedSignal• Working closely with Watts Humphrey and his SEI team, led the first
PSP/TSP projects within AlliedSignal• Ran Honeywell’s corporate level software process improvement
organization– Six Sigma Software Training and deployment, CMM Based Assessments,
PSP/TSP deployment– Provided support for 6000 software engineers at 100 sites around the
world• SEI transition partner – more experience with PSP/TSP than anyone
other than the SEI team
We offer a unique blend of software management skill and process deployment experience
We offer a unique blend of software management skill and process deployment experience

PS&J Software Six Sigma
Copyright © 2002, PS&J Software Six SigmaAll rights reserved.
5
March 20, 2002
PS&J Software Six Sigma Products & ServicesPS&J Software Six Sigma Products & Services
• CMM assessments
• SPI planning workshops, ROI analysis, mentoring
• Software project management training and mentoring
• Software 6 Sigma implementation consulting, training,mentoring
• Appraisals & defect prevention training
• PSP training
• TSP launches and mentoring
• Proposal and project red teams
PS&J Software Six Sigma
Copyright © 2002, PS&J Software Six SigmaAll rights reserved.
6
March 20, 2002
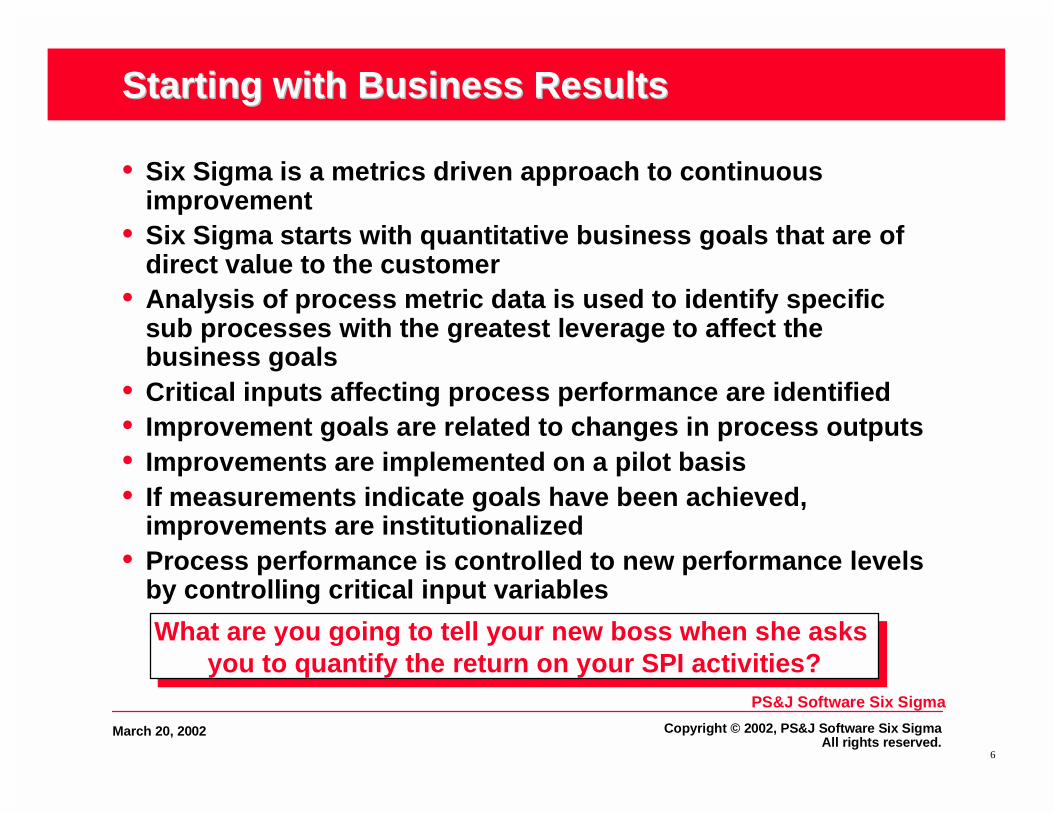
Starting with Business ResultsStarting with Business Results
• Six Sigma is a metrics driven approach to continuousimprovement
• Six Sigma starts with quantitative business goals that are ofdirect value to the customer
• Analysis of process metric data is used to identify specificsub processes with the greatest leverage to affect thebusiness goals
• Critical inputs affecting process performance are identified• Improvement goals are related to changes in process outputs• Improvements are implemented on a pilot basis• If measurements indicate goals have been achieved,
improvements are institutionalized• Process performance is controlled to new performance levels
by controlling critical input variables
What are you going to tell your new boss when she asks you to quantify the return on your SPI activities?
What are you going to tell your new boss when she asks you to quantify the return on your SPI activities?
PS&J Software Six Sigma
Copyright © 2002, PS&J Software Six SigmaAll rights reserved.
7
March 20, 2002
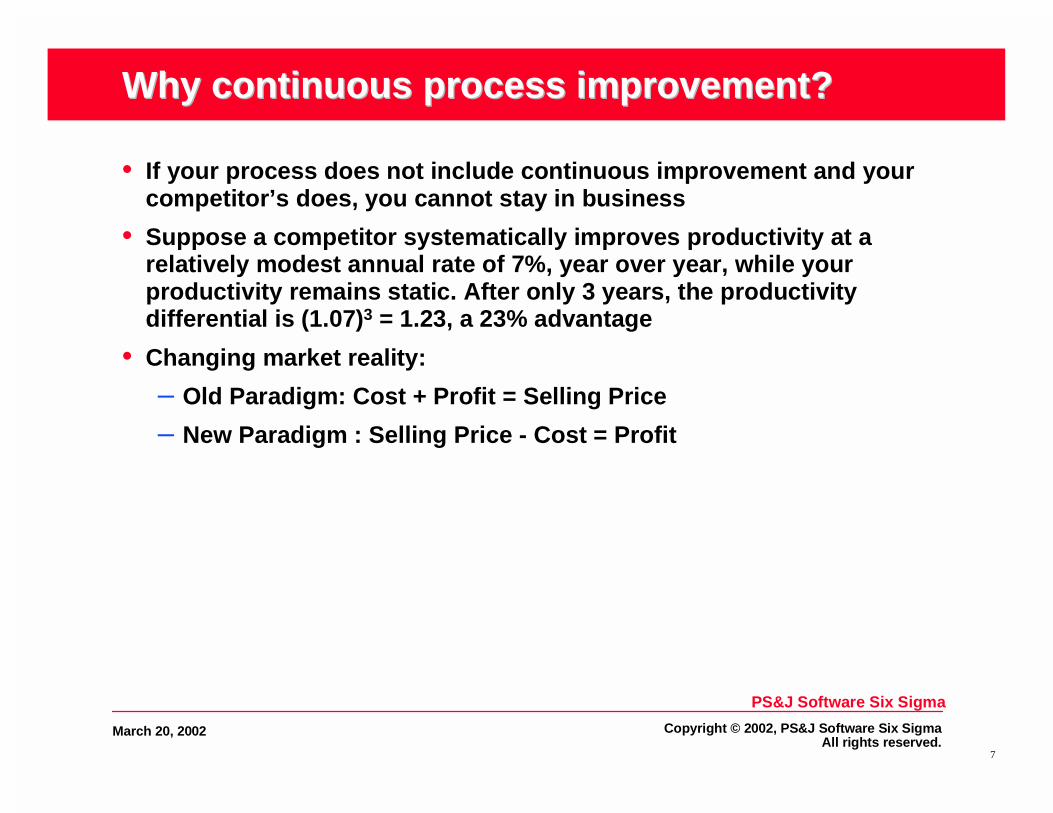
Why continuous process improvement?Why continuous process improvement?
• If your process does not include continuous improvement and yourcompetitor’s does, you cannot stay in business
• Suppose a competitor systematically improves productivity at arelatively modest annual rate of 7%, year over year, while yourproductivity remains static. After only 3 years, the productivitydifferential is (1.07)3 = 1.23, a 23% advantage
• Changing market reality:
– Old Paradigm: Cost + Profit = Selling Price
– New Paradigm : Selling Price - Cost = Profit

PS&J Software Six Sigma
Copyright © 2002, PS&J Software Six SigmaAll rights reserved.
8
March 20, 2002
CompaniesCompanies
• Six Sigma originated at Motorola• Early adopters included
– Texas Instruments– AlliedSignal (Honeywell)– General Electric
• Many more organizations moved into Six Sigma after GeneralElectric began publicizing its program– Nokia, Bombardier, Siebe, Lockheed Martin, Sony, Crane,
Polaroid, Avery Dennison, Shimano, Raytheon, Kodak,JP Morgan, Citicorp, TRW, Litton, Boeing
• Initial success in manufacturing and operations, later inservices
• Lots of current interest in extending it into productengineering with Design for Six Sigma

PS&J Software Six Sigma
Copyright © 2002, PS&J Software Six SigmaAll rights reserved.
9
March 20, 2002
DMAIC – Continuous Improvement Cycle
• Define process
• Measure the process
• Analyze the process to identify causal variables
• Improve the process– Modify the process– Measure the modified process– Verify the improvement– Define control mechanism
• Control the process to new performance levels– Monitor performance metrics and take designated action when
required– Perform continuous verification of the stability and capability
of the process

PS&J Software Six Sigma
Copyright © 2002, PS&J Software Six SigmaAll rights reserved.
10
March 20, 2002
Why Apply Six Sigma to SPI?Why Apply Six Sigma to SPI?
• Software-dependent businesses have three critical needs– better cost and schedule management– better quality management– cycle time improvement
• With conventional CMM based SPI, it is easy to fall into the trap oflaying a veneer of process over the same old activities– adds overhead while having no significant effect– destroys credibility with the developers
• In order to meet business needs, one cannot simply try harder. Onemust significantly change the engineer’s daily activities
• Six Sigma increases the likelihood of sustainable success– linkage to business goals– objective measurements– active participation in SPI by the engineers
One definition of insanity: doing the same thingover and over and expecting a different result
One definition of insanity: doing the same thingover and over and expecting a different result

PS&J Software Six Sigma
Copyright © 2002, PS&J Software Six SigmaAll rights reserved.
11
March 20, 2002
Software Six SigmaSoftware Six Sigma
• Software Six Sigma is an overall strategy to accelerate and sustaincontinuous improvement in software development processefficiency and in software product quality
• A Six Sigma software development process is characterized by– the application of statistical tools to process and product metrics– quantitative management of product quality
� allowing delivery of very high quality product (very few latent defects)� reducing time spent in integration and test cutting overall cost and cycle time� making the software development process more repeatable and predictable
– closed loop quantitative process management
• Sigma can also be used as a measurement of product quality– Six Sigma processes produce only 3.4 defects per million opportunities -
or 99.9997% error-free.– Typical software processes operate at between 2.3 and 3.0 sigma– The best software processes operate at 4 to 5 sigma

PS&J Software Six Sigma
Copyright © 2002, PS&J Software Six SigmaAll rights reserved.
12
March 20, 2002
Software Software isis different, but it is also controllable! different, but it is also controllable!
• Software development is different - it is not like manufacturing• Process variation can never be eliminated or even reduced below a
moderate level– No two modules are alike so process performance always includes an
intrinsic degree of variability– There are very large differences in skills and experience from one
developer to another
• However, software development processes can be fullycharacterized by three simple measurements– Time: the time required to perform a task– Size: the size of the work product produced– Defects: the number and type of defects, removal time, point of injection
and point of removal
• Software measurements are amenable to statistical analysisprovided:– Data is complete, consistent, and accurate– Data from individuals with widely varying skill levels is not mixed
• Statistical Process Control is applicable to software processmanagement

PS&J Software Six Sigma
Copyright © 2002, PS&J Software Six SigmaAll rights reserved.
13
March 20, 2002
Applying the Six Sigma Toolkit to SoftwareApplying the Six Sigma Toolkit to Software
• The majority of elements of the six sigma toolkit are directly applicableto every day software development data analysis• Quality Function Deployment (QFD) for prioritizing requirements• Process mapping for work flow optimization• Correlation Analysis• Analysis of Variance (ANOVA)• Failure Modes Effect Analysis (FMEA)• Statistical Process Control• Control Plans
• Design of Experiments (DOE), Measurement System Evaluation (MSE)and LEAN tend to have less applicability to every day softwaredevelopment situations than they do in manufacturing applications
PS&J Software Six Sigma
Copyright © 2002, PS&J Software Six SigmaAll rights reserved.
14
March 20, 2002
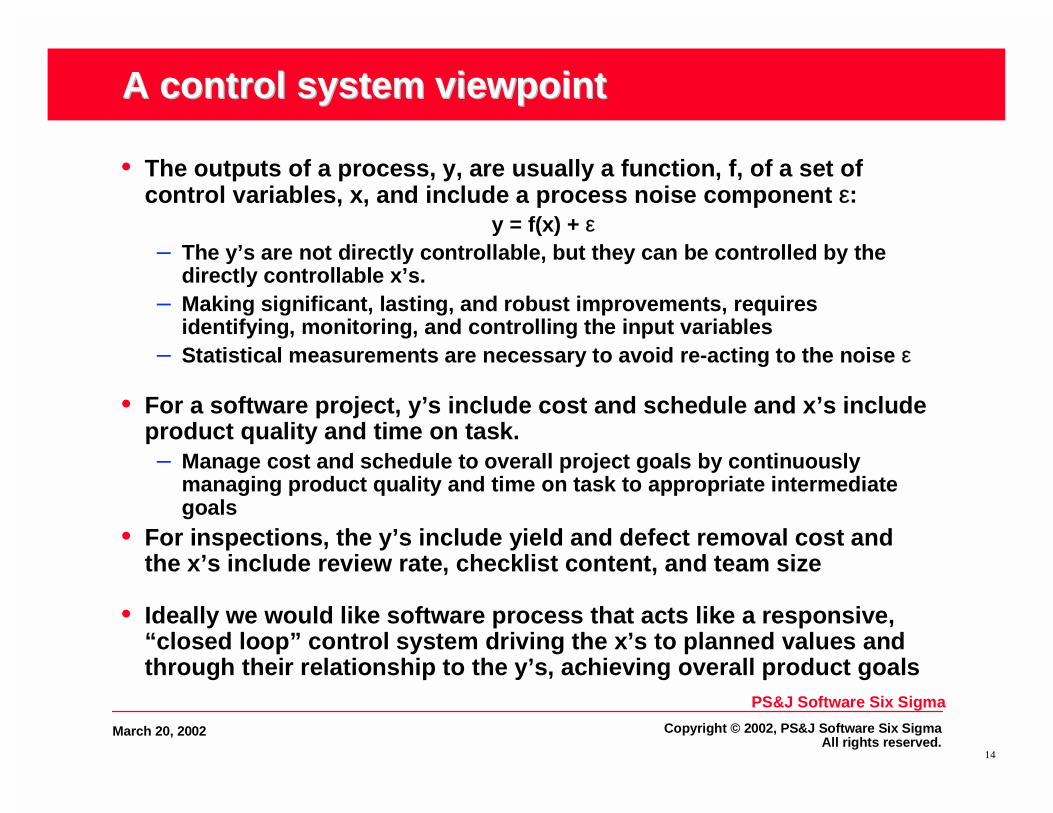
A control system viewpointA control system viewpoint
• The outputs of a process, y, are usually a function, f, of a set ofcontrol variables, x, and include a process noise component ε:
y = f(x) + ε– The y’s are not directly controllable, but they can be controlled by the
directly controllable x’s.– Making significant, lasting, and robust improvements, requires
identifying, monitoring, and controlling the input variables– Statistical measurements are necessary to avoid re-acting to the noise ε
• For a software project, y’s include cost and schedule and x’s includeproduct quality and time on task.– Manage cost and schedule to overall project goals by continuously
managing product quality and time on task to appropriate intermediategoals
• For inspections, the y’s include yield and defect removal cost andthe x’s include review rate, checklist content, and team size
• Ideally we would like software process that acts like a responsive,“closed loop” control system driving the x’s to planned values andthrough their relationship to the y’s, achieving overall product goals

PS&J Software Six Sigma
Copyright © 2002, PS&J Software Six SigmaAll rights reserved.
15
March 20, 2002
A Closed Loop ProcessA Closed Loop Process
• Tasks are planned based onhistorical time, size, and defectdata.
• Individuals log time and defectdata in process as they performtheir tasks
• Individuals manage their owntasks using real-time feedbackprovided by the differencebetween planned and actualprocess metrics
• Activities are driven to plannedperformance
• Planned performance levelsserve as phase exit criteria
• Automated in-process dataacquisition and real timeanalysis is a key enabler
Definerequirements
Produceconceptual
design
Estimatesize
Estimateresources
Produceschedule
Developproduct
Size, time, Defect data
Processanalysis
Availability
Timedatabase
Sizedatabase
Customerneed
Productdelivery
Management
Customer
Producequality plan
Defectdatabase

PS&J Software Six Sigma
Copyright © 2002, PS&J Software Six SigmaAll rights reserved.
16
March 20, 2002
• Most data tends to follow the normaldistribution or bell shaped curve.
• One of the key properties of thenormal distribution is the relationshipbetween the mean (µ) and thestandard deviation (σ).
• σ is a measure of the variation presentin the data
Normal Distribution and VariationNormal Distribution and Variation
3σ 2σ 1σ µ 1σ 2σ 3σ
• 68.2% of the data lies within 1σ of µ• 95.4% of the data lies within 2σ of µ• 99.7% of the data lies within 3σ of µ• 99.99999975% of the data lies within 6σ of µ
• For data that follows a normal distribution– ±3σ is the natural limit of random variation of data produced by a process– ±3σ represents 99.7% of all data produced by a process– ±3σ are the control limits for natural variation
2)(1
1 ∑ −−
= avgxxn
σ

PS&J Software Six Sigma
Copyright © 2002, PS&J Software Six SigmaAll rights reserved.
17
March 20, 2002
Asymmetric DistributionsAsymmetric Distributions
• The distributions associated with softwareprocess measurements tend to be asymmetric– Many variables of interest cannot have
negative values, e.g. product size, effort,and defect density.� In general these quantities have more “room to vary”
up than down since they are constrained to be non-negative.
� This causes an asymmetric distribution of values.
– Unlike the normal distribution, the mean,median, and mode are not coincident.� The mean will not be the most likely value of the
random variable and that there will be a higherlikelihood of a random variable being on one side ofthe mean than on the other.
• The empirical rule allows us to treat non-normaldata as if it were normal for the purposes ofstatistical process control
Module Size Distribution
0
10
20
30
40
50
60
70
80
0 15 30 45 60 75 90105120135150165180195
LOC S
Fre
qu
ency
• Given a homogenous set of data– Roughly 60%-75% of the data will be located within 1σ of µ– Roughly 90%-98% of the data will be located within 2σ of µ– Roughly 99%-100% of the data will be located within 3σ of µ

PS&J Software Six Sigma
Copyright © 2002, PS&J Software Six SigmaAll rights reserved.
18
March 20, 2002
• When a process displays statistical control, a sequence of measurements x1,x2, x3,,…xn,… will display a consistent and predictable amount of variation
• Periodic histograms of the measurements will exhibit a consistent pattern ofvariation, so that it is possible to represent this pattern of variation by astationary density function f(x)
• It is possible to make statistically valid predictions about processes thatexhibit statistical control
• When a process does not exhibit statistical control, the distribution functionchanges over time destroying the ability to make statistically basedpredictions
Statistical ControlStatistical Control
f(x)
σ

PS&J Software Six Sigma
Copyright © 2002, PS&J Software Six SigmaAll rights reserved.
19
March 20, 2002
Control ChartsControl Charts
• Control charts are a graphical depiction of the normal range of variation of astable process.
• Common cause variation is normal random variation in process performance
– Reduction requires a process change
• Special cause variation represents an exception to the process
– Actions to correct special cause variation must eliminate the specific assignablecause
– Special cause action eliminates a specific isolated event; does not necessarilyinvolve a process change
Special cause variation
Average
Time
Metric
- 3σ
+ 3σ
Commoncause
variation

PS&J Software Six Sigma
Copyright © 2002, PS&J Software Six SigmaAll rights reserved.
20
March 20, 2002
XmRXmR Charts Charts
• X is time series of variables xi, i = 1,2,...• R is time series for range of X from measurement to
measurement, i.e. ri = |xi - xi-1|
• xavg is average value of X• mR is average value of R
• X chart shows– xi vs. time– Xavg
– CLx = Xavg ± 2.660 mR• R chart shows
– ri vs time– mR– CLr = 3.628 mR
Re vie w Rate
0
10 0
20 0
30 0
40 0
50 0
60 0
70 0
80 0
90 0
1 5 9 13
17
21
25
29
33
37
41
45
49
53
57
61
65
69
73
77
81
85
LO
Cs
/Hr
m r Re vie w Rate
0
100
200
300
400
500
600

PS&J Software Six Sigma
Copyright © 2002, PS&J Software Six SigmaAll rights reserved.
21
March 20, 2002
Detecting Assignable CausesDetecting Assignable Causes
• X is out of control whenever– a single point xi falls outside the three sigma control limits CLx
– at least two out of three successive xi’s fall on the same side of, andmore than two sigma units away from, the central line
– at least four out of five successive xi’s fall on the same side of, andmore than one sigma unit away from, the central line
– at least 8 successive xi’s fall on the same side of the central line• R is out of control when
– 8 or more successive ri’s fall on same side of median– or 12 or more successive ri’s fall on same side of mR
• A trend is any upward or downward movement of 5 or moreconsecutive points
• Use of control charts to quantify normal variation and to identifythe presence of assignable causes is called Statistical ProcessControl (SPC)
Never attempt to interpret the X chart when the mR chart is out of control !
Never attempt to interpret the X chart when the mR chart is out of control !

PS&J Software Six Sigma
Copyright © 2002, PS&J Software Six SigmaAll rights reserved.
22
March 20, 2002
Always Take Appropriate ActionAlways Take Appropriate Action
Avoid taking special cause action,designed as a one time event to correct an
isolated incident, on a common causeproblem that is inherent to the process
Don’t over react to common causevariation in process performance

PS&J Software Six Sigma
Copyright © 2002, PS&J Software Six SigmaAll rights reserved.
23
March 20, 2002
InspectionsInspections
• Optimizing the inspection process is a good place for anorganization to try out a six sigma approach
INSPECTION PROCESS
INSPECTION Process
INPUTS OUTPUTS
• Code• Checklists• Scripts• Team
• prep time• meeting time• closeout time• defects• defects/inspector• product size• review rate• defects/KLOC• completed checklists

PS&J Software Six Sigma
Copyright © 2002, PS&J Software Six SigmaAll rights reserved.
24
March 20, 2002
Open Loop Inspection Process - TrackingOpen Loop Inspection Process - Tracking
Material Checklist
Reviewmaterial
HoldMeeting
Fix Defects
AnalyzeMetrics
Test Product
• Track process metrics:– rate vs yield

PS&J Software Six Sigma
Copyright © 2002, PS&J Software Six SigmaAll rights reserved.
25
March 20, 2002
Open Loop Process Run ChartsOpen Loop Process Run Charts
• Average review rate 244 LOCs/Hr• Average defect density 39 Defects/KLOC• Average removal rate 6/Hr
De fe ct De nsity
0
2 0
4 0
6 0
8 0
1 0 0
1 2 0
1 4 0
1 6 0
1 8 0
2 0 0
De
fect
s/K
LO
C
Review Rate
0
100
200
300
400
500
600
700
800
900
1 5 9 13 17 21 25 29 33 37 41 45 49 53 57 61 65 69 73 77 81 85
LO
Cs
/Hr
m R De fe cts /KLOC
0
20
40
60
80
100
120
1 5 9 13
17
21
25
29
33
37
41
45
49
53
57
61
65
69
73
77
81
85
m r Re vie w Rate
0
1 0 0
2 0 0
3 0 0
4 0 0
5 0 0
6 0 0

PS&J Software Six Sigma
Copyright © 2002, PS&J Software Six SigmaAll rights reserved.
26
March 20, 2002
Correlation AnalysisCorrelation Analysis
• To evaluate review rate for suitability as a control variable usecorrelation analysis
• r2 = 0.67 – moderately good fit by hyperbola• Chart suggests targeting review rate in the 100 – 200 LOCs hour
range
Review Rate vs Defect Density
0
50
100
150
200
250
0 100 200 300 400 500 600 700 800 900
Review Rate (LOC/Hr)
Def
ect D
ensi
ty (
De
fect
s/K
LOC
)

PS&J Software Six Sigma
Copyright © 2002, PS&J Software Six SigmaAll rights reserved.
27
March 20, 2002
Closed Loop Inspection Process - ManagingClosed Loop Inspection Process - Managing
Material Checklist
Reviewmaterial
HoldMeeting
Fix Defects
AnalyzeMetrics
UpdateChecklist
Update Checklist• Remove questions that are not
catching defects.• Add questions to catch defects
that are leaking out to test.
Test Product
ModifyProcess
Modify Process• Modify review rate• Vary size of material reviewed• Include test cases
Re-review
Analyze Metrics• Process metrics:
– Rate vs Yield– Effectiveness of checklist questions
• Product metrics:– Compare yields to quality plan– Consider re-review of products that
fall outside quality thresholds– Buggiest products list

PS&J Software Six Sigma
Copyright © 2002, PS&J Software Six SigmaAll rights reserved.
28
March 20, 2002
Closed Loop Run Charts Closed Loop Run Charts
• Targeting rate yielded major decrease in variation• Closed loop process achieved significant improvements
– Average Review Rate 138 LOCs/hr– Average Defect Density 118 Defects/KLOC– Average Defect Removal Rate 15/hr
Review Rate
0
20
40
60
80
100
120
140
160
180
200
1 2 3 4 5 6 7 8 9 10 11 12
LO
Cs
/Hr
m R Re vie w Ra te
0
5
1 0
1 5
2 0
2 5
3 0
3 5
4 0
4 5
5 0
1 2 3 4 5 6 7 8 9 1 0 1 1 1 2
De fe ct De n s ity
0
50
10 0
15 0
20 0
25 0
30 0
35 0
40 0
1 2 3 4 5 6 7 8 9 10 11 12
De
fec
ts/K
LO
C
m R De fe ct De ns ity
0
5 0
1 0 0
1 5 0
2 0 0
2 5 0
3 0 0
1 2 3 4 5 6 7 8 9 1 0 1 1 1 2
PS&J Software Six Sigma
Copyright © 2002, PS&J Software Six SigmaAll rights reserved.
29
March 20, 2002
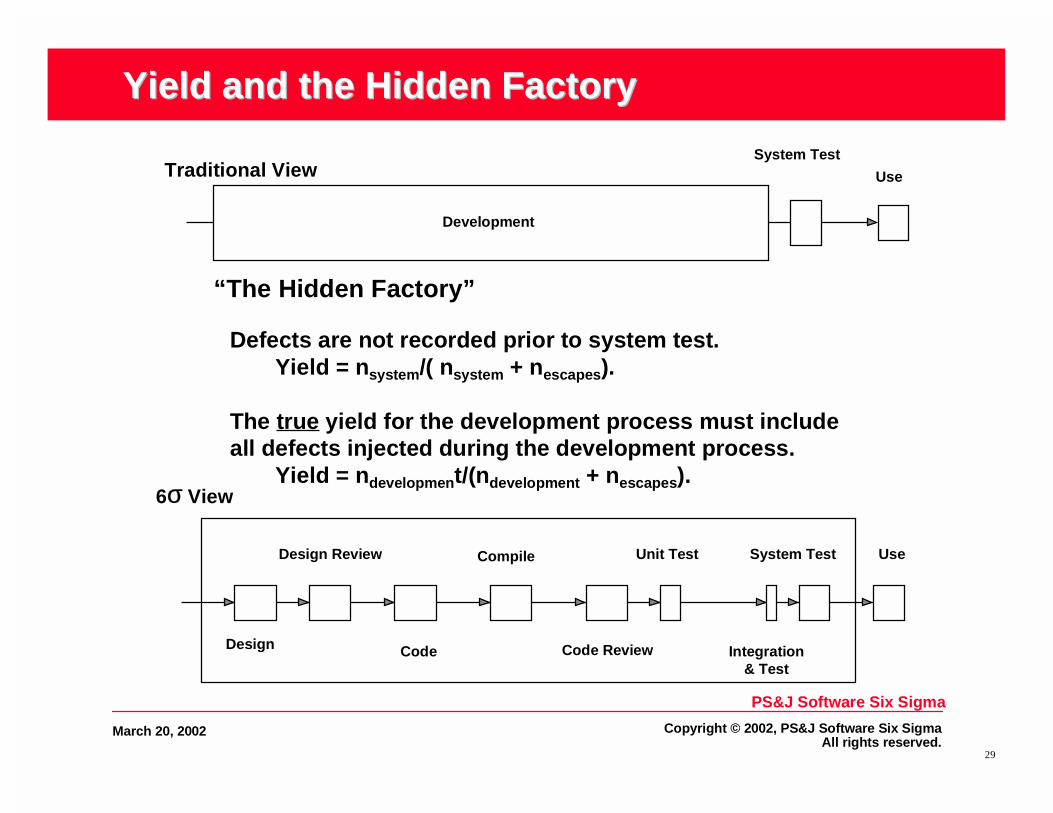
Yield and the Hidden FactoryYield and the Hidden Factory
“The Hidden Factory”
Defects are not recorded prior to system test.Yield = nsystem/( nsystem + nescapes).
The true yield for the development process must includeall defects injected during the development process.
Yield = ndevelopment/(ndevelopment + nescapes).6σ View
Design Review
Code Code Review
Compile Unit Test
Integration& Test
Design
UseSystem Test
Traditional View Use
Development
System Test

PS&J Software Six Sigma
Copyright © 2002, PS&J Software Six SigmaAll rights reserved.
30
March 20, 2002
Process YieldProcess Yield
Code Review(70%)
Detailed Design (0%)
Detailed Design Review (70%)
Code (0%)
Unit Test (50%)
Compile (50%, code only)
40 Design Defects Injected
28 Removed, 12 escapes
60 Coding Defects Injected, 72 total
50 Removed,22 escapes
7 Removed,6 escapes
9 Removed, 13 escapes
What’s the yield of this process?
Integration Test (35%)
System Test (35%)
2 Removed,4 escapes
1 Removed,3 escapes
97/(40 + 60) = 97%

PS&J Software Six Sigma
Copyright © 2002, PS&J Software Six SigmaAll rights reserved.
31
March 20, 2002
Control Plan for Product QualityControl Plan for Product Quality
• Inspection process can be characterized by its yield• Historical yields allow you to plan the number of defects that will be
removed• Manage to the plan by taking planned corrective actions when actual
Defects Contained diverge from planned by an amount that exceedsa threshold– If a module has too many defects in integration, pull it and inspect it
Quality Plan for 1 KLOC Embedded Code
Defects leaked from prev phase
New Defects Injected Phase Yield Defects
ContainedDefects Leaked
Defect Removal
Cost
Total Removal
Cost (hrs)
Design 0.0 40 0% 0.0 40.0 n/a 0.00
Design Bench Check 40.0 0 50% 20.0 20.0 10 mins 3.33
Design Inspection 20.0 0 50% 10.0 10.0 30 mins 5.00
Code 10.0 60 0% 0.0 70.0 n/a 0.00
Code Bench Check 70.0 0 70% 49.0 21.0 5 mins 4.08
Compile 21.0 0 50% 10.5 10.5 1 min 0.18
Code Inspection 10.5 0 60% 6.3 4.2 15 mins 1.58
Unit Test 4.2 0 50% 2.1 2.1 15 mins 0.53
Integration Test 2.1 0 35% 0.7 1.4 18 hrs 13.23
System Test 1.4 0 35% 0.5 0.9 18 hrs 8.60
CUSTOMER 0.9 37

PS&J Software Six Sigma
Copyright © 2002, PS&J Software Six SigmaAll rights reserved.
32
March 20, 2002
Calculating Return on Investment - 1Calculating Return on Investment - 1
• Without inspections, the cost of defect removal is 267 hrs per KLOC• Savings require estimating the difference in cost between finding a
defect in review and finding it later in the process
Defects leaked from prev phase
New Defects Injected
Phase Yield Defects Contained
Defects Leaked
Defect Removal
Cost
Total Removal
Cost (hrs)
Design 0.0 40 0% 0.0 40.0 n/a 0.00
Design Bench Check 40.0 0 0% 0.0 40.0 10 mins 0.00
Design Inspection 40.0 0 0% 0.0 40.0 30 mins 0.00
Code 40.0 60 0% 0.0 100.0 n/a 0.00
Code Bench Check 100.0 0 0% 0.0 100.0 5 mins 0.00
Compile 100.0 0 50% 50.0 50.0 1 min 0.83
Code Inspection 50.0 0 0% 0.0 50.0 15 mins 0.00
Unit Test 50.0 0 50% 25.0 25.0 15 mins 6.25
Integration Test 25.0 0 35% 8.8 16.3 18 hrs 157
System Test 16.3 0 35% 5.7 10.6 18 hrs 102
CUSTOMER 10.6 267

PS&J Software Six Sigma
Copyright © 2002, PS&J Software Six SigmaAll rights reserved.
33
March 20, 2002
Calculating Return on Investment - 2Calculating Return on Investment - 2
Defects leaked from prev phase
New Defects Injected
Phase Yield Defects Contained
Defects Leaked
Defect Removal
Cost
Total Removal
Cost (hrs)
Design 0.0 40 0% 0.0 40.0 n/a 0.00
Design Bench Check 40.0 0 50% 20.0 20.0 10 mins 3.33
Design Inspection 20.0 0 50% 10.0 10.0 30 mins 5.00
Code 10.0 60 0% 0.0 70.0 n/a 0.00
Code Bench Check 70.0 0 70% 49.0 21.0 5 mins 4.08
Compile 21.0 0 50% 10.5 10.5 1 min 0.18
Code Inspection 10.5 0 60% 6.3 4.2 15 mins 1.58
Unit Test 4.2 0 50% 2.1 2.1 15 mins 0.53
Integration Test 2.1 0 35% 0.7 1.4 18 hrs 13.23
System Test 1.4 0 35% 0.5 0.9 18 hrs 8.60
CUSTOMER 0.9 37
• With inspections, the cost of defect removal drops to 37 hours,a savings of 230 = 267 – 37 hours
• The cost of holding the inspections is about 80 hours(at 100 LOC/hr), so the net savings is 150 hours

PS&J Software Six Sigma
Copyright © 2002, PS&J Software Six SigmaAll rights reserved.
34
March 20, 2002
Quality is FreeQuality is Free
COQ Correlation
y = -1.221x + 0.3469
R2 = 0.8619
0
0.1
0.2
0.3
0.4
0.5
0 0.05 0.1 0.15 0.2
Appraisal COQ
Fai
lure
CO
Q
P roductiv ity v s Appraisal C O Q
0
5
10
15
20
25
30
0 0.05 0.1 0.15 0.2
Appra isa l COQ
LO
Cs/
hr
• As appraisal cost increases– Failure costs decrease– Overall COQ remains constant– Productivity remains constant
• No net cost to performing appraisals• Appraisal cost is more controllable than failure cost• Results in more accurate estimates, fewer defects to integration and
system test

PS&J Software Six Sigma
Copyright © 2002, PS&J Software Six SigmaAll rights reserved.
35
March 20, 2002
CMM – A Six Sigma PerspectiveCMM – A Six Sigma Perspective
• From a business perspective,predictable processperformance is a key aspectof process capability
• Predictable performancerequires a stable process
• First step to a stable processis a “defined process”
• Moving up the CMM levelscorresponds to firststabilizing the process, thenreducing variation, and finallycentering the process ontarget performance
Target
5
Target4
Target3
Target2
Target1
SCHEDULE/COST/QUALITY

PS&J Software Six Sigma
Copyright © 2002, PS&J Software Six SigmaAll rights reserved.
36
March 20, 2002
Driving CMM Based SPI With Six SigmaDriving CMM Based SPI With Six Sigma
• Six Sigma can be used to drive CMMbased SPI in a bottoms-up fashion
• Emphasis on direct coupling tobusiness results and measurableimprovements– allows easy quantification SPI ROI– moves organization away from level
oriented goals – levels become a by-product of SPI, not the primary goal ofSPI
– sustains executive sponsorship• Metrics driven bottoms up approach
more likely to result in real measurableimprovements than top down processdeployment driven by level goals
• Apply DMAIC to one or two processesat a time as part of an SPI action plan
• Look at process metrics and successat achieving business goals inassessing process effectiveness
Define
Measure
Control
Improve
IDEAL and DMAIC
Analyze
• Track SPI ROI using relationships to business goals• If your organization has a six sigma initiative, integrate your CMM activities
with it

PS&J Software Six Sigma
Copyright © 2002, PS&J Software Six SigmaAll rights reserved.
37
March 20, 2002
PSPPSP
• PSP is a lightweight level 5 process
• It is based on six sigma concepts– fact based– data driven
– closed loop
• It is designed to be introduced bottoms up in an organization, oneteam at a time
• It doesn’t require a high level of process maturity for introduction,basic configuration management and quality assurance are the onlypre-requisites
• Data recording overhead is exceptionally low – typically less than 5minutes per day
• Engineers are provided with real-time data analysis for decisionsupport in the course of doing their task and performing a task post-mortem

PS&J Software Six Sigma
Copyright © 2002, PS&J Software Six SigmaAll rights reserved.
38
March 20, 2002
TSPTSP• Team oriented approach to project planning and tracking• Launch meeting kicks off a project
– Three to four day team building experience– Data driven, emphasizes individual ownership, focuses on attaining
overarching business goals– Detailed plan features 0-100 milestones with 2 /person/week granularity that
provides EV tracking with extraordinary fidelity– Everyone comes out with a clear understanding of roles, responsibilities,
and tasks– Detailed quality plan that projects defects injected and removed by phase,
establishes phase exit criteria, defines corrective action plans
• Structured weekly status meeting are used to manage the project– Each person briefs performance relative to plan, risk and action item status– Lead briefs overall status, sets goals for next week
• Quarterly re-launches create new detailed plans– Due to extraordinary high level of task granularity, detailed planning is only
done one quarter out
In 4 days, 5 people will generate a far better plan than one person working alone for 20 days.
They’ll do it faster. They’ll own it. They’ll use it.
In 4 days, 5 people will generate a far better plan than one person working alone for 20 days.
They’ll do it faster. They’ll own it. They’ll use it.

PS&J Software Six Sigma
Copyright © 2002, PS&J Software Six SigmaAll rights reserved.
39
March 20, 2002
PSP, TSP, and Six SigmaPSP, TSP, and Six Sigma• PSP and TSP directly address
– Large data variation normally seen due to the wide range of individual skills– Process noise caused by inadequate measurements– Credibility of process improvement with team members
� The PSP training course is based on each individual using the process, makingmeasurements, and observing their own performance improvements as the courseprogresses
– Willingness of individual engineers to take data and use it for continuousimprovement� PSP is structured so that all data is used by the person who collected it within a short
time after collection.� Results of data driven process improvement are immediately apparent to each
practitioner– Support structure to change individual behavior through use of TSP team
building, status meetings, and use of post mortems
• PSP and TSP are well-defined fully instrumented processes, generallyapplicable “out of the box”, supported by excellent training material, andhas extensive performance data available
• For all these reasons, PSP and TSP make a great platform for thedeployment of six sigma technique– Six Sigma techniques easily integrate into and extend PSP/TSP’s management,
design, inspection, and post-mortem processes

PS&J Software Six Sigma
Copyright © 2002, PS&J Software Six SigmaAll rights reserved.
40
March 20, 2002
Six Sigma DeploymentSix Sigma Deployment
• Many organizations have had significant success deploying six sigma inmanufacturing, but have had very little or no success in penetrating softwareengineering
• Some barriers to successful application in software that must be addressed are– Too many competing initiatives
� TQ, ISO, CMM, Six Sigma– Rigid application of the CMM staged model
� SPC is for level 4 and 5 organizations
– Standard six sigma training does not directly relate to software development� Software is different� Software developers can’t bridge gap on their own� “One size fits all” generates resistance
– Business as usual after training� No time for continuous improvement� Six Sigma Projects are not considered integral to software development� Deployment process fails to change engineers daily behavior, not just managers, process people,
etc.
– Poor alignment of sponsorship� Divided responsibilities for productivity improvement and product development
• Once you have addressed the barriers– Set SMART goals– Train project oriented teams– Put them to work using the six sigma toolkit to focus on achieving the goal immediately– Provide them with adequate mentoring and visible sponsorship

PS&J Software Six Sigma
Copyright © 2002, PS&J Software Six SigmaAll rights reserved.
41
March 20, 2002
Why Should You Use Six Sigma?Why Should You Use Six Sigma?
• You can’t manage what you don’t measure• If you don’t manage a process it is unlikely to perform as well as it could• Closed loop processes outperform open loop ones• If you don’t couple an SPI effort to measurable business results, it is
unlikely to survive a change in executive sponsorship• CMM Levels do not equate to business results• Combining a Six Sigma approach to process improvements at the
tactical level with a CMM approach at the strategic level, addresses all ofthese issues
• You only need to measure three things: size, time, and defects, but youneed to measure them well
• Metrics can and should be taken at every CMM level and should be usedto manage and evaluate process effectiveness
• Metrics need to be put into a statistical context before being used tomake decisions
• Once you know how, you’ll find most elements of the Six Sigma tool kithave broad applicability to software development
PS&J Software Six Sigma
Copyright © 2002, PS&J Software Six SigmaAll rights reserved.
42
March 20, 2002
For Additional Information ContactFor Additional Information Contact
Ellen George
201- [email protected]
Steve Janiszewski
201- [email protected]
www.SoftwareSixSigma.com