skeletal correlates of coral density banding and an ... · density bands is not reliable because...
TRANSCRIPT

MARINE ECOLOGY PROGRESS SERIES Mar. Ecol. Prog. Ser. I Published July 7
Skeletal correlates of coral density banding and an evaluation of radiography as used in
sclerochronology
Martin D'A. A. L e ~ i s s i er ' , Barry Clayton2, Barbara E. ~ r o w n ' , Peter Spencer Davis3
' Department of Marine Sciences and Coastal Management, University of Newcastle upon Tyne, NE1 7RU, United Kingdom Department of Medical Physics, Royal Victoria Infirmary. Newcastle upon Tyne NE1 4LP, United Kingdom
Department of Zoology, University of Glasgow, Glasgow G12 8QQ, United Kingdom
ABSTRACT: The skeletal correlates of density band patterns seen on radiographs of coral skeletons is investigated by theoretical analysis of radiography, comparison of radiographs and skeleton, and modelling of skeletal slices of the massive Indo-Pacific coral Pontes lutea and the branching Caribbean coral Pontes porites. Radiography resolves finer detail of the coral skeleton than has previously been recognised. Small changes in path length of individual skeletal elements attenuating an X-ray beam, including dissepiments as thin as 3 to 10 pm, can generate contrast on radiographs as well as variations in skeletal bulk density. The annual high/low density band pattern was found to be correlated with areas of relatively thick/thin skeletal elements respectively. Secondary density variations seen on radiographs, 'fine' bands, were found to be correlated with the position of corallite walls oriented per- pendicular to the the long axis of the skeletal slice or dissepiments. Modelling of skeletal slices showed that errors in the density band record may be introduced by (1) skeletal slices not following the growth axis of the colony, and (2) changes in corallite orientation which generate density variations that are not part of any growth record. The use of radiography as a tool for demonstrating growth records in coral skeletons is critically reviewed. It is proposed that the skeletal growth record consists of patterns of thickeninglthinning and spacing of skeletal elements. The illustrations of these patterns by analysis of the actual skeleton, rather than by radiography, may prove to be a very accurate method of determin- ing growth records in corals.
KEY WORDS: Corals . Density banding . Sclerochronology
INTRODUCTION
Studies on growth patterns in contemporary corals have centred on the observation by Knutson et al. (1972) of alternating dark (high density) and light (low density) bands on radiographs taken of slices of coral skeleton. Couplets of dark and light bands have been shown to reflect seasonal variations in the apparent bulk density of skeleton (see Barnes & Devereux 1988, Barnes & Lough 1989). Density banding is considered a characteristic feature of massive coral skeletons, and banding patterns have the potential to provide a marine analogue to dendrochronology and dendro- climatology.
Studies on density band patterns in corals have been principally concerned with the pursuit of empirical
linkages with environmental parameters (see Barnes & Devereux 1988, Barnes & Lough 1989, Lough & Barnes 1990a for reviews). In contrast, little effort has been directed towards determining how variations in coral skeleton architecture cause banding patterns, and radiographs have been regarded as direct photo- graphic illustrations of skeletal structure and density (Barnes et al. 1989). However, interpretation of coral density bands is not reliable because the physical characteristics of the skeleton which cause banding, and the physiological and biological mechanisms responsible for band formation, are not known (Budde- meier & Kinzie 1975, Wellington & Glynn 1983, Barnes & Devereux 1988, Lough & Barnes 1992, Le Tissier & Scrutton 1993). Few studies (Macintyre & Smith 1974, Le Tissier & Scrutton 1993, Dodge et al. in press) have
O Inter-Research 1994 Resale of fuU article not permitted
Mar. Ecol. Prog. Ser. 110: 29-44, 1994
used observations made directly from coral skeletons other Porites species making comparisons between to describe skeletal characteristics that correlate with skeleton, radiographs, and theoretical deductions radiographic banding patterns. Other work has at- relatively easy. tempted to derive skeletal characteristics (1) from the image of the skeleton shown on radiographs (Budde- meier et al.. 1974, Buddemeier & Kinzie 1975), (2) using THEORY techniques for measuring density which either pre- serve or destroy the skeleton architecture (Barnes & Previous studies that have considered theoretical Devereux 1988) or (3) from computer models of the aspects of X-ray systems and radiography of coral coral skeleton (Barnes et al. 1989). skeletons have been concerned with the measurement
Studies by Buddemeier (19?4), Brown et al. (1986) of skeletal density by microdensitometry of radio- and Barnes & Lough (1989) have shown that the nature graphs (Buddemeier 1974, Chalker et al. 1985). In of coral bandng patterns may be more complex than these studies a radiograph was regarded as displaying annual couplets of high and low density bands. A the density of material through which an X-ray beam feature of radiographs of whole colony slices (e.g. passed. Density of coral skeleton is determined by the Lough & Barnes 1992), and sub-samples of colonies, relative proportions of skeleton to pore space between for example from cores (e.g. Hudson et al. 1976, Hud- skeletal elements. In this study, we investigated the son 1981), is the variability in the appearance of the resolution of an X-ray system in order to determine the banding pattern both within and between speci~riens. effect :ha: orientation and size of individilal skeletal This is confirmed by gamma densitometric measure- elements might have on the attenuation of an X-ray ments taken along tracks across different radii of beam and the photographic density on resulting radio- colony slices which show that there is no evidence for graphs. We viewed a radiograph as showing the path a common density pdtlern within single colonies, length of skeleton through which the X-ray beam between colonies from the same reef, or among passed at any given point. colonies from different reefs (Lough & Barnes 1992). The radiographic system used in the present study
Recently, Barnes, Lough and co-workers have car- (see 'Materials and Methods') is capable of resolving ried out a series of studies which sought to identify the at least 18 line pairs mm-', provided the radiation con- problems associated with interpreting 2-dimensional trast between adjacent lines is sufficiently great. This radiographic images of a volume of skeleton subjected means that objects as narrow as 30 pm can be resolved to an X-ray beam (Barnes & Lough 1989, 1990, Barnes under ideal recording conditions providing the attenua- et al. 1989, Lough & Barnes 1990a, b, c, 1992). The tion of the X-ray beam, by the material being X-rayed, is extreme variability of results obtained using radio- sufficient to produce contrast on the X-ray film. For graphic and densitometric techniques has led them to radiographs of small objects, we have assumed that a suggest that alternative methods should be found to radiation contrast of 3 % is detectable at a photographic derive chronological and climatological information density of 1.4 (John Kotre pers. comm.). recorded in coral skeletons (Lough & Barnes 1992). For a homogeneous beam of X-rays the intensity of
The aims of the present study are to explore (1) the radiation at a point beyond an object is given by nature of the attenuation of an X-ray beam by coral
I = Ioe-"' skeleton, (2) which features of the skeleton determine (1)
and characterise any growth patterns recorded in coral where I = intensity of transmitted radiation at a given skeletons, and (3) the sources of error in determining point when the object is in the beam, I. = intensity of growth patterns in corals using radiography. We radiation at the same point when the object is absent employed a combination of theoretical considerations and all other conditions are unchanged, p = linear of radiography, comparisons of the architecture of absorption coefficient, t = thickness of the object, and skeletal material with their derived radiographs and e = exponential coefficient. modelling of skeletal slices subjected to X-ray beams Radiation contrast = = 0.03 for the detection
I0 in order to gain an understanding of how skeletal criterion assumed, therefore architecture both records a growth history and causes banding patterns on radiographs. - ,! - 0.97 = e-p'm
Porites lutea (Edwards & Hairne) was chosen as the 10
Thus the minimum detectable thickness t,, is given main coral for study because it is the most widely used L.,
Indo-Pacific coral in radiographic studies of skeletal banding patterns. In addition, Pontes porites (Pallas) from the Caribbean was studied because it has larger The linear absorption coefficient is dependent upon skeletal elements (e.g. dissepiments) compared to the density and effective atomic number of the object
Le Tissier et al.: Coral denslty banding 3 1
and the quantum energy of the incident radiation. If the material of the object is aragonite (CaC03), which has a density of 2.8 in coral (Barnes & Devereux 1988), then for 20 keV X-rays the linear absorption coefficient is 15.2 cm-'. Substituting this value in the expression for minimum detectable thickness gives tmi, = 20 pm.
The t,, values calculated above suggest that the resolving power of the X-ray system should be much greater than has probably been realised previously. The skeleton of Porites species consists of a reticulation of cylindrical vertical rods interconnected by horizon- tal bars which vary in width from 40 to 400 pm. Peri- odically along the vertical axis of the skeleton, which corresponds to the growth axis, areas of skeleton are separated by dissepiments, that are formed around and between the bars and rods. Dissepiments mark the former positions of the base of the coral tissues. In P. lutea dissepiments have a thickness of between 3 and 10 pm, and in P. porites a thickness of between 20 and 40 pm. An image on a radiograph results from the cumulative absorption of X-rays by skeletal ele- ments through the slice thickness. Based on our calcu- lations, most individual skeletal bars and rods ought to be resolvable by the X-ray system. Such features would appear on radiographs providing there were only single bars or rods within the skeletal slice sub- jected to an X-ray beam, or the radiation contrast attributable to an individual element was sufficiently great so as to be seen against the background contrast generated by other skeletal elements. Dissepiments have previously not been considered able to generate contrast on radiographs (Barnes & Lough 1989).
The dimensions of dissepiments of Porites lutea suggest that if the thin sheets of skeleton were either perpendicular or parallel to the X-ray beam t- and line resolution criteria respectively would fall outside of the
a beam b beam
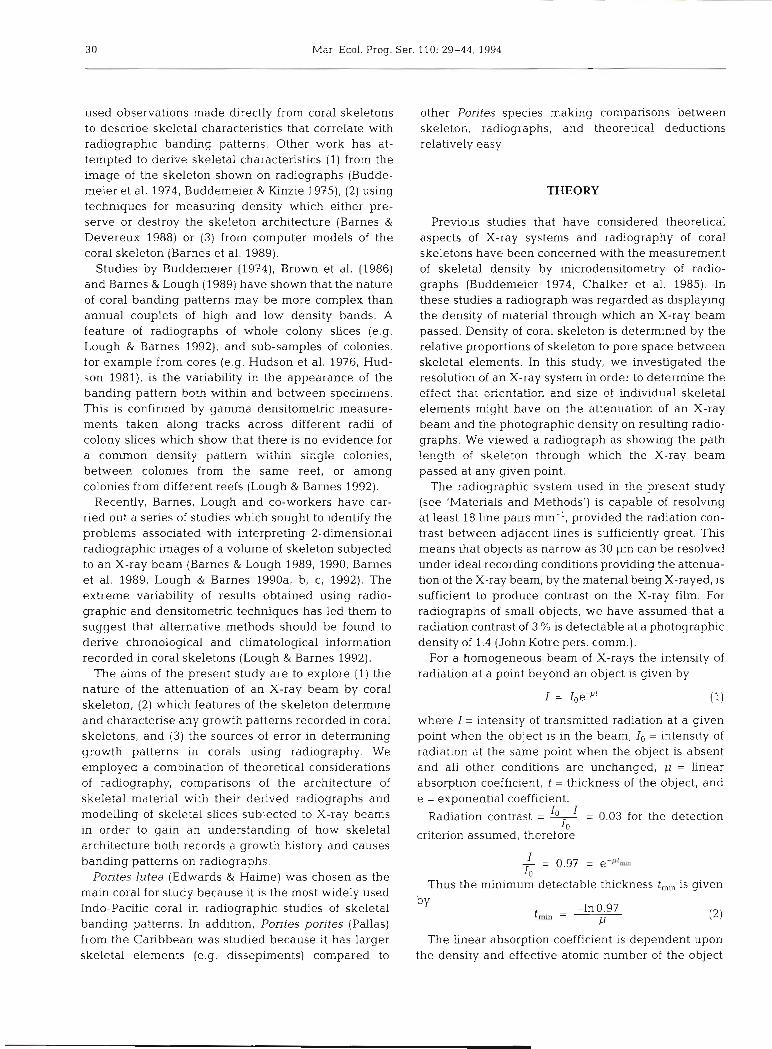
resolution of the X-ray system. Dissepiments of P. porites would bracket the resolution of the X-ray system. When a specimen is prepared to demonstrate banding patterns by radiography, sections are cut parallel to the growth axis of the coral. This implies that the planes of dissepiment will be parallel to the axis of the X-ray beam; that is, the dissepiment will be edgeways on in the beam. In these circumstances, dissepiments less than 20 pm thick will not be resolved in the X-ray image. However, dissepiments which lie within a range of angles to the beam can be resolved if they are suffi- ciently far apart and if the section IS thick enough (Fig. 1). For a dissepiment of thickness winclined at an angle 0 to the axis of the X-ray beam, the path length of a ray passing through the dissepiment is t. For dissepi- ments of P. lutea the maximum inclination that will give a path length, t , of 20 pm (Fig. l a ) in order to give a min- imum radiation contrast of 3 % is given by the equation
o = sin-I (f)
If the range of thickness of dissepiments is from 3 to 10 pm and t is 20 pm then, using the above equation for a dissepiment of 3 pm thickness, the maximum inclination (em,,) to the axis of the X-ray beam which will produce a radiation contrast 2 3 % is 9" while for a 10 pm thick dissepiment it is 30".
The width of the line projected onto the X-ray image plane by an inclined dissepiment depends upon the inclination of the dissepiment and the thickness of the section. Disregarding small edge effects, the width (W) of the line projected onto the image plane by an inclined dissepiment (Fig. l b ) is given by:
where T = section thickness, and 8 = angle of in- clination.
C beam
Fig. 1. (a) Relationshlp used to calculate the minimum path length necessary for an object to be resolvable by a X-ray system. SS: skeletal slice; t: thickness of object; W: thickness of dissepiment; 8. angle of inclination. (b) Relationship between an object and its image on a radiograph. W: width of image; T. thickness of skeletal slice. (c) Effect of a change in onentation of a skeletal element within a skeletal slice on the relative position of the skeletal element on the surface of the slice and its X-ray image
3 2 Mar. Ecol. Prog. Ser. 110: 29-44, 1994
For a section thickness of 400 pm and a dissepiment thickness of 10 pm inclined at its maximum angle of 30" the line width (W) will be 219 pm. A 3 pm thick dissepiment inclined at its maximum angle of 9" would project as a line 60 pm wide; in principle this could be visualised on a radiograph with a resolution of 18 line pairs mm-', but the contrast cnterion adopted ear- lier would probably be too optimistic and significantly higher radiation contrast would be necessary for such a narrow band to be discernible.
If the spacing between dissepiments were less than or equal to the width of the line projected by a single inclined dissepiment, then a broad band would be pro- duced in the image. Where overlap of dissepiments occurs in the path of the X-rays, bands would also be produced in the image; such bands could appear at even steeper angles than ern,, provided that the total path length through aragonite exceeded tmin.
Where a dissepiment changes its orientation within a skeletal slice (Fig. lc) then a line would only be pro- duced in the image for that portion of the dissepiment where em,, and t,, are not exceeded (82 and t2). Where urn,, and t,,, are exceeded (0, and il j no irndye would be produced, and the position of the line in the image would not correspond with the position of the dissepi- ment as seen on the upper surface of the skeletal slice (Fig. lc). The width of the line (W) would only corre- spond to that portion of the dissepiment satisfying the em,, and t,,, criteria and not the obliquity of the dis- sepiment between surfaces of the skeletal slice. The arguments above, which consider thin plates of skele- ton, would equally apply to narrow bands of relatively thickened skeletal elements.
The foregoing analysis has only taken into consider- ation X-rays with a quantum energy of 20 keV. This is appropriate for a molybdenum target X-ray tube oper- ated at 22 kV peak; most of the radiation generated will be k-characteristic X-rays of molybdenum with energies of 17.9 and 19.5 keV. If such an X-ray tube is excited at higher potentials then a greater proportion of bremsstrahlung X-rays will be produced with a broad spectrum of energies up to a maximum ( ~ n keVj which is numerically equal to the peak kV. An exciting potential of 40 kV peak would produce broad spec- trum X-rays with an effective energy of about 30 keV.
Suppose that an X-ray beam generated at 40 kV peak contains photons of 20 and 30 keV only, in equal proportions, representing equal components of charac- teristic and bremsstrahlung radiation. The linear ab- sorption coefficient for aragonite exposed to 30 keV X-rays can be estimated in the same manner as for 20 keV X-rays and is calculated to be 4.9 cm-'. Adopting the same conventions and the same cnterion of visibility as before, then t,,, may be calculated as follows:
Thus ~t becomes more difficult to demonstrate fine structure with X-rays generated at higher exciting potentials.
In order to test the validity of our theoretical calcula- tions described above, we investigated the path length of calcium carbonate necessary to generate a 3 % radi- ation contrast and the effect of thin plates of material on radiography. A wedge-shaped mould, made from perspex with a depth range of 0 to 7 mm, was filled with ground Porites lutea skeleton with a grain size of approximately 30 pm to produce a calcium carbonate wedge. The bulk density of calcium carbonate within the wedge was calculated at 2.068 g cm-3 in contrast to a measured densiiy u i soiid coral skeleton of approd- mately 2.7 to 2.8 g cm-3 (Barnes & Devereux 1988). The wedge was X-rayed so that the dynamic range of the resulting radiograph covered the 0.0 to 3.5 mm thick portion of the wcdge. The ~)ptjcz! density of the resulting radiograph was measured as described below and plotted against thickness of calcium car- bonate through which the X-ray beam passed. A 3% change in optical density corresponded to a 46.6 pm change in path length of calcium carbonate. This value equates well with the values theoretically calculated above considering the lower density value of the wedge compared to actual density recorded from coral skeleton.
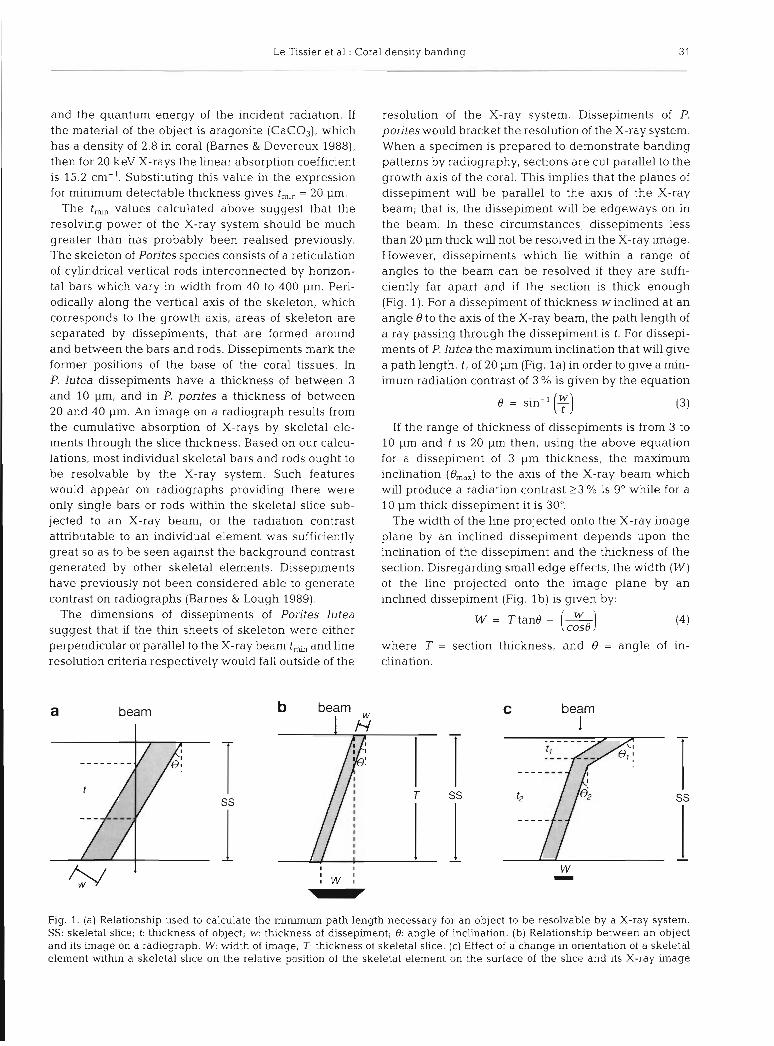
A model to demonstrate the effect of changes in orientation of material with respect to an X-ray beam was made from 6 sheets of aluminium foil sandwiched between perspex. Each sheet of aluminium foil was 0.03 mm thick and separated from each other by 2 mm. The depth of the model through which the X-ray beam passed was 5 mm. Radiographs were taken with the model inclined with respect to the X-ray beam at angles between 0 and 35". Although the bulk density of aluminium within the volume of the whole model was low, the path length of aluminium through which the X-ray beam passed was sufficient to produce bands of contrast on the radiographs (Fig. 2). As the angle of the sheets of aluminium foil with respect to the X-ray beam increased from 0 to 35" the images of individual sheets of foil were shown to overlap with the result that there was a reduction in overall density of their indi- vidual images and, with increasing angle to the X-ray beam, there was a change from 6 fine high density bands and 2 contrast levels on the radiograph at 0" to l l bands and 4 contrast levels at 35". The width of the dark bands on the radiograph of the model at 0' was an order of magnitude wider than the width of the alu-
Le Tissier et al.: Coral density banding 33
Fig. 2. Positive radiographs of the aluminium foil model show- ing that the level of contrast and number of contrast bands changes as the angle of thin sheets of material to the X-ray beam is varied from 0" (sheets parallel to X-ray beam) to 359 Each radograph was taken with identical exposure settlngs
and pnnted using the same grade of photographic paper
minium foil (- 300 to 500 pm cf. 30 to 50 pm) demon- strating that X-ray scattering can increase the appar- ent width of structures.
MATERIALS AND METHODS
Specimen collection and preparation. Specimens of the Indo-Pacific coral Pontes lutea and the Caribbean coral P. porites were collected from KO Phuket, Thai- land, and St. Croix, U.S. Virgin Islands, respectively. Three specimens of Pontes lutea, all collected from the same site (Porites Bay; Scoffin et al. 1992), are described in detail here.
(1) Specimen PB1 -the top 5 cm of a core taken from a large Porites lutea colony. A 24 mm thick slice was cut from the core and X-rayed. The slice was then sequentially ground to one-half of its thickness and re- X-rayed, until it was 0.75 nlm thick.
(2) Specimen PB2 - a section from a 5 mm thick slice cut from this sample has previously been described by Scoffin et al. (1992). We embedded a 5 mm wide section of skeleton in Emix resin with a whitener added. The surface of the resulting block was polished with carborundum powder, the skeleton stained in a solution of Alizarin red-S in 0.5 % hydro- chloric acid and analysed for recurring patterns of skeletal features and morphology using a Wilde M8 stereomicroscope fitted with an eyepiece graticule and a drawing tube. A 9 mm thick block from a portion of skeleton was X-rayed and then a 0.4 mm section cut from it using a Metals Research Microslice 2. The 0.4 mm section was X-rayed and the skeleton prepared and analysed as described above. Embedding a skele- ton in resin prior to radiography will increase the min- imum detectable thickness of skeleton on a radiograph by approximately 7 % (B. Clayton pers. obs.)
(3) Radiographs taken of specimen PB3 were found not to show distinct annual density bands but narrow dense bands of the type described as 'fine' bands by Barnes & Lough (1989). A 5 mm thick slice of this specimen was embedded in resin and a thin (1 mm thick) slice cut from one side of the slice. The surface of the thin slice was polished and the skeleton stained and analysed for recurring patterns of skeletal features and morphology as described above.
Slices (3 mm thick) of Porites porites skeleton taken from along the longitudinal axis of branches were embedded in resin, then X-rayed and sequentially ground down and re-X-rayed at 1.5 mm then at 0.75 mm thickness. The skeleton of the 0.75 mm thick slice was analysed for recurring patterns of skeletal features and morphology as described above.
Radiography, optical densitometry and photography. Radiography described in this study was carried out using a CGR Senographe marnrnography unit using Fuji mammography film. Specimens were X-rayed at a source to film distance of 75 cm and exposures (keV & MaS) were varied according to the type and thickness of the specimen to give well-contrasted radiographs. All skeletal material X-rayed in this study had been em- bedded in Emix resin; no differences were found in the appearance of radiographs of skeletons before or after embedding (Le Tissier pers. obs.). A Monovar mono- scopic zoom macroscope was used to photograph skele- tal material. A Cambridge 240 Scanning Electron Microscope with a calibrated line separation measuring system was used to determine skeletal dimensions, and in all cases a minimum of 10 measurements were made.
34 Mar. Ecol. Prog. Ser
Effect of sample and corallite orientation on radio- graphy. A Wilde M8 stereomicroscope was used to observe the orientation and dimensions of corallites, and determine growth axes and banding patterns, on slices of Pontes lutea skeleton. This information was used to make drawings of a coral colony, with and without a change in growth axis, in order to charac- terise (1) possible sources of variations in radiographic banding patterns that might occur from sub-sampling of coral colonies, for example by coring, and (2) the effect that changes in density band orientation within a sample of skeleton might have on an annual radio- graphic density signal. In practice cores are cut or ground to produce slices of skeleton for radiography. For the purposes of the models, a core is illustrated as a rectangular block which may be X-rayed through either pairs of faces in order to simulate that a slice of skeleton may be prepared at a range of orientations about the axis of the original core.
To investigate the detaded effect that changes in coral- lite orientation within a skeletal slice might have on radiographic banding patterns, a series of drawings were made to represent a skeierai siice within w'nicn the orientation of corallites deviated by 20, 40, 60 and 80" from the longitudinal axis of the slice. Each drawing was based on a skeletal slice 5 corallites thick, which equates with an approximately 7 mm thick skeletal slice of Pontes lutea, and a corallite wall thickness to calyx dia- meter ratio of 1:2, which is representative of Pontesspp. The growth axes of corallites are parallel to their walls so changing corallite orientation also illustrates the effect of changes in growth axes within skeletal slices. Drawings were made both with and without density banding patterns, and, for a 60" change in corallite orientation, to simulate the effect of changes in skeletal slice thickness and radius of curvature. Density bands were introduced into models by periodically increasing the thickness of individual corahte walls by a factor of 1.5 - represent- ing a 50 % increase in density against actual density vari- ations in coral skeletons of 30 to 40% (Chalker et al. 1985). Growth axes adopted by the coral Galaxea fasci- cularis as a result of phototropic responses were used to construct banding patterns in regions where corallites change their axis of growth on the models (Hidaka & Shi- rasaka 1992). The path length of skeleton perpendicular to the long axis of each drawing (to simulate the path length of a X-ray beam) was measured at 126 equal in- tervals along each drawing and graphed against the ex- pected path length had there been no change in corahte orientation. Within the dynamic range of the film-screen combination used for radiography in this study, photo- graphic density is proportional to the log of the film ex- posure and within that range, photographic density will decrease linearly with increasing path length of skeleton through which an X-ray beam passes. The magnitude of
any variations in path length made from the drawings will reflect the variation that would be expected from densitometric traces made from radiographs or from skeleton directly by gamma densitometry.
RESULTS
Correlation of skeletal characteristics with radiographs
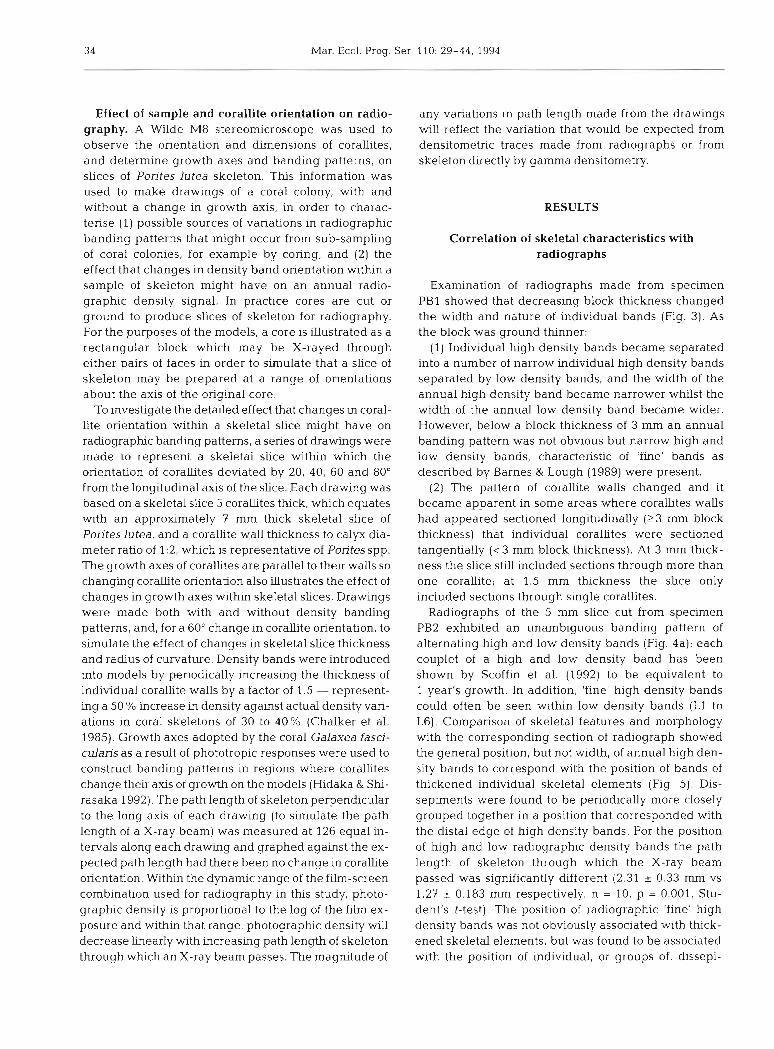
Examination of radiographs made from specimen PB1 showed that decreasing block thickness changed the width and nature of individual bands (Fig. 3). As the block was ground thinner:
(1) Individual high density bands became separated into a number of narrow indvidual high density bands separated by low density bands, and the width of the annual high density band became narrower whilst the width of the annual low density band became wider. However, below a block thickness of 3 mm an annual banding pattern was not obvious but narrow high and iow density bands, characteristic oi .fine' bands as described by Barnes & Lough (1989) were present.
(2) The pattern of corallite walls changed and it became apparent in some areas where corallites walls had appeared sectioned longitudinally (23 mm block thickness) that individual corallites were sectioned tangentially ( c 3 mm block thickness). At 3 mm thick- ness the slice still included sections through more than one corallite; at 1.5 mm thickness the slice only included sections through single corallites.
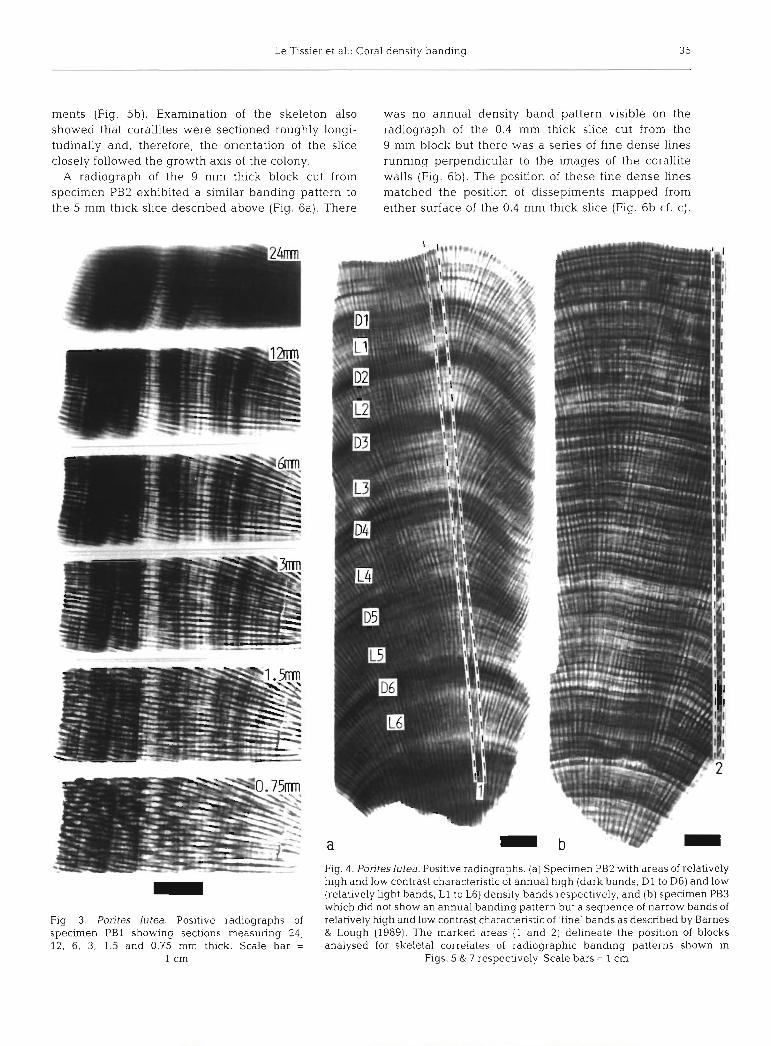
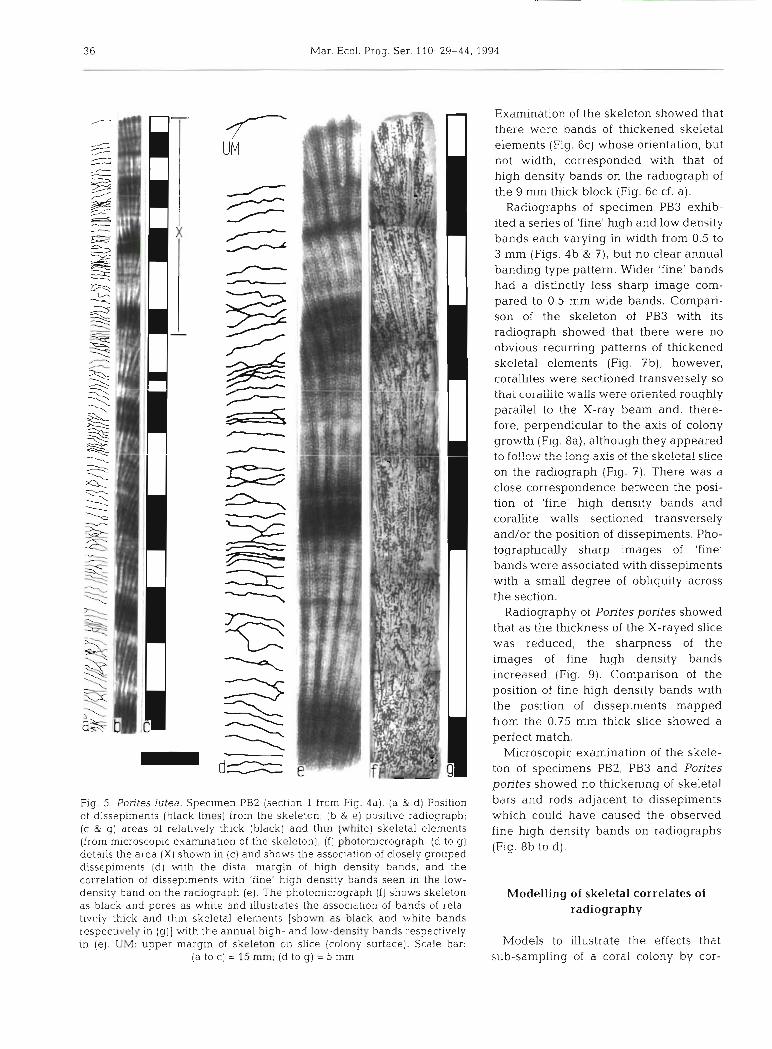
Radiographs of the 5 mm slice cut from specimen PB2 exhibited an unambiguous banding pattern of alternating high and low density bands (Fig. 4a); each couplet of a high and low density band has been shown by Scoffin et al. (1992) to be equivalent to 1 year's growth. In addition, 'fine' high density bands could often be seen within low density bands (L1 to L6). Comparison of skeletal features and morphology with the corresponding section of radiograph showed the general position, but not width, of annual high den- sity bands to correspond with the position of bands of thickened individual skeletal elements (Fig. 5). Dis- sepiments were found to be periodically more closely grouped together in a position that corresponded with the distal edge of high density bands. For the position of high and low radiographic density bands the path length of skeleton through which the X-ray beam passed was significantly different (2.31 + 0.33 mm vs 1.27 * 0.183 mm respectively. n = 10, p = 0.001, Stu- dent's t-test). The position of radiographic 'fine' high density bands was not obviously associated with thick- ened skeletal elements, but was found to be associated with the position of individual, or groups of, dissepi-
Le Tissier et al.: Coral density banding
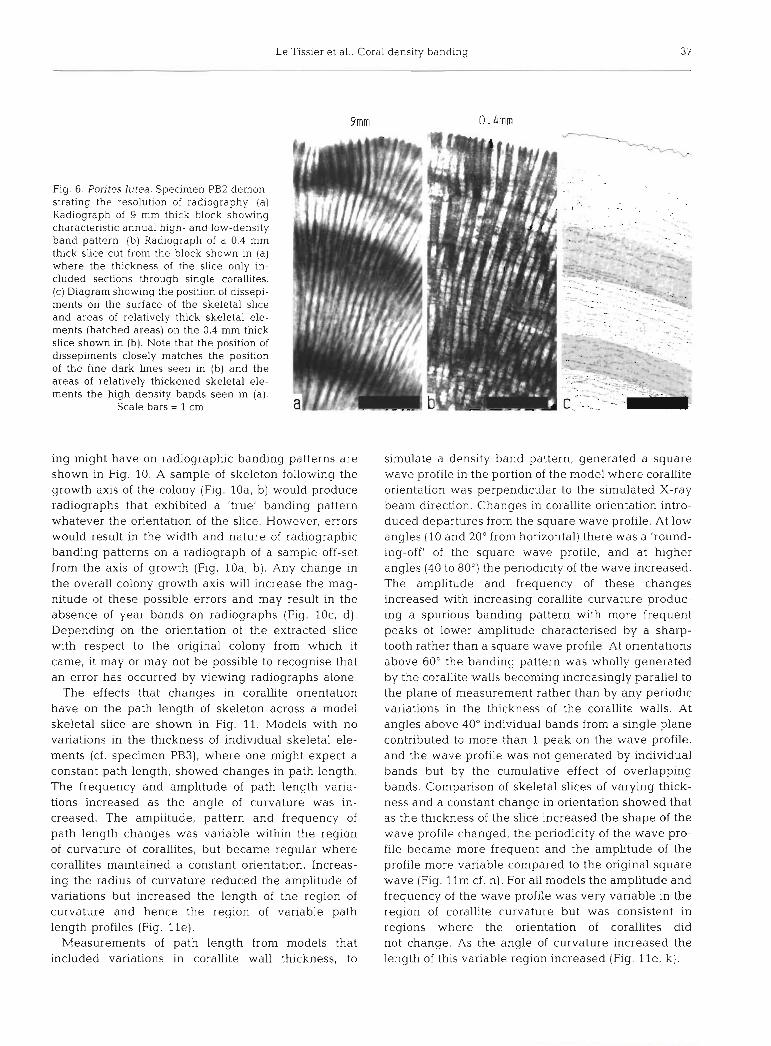
ments (Fig. 5b). Examination of the skeleton also was no annual density band pattern visible on the showed that corallites were sectioned roughly longi- radiograph of the 0.4 mm thick slice cut from the tudinally and, therefore, the orientation of the slice 9 mm block but there was a series of fine dense lines closely followed the growth axis of the colony. running perpendicular to the images of the corallite
A radiograph of the 9 mm thick block cut from walls (Fig. 6b). The position of these fine dense lines specimen PB2 exhibited a similar banding pattern to matched the position of dissepiments mapped from the 5 mm thick slice described above (Fig. 6a). There either surface of the 0.4 mm thick slice (Fig. 6b cf. c).
Fig. 3. Porites lutea. Positive radiographs of specimen PB1 showing sections measuring 24, 12, 6, 3, 1.5 and 0.75 mm thick. Scale bar =
l cm
, ,,>I -Id '1" ' ,77. , ; -
..*- A*.
Fig. 4. Poriteslutea. Positive radiographs. (a] Specimen PB2 with areas of relatively hiqh and low contrast characteristic of annual hiqh (dark bands, D1 to D6) and low (relatively light bands, L1 to L6) density bands r&pectively, and (b) specimen PB3 which did not show an annual banding pattern but a sequence of narrow bands of relatively high and low contrast characteristic of 'fine' bands as described by Barnes & Lough (1989). The marked areas (1 and 2) delineate the position of blocks analysed for skeletal correlates of radiographic banding patterns shown in
Figs. 5 & 7 respectively. Scale bars = 1 cm
3 6 Mar. Ecol Prog. Ser. 110: 29-44, 1994
Fig. 5. Porites lutea. Specimen PB2 (section 1 from Fig. 4a). (a & d) Position of dissepiments (black lines) from the skeleton; (b & e) positive radiograph; (c & g) areas of relatively thick (black) and thin (white) skeletal elements (from microscopic examination of the skeleton), ( f ) photomicrograph. (d to g) details the area ( X ) shown in (c) and shows the association of closely grouped dissepimc:nts (d) with the distal margin of high density bands, and the correlation of dissepiments with 'fine' high density bands seen in the low- density band on the radiograph (e]. The photomicrograph (f) shows skeleton as black and pores as white and illustrates the association of bands of rela- tively thick and thin skeletal elements [shown as black and white bands respectively in (g ) ] with the annual high- and low-density bands respectively in (e) . UM: upper margln of skeleton on slice (colony surface). Scale bar.
(a to c) = 15 mm; (d to g) = 5 mm
Examination of the skeleton showed that there were bands of thickened skeletal elements (Fig. 6c) whose orientation, but not width, corresponded with that of high density bands on the radiograph of the 9 mm thick block (Fig. 6c cf. a).
Radiographs of specimen PB3 exhib- ited a series of 'fine' high and low density bands each varying in width from 0.5 to 3 mm (Figs. 4b & 7), but no clear annual banding type pattern. Wider 'fine' bands had a distinctly less sharp image com- pared to 0.5 mm wide bands. Compari- son of the skeleton of PB3 with its radiograph showed that there were no obvious recurring patterns of thickened skeletal elements (Fig. 7b), however, corallites were sectioned transversely so thai coraiiiie walis W-ere oriented ror;gh!y parallel to the X-ray beam and, there- fore, perpendicular to the axis of colony growth (Fig. 8a), although they appeared to fcllcv: the long axis of the ske!et;! slice on the radiograph (Fig. 7). There was a close correspondence between the posi- tion of 'fine' high density bands and corallite walls sectioned transversely and/or the position of dissepiments. Pho- tographlcally sharp images of 'fine' bands were associated with dissepiments with a small degree of obliquity across the section.
Radiography of Porites pontes showed that as the thickness of the X-rayed slice was reduced, the sharpness of the images of fine high density bands increased (Fig. 9). Comparison of the position of fine high density bands with the position of dissepiments mapped from the 0.75 mm thick slice showed a perfect match.
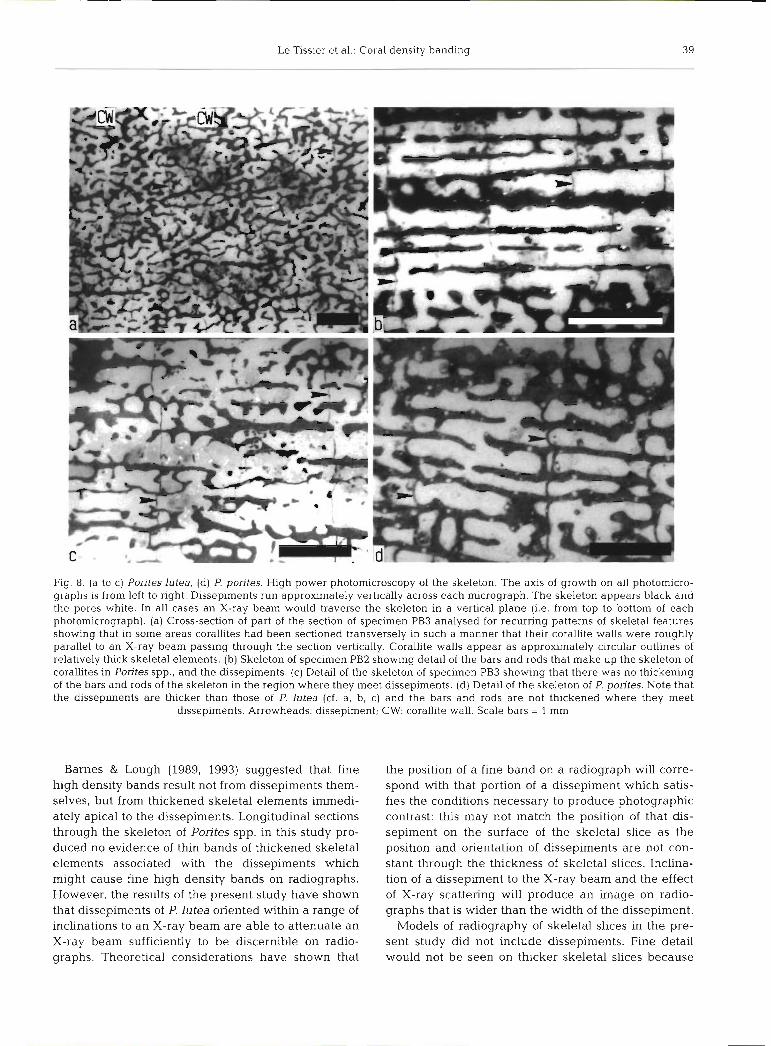
Microscopic examination of the skele- ton of specimens PB2, PB3 and Porites porites showed no thickening of skeletal bars and rods adjacent to dissepiments which could have caused the observed fine high density bands on radiographs (Fig. 8b to d ) .
Modelling of skeletal correlates of radiography
Models to illustrate the effects that sub-sampling of a coral colony by cor-
Le Tissier et al.. Coral density banding
Fig. 6. Porites lutea. Specimen PB2 demon- strating the resolution of radiography. (a) Radiograph of 9 mm thick block showing characteristic annual high- and low-dens~ty band pattern. (b) Radiograph of a 0 4 mm thick slice cut from the block shown in (a) where the thickness of the slice only in- cluded sections through single corallites. (c) Diagram showing the position of dissepi- ments on the surface of the skeletal slice and areas of relatively thick skeletal ele- ments (hatched areas) on the 0.4 mm thick slice shown in (b). Note that the position of dissepiments closely matches the position of the fine dark lines seen in (b) and the areas of relatively thickened skeletal ele- ments the high density bands seen in (a).
Scale bars = 1 cm
ing might have on radiographic banding patterns are shown in Fig. 10. A sample of skeleton following the growth axis of the colony (Fig. 10a, b) would produce radiographs that exhibited a 'true' banding pattern whatever the orientation of the slice. However, errors would result in the width and nature of radiographic banding patterns on a radiograph of a sample off-set from the axis of growth (Fig. 10a, b). Any change in the overall colony growth axis will increase the mag- nitude of these possible errors and may result in the absence of year bands on radiographs (Fig. 10c, d) . Depending on the orientation of the extracted slice with respect to the original colony from which it came, it may or may not be possible to recognise that an error has occurred by viewing radiographs alone.
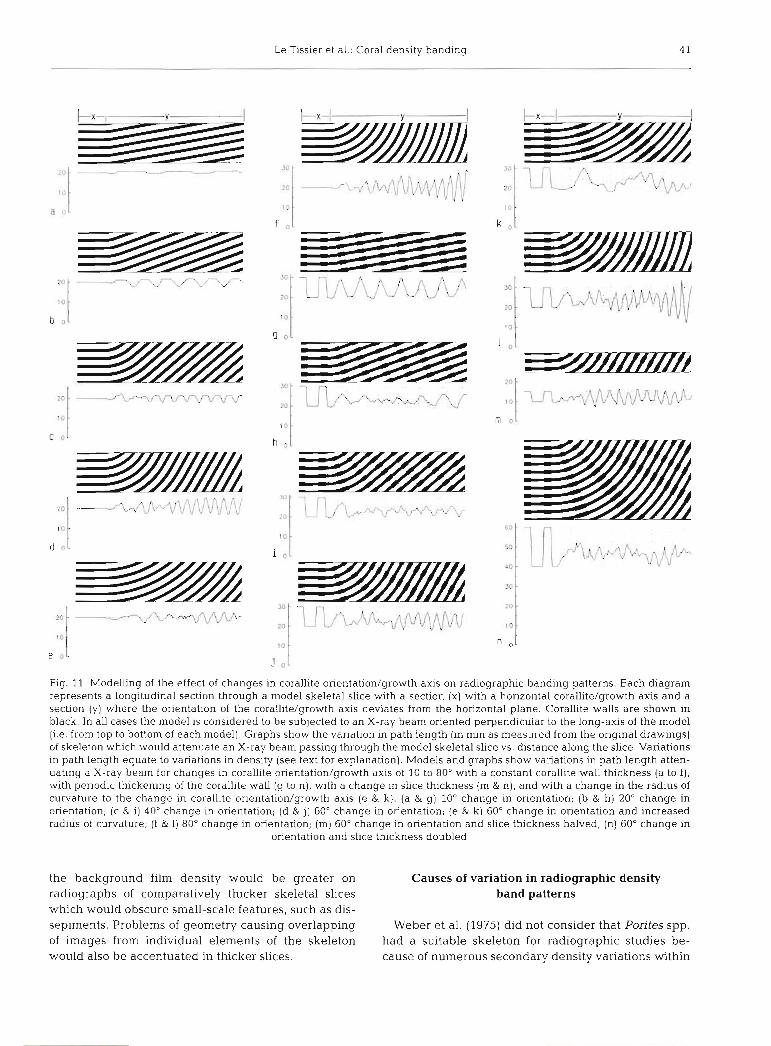
The effects that changes in corallite orientation have on the path length of skeleton across a model skeletal slice are shown in Fig. 11. Models with no variations in the thickness of individual skeletal ele- ments (cf. specimen PB3), where one might expect a constant path length, showed changes in path length. The frequency and amplitude of path length varia- tions increased as the angle of curvature was in- creased. The amplitude, pattern and frequency of path length changes was variable within the region of curvature of corallites, but became regular where corallites maintained a constant orientation. Increas- ing the radius of curvature reduced the amplitude of variations but increased the length of the region of curvature and hence the region of variable path length profiles (Fig. l l e ) .
Measurements of path length from models that included variations in corallite wall thickness, to
simulate a density band pattern, generated a square wave profile in the portion of the model where corallite orientation was perpendicular to the simulated X-ray beam direction. Changes in corallite orientation intro- duced departures from the square wave profile. At low angles (10 and 20" from horizontal) there was a 'round- ing-off' of the square wave profile, and at higher angles (40 to 80") the periodicity of the wave increased. The amplit.ude and frequency of these changes increased with increasing corallite curvature produc- ing a spurious banding pattern with more frequent peaks of lower amplitude characterised by a sharp- tooth rather than a square wave profile. At orientations above 60" the banding pattern was wholly generated by the corallite walls becoming increasingly parallel to the plane of measurement rather than by any periodic variations in the thickness of the corallite walls. At angles above 40" individual bands from a single plane contributed to more than 1 peak on the wave profile, and the wave profile was not generated by individual bands but by the cumulative effect of overlapping bands. Comparison of skeletal slices of varying thick- ness and a constant change in orientation showed that as the thickness of the slice increased the shape of the wave profile changed, the periodicity of the wave pro- file became more frequent and the amplitude of the profile more variable compared to the original square wave (Fig. l l m cf. n). For all models the amplitude and frequency of the wave profile was very variable in the region of corallite curvature but was consistent in regions where the orientation of corallites did not change. As the angle of curvature increased the length of this variable region increased (Fig. l l e , k).
38 Pvlar. Ecol. Prog. Ser. 110: 29-44, 1994
and (3) the nature, and method of extrac- tion, of the growth record in coral skeletons.
Skeletal correlates of density bands
Barnes & Devereux (1988) used tech- niques that distinguished between density variations caused by crystal packing and by skeletal architecture to propose that annual density bands in Porites spp. were gener- ated by changes in the dimensions of indi- vidual skeletal elements. The present study has clearly shown that annual high and low density bands are caused by variations in the thickness of skeletal bars and rods that largely comprise the skeleton of Porites spp. Such variations in the thickness of skeletal elements correspond to vanatlons in the bulk density of the skeleton.
Buddemeier (1974), Buddemeier & Kinzie (1975), Barnes & Lough (1989) and the present study have slluwn Lhdi, as weii as relatively broad annual high and low density band, a finer density banding pattern, consisting of narrow high density bands (- 1 mm wide) and less dense bands (up to 3 mm wide) may be seen on radio- graphs of Porites spp., especially those derived from thinner (<6 mm) slabs. The aluminium foil model (Fig. 2) demonstrated that if 'fine' bands of density variation were not oriented parallel to the X-ray beam their individual X-ray images merge and over- lap, as proposed by Barnes & Lough (1989).
Barnes & Lough (1993) have proposed that radiographic fine bands are generated
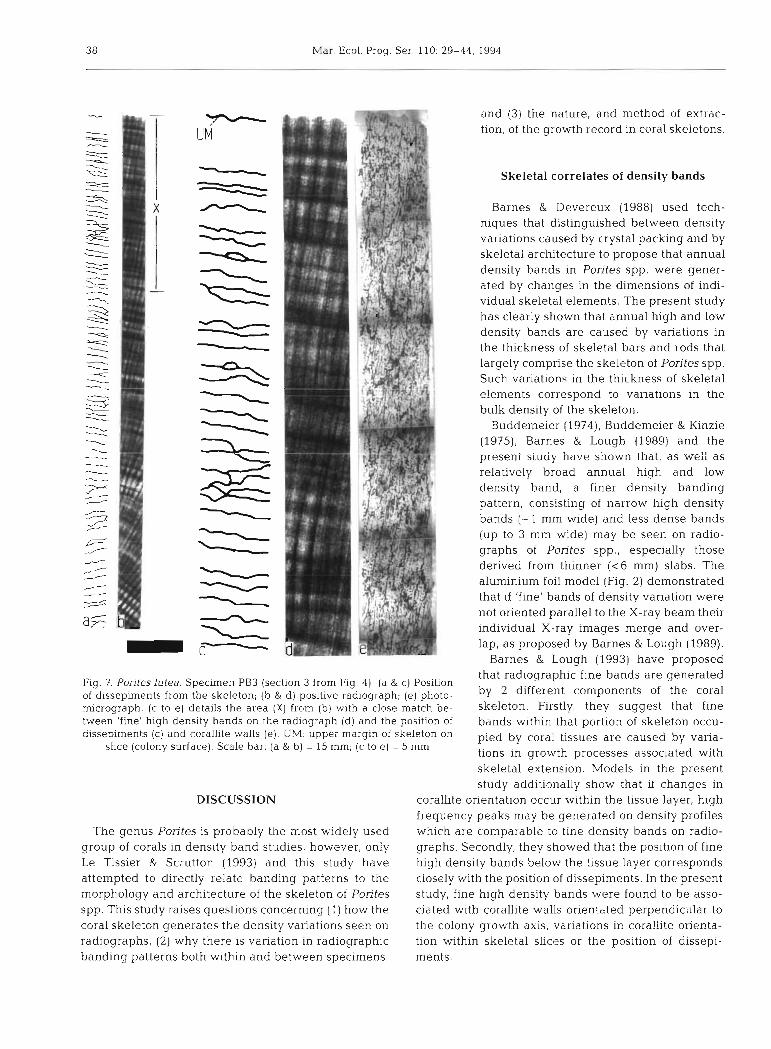
Fig. 7. Porites lutea. Specimen PB3 (section 3 from Fig. 4). (a & c) Position of dissepiments from the skeleton; (b & d) positive radiograph; (e) photo- by 2 different components of the coral micrograph. (c to e ) details the area ( X ) from (b) with a close match be- skeleton. Firstly, they suggest that fine tween 'fine' high denslty bands on the radiograph (d) and the position of bands within that portion of skeleton occu- d~ssepiments (c) and corallite walls (e). UM: upper margln of skeleton on pied by coral tissues are caused by varia-
slice (colony surface). Scale bar: (a & b) = 15 mm; (c to e) = 5 mm tions in growth processes associated with skeletal extension. Models in the present study additionally show that if changes in
DISCUSSION corallite orientation occur within the tissue layer, high frequency peaks may be generated on density profiles
The genus Porites is probably the most widely used which are comparable to fine density bands on radio- group of corals in density band studies, however, only graphs. Secondly, they showed that the position of fine Le Tissier & Scrutton (1993) and this study have high density bands below the tissue layer corresponds attempted to directly relate banding patterns to the closely with the position of dissepiments. In the present morphology and architecture of the skeleton of Porites study, fine high density bands were found to be asso- spp. This study raises questions concerning ( I ) how the ciated with corallite walls orientated perpendicular to coral skeleton generates the density variations seen on the colony growth axis, variations in corallite orienta- radiographs, (2) why there is variation in rad.iographic tion within skeletal slices or the position of dissepi- banding patterns both within and between specimens, ments.
Le Tissier et al.: Coral density banding 39
Fig. 8. (a to c) Porites lutea, (d) P. pontes. High power photomicroscopy of the skeleton. The axis of growth on all photornicro- graphs is from left to right. Dissepiments run approximately vertically across each micrograph. The skeleton appears black and the pores white. In all cases an X-ray beam would traverse the skeleton in a verhcal plane (i.e. from top to bottom of each photomicrograph). (a) Cross-section of part of the section of specimen PB3 analysed for recurring patterns of skeletal features showing that in some areas corallites had been sectioned transversely in such a manner that their corallite walls were roughly parallel to an X-ray beam passing through the section vertically. Corallite walls appear as approximately circular outlines of relatively thick skeletal elements. (b) Skeleton of specimen PB2 showng detail of the bars and rods that make up the skeleton of corallites in Porites spp., and the dissepiments. (c) Detail of the skeleton of specimen PB3 showing that there was no thickening of the bars and rods of the skeleton in the region where they meet dissepiments. (d) Detall of the skeleton of P. porites. Note that the dissepiments are thicker than those of P. lutea (cf. a , b, c) and the bars and rods are not thickened where they meet
dissepiments. Arrowheads: dssepiment; CW: corallite wall. Scale bars = 1 mm
Barnes & Lough (1989, 1993) suggested that fine high density bands result not from dissepiments them- selves, but from thickened skeletal elements immedi- ately apical to the dissepiments. Longitudinal sections through the skeleton of Porites spp. in this study pro- duced no evidence of thin bands of thickened skeletal elements associated with the dissepiments which might cause fine high density bands on radiographs. However, the results of the present study have shown that dissepiments of P. lutea oriented within a range of inclinations to an X-ray beam are able to attenuate an X-ray beam sufficiently to be discernible on radio- graphs. Theoretical considerations have shown that
the position of a fine band on a radiograph will corre- spond with that portion of a dissepiment which satis- fies the conditions necessary to produce photographic contrast: this may not match the position of that dis- sepiment on the surface of the skeletal slice as the position and orientation of dissepiments are not con- stant through the thickness of skeletal slices. Inclina- tion of a dissepiment to the X-ray beam and the effect of X-ray scattering will produce an image on radio- graphs that is wider than the width of the dissepiment.
Models of radiography of skeletal slices in the pre- sent study did not include dissepiments. Fine detail would not be seen on thicker skeletal slices because

40 Mar. Ecol. Prog. Ser. 110: 29-44, 1994
w 'at r Fig. 9. Poritesporites. (a) Radiograph of 3 mm thick slice showing well-defined 'fine' high density bands towards the apex of the slice and blurred banding distally. (b) Radiograph of 1.5 mm thick slice. Note that the apical 'fine' high density bands have a sharpened image and distally 'fine' high density bands are apparent. (c) Radiograph of 0.75 rnm thick slice showing sharp 'fine' high density bands down the whole slice. (d) Position of dissepiments mapped out from the 0.75 mm thick slice showing that they match the position of the 'fine' high density bands seen in (a to c). Hatched area shows the position formerly occupied by coral
tissues. Arrowhead: dissepiment. Scale bars = 1 cm
(ill)
Fig. 10. Models showing the effect of core orientation on banding patterns, (a) Model of a coral colony with a constant axis of growth direction showing the position of cores illus- trated in (b). Core W follows the axis of growth exactly and core Xis offset from the axis of growth. (b) Diagrams showing the banding pattern on radiographs from X-rays passing through front (i) and back (iii) and side (ii) & (iv) faces respectively of cores W and X, The banding pattern on both radio- graphs from core W is essentially the same when X-rayed in either direction. Whereas the curved bands towards the bottom of radiograph (iii) show that core X does not follow the axis of growth, it is not possible from the banding pattern on X-radiograph (iv) to determine the orientation of the axis of growth, (c) Model of a coral colony with a change in the axis of growth showing the position of cores illustrated in (d) . Core Y fol- lows the centre line of the colony exactly and core Z is offset from the centre line. (d) The banding pattern on radiographs of cores Y and Z X-rayed through front (i) and back (iii) faces respectively showing that the cores do not follow the axis of growth of the colony. It is not possible from the banding pattern towards the bottom of radiograph of core Y and Z X-rayed through side faces, (ii & iv), to determine the orientation of the core relative to the colony growth axis, In addition the width of bands on radiographs (ii & iv) become greater as skeletal bands
from the cores are X-rayed obliquely
Le Tissier et al.: Coral density banding 4 1
Fig. 11 Modelling of the effect of changes in corallite orientation/growth axis on radiographic banding patterns. Each diagram represents a longitudinal section through a model skeletal slice with a section (X) with a horizontal corallite/growth axis and a section (y) where the orientation of the corallite/growth axis deviates from the horizontal plane. Corallite walls are shown in black. In all cases the model is considered to be subjected to an X-ray beam oriented perpend~cular to the long-axis of the model (i.e. from top to bottom of each model). Graphs show the variation in path length (in mm as measured from the original drawings) of skeleton which would attenuate an X-ray beam passing through the model skeletal slice vs. distance along the slice. Variations in path length equate to variations in density (see text for explanation). Models and graphs show variations in path length atten- uating a X-ray beam for changes in corallite orientation/growth axis of 10 to 80" with a constant corallite wall thickness (a to f ) , with periodic thickening of the corallite wall (g to n), with a change in slice thickness (m & n), and with a change in the radius of curvature to the change in corallite orientation/growth axis (e & k). (a & g) 10" change in orientation; (b & h) 20" change in onentation; (c & i) 40" change in orientation; (d & j ) 60" change in orientation; (e & k) 60" change in orientation and increased radius of curvature; (f & 1) 80" change in orientation; (m) 60" change in orientation and slice thickness halved; (n) 60" change in
orientation and slice thickness doubled
the background film density would be greater on Causes of variation in radiographic density radiographs of comparatively thicker skeletal slices band patterns which would obscure small-scale features, such as dis- sepiments. Problems of geometry causing overlapping Weber et al. (1975) did not consider that Pontes spp. of images from individual elements of the skeleton had a suitable skeleton for radiographic studies be- would also be accentuated in thicker slices. cause of numerous secondary density variations within
42 Mar. Ecol. Prog. Ser
the annual cycle of banding on radiographs. In con- trast, Barnes & Lough (1990) proposed that Porites was a suitable genus for radiography because the homoge- neous appearance of the skeleton meant that the con- tribution of skeletal architecture to density profiles was less than in other genera. However, Lough & Barnes (1992) found that density variations were such that there was no common information in density or growth data from corals from the same reef and the banding pattern was not equally displayed within or between slices from colonies from the same or different reefs. Multiple peaks in density profiles obtained from mod- els (Barnes et al. 1989, Barnes & Lough 1990, present study) or from skeletal slices (Lough & Barnes 1992) suggest chronologies established from radiography are more subjective than indicated by the literature.
When compared with the skeleton of Porites spp., the models of skeletal slices presented in Barnes et al. (1389), Barnes & Lough (1990) and this study are a gross simplification and do not include much of the detail of the skeleton. However, such models can pro- vide an explanation for much of the variation that is seen on published radiographs of coral skeleioii. Except for Schneider & Smith (1982), radiographic banding patterns have been described in terms of a square wave profile (Barnes et al. 1989). Analysis of coral skeletons and models in this study have shown that periodic variations in the thickness of skeletal elements do generate density bands on radiographs. However, Barnes et al. (1989) and Barnes & Lough (1990) and the present study have shown that if skele- tal slices are not cut exactly parallel to the coral growth axis, or the angle of the X-ray beam is not parallel to the skeletal banding pattern, a square-wave density profile (annual density cycle) may become masked (specimen PB2 cf. PB3). Changes in corallite orienta- tion may distort density profiles and banding patterns by generating secondary density variations. In addi- tion, higher frequency peaks, equivalent to fine bands, may be introduced into the banding pattern. Although variations in bulk density (relative thickness of skeletal elements) are responsible for the annual density band pattern, the path length of skeleton attenuating an X- ray beam is responsible for the fine detail apparent on radiographs, and may generate bands attributable to skeletal architecture which do not reflect any growth record.
It has been recognised that the appearance of radio- graphs will depend on the X-ray output, film type and sample type (Dodge & Vaisnys 1980). Indeed. even if slices or cores cut from a coral colony pass close to the colony origin distortion of the banding pattern is likely because there will, be increasing curvature of bands through the slice thickness towards the origin (Dodge & Vaisnys 1980, Lough & Barnes 1990c, 1.992, this
study). Lough & Barnes (1990b) proposed increasing the thickness of the skeletal slice s tuded in order to average out features which distort the banding pat- tern. This study has shown that the pattern of density banding from relatively thick slices does not always correspond to the pattern found from thinner slices. Lough & Barnes (1990~) showed that fluorescent bands had a maximum displacement of 10 mm and an aver- age displacement of 2 mm across a 6 to 7 mm thick slice, corresponding to a change in orientation of 35 and 12" respectively. Thin slices taken from coral blocks in the present study have shown that corallite orientation can be almost parallel to the X-ray beam even though on radiographs images of corallites appear to be perpendicular. Lough & Barnes (1992) suggested that large colonies of Porites spp. do not have a single plane where corallites maintain a con- stant orientation so that radiography or densitometry wouid not have a constant precision across a skeletal slice. Problems associated with the 3-dimensional geometry of bands through skeletal slices will affect the apparent width of bands causing blurring of the olensiiy paiiern proiiie introciucir~g errors in baiiny cji banding patterns (e.g. Barnes & Lough 1989, 1990, Lough & Barnes 1990a), and in measurements of skele- tal bulk density (e.g. Chalker et al. 1985, Scoffin et al. 1992). Such factors could result in samples taken from bands for analysis including material from adjacent bands (Lough & Barnes 1 9 9 0 ~ ) .
For radiographic banding patterns to present an accurate picture of coral growth it is important that corallites are sectioned longitudinally in order that the growth axis and variations in growth features are ori- ented perpendicular to the X-ray beam. This is rarely possible. Models presented here show that variations in corallite orientation can generate banding patterns which do not reflect variations in skeletal features along a growth axis. The sensitivity of our X-ray sys- tem suggested that small changes in the path length of skeleton attenuating an X-ray beam could generate variations in contrast on radiographs that were not part of any growth pattern. Clearly the 3-dimensional geo- metry, and orientation to the X-ray beam, of broad areas of skeleton and individual skeletal structures will have a profound impact on the nature of the banding pattern visible on radiographs, drawing into question the validity of radiography as a means of investigating growth patterns in coral skeletons.
Nature, and method of extraction, of the growth record in coral skeletons
Results presented here show that skeletons of massive Porites spp. contain a growth record consist-
Le Tissier et al.: Coral density banding
ing of periodic thickening and thinning of skeletal elements and closer spacing of dissepiments. Such a growth record was shown by specimen PB2 where the orientation of the skeletal slice closely followed the growth axis of the colony. In contrast, specimen PB3 did not exhibit a growth record, or an annual radio- graphic banding pattern, because the orientation of the slice did not follow the growth axis of the colony. A 2-dimensional analysis of the skeleton using visual examination of polished sections of embedded skele- ton can resolve, in great detail, incremental growth patterns for both the colony and individual corallites. Such a method of analysis can also differentiate between growth patterns determined by variations in linear extension (spacing of skeletal elements) and calcification (the thickness of skeletal elements). A further advantage of using 2-dimensional surfaces to determine growth patterns is that measurement of growth increments can be corrected for changes in corallite orientation using calculations described by Goreau (1977).
Studies using cyclical variations in skeletal features to illustrate growth patterns in corals are not new: studies on fossil corals have used thin sections of skele- ton to illustrate density banding (Scrutton & Powell 1980, Ali 1984). Studies by Wells, Ma and others (see Scrutton 1978 for review) used incremental growth patterns of both internal and external features of fossil and contemporary coral skeletons to determine chronologies of coral growth which were linked to the environment in which corals grew; these studies were principally concerned with reconstructing palaeocli- matic variables and the history of the Earth's rotation and the Earth-Moon system. Indeed, internal growth patterns in 6 genera of contemporary scleractinian corals were described by Ma (1934a, b) as resulting from the alternation of spacing and periodic thickening of skeletal elements.
Although such analysis has the disadvantage of being time consuming, both in the preparation of specimens and extraction of data, we believe its advantages hold considerable scope for understanding the biological processes associated with growth pat- terns and realising the potential of coral skeletons as proxy records of growth and the environment.
Acknowledgements. The authors thank Mrs Milton and the staff of the Radiography Department, Royal Victoria Infir- mary, Newcastle upon Tyne, for their help with all aspects of the radiography, and Rob Beckworth of the Medical Physics Department, Royal Victoria Infirmary, for construction of the calcium carbonate wedge and aluminium foil model. Terry Scoffin and Sandy Tudhope provided many useful comments on the manuscript. This work was funded by a grant from the Leverhulme Trust.
LITERATURE CITED
Ali. 0. E. (1984). Sclerochronology and carbonate production in some upper Jurassic reef corals. Palaeontology 27: 537-548
Barnes, D. J., Devereux. M. J . (1988). Variations in skeletal architecture associated with density banding in the hard coral Porites. J . exp. mar. Biol. Ecol. 121: 37-54
Barnes, D. J. , Lough, J . M. (1989). The nature of skeletal density banding in scleractinian corals: fine banding and seasonal patterns. J . exp. mar. Biol. Ecol. 126: 119-134
Barnes, D. J., Lough, J . M. (1990). Computer simulations showing the likely effects of calix architecture and other factors on retrieval of density information from coral skele- tons. J. exp. mar. Biol. Ecol. 137: 141-164
Barnes, D. J., Lough, J. M. (1993). On the nature and causes of density banding in massive coral skeletons. J . exp. mar. Biol. Ecol. 167: 91-108
Barnes, D. J., Lough, J. M., Tobin, B. J. (1989). Density measurements and the interpretation of X-radiographic images of slices of skeleton from the colonial hard coral Porites. J . exp. mar. Biol. Ecol. 131: 45-60
Brown, B. E., Le Tissier, M., Howard, L. S., Charuchinda, M., Jackson, J . A. (1986). Asynchronous deposition of dense skeletal bands in Porites lutea. Mar. Biol. 93: 83-89
Buddemeier. R. W. (1974). Environmental controls over annual and lunar monthly cycles in hermatypic coral cal- cification. Proc. 2nd int. coral Reef Symp. 2: 259-267
Buddemeier, R. W., IOnzie, R. A. (1975). The chronometric reliability of contemporary corals. In: Rosenberg. G. D., Runcorn, S. K. (eds.) Growth rhythms and the history of the earth's rotation. John Wiley & Sons, London, p. 135-147
Buddemeier. R. W., Maragos, J. E., Knutson, D. W. (1974). Radiographic studies of reef coral exoskeleton: rates and patterns of coral growth. J . exp, mar. Biol. Ecol. 14: 179-200
Chalker, B. E., Barnes, D. J., Isdale, P. J . (1985). Calibration of X-ray densitometry for the measurement of skeletal density. Coral Reefs 9: 11 -23
Dodge, R. E., Szmant, A. M, , Garcia, R., Swart, P. K., Forester, A.. Leder, J . J . (in press). Skeletal structural basis of density banding in the reef coral Montastrea annulans. Proc. 7th int. coral Reef Symp.
Dodge, R. E., Vaisnys, J . R. (1980). Skeletal growth chronolo- gies of recent and fossil corals. In: Rhoads, D. C., Lutz, R. A. (eds.) Skeletal growth of aquatic organisms. Plenum Press, New York, p. 493-517
Goreau, T J. (1977). Coral skeletal chemistry: physiological and environmental regulation of stable isotopes and trace metals in Montastrea annularis. Proc. R. Soc. Lond. B 196: 291-315
Hidaka, M., Shiraska, S. (1992). Mechanism of phototropism in young corallites of the coral Galaxea fascicularis (L.). J. exp. mar. Biol. Ecol. 157: 69-78
Hudson, J . H. (1981). Growth rates in Montastrea annulans: a record of environmental change in Key Largo Coral Reef Marine Sanctuary, Florida. Bull. mar. Sci. 31: 444-459
Hudson, J. H., Shinn, E. A., Halley, R. B., Lidz, B. (1976). Sclerochronology: a tool for interpreting past environ- ments. Geology 4: 361-364
Knutson, D. W., Buddemeier, R. W., Smith, S. V. (1972). Coral chronologies: seasonal growth bands in reef corals. Sci- ence 177: 270-272
Le Tissier, M. D'A. A., Scrutton, C. T. (1993). A review of den- sity banding in Recent and fossil corals. Cour. Forsch.-Inst. Senckenberg 164: 55-62
44 Mar. Ecol. Prog. Ser. 110: 29-44, 1994
Lough, J. M., Barnes, D. J (1990a). Possible relationships between environmental variables and skeletal dens~ty in a coral colony from the central Great Barrier Reef. J. exp. mar. Biol. Ecol. 134: 221-241
Lough, J. M., Barnes, D. J. (1990b). Intra-annual timing of density band formation of Pontes coral from the central Great Barrier Reef. J . exp. mar Biol. Ecol. 135: 35-57
Lough, J. M., Barnes, D. J . (1990~) . Measurement of density in slices of coral skeleton: effect of densitorneter beam diameter. J. exp. mar. Biol. Ecol. 143: 91-99
Lough, J . M., Barnes, D. J. (1992). Comparisons of skeletal density in Porites from the central Great Barrier Reef. J. exp. mar. Biol. Ecol. 155: 1-25
Ma, T. Y. H. (1934a). On the seasonal change of growth in a reef coral, Favia speciosa (Dana), and the water- temperature of the Japanese sea during the latest geo- logical tlmes. Proc. Imp. Akad. Tokyo 10: 353-356
Ma, T. Y H. (1934b). On the growth rate of reef corals and the sea water temperature in the Japanese Islands during the latest geological times. Sci. Rep. TBhoku Imp. Univ. (Ser. 2. Geol.) 16: 166-189
Macintyre, I. G., Smith, S. V. (1974). X-radiographic studies of skeletai development In coral colonies Proc. 2nd int. coral
This article was submitted to the ed~tor
Reef Symp. 2: 277-287 Schneider, R. C., Smith, S. V. (1982). Skeletal Sr content and
density in Porites spp. in relation to environmental factors. Mar. Biol. 66: 121-131
Scoffin. T. P,, Tudhope. A. W.. Brown, B. E., Chansang, H., Cheeney, R. F. (1992). Patterns and possible environmen- tal controls of skeletogenesis of Pontes lutea, South Thai- land. Coral Reefs 11. 1-11
Scrutton, C. T (1978). Periodic growth features in fossil organisms and the length of the day and month. In: Brosche, P,, Sundermann, J. (eds.) Tidal friction and the earth's rotation. Springer-Verlag, Berlin, p. 154-196
Scrutton, C. T., Powell, J. H. (1980). Periodic development of dirnetrism in some favositid corals. Acta palaeont. pol. 25: 477-491
Weber, J. N., White, E. W., Weber, P. H. (1975). Correlation of denslty bandlng in coral skeletons with environmental parameters: the basis for interpretation of chronological records preserved in the coralla of corals. Paleobiology 1: 137-149
Wellington, G. M, , Glynn, P. W. (1983). Environmental influ- ences on skeletal banding in eastern Pacific (Panama) corals. Coral Reefs 1: 215-222
Manuscript first received: May 5, 1993 Revised version accepted: April l 1, 1994