sketching bode magnitude and phase plots - drexel … · sketching bode magnitude and phase plots...
TRANSCRIPT
Sketching Bode Magnitude and Phase Plots
© Copyright 2012, Paul Oh
MEM 639 – Real-time Microcomputer Controls 1
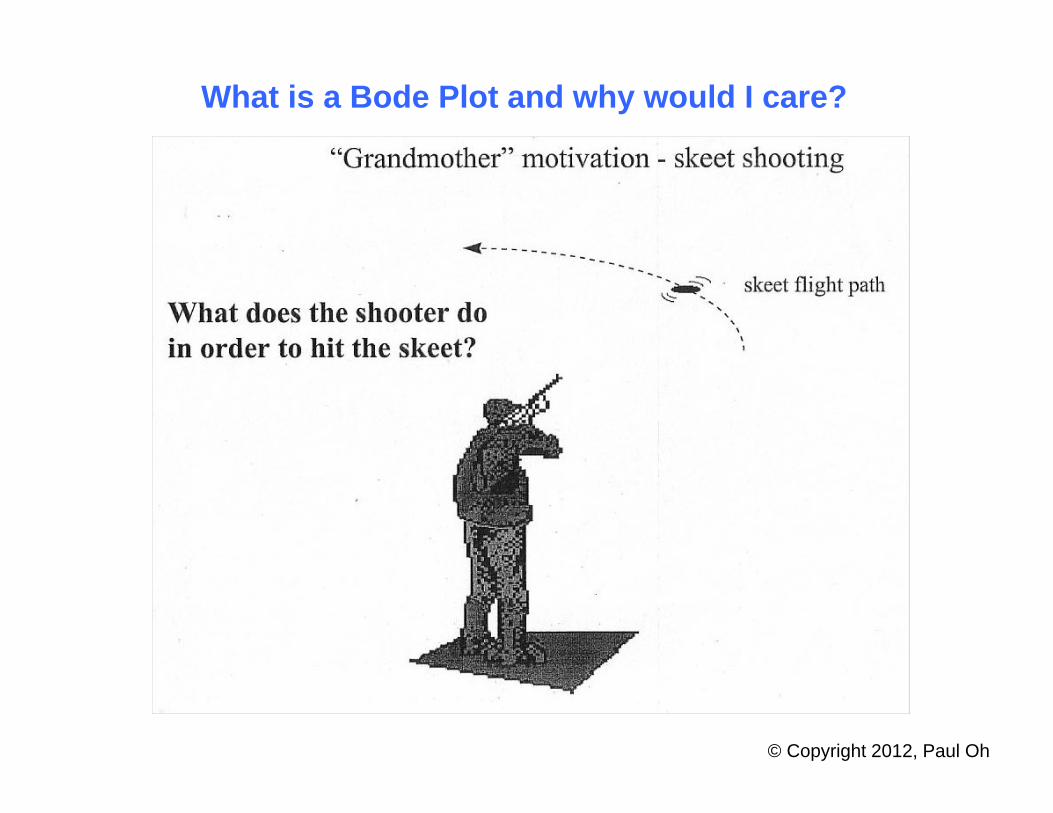
What is a Bode Plot and why would I care?
© Copyright 2012, Paul Oh
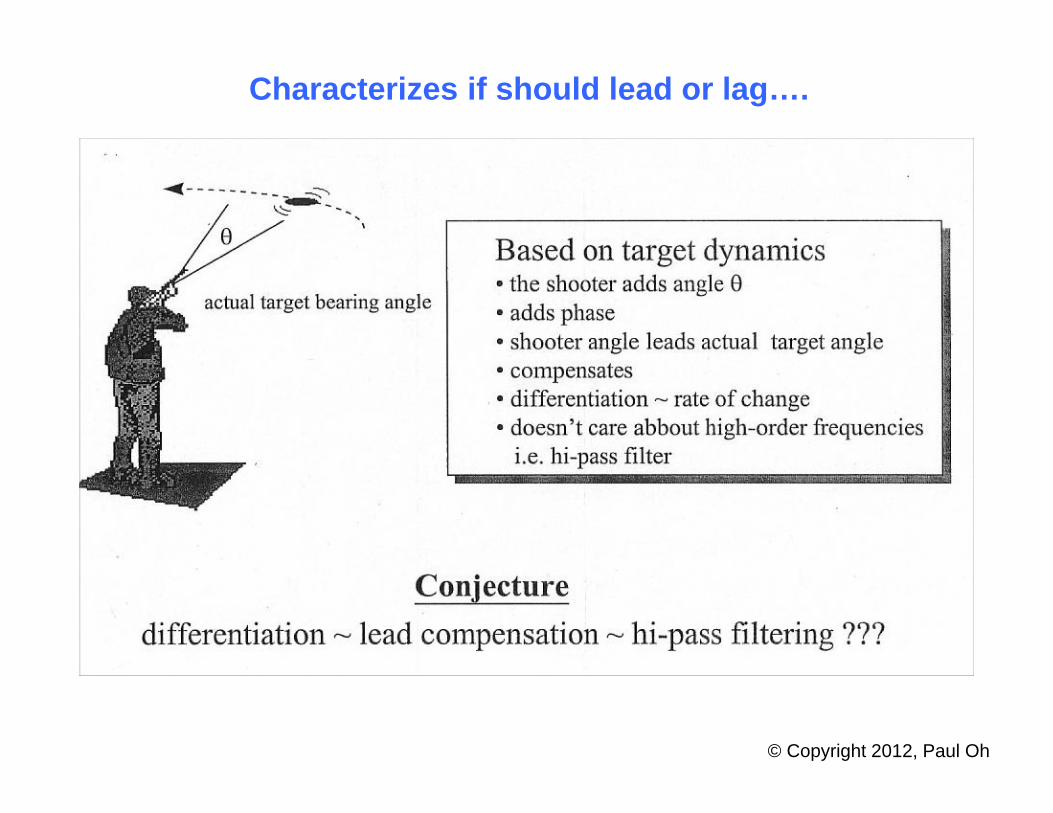
Characterizes if should lead or lag….
© Copyright 2012, Paul Oh
© Copyright 2012, Paul Oh
5
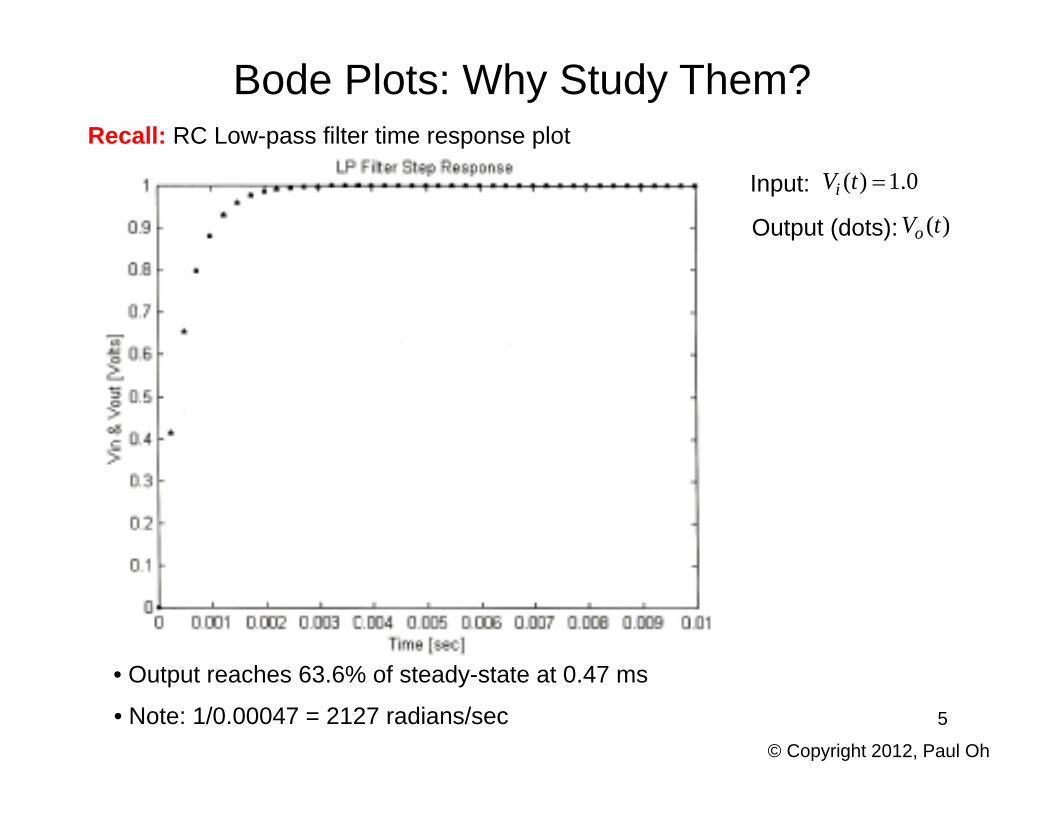
Bode Plots: Why Study Them?
Input: 0.1)( tVi
Output (dots): )(tVo
• Output reaches 63.6% of steady-state at 0.47 ms
• Note: 1/0.00047 = 2127 radians/sec
Recall: RC Low-pass filter time response plot
© Copyright 2012, Paul Oh
6
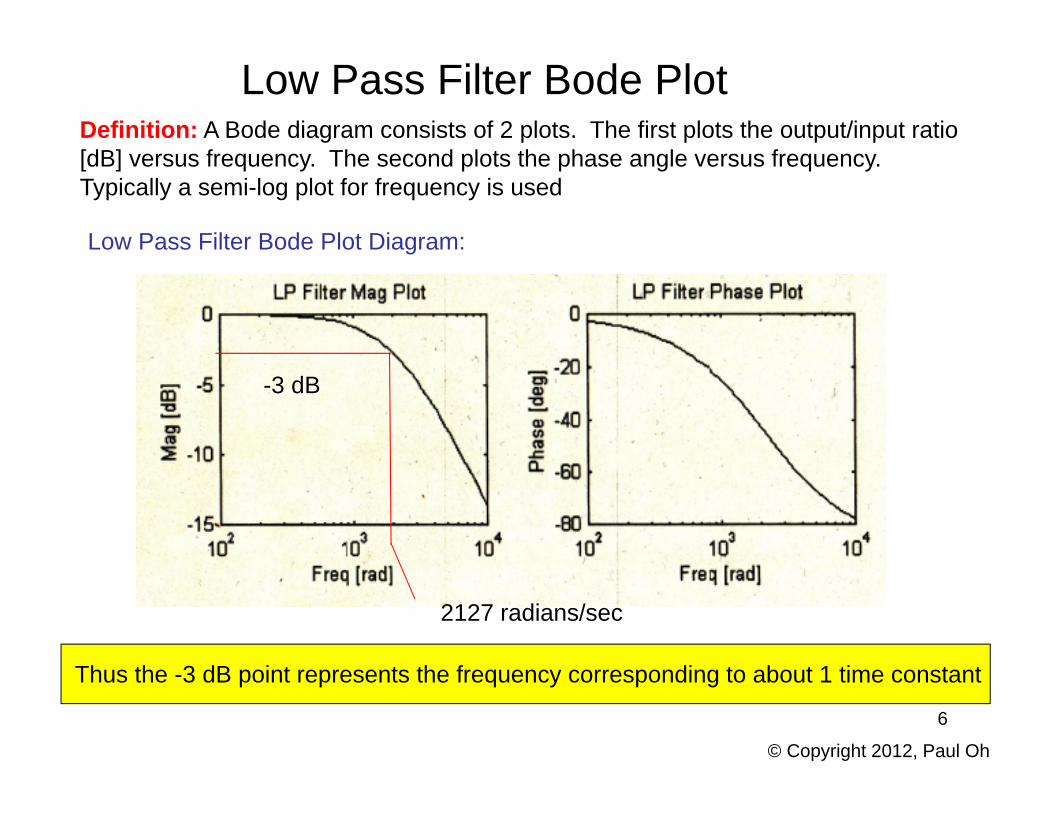
Low Pass Filter Bode PlotDefinition: A Bode diagram consists of 2 plots. The first plots the output/input ratio[dB] versus frequency. The second plots the phase angle versus frequency.Typically a semi-log plot for frequency is used
Low Pass Filter Bode Plot Diagram:
-3 dB
2127 radians/sec
Thus the -3 dB point represents the frequency corresponding to about 1 time constant
© Copyright 2012, Paul Oh
7
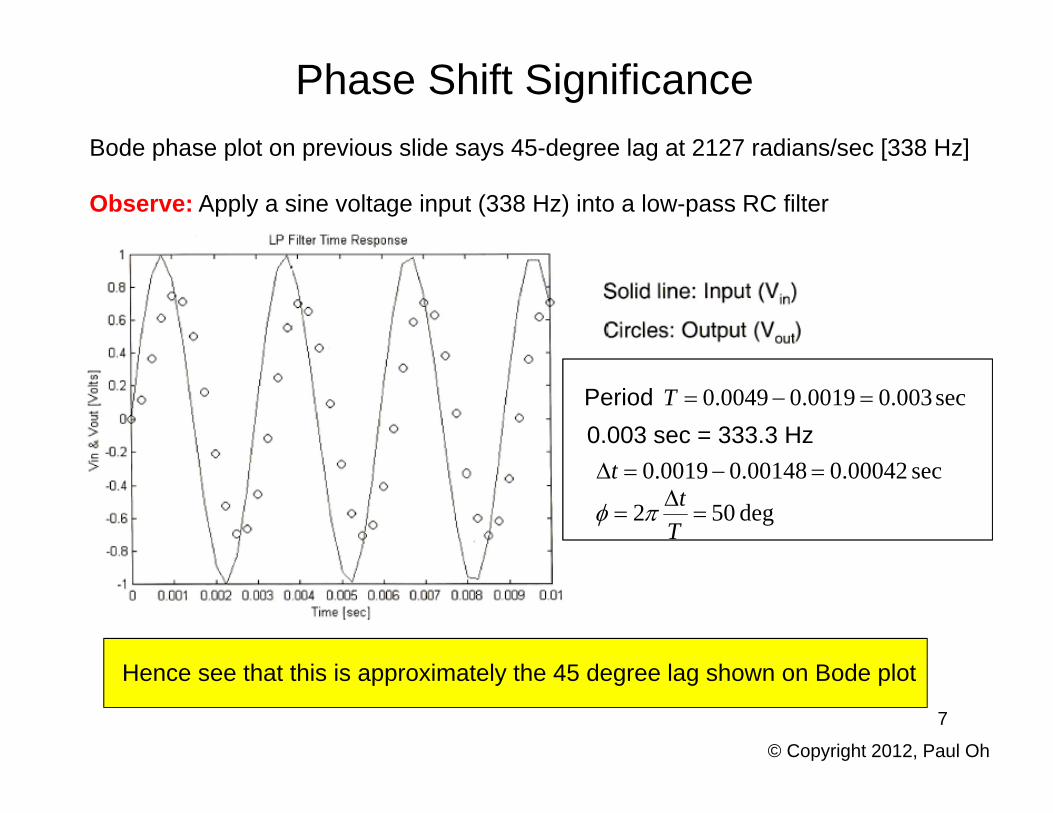
Phase Shift Significance
Observe: Apply a sine voltage input (338 Hz) into a low-pass RC filter
Hence see that this is approximately the 45 degree lag shown on Bode plot
Bode phase plot on previous slide says 45-degree lag at 2127 radians/sec [338 Hz]
Period sec003.00019.00049.0 T0.003 sec = 333.3 Hz
sec00042.000148.00019.0 t
deg 502
Tt
© Copyright 2012, Paul Oh
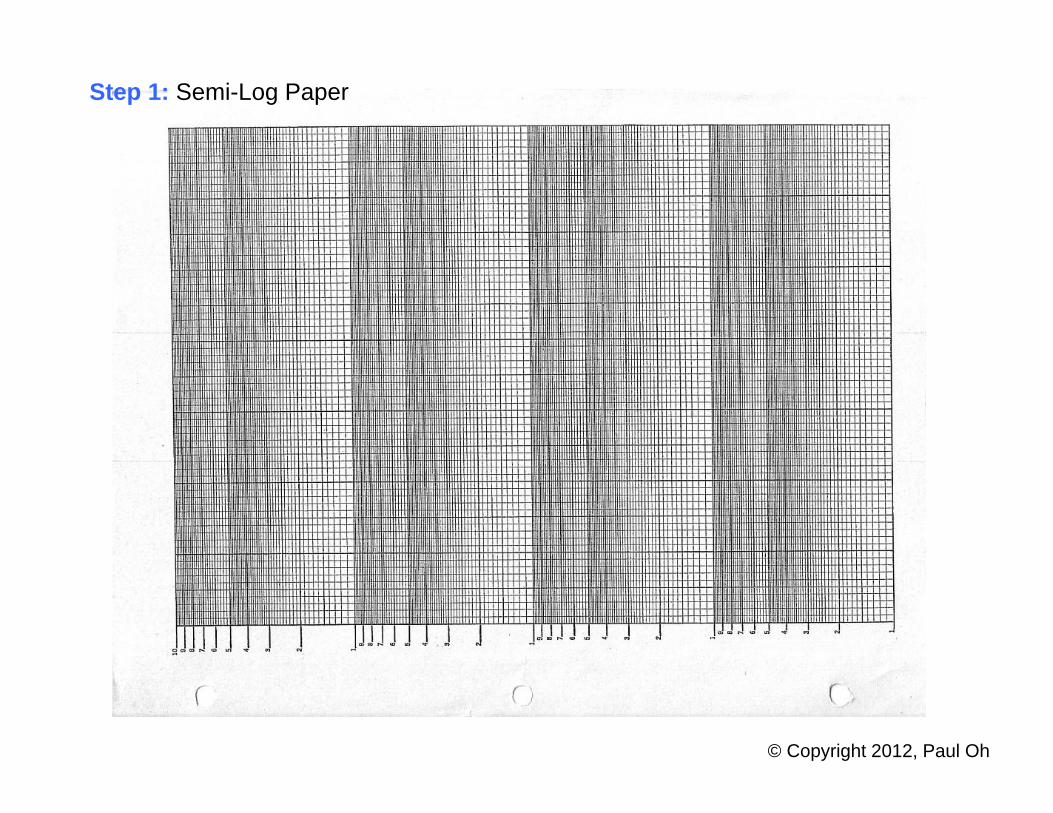
Step 1: Semi-Log Paper
© Copyright 2012, Paul Oh
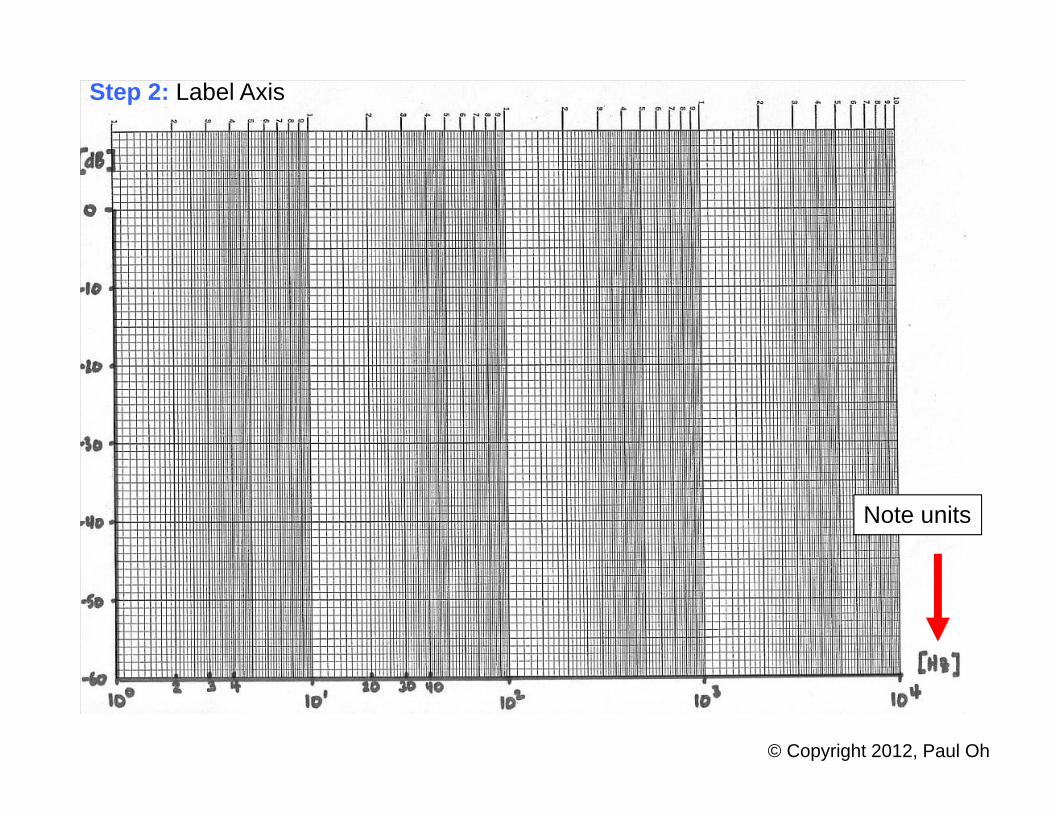
Step 2: Label Axis
Note units
© Copyright 2012, Paul Oh
1
2
4
3
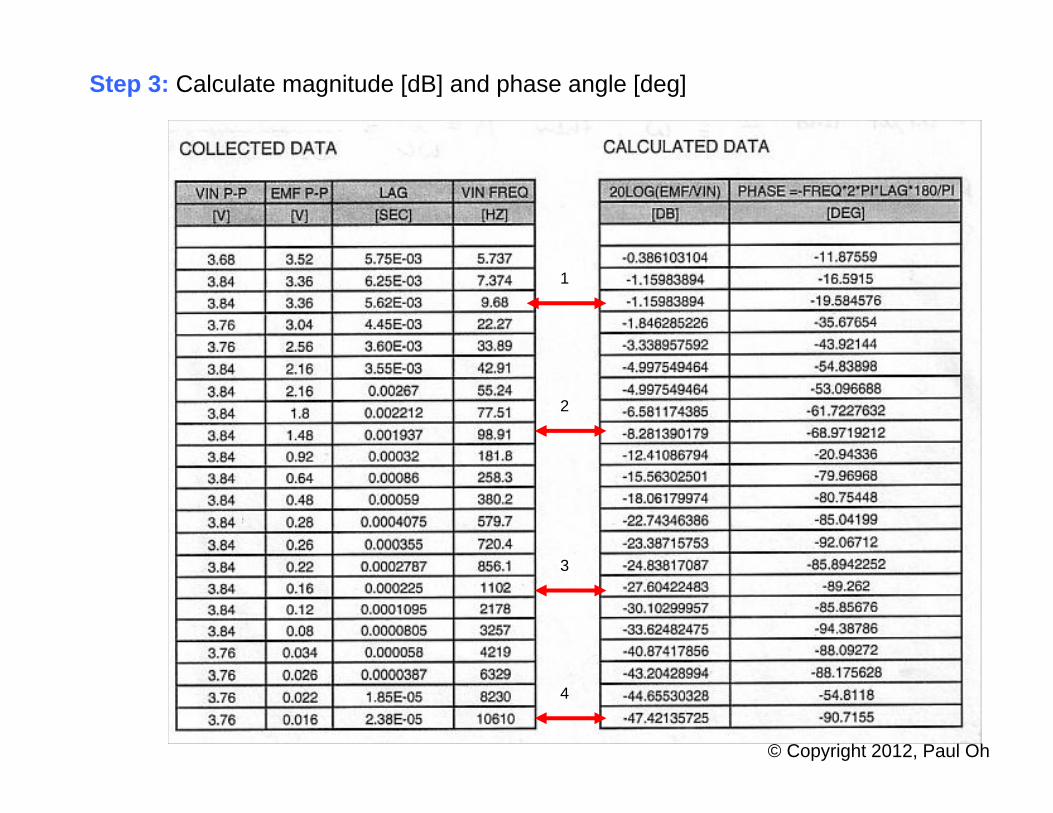
Step 3: Calculate magnitude [dB] and phase angle [deg]
© Copyright 2012, Paul Oh
1
2
3
4
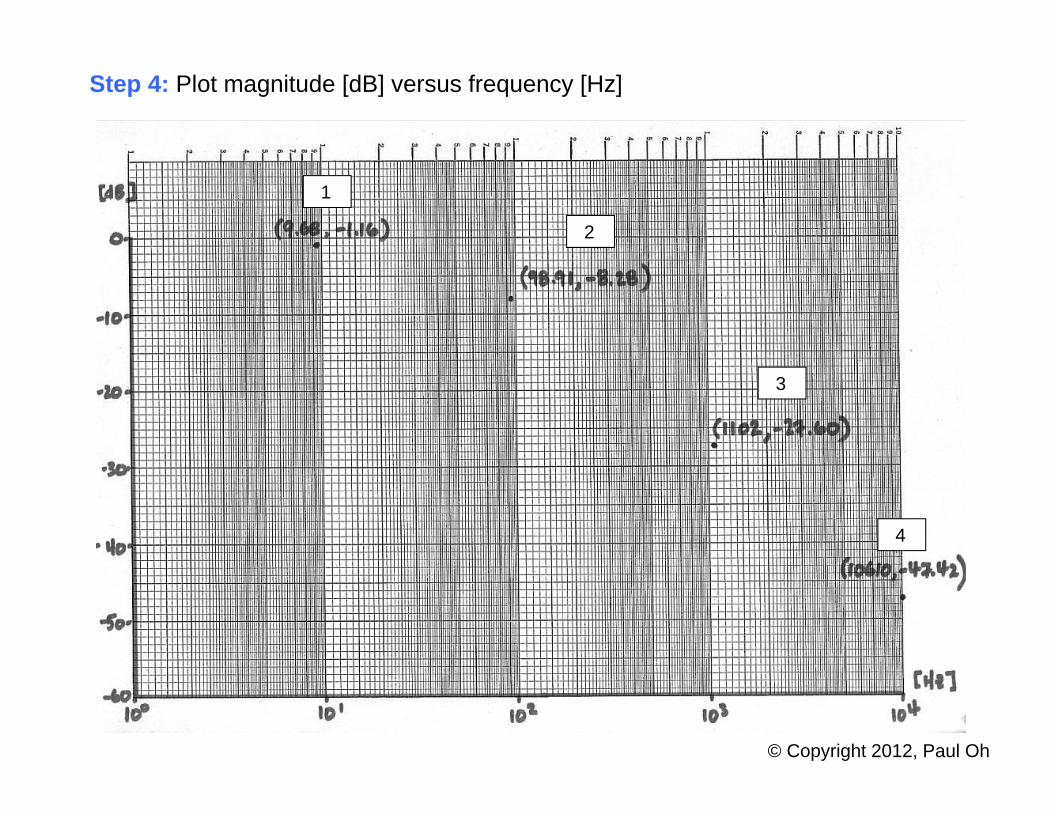
Step 4: Plot magnitude [dB] versus frequency [Hz]
© Copyright 2012, Paul Oh
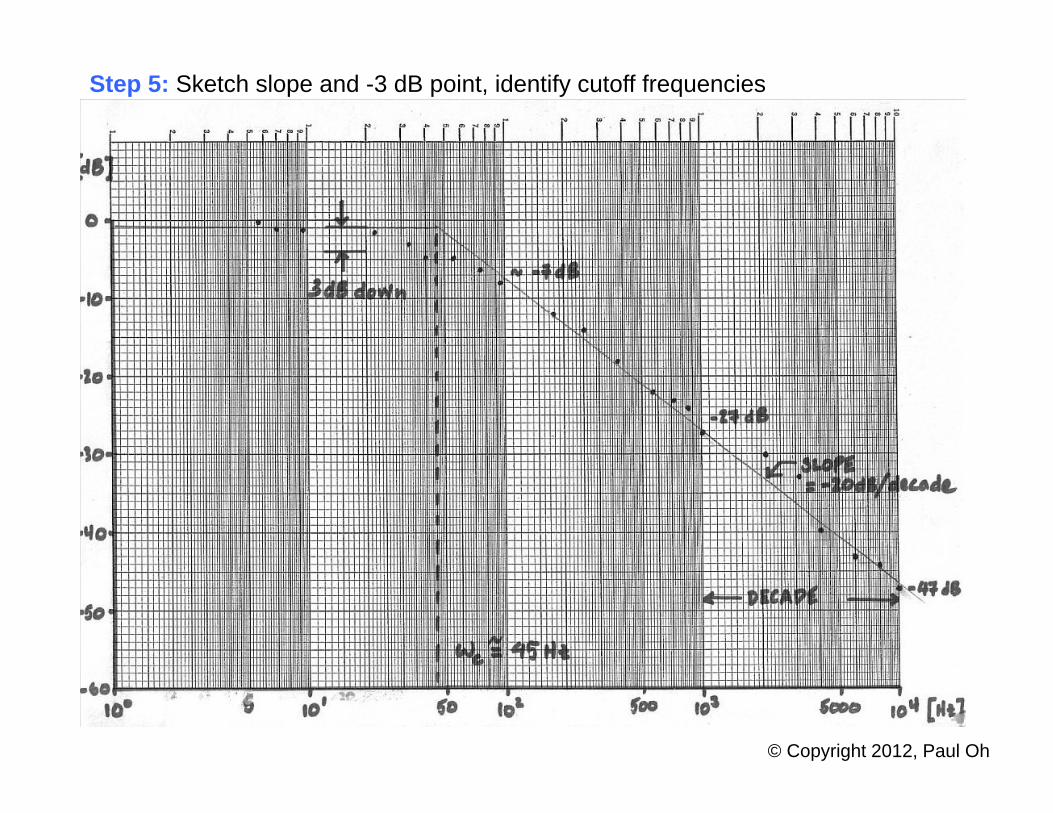
Step 5: Sketch slope and -3 dB point, identify cutoff frequencies
© Copyright 2012, Paul Oh
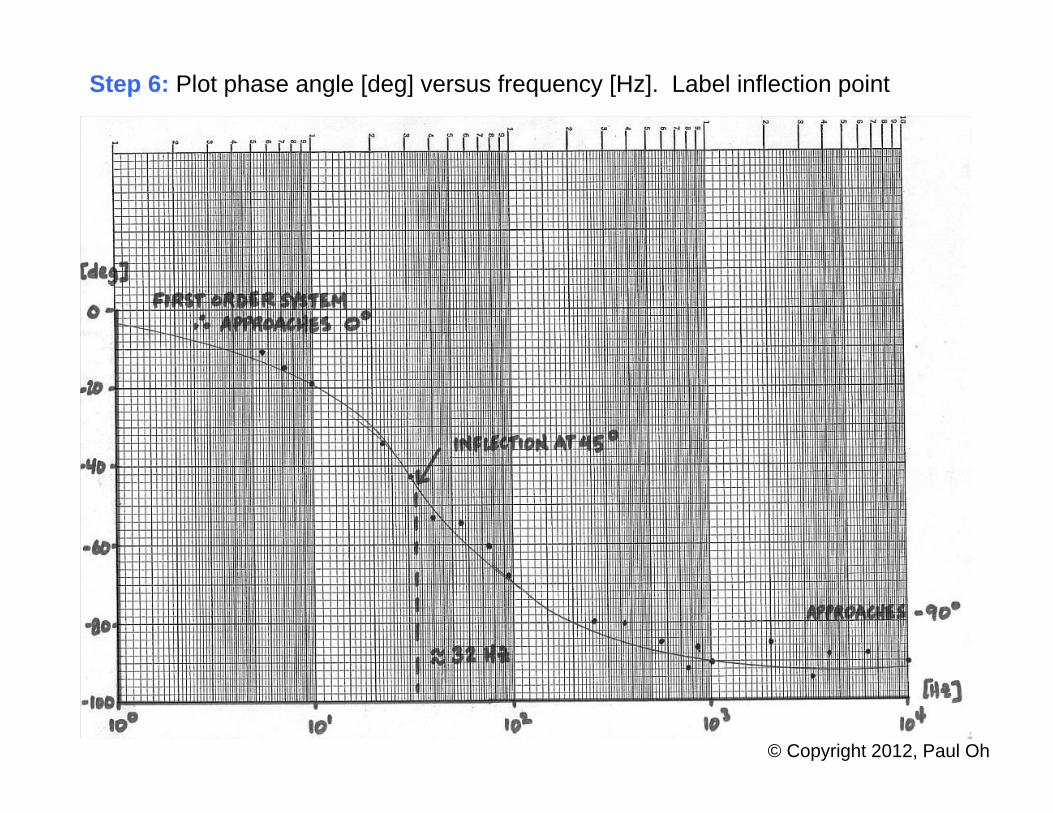
Step 6: Plot phase angle [deg] versus frequency [Hz]. Label inflection point
© Copyright 2012, Paul Oh
14
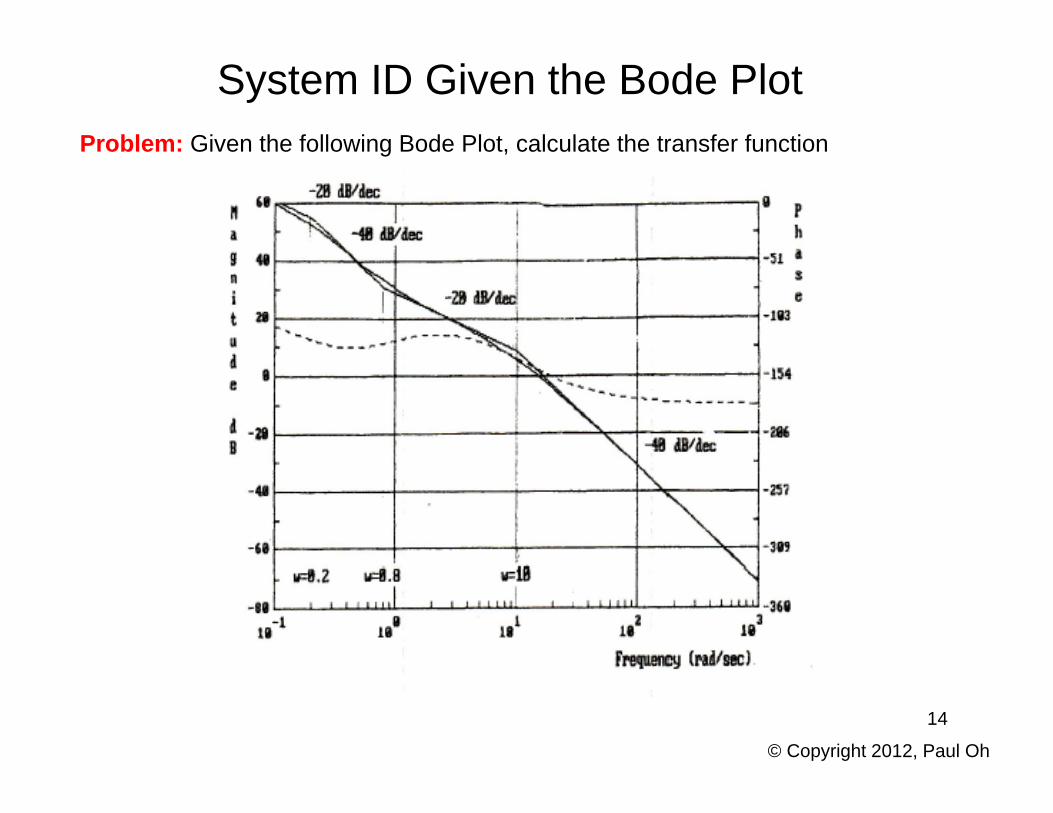
System ID Given the Bode PlotProblem: Given the following Bode Plot, calculate the transfer function
© Copyright 2012, Paul Oh
15
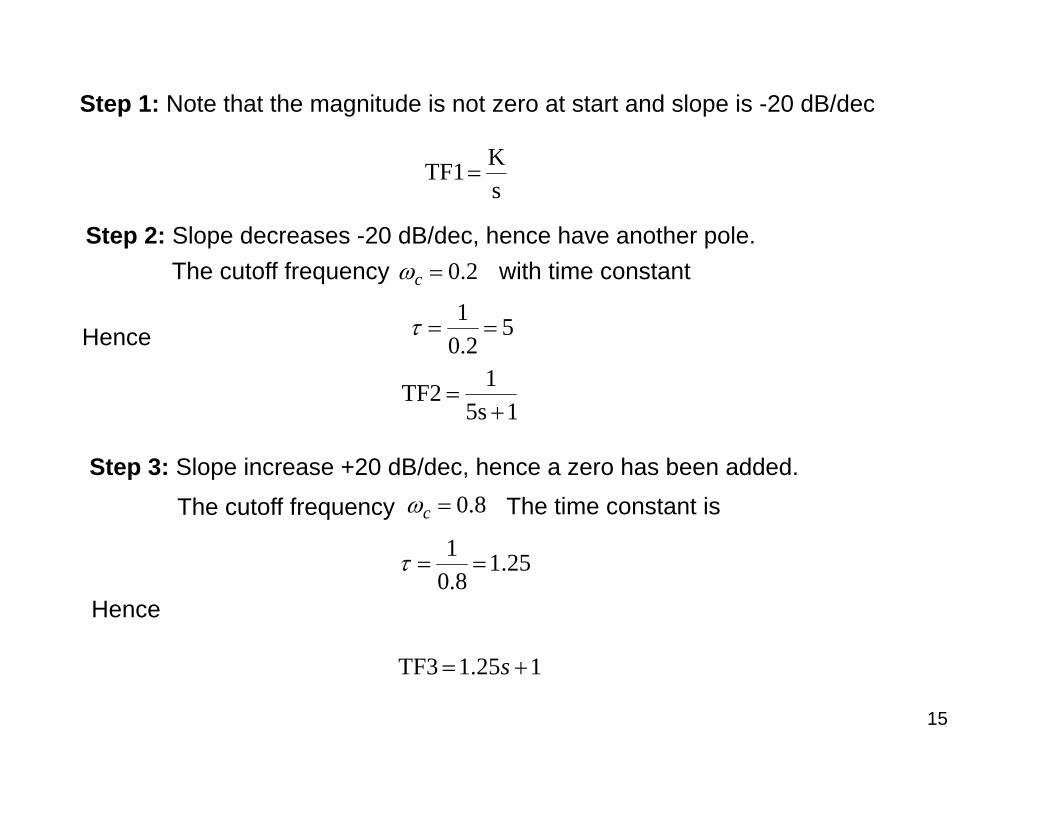
Step 1: Note that the magnitude is not zero at start and slope is -20 dB/dec
sKTF1
Step 2: Slope decreases -20 dB/dec, hence have another pole. with time constant
52.0
1Hence
15s1TF2
Step 3: Slope increase +20 dB/dec, hence a zero has been added.
2.0cThe cutoff frequency
8.0cThe cutoff frequency The time constant is
25.18.0
1
Hence
125.1TF3 s
16
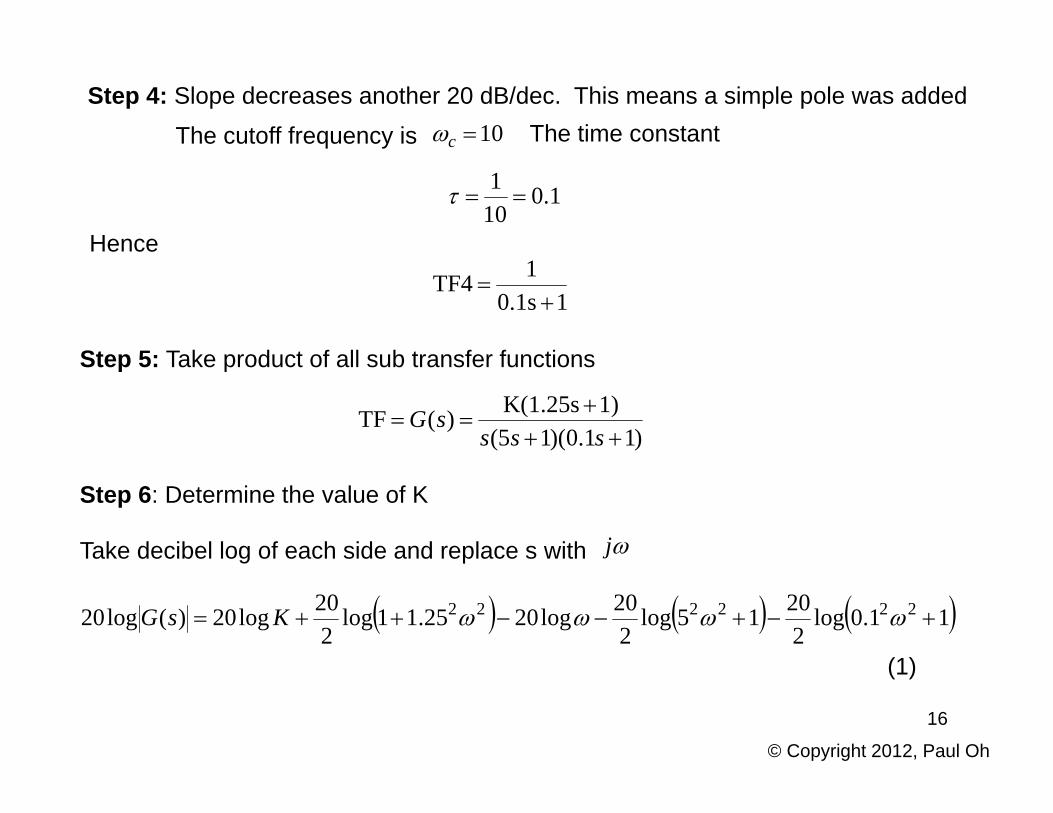
Step 4: Slope decreases another 20 dB/dec. This means a simple pole was added
The cutoff frequency is 10c The time constant
1.0101
Hence
10.1s1TF4
Step 5: Take product of all sub transfer functions
)11.0)(15(1)K(1.25s)(TF
ssssG
Step 6: Determine the value of K
Take decibel log of each side and replace s with j
11.0log2
2015log2
20log2025.11log2
20log20)(log20 222222 KsG
(1)
© Copyright 2012, Paul Oh
17
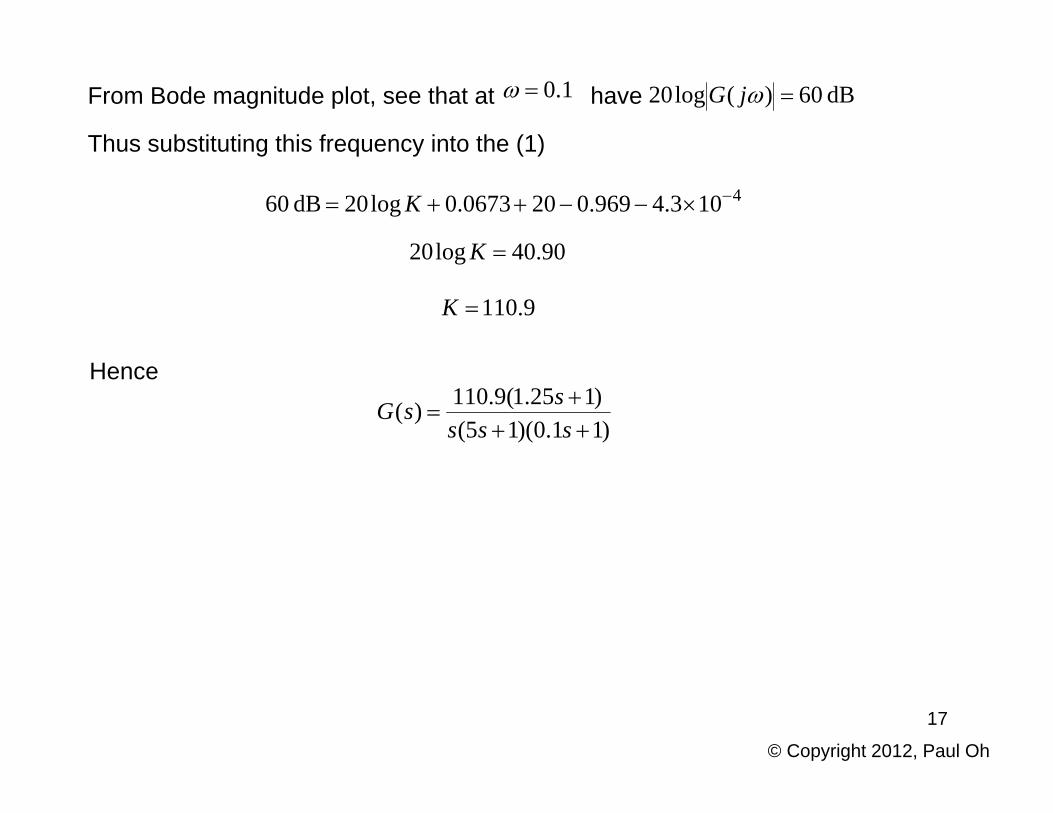
From Bode magnitude plot, see that at 1.0 have dB 60)(log20 jG
Thus substituting this frequency into the (1)
4103.4969.0200673.0log20dB 60 K
90.40log20 K
9.110K
Hence
)11.0)(15()125.1(9.110)(
sss
ssG
© Copyright 2012, Paul Oh