snow melt and flow (uludaĞ case study)...
TRANSCRIPT

SNOW MELT AND FLOW
(ULUDAĞ CASE STUDY)
Kar Erimesi ve Akımı (Uludağ Örneği)
Doç. Dr. İBRAHİM GÜRER*
ABSTRACT:
In humid regions, spring floods constitute approximately 50-70 % of annual flow. In upper zones of the river basins, winter precipitation occurs mostly in solid form and spring thaws. This provides the possibilty to forecast the magnitude of spring snowmelt floods.
For this purpose, the snow cover on Uludağ area, chosen for snow melt study, was measured as accuarately as possible, the collected data were analysed and the relations among snow melt water, meteorological factors and daily flow depths of Kirkpinarlar creek located in the study area were investigated.
In the area of investigation, six new snow courses were established during 1975-76 winter season, in addition to three already existing ones. Snow measurements were made by using different methods and instruments for the purpose of comparison. The area is approximately 30 sq. kms, extending from 1200 m. to 2100 m. elevation, the snow cover period is December 15-April 15 and average depth of snow is 100 cm. There is a water level recorder on Kirkpinarlar creek of 8.03 sq. kms drainage area with a median elevation of 1935 m, and operates under severe winter conditions.
Additionally, the maximum snow depth observations of Uludağ, were correlated with limited data of the ground water level observation of Bursa plain (100 m). The statistical relation was found to be rather weak, because rapidly increasing industrial water requirement of Bursa region was continously obtained from ground water storage.
ÖZET:
Ilıman bölgelerde ilkbahar taşkınları yıllık akış hacminin yaklaşık olarak % 50-70’ini oluşturmaktadır. Havzaların yüksek kesimlerinde kar şeklinde olan
* Hacettepe University Engineering F Julty Beytepe/ANKARA

26 İBRAHİM GURER
yağış, taşkın öncesi arazide iki üç ay bekleyerek baraj işletme mühendislerine taşkın boyutlarını tahmin olanağı sağlar.
Bu amaca yönelik olarak, kar olanaklar elverdiğince doğru ölçülerek, veriler analiz edilmekte ve istatistiksel yöntemlerden faydalanarak özellikle kar, sıcaklık, erime oranı ve akış yüksekliği arasındaki ilişkilerin boyutları ortaya koyulmaktadır. Araştırma alanı Uludağ da 1975-1976 kış mevsiminden başlayarak, 1970 yılından beri işletilmekte olan üç adet kar gözlem istasyonuna ek olarak altı adet yeni istasyon kurulmuştur. Yaklaşık 30 km2 lik, 1200 m-2100 m yükseklik şeriti arasında uzanan, 15 Aralık-15 Nisan tarihleri arasında, ortalama 100 cm kalınlığında kar örtüsü oluşan bir “ kar laboratuvarı” karakterindeki bu alanda, değişik ölçüm aletleri ve yöntemler kullanılarak kar ölçümleri yapılmıştır. Araştırma alanında 1972 yılından beri çok zor iklim koşullarında işletilen Kırkpınarlar Akım Gözlem istasyonunun verileri de analiz katılarak, günlük akış yükseklikleri ve meteorolojik faktörler arasındaki ilişkiler bulunmuştur.
Ayrıca Bursa ovasının en önemli beslenim kaynağı olan Uludağ kar örtüsü ile ova yeraltısı gözlemleri arasındaki ilişki araştırılmıştır. Hızlı bir endüstrileşmenin gereksinimi olan suyun ovadan çekilmesinden dolayı halihazırda ovanın yeraltısu gözlemleri, yeraltısu tablasının doğal durumunu vermediğinden istatistiksel ilişki oldukça zayıftır.
1. INTRODUCTION
In seasonal spring flow forecasting, the most important factor is the water stored in snow cover in the watershed, waiting for the rise of the air temperature and rainfall. For both short term and long term forecasting, the snow cover in the drainage area should be evaluated by measuring the snow depth (Sd), snow density (Sa), and snow water equivalent (Sw/e), and utilizing the area elevation curve, basin slope, exposure, vegatative cover and other physiographi- cal parameters, and then depth of flow and the volume of water which is expected to fill the reservoir is estimated. The melting period extends from the date of maximum snow cover to the disappereance of snow patches from the watershed. The forecasting models prepared during this period is more dependable than those of earlier dates, but part of the reservoir would be already filled with the incoming flow, and the meteorological forecasting will be more important in these types of estimates.
As it is in central Anatolia and Eastern part of Turkey, where the snow melt water constitutes a large portion of annual inflow to reservoirs, rather accurate measurement of snow pack parameters is a must. The amount of water from snow melt is a function of the water equivalent of snow cover at the

SNOW MELT AND FLOW 27
beginning of melting season, the precipitation during this period, the rate of inflitration and evaporation losses in watershed. The snow and rain can be measured but the losses are estimated as the difference between precipitation and discharge. Since there is always a certain amount of error in both snow and rain measurements (Anderson, 1962, Biswas, 1967, Bratzer, 1963, Cox, 1971, Dolgushin and Chigray, 1965, Hamilton, 1949, Kurtyka, 1953, Otnes, 1978, Rodda, 1971, Sevruk, 1974, Struzer, 1965) none of the hydrologic forecasting models can accurately determine the water regime. The errors are large and stocastic in character (Beyazit, 1979, Cary et al., 1977, Hanel et al., 1977). The data collected from snow courses are index values therefore the relation between seasonal spring flood volume and snow water equivalent has statistical character. In forecasting, it is possible to use these index values but in water budget computations, they are inadequate.
In long term forecasting, snow accumulation index is important (U.S. Corps of Engineers, 1960). In defining this index, area evaluation curve of basin, snow water equivalent, total precipitation amount type of precipitation, and variation of mean temperature with respect to elevation are utilized. The magnitude of evaporation from snow during snow accumulation season is very small, therefore it may not be taken into consideration (Teresvirta, 1971). Empirical equations to compute basin evaporation during snow melt season give higher values due to the ground frost. Because, before evaporation process starts, the ground frost must melt, the snow melt water must reach a certain plus temperature and then evaporation will start. Due to temperature difference in day and night, this situation continues quiet a long time. Therefore the evaporation from snow is under intensive research (Doty & Johston, 1969, Giirer, 1975,' Hutchinson, 1966, Peak, 1969). In the analysis of snow data it is possible to correlate the 10-day precip^ion totals from precipitation gages with the snow water equivalent values of the nearest snow courses (Kuzmin, 1960). Before the snow data is included into the correlation, it is necessary to check the data from error point of view, and if there are large deviations, they are eliminated (Gürer and Akin, 1983). Besides, if possible the warm-spells and very windy periods which cause snow drifts are avoided.
In defining areal snow cover, it is important to know the ratio of snow covered area to total area, and also to use this ratio when point data are used to estimate the areal values. To determine the areal distribution of snow pack in drainage areas of represantative and research basins, local observations and mosoic photos are used (Abalyan and Mazuroval, 1971). For fairly large basins, air photos and satellite pictures are useful. But satellite photos should reach the forecaster so early that he can use it before the flood comes. Otherwise they can be used to verif ) how good the estimate of areal distribution of snow was.
28 İBRAHİM GÜRER
In State Meteorological Organization (DMI) stations, the depth of new snow is measured by using snow table, the depth of accumulated snow is measured by snow stakes, and the snow depth, density and snow water equivalent by snow sampling tubes. The vegetation cover, percentage of open area, and different types of forest cover affect the snow occurance. In bare parts of the basin snow accumulates earlier than forest covered parts due to snow catch of forest canopy. Whereas in spring, due to long wave radiation and wind, melting starts earlier in open parts compared to forest covered sections where type of trees, forest density, geographical location, and latitude may change rate of melting, and cause delay in disappearance of snow.
In humid parts of the country, the elevation above the sea level is the most decisive factor for the type of precipitation. As the elevation increases the snow replaces rain, and the amount of the total precipitation increases up to the upper elevation limit of the forest canopy. Although, no universally accepted equation is available to determine the rate of precipitation increase with elevation, there are numerous empirical relations to describe the regional conditions (Anderson and West, 1965; Arai and Bekine, 1974; Bergeron, 1965; WMO, 1972). Models including exposure, vegetative cover, soil infiltration rate besides elevation were set up generally for research and represantative basins (Burns, 1953; Gürer, 1979; Helimeki and Lange, 1973; Hooli, 1973; Kuusisto, 1979; Nilsson, 1973; Pysklywec et al., 1968; Storr, 1967). Besides the snow measurements during melting season, meteorological observations are utilized to compute the amount of melt water and they are used in reservoir operation studies. In dry periods, only air temperature is used in snow melt computations, during wet periods, rainfall on snow, wind and air temperature data are utilized in forecasting the snow melt water.
Snow measurement in Turkey started in 1963 by establishing the snow survey network in the drainage area of Keban dam. The period covering 1963-1969 is defined as “data and information accumulation” period (Krasser, 1966; Ors- trem, 1969; Work, 1969). Foreign experts proposed two different approach for the development of the snow hydrology studies in Turkey. They are:
— Snow research stations and represantative basins
— Snow course network for the drainage areas of reservoirs.
The present snow course network of the country was established under the guidance of these proposals. Turkish State Hydraulic Works (DSİ) operates 196, Electrical Power Research Institute (EİEİ) operates 21 snow courses, where snow depth, density and water equivalent of snow are measured minimum at 10 points, approximately 15-20 meters apart from each other. In order to define the snow cover formation, under the effect of meteorological and

SNOW MELT AND FLOW 29
physiographical factors, and also to prepare a forecasting model a detailed snow study forecasting model has been realized at Uludağ (Gürer, 1983). In selecting the area for investigation, it was necessary to know the preconditions of:
— Heavy snow fall
— The long period of observation of snow parameters
— Variation in elevation (To define the effect of elevation on snow cover formation)
— Winter travelling and transportation (For continous observation program)
For this investigation, the noth facing slopes of Mount Uludağ were selected (Figure 1). When the investigation was started in 1975, four meteorological stations of DMI and three snow courses of DSİ were operating. The number of snow courses increased to nine to cover the elevation strip extending from 1240 m to 2100 m as homogenously as possible. DSİ also operates a flow measuring station since 1971 located on Kirkpinarlar creek feeding mainly from snow melt water and mountain springs. Due to severe winter conditions, in some winters, the limnigraph did not function satisfactorily although the isolation against cold was proper.
2. METHOD OF INVESTIGATION
In this study, the variation of types of precipitation with respect to elevation was investigated. The areal and spatial distribution of physical parameters of snow (the depth, the density and the water equivalent) were studied and the rate of snow melt was computed by degree-day method. The daily flow depth values of the period February-June were compared with snow melt water values of the same period. The interrelation among the depth of flow, snow melt water, temperature, snow cover percentage in drainage basins, and total precipitation, were investigated by actual field data.
During the snow measurements at snow courses, the errors detected as large deviations from mean values were corrected by homogenizing the density values and if necessary by obtaining more samples along the snow line. Although snow fall is frontal type precipitiation in Turkey, and high correlation coefficient are obtained between the daily precipitation data from stations, the snow measurements are affected by the meteorological conditions prevailing during snow measurement, and therefore the relations between snow observations become weak. The systematic errors in flow measurements were corrected and flow data were made ready to correlate with precipitation and other meteorological data. The relation between the snow depth on Uludağ and the groundwater and/or pi feetemetric surface levels of Bursa plain which

30 İBRAHİM GÜRER
is known to be recharged mainly by the tributaries from Uludağ, was also searched.
3. STUDY AREA
The size of the investigation area is about 800 km2, with dense vegetation up to 1900 m, above it is bare, steeply sloped (35° 40°) to Bursa plain, open to the humid winds coming from Marmara Sea. The Bursa plain is about 210 km2 with annual mean temperature of 14.4°C and total annual precipitation 710 mm, and drained by Nilüfer Çay. A series of spring such as Karapinar, Pınarbaşı, and Inkaya having discharges varying from 200 to 2000 It/sec from Paleozoic calcereous belt were the main sources of water supply before the completion of Doğancı dam. Also at Çekirge part of the city, a fault spring temperature range of 35-85°C d' charges above 80 It/sec (Unay, 1978).
The geological formations sloped down to Bursa plain, have many faults and solution galleries, therefore they feed the plain aluvions they are in contact. The important aquifers are sand gravel levels of aluvions, sediment cones and Neogen conglomerate, sandstones and limestones. Most of the aquifer of the plain is confined aquifer type. The sediment cones fed by Uludağ snow melt water is the most important part for the ground water development, where 100 m deep wells may discharge about 50 lt/sec with a 10-15 m drawdown.
4. CLIMATE
The annual precipitiation total of the study area varies between 1000-1600 mm, the mean annual temperature is 4.6° C at Uludağ, in February the coldest month -4.0°C, in July, the warmest month, 14°C, and average wind speed is 2 m/sec, Number of days with snow fall is 64, and average period of snow cover is 171 days, with an average snow depth of 375 cm. The lower limit of snow line is 800-900 m. Mostly frontal precipitation occurs in winter but orographic and convective precipitations are also effective.
5. HYDROMETEOROLOGICAL OBSERVATIONS
In study area, there are four meteorological stations (Table 1).Observation
Elevation Latitude & Period StarsName (m) Longititude From
Uludağ Zirve 1878 40° 07’N, 29° 10’E 1968..Sarialan 1620 40° 04’N, 29° 07’E 1963..Yeşılkonak 1025 40° 07’N, 29° 10’E 1963..Bursa Airport 100 40° l l ’N, 29° 04’E 1929..
Table 1: The meteorological Stations in the Study area
SNOW MELT AND FLOW 31
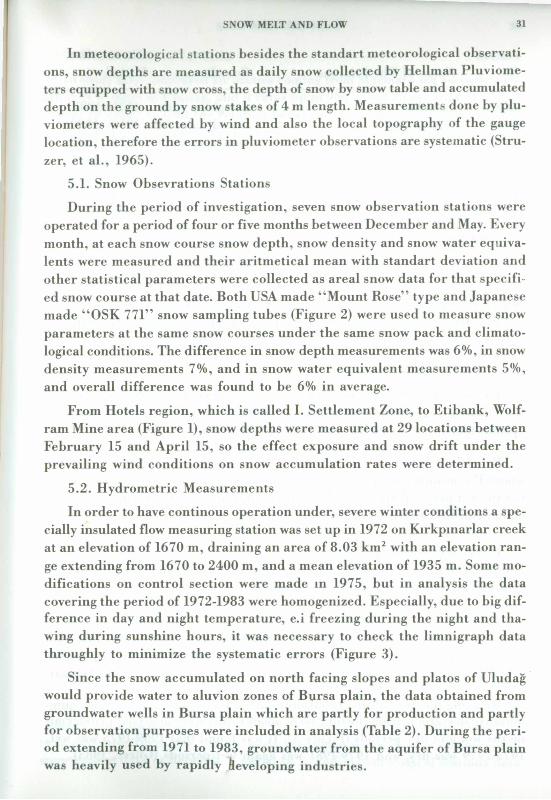
In meteoorological stations besides the standart meteorological observations, snow depths are measured as daily snow collected by Heilman Pluviometers equipped with snow cross, the depth of snow by snow table and accumulated depth on the ground by snow stakes of 4 m length. Measurements done by pluviometers were affected by wind and also the local topography of the gauge location, therefore the errors in pluviometer observations are systematic (Stru- zer, et al., 1965).
5.1. Snow Obsevrations Stations
During the period of investigation, seven snow observation stations were operated for a period of four or five months between December and May. Every month, at each snow course snow depth, snow density and snow water equivalents were measured and their aritmetical mean with standart deviation and other statistical parameters were collected as areal snow data for that specified snow course at that date. Both USA made “ Mount Rose” type and Japanese made “ OSK 771” snow sampling tubes (Figure 2) were used to measure snow parameters at the same snow courses under the same snow pack and climato- logical conditions. The difference in snow depth measurements was 6%, in snow density measurements 7%, and in snow water equivalent measurements 5%, and overall difference was found to be 6% in average.
From Hotels region, which is called I. Settlement Zone, to Etibank, Wolfram Mine area (Figure 1), snow depths were measured at 29 locations between February 15 and April 15, so the effect exposure and snow drift under the prevailing wind conditions on snow accumulation rates were determined.
5.2. Hydrometric Measurements
In order to have continous operation under, severe winter conditions a specially insulated flow measuring station was set up in 1972 on Kirkpinarlar creek at an elevation of 1670 m, draining an area of 8.03 km2 with an elevation range extending from 1670 to 2400 m, and a mean elevation of 1935 m. Some modifications on control section were made in 1975, but in analysis the data covering the period of 1972-1983 were homogenized. Especially, due to big difference in day and night temperature, e.i freezing during the night and thawing during sunshine hours, it was necessary to check the limnigraph data throughly to minimize the systematic errors (Figure 3).
Since the snow accumulated on north facing slopes and platos of Uludag would provide water to aluvion zones of Bursa plain, the data obtained from groundwater wells in Bursa plain which are partly for production and partly for observation purposes were included in analysis (Table 2). During the period extending from 1971 to 1983, groundwater from the aquifer of Bursa plain was heavily used by rapidly fteveloping industries.
32 İBRAHİM GÜRER
Station ObservationNo Name of The Stations Coordinates Period
8083 Çayırköy (*) not given with 1971-198115594 Narlıdere (*) Coordinates but 1974-198015600 N. Dudaklı with map num 1973-198015603 N. Dudaklı bers and 1973-197518771 Bursa Saniyi Bölgesi Eceabat locations 1976-198118770 9 9 9 9 9 9 9 9 19 78 -18775 9 9 9 9 9 9 9 9 1977-1978
* equipped with stevens type well limnigraphes
Table 2: Groundwater Observation Wells in Bursa plain
With the completion of Doğancı Dam, the rate of overdrafting decreased. Also there are discharge measurements of two large springs Pınarbaşı (from Tra- verten) and Karapınar (from limestone) since 1976.
6. Precipitation Analysis
By using the precipitation data covering the period of 1969-1981, from all four meteorological stations located at different elevations, the annual pre- cpition total varied with elevation according to the relation of
P = 600 + 0.5 h ........................................................................ (1)where P is annual precipitation in mm, h is elevation from sea level in meter. For the wet period (September-June) precipitation total, the relation with elevation can be written as
P sept-may = 600 + 0.4 h ....................................................... (2)For dry period (June-August) between precipitation total and elevation the following simple linear relation was obtained
P June-Aug = 45 + O.l h ...................................................... (3)Also, when the precipitation data were analysed, it was found out that 90.1 % of annual precipitation total occurs during wet period i.e from September 1 to May 31, and the rest 9.9% occurs during the dry season (June-August).
By using the annual precipitation totals of meteorological stations, cum- mulative deviations from the long term mean values were analysed to determine the wet and dry periods (Figure 4). It was found that 1969-1975 was wet, 1975-1979 was dry, and 1979-1981 was again wet periods (Giirer, 1983).

SNOW MELT AND FLOW 33
7. SNOW DATA ANALYSIS
In study area, saturated air masses coming from Marmara sea ascends through N-NW slope of Uludag, and it rains up to 900 m but snows above this elevation. In order to find the relation between temperature and precipitation the common observation period of four meteorological stations 1968-1981 was selected. The variation number of days with different types of precipitation (snow, rain, sleet) versus air temperatures (from —15 °C to + 15 °C) were plotted (Figure 5). At DMI, Zirve station, the ratio of snowy days to total number of days with precipitation is 62%, and at Bursa it is only 5.4%. At higher elevations of the basin, the percentage of number o f snowy days is 90.7% in January, 95.7% in February, 80.1% in March, 56.7% in April. As the elevation decreases, these percentages drop.
7.1. Degree —Day Approach in Snow Melt Computations
During rainless days of snowmelt season, the amount of water produced by the melting of snow is computed by degree-day method (Martinec, 1960; U.S.A. Corps. Eng., 1956). In order to determine the degree day factors, the amounts of snow melts and corresponding °C degrees above a base temperature (0°C), for rainless periods, obtained from three meteorological stations were analysed. The density of fresh snow is generally 10%, for ripe snow it reaches to 35%, prior to melting it is 40-45%, even it may reach to 49-50%. The snow densities measured and the degree day factors computed for three of the meteorological stations in study area are given in Table 3.
Snow Meteorological StationsPeriod Density Zirve Sarialan Yefilkonak
December 0.20 gr/cm3 2.0 mm/°C 1.9 mrn/°C 1.9 mm/°CJanuary 0.25 gr/cm3 3.0 mm/°C 2.5 mm/°C 2.6 mm/°CFebruary 0.30 gr/cm3 3.7 mm/°C 3.1 mm/°C 3.4 mm/°CMarch 0.35 gr/cm3 4.5 mm/°C 3.8 mrn/°C 4.2 mm/°CApril 0.40 gr/cm3 5.2 mm/°C 4.5 mm/°C —May 0.50 gr/cm3 7.0 mm/°C — —June 0.50 gr/cm3 7.4 mm/°C — —
Table 3: The computed degree-day factors for three m eteorological stations in the study area
In the study area, basicly three different types of snow data of varying periods of observation were avaible. Before using these data, it was necessary to homogenize them. By using simple regression method, and assuming the snow course data as dependen* Variable Y, and meteorological stations data

34 İBRAHİM GÜRER
as X, the best relation was obtained in Sarialan region with corelation coefficient of r = 0.811 and standard error of estimate s = 0.131 with sample size of n = 22. The cross correlations between various meteorological stations and snow courses were found to be less dependable due to limited size of data and less degree of freedom.
In order to determine the variations of snow depth and water equivalent with altitude, the snow data collected from six snow courses homogenously distributed from 1240 m to 2050 m were included in analyses. The results are presented in Figure 6. As shown in the figure, the relations are quite similar to each other, but the snow density showed rather large deviations varying between 20% and 45%, due to wind effect, therefore the results were not satisfactory. Snow drift adversely affects the snow distributions in the field (Tabler, 1975; Young, 1974).
After the homogenization of the snow data, the interrelations among the snow courses were searched. The best relation was found to be between DSl Sarialan snow course and DMI Kirazliyayla snow course (r = 0.986 in snow depth values, r = 0.958 in snow water equivalent values and r = 0.868 in snow densities).
The relations improve as the altitude of the snow courses increases because more snow is measured at the snow courses of higher elevations. The statistical relations among the snow courses decrease as the interdistance, and elevation difference of the stations increase e.i. nearer stations have better relations than the snow courses far from eacher other (Figure 7).
8. ANALYSIS OF HYDROMETRIC DATA
In the study area, permanent snow cover starts generally on November 15. Melting is rather low during the winter due to north facing orientation. Therefore in snowy season Kirkpinarlar creek like others has very little discharge fed by afew springs. Due to rather long stay of snow cover on the ground, top soil will be fully saturated before the start of the melting season. When the spring thaws start, the direct flow occurs with a sharp rise in hydrograph. Most of the creeks originating from the study area feed the main aquifer of Bursa plain, by Deli§ay river.
Spring floods produced mainly by snow melting, start in the second half of March (Figure 8). By analysing the data extending from 1972 to 1981 (excluding 1973 and 1975), the total annual flow, snow melt flows of the periods of February-June, March-June, April-June and April-May and their ratios to annual total are computed and results are given in Table 4.

SNOW MELT AND FLOW 35
Q i i - v i Q * * « - v i Q iv - v i Q i'v -v
Year (105*m3) (106*m3) (106*m3) (106*m3) (106*m3)
1974 11.62 9.24 9.10 8.48 6.96(%100) (%80) (%78) (%73) (%60)
1976 10.89 9.03 8.87 8.61 7.42(%100) (%83) (%81) (%79) (%68)
1977 11.63 5.93 5.66 5.52 5.08(%100) (%51) (%49) (%47) (%44)
1978 14.08 12.03 11.18 9.50 8.32(%100) (%85) (%79) (%67) (%59)
1979 12.81 10.45 9.17 6.70 5.60(%100) (%82) (% 72) (%52) (%44)
1980 17.72 13.65 13.27 12.73 8.73(%100) (%77) (%75) (%72) (%49)
Table 4: List o f the annual and seasonal flow volumes o f different periods and their ratios to annual flow total o f DSi 3-38 Kirkpinarlar stream gage.
8.1. Recession Curve Analysis
In mountainous watersheds, where snow melt is the main source of flow, the melt water flowing overland and in channel under the affect of gravitation is termed as “ Surface Flow” the water infiltrating into soil mantle and flowing down, above groundwater table is called “ Subsurface Flow” , and that part of melt water infiltrating and reaching the groundwater table and later flowing out as springs and perennial channel flow not only dry seasons but all the time is called “ Groundwater Flow” .
The daily low flow values of rainless period of June-July were plotted against time to obtain recession curves for the periods 1972-1980 (Figure 9). The semilogaritmic plotting of low flow values produced a curve which is expressed by
Q. = Qo e - « ................................................................. (4)
Where Q, is the discharge at the end of the recession time t, Q0 is discharge at time t = 0, a is the slope of recession curve and known as recession coefficient. The results are given in Table 5.
From the analysis, recession period was found to be about 40 days, and base flow about 32 It/sec ana a coefficient is between 0.06-0.12 lt/day. For 8.0

36 İBRAHİM GÜRER
YearO o
(m3/Sec)Q t
(m3/sec)Tdays
a(1/day)
V o
(106* m3)
1972 0.86 0.032 38 0.0866 0.851974 0.98 0.038 40 0.0812 1.041976 0.88 0.045 44 0.0675 1.121977 0.96 0.088 35 0.0680 1.221978 0.48 0.031 23 0.1190 0.34
(0.60) (0.025) (25) (0.1270) (0.40)1979 0.89 0.046 41 0.0720 1.071980 0.56 0.047 43 0.0580 0.84
Table 5: Recession curve characteristics o f DSI 3-38 Kirkpinarlar stream gage.
km2 drainage area, such high values indicate very small storage capacity but rather rapid discharge.
8.2. Multiple Correlation Analysis
In order to determine the interrelations of hydrometeorological parameters, by using 13 different variables, a multiple correlation analysis was carried out. The variables included in analysis are the total flow depth (Qi), direct flow depth (Q2), Q3= Total flow depth -Q o , daily mean temperature (T°C), the melting rates (D, =Q!/T and D2 = Q2/T), daily precipitation total (P), snow depth (S), new snow depth (NS), daily mean wind velocity (W), cloudiness (C), relative humidity (RH) and the snow melt water computed by empirical approach (M). The relations of flow to temperature and melt water were found to be better than the other variables (Gürer, 1983).
9. RELATION OF SNOW COVER AT ULUDAĞ TO GROUNDWATER IN BURSA PLAIN
Snow measurements done in the study area, could be used as index values in order to foreceast the water stored at the higher elevations of the drainage areas of many small creeks feeding the aluvion cones of Bursa plain. Seven of those creeks having drainage areas varying between 14 km2 and 66 km2 are listed in Table 6 with their basin characteristics and physical parameters. Most of the floods in Bursa are produced by the sudden melt of snow or melt due to the rainfall on snow pack.
Groundwater level observations of the stations listed in Table 2, are shown in Figure 10. It may be possible to determine monthly groundwater level vari

SNOW MELT AND FLOW 37
ations from the static water levels of the wells. The exact yields of the artesian wells existing in Bursa plain could not be determined, but flow rates of Kara- pinar and Pınarbaşı springs were measured once a month since 1976.
Name o f the basınDrainage
Area (km2)Length of
Main Branch
Number of Segments
SteamOrder
RelativeRelief
DrainageDensity
SteamFreq.
SchumCoeff.
ShapeFactor
Gravel.Coeff.
A L (Km) NU D(km/kmJ) NU/A L2/A KC
Güvercinlik Deresi 23.72 9.5 72 4 0.0768 1.412 3.05 0.57 3.30 1.46Delicay (Kürekli D.) 29.60 10.2 84 3 0.0799 1.499 2.84 0.63 3.50 1.41Küçük Balıklı 14.06 7.8 31 2 0.0870 1.650 2.20 0.54 4.27 1.67Kırkpm arlar Dombay C. 19.88 16.0 83 3 0.0608 2.190 4.18 0.31 12.88 2.13Kaplıkaya D. 43.90 16.0 93 4 0.0495 0.900 2.12 0.47 5.83 1.72Gökdere 66.42 17.3 36 4 0.0400 0.630 0.54 0.53 4.48 1.63Alaşar Deresi 14.04 8.0 92 4 0.0550 2.430 6.40 0.52 4.56 1.28Aşağı Alaşar Deresi 20.81 9.3 26 3 0.0348 1.153 1.24 0.57 4.11 1.55
Table 6: Physical parameters o f the small drainage areas located on north facing slope, between Uludağ and Bursa plain.
Since there was no flow measuring station on the creeks flowing down from Uludağ to aquifer, an overall relation between snow depth at Uludağ and groundwater level in Bursa plain was searched. Before the Doğancı dam put in the service, the rapidly developing industry used up the groundwater of Bursa plain. Also, part of the domestic and irrigation water was obtained from the groundwater wells. Because of these reasons, the static water level observations were adversely affected.
The snow courses of the study area, located above 1200 m, represent only 8 % of the watershed of the aquifer.
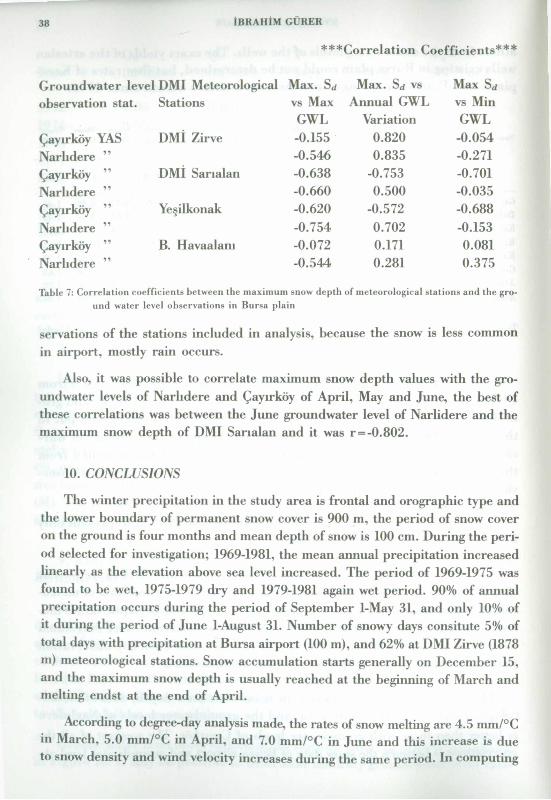
The meteorological stations located between 100 m and 1878 m, represent almost the whole watersheed of the aquifer. Therefore the snow data of meteorological stations were used in analysis. The maximum snow depth values measured at DMI Zirve, Sarıalan, Yeşilkonak and Bursa stations were correlated with the static water levels observed at Narlidere and Çayırköy observation wells, the correlation coefficient are presented in Table 7.
The statistical relation between the maximum snow depth, data of meteorological stations in the study area, and the groundwater levels of Narlidere is better than those with groundwater levels of Çayırköy. The weakest of all the correlations is between the snow /data of Bursa airport and groundwater level ob-
38 IBRAHIM GÜRER
***Correlation Coefficients***
Groundwater level DMI Meteorological Max. Sd Max. Sd vs Max Sdobservation stat. Stations vs Max Annual GWL vs Min
GWL Variation GWLÇayırköy YAS DMİ Zirve -0.155 0.820 -0.054Narlidere ” -0.546 0.835 -0.271Çayırköy DMİ Sarialan -0.638 -0.753 -0.701Narhdere ” -0.660 0.500 -0.035Çayırköy Yeşilkonak -0.620 -0.572 -0.688Narhdere ” -0.754 0.702 -0.153Çayırköy ” B. Havaalanı -0.072 0.171 0.081Narhdere ” -0.544 0.281 0.375
Table 7: Correlation coefficients between the maximum snow depth o f m eteorological stations and the ground water level observations in Bursa plain
servations of the stations included in analysis, because the snow is less common in airport, mostly rain occurs.
Also, it was possible to correlate maximum snow depth values with the groundwater levels of Narhdere and Çayirkôy of April, May and June, the best of these correlations was between the June groundwater level of Narlidere and the maximum snow depth of DMI Sanalan and it was r = -0.802.
10. CONCLUSIONS
The winter precipitation in the study area is frontal and orographic type and the lower boundary of permanent snow cover is 900 m, the period of snow cover on the ground is four months and mean depth of snow is 100 cm. During the period selected for investigation; 1969-1981, the mean annual precipitation increased linearly as the elevation above sea level increased. The period of 1969-1975 was found to be wet, 1975-1979 dry and 1979-1981 again wet period. 90% of annual precipitation occurs during the period of September 1-May 31, and only 10% of it during the period of June 1-August 31. Number of snowy days consitute 5% of total days with precipitation at Bursa airport (100 m), and 62% at DMI Zirve (1878 m) meteorological stations. Snow accumulation starts generally on December 15, and the maximum snow depth is usually reached at the beginning of March and melting endst at the end of April.
According to degree-day analysis made, the rates of snow melting are 4.5 mm/°C in March, 5.0 mm/°C in April, and 7.0 mm/°C in June and this increase is due to snow density and wind velocity increases during the same period. In computing

SNOW MELT AND FLOW 39
the rate of snow melting when air temperature is between 0°C and 1°C, the mag- nitute of the error involved is large because mean daily temperature values are used in computation. Although melting is assumed to take place when the air temperature is above 0°C, but when the air temperature is 0.1 °C, and snow water equivalent is divided to this number then the rate of melt is found to be errono- usly high.
The high correlation coefficient between the snow depth measured at meteorological stations and the snow depth values measured along snow courses, made it possible to use snow depth values of meteorological stations instead of the depth values of snow courses when the climate is unsuitable to work in open field along the snow courses.
Snow depth and water equivalent increase with the elevation but this not a linear relation, under the influence of other meteorological factors, rate of increase is steeper above 1700 metres.
The interrelation among the snow depth, density, and water equivalent observations at the snow courses decreases as the distance and elevation difference between the snow courses increases, but the change of slope has little effect.
The stream flow data of Kirkpinarlar station extents from 1972 to 1980, the drainage area is 8.03 km2, and the average elevation of the basin is 1935 m. According to the flow data analysis, 76% of annual flow comes during February-June, 73% during March-June, 65% during April-June and 54% during April-May, and it is produced by snow meting.
According to the flow recession curve analysis of the Kirkpinarlar Creek, the flow drops to 1.0 m3/sec at the beginning of June and the base flow is 32 It/sec, the underground storage is almost nill, coefficient of discharge is 0.06-0.12 It/day and rather high, and this information fits well with the structural geology of the drainage area.
The mean daily total and flood flow values of Kirkpinarlar creek, were linearly and logaritmicly correlated with the snow melt water of the same day and of the preceeding day, computed from the snow data obtained from DMI Zirve meteorological station. The mean daily temperature, snow pack in basin, and pre- cipitiation on snow affect the flow depth of the creek, but the corielation coefficient varies between, r = 0.4-0.6, which is rather weak. The relation between the maximum snow depth values measured on the north facing slopes of Uludağ, and the ground water levels in Bursa plain was searched. With the limited data available in hand, snow depth affects the maximum level of groundwater, but minimum groundwater level has weak relation, because the overdraft of the groundwater by rapidly developed industry Y Is more dominant affect on the minimum values of groundwater levels.

11. LIST OF REFERENCES
ABALYAN, T.S., MAZUROVAL, I.N., 1971, Use of aerial photographs for snow cover study in the mountain basin of Varzob rivers, Soviet Hydrology, Selected Papers. Issue No: 2, U.S.A.
ANDERSON. H.W., WEST A .J ., 1965, Snow accumulation and melt in relation to terrain in wet and dry years, Proc. of the Western Snow Conference, pp. 77-83, U.S.A.
ANDERSON, T., 1949, On the accuracy of rain measurements and statistical result- fron rain studies with dense networks, Akiv for Geoysik Band, No: 13, Upsa- la, Sweden.
ARA!, T., SEKİNE, K., 1974, Study on the formation of perennial snow patches in Japan, Japanese Progress in Climatalogy, Japanese Climatological Seminar La- barotory of Climatology, Tokyo University of Education, Ofsuko, Bankyo-ku, Tokyo, Japan
BERGERON, T., 1965, On the low level redistribution of ath nospheric water caused by orography, Project Pluvious Report 1, Maddehinle, No: 92, Meteoro- logisha Instituionen Upsala, Sweden
BE YAZIT, C.V., 1979, Hidroloji, ITU Kütüphanesi, Sayı: 1138, Istanbul
BRATZEV, A .P., 1963, The influence of wind speed on the quantity of measured precipitation, UAC 551-577, Met and Hydrology, No: 8, pp, 54-56
BURNS, J.I., 1953, Small scale topographic effects on precipitation distribution Insun Dima experimental forest, Trans American Geophysical Union, Vol: 34, No: 5
CARY, E., FOGEL, M., and DUCKSTEIN, L., 1977, Snow accumulation and ablation: a stochastic model, For presentation at Third International Hydrology Symposium, Fort Collins, Colorado, U.S.A.
COX, L.M., 1971, Field performance of the universal surface precipitation gage, Proc. of the Western Snow Conference, pp. 84-88, Montana
DOLGUSHIN, I.P., Ch IGRAY, D.T., 1965, Results of experimental investigations of error of precipitation gages at Gorki Hydrmeteorological Observatory, Trudy
GGO, No: 175, pp. 155-163
SNOW MELT AND FLOW 41
DOTY, R.D., JONSTON, R.S., 1969, Comparision of gravimetric measurements and mass tranfer computations of snow evaporation beneath selected vegetation conopies, Proc. of Western Snow Conference, U.S.A.
GÜRER, I., 1975, Hydrometeorological and water balance studies in Finland, Helsinki University of Technology, Research Papers 49, Helsinki
GÜRER, I., 1979, Karın fiziksel özelliklerinin zamansal değişimine yükseklik faktörünün etkisi, II. Ulusal Kar Hidrolojisi Semineri, D.S.Î., Ankara, s. 37-44
GÜRER, İ., ÇELİK, A., 1979, Kar verilerinin bilgisayarla analizi, D.S.İ. III. Hidroloji Semineri, cilt 3, Ankara
GÜRER, I., 1982, Kar erimesi ve akımı, Hacettepe Üniversitesi, Mühendislik Fakültesi, Beytepe, Ankara
HAMILTON, E.L., 1949, The problem of sampling rainfall in mountaneous areas, Reprint from Proc. of the Berkeley Symposium on Mathematical Statistics and Probability, University of Californa Press
HELİMAKİ, U.I., LANGE, A., 1971, Söneplatta; Jamförelse av Matresultat. The snow plate: comparsions and results, Snotaxering Nordiskt expertmate, Lammi 21-23,3, Nordric IH D Report, No: 1
HOOLİ, J., 1973, The efect of elevation and slope direction on the water equivalent of the snow on mountains in Lapland on the basis of observations taken during the water of 1971/72, Helsinki University of Technology Research Papers 43, Helsinki, F,nland
HUTCHINSON, B.A., 1966, A comparision of evaporation from snow and soil surfaces, Rep. of Bull, of the IASH XI® Annee No: 1 pp. 34-42, Colorado
KRASSER, M.A.L., 1966, Preparation of the national snow survey in Turkey, DSI, Ankara
KURTYKA, I.C., 1953, Precipitation measurement study, Report of Investigation No: 20, İllinois, U.S.A.
KUZMIN, P.P., I960, The formation of snow cover and methods of determining snow amount, Publ. of Hydrometeorology Institute Hse, Leningrad
KUUSISrO, E ., 1973, On snowmelt and and snow melt runoff in Paajarvi representative basin 1970-1972, Vesihallitus, Report 46, Helsinki
MARTINEC, J., 1960, The degree-day factor for snowmelt-runoff forecasting, UASH Gen. Assembly of Helsinki, Comm, on Surface Water, pp. 448
NILSSON, L.Y., 1973, Verka representative basin precipitation, Royal Institute of Technology Report 3: 16, Stockholm

QiTTREM, G., 1969, Needs and possibilities applied snow investigations in Turkey, Report from a UNESCO Mission in Turkey, Ankara
PEAK, G.W., 1969, A snow pack evapo-sublimation formula, Proc. of Western snow conference, pp. 64-72
PYSKLYWEC, W.D., DAVAR, S.K., and B ray, D.I., 1968, Snow melt at an index plot, Water resources Research Vol: 4, No: 5, pp. 937-946
RODDA, J.R., 1971, The precipitation measurement paradox-The instrument accuracy problem, WMO Report No: 316, Switzerland
STORR, D., 1967, Precipitation variations in a small forested watershed, Proc. of the Western Snow Conference, pp. 18-20
STRUZER, L.R., 1965, Principal shortcoming of methods of measuring atmospheric precipitation and of improving them, Trans, of the Voyeykov Main Geophysical Observatory, Trudy GGD, No: 175, pp. 5-23
STRUZER, L.R., NECHAYEV, I.N., and BOGDANOVA, E.G., 1965, Systematic errors of measurements of atmospheric precipitation, Trans. Meteorology and Hydrology No: 10, UDC, pp. 551-501-777
TABLER, R.D., 1975, Predicting profiles of snow drifts in topographic catchments, Proc. of the Western Snow Conference, pp. 87-97
U.S. Army, Corps of Engineers, 1956, Snow Hydrology, North Pasific division, Portland, Oregon
UNAY, T., 1978, Bursa ovası jeotermal enerji aramaları rezistivite etüd raporu, MTA Enstitüsü Derleme rapor No: 6255, (Yayınlanmamış)
WMO, 1972, Distribution of precipitation in mountaneous areas, Gelio Symposium, Vol: 1 and 2, Norway Proc. printed in Switzerland
WORK, R.A., 1969, Recomendations for development and practive of snow survey for runoff forecasting in Turkey, DSİ, Ankara
YOUNG, G.J., 1974, A stratified sampling design for snow surveys based on terrain shape, Proc. of the Western Snow Conference pp. 14-22
42 İBRAHİM GÜRER

SNOW MELT AND FLOW 43
Figu
re
1: Lo
catio
n an
d to
pogr
aphi
cal
map
of the
stu
dy
area
, wi
th
hydr
omet
eoro
logi
cal
stat
ions
an
d sn
ow
cour
ses
and
area
el
evat
ion
curv
e of
smal
l re
seac
h ba
sin
DSI
3-38
Kir
kpin
arla
r cr
eek,
with
A
- B.
O

44 İBRAHİM GÜRER
Figure 2-a: Rose type snow used by State Hydraulic Works DSI A: Sampling tube, B: Cylindirical balance, C: Hanger, D: Driver, E: Wrend: F: Cutter, G: Extra tube
Figure 2-b: Japanese OSK 771 type snow sampler used by State meteorological Organization (DMI).
n __________________________________ __________________________________5 3 1979 6 3 .1 9 7 9 7.3.1979 8 .3 1979 9 3 1979 ICX 3.1979
^ ----vS '
2 4 » 12« 12= 2 4 » 12“ M “ 1 2 « 2 4 « 1 2 « 2 4 » 1 2 « 2 4 «
ho*'
DSİ 3 - 3 8 U ludağ Kirkpinariar S tre a m Gage
h ______2 6 .4 f979 27 4 1979 28 4 .1979 2 9 4 1979 30 4 1979 1 5 1979
---------------- -..................... ,
----------<• --------__________
I2M 2 4 « 1 2 « 2 4 «» 1 2 « 2 4 » C « 2 4 » 1 2 » 2 4 » 1 2 « 24*:H o u r
Figure 3: The day and night temperature differance affect on limnigraph recording under severe winter conditions at Uludağ o f DSI 3-38 Kirkpinariar Creek

SNOW MELT AND FLOW 45
Figure 4: Annual precipitation totals, long term mean o f annual totals, and dry periods o f DMI m eteorological Stations o f Zirve, Sanalan, Ye§ilkonak and Bursa

Nuınb
«r of
46İBRAHİM GÜRER

E X
PLA
NA
T
10 N
S
SNOW MELT AND FLOW 47
Figu
re
6: Va
riatio
n of
daily
sn
ow
dept
h (S
) an
d sn
ow
wate
r eq
uiva
lent
(S
f ) va
lues
m
easu
red
with
sn
ow
sam
pler
s wi
th
elev
atio
n. S
now
obse
rvat
ion
data
in
clud
ed
in an
alys
is co
ver
the
perio
d of
1975
-197
8.

48 İBRAHİM GÜRER
March I I
i s s p u .».—Jarik l
s g
2 £ 1 1
i I Sono
lan
KOI X
I— 1
|
?
1o
3X
*2
1200 1240 1X0 1310 1620 (732 «7 0 2 0 0 0 2100
E l e v a t i o n ( m )
C
Figure 7: Varitation o f average snow depth, snow water equivalent and snow density with elevations. The snow data were analysed in two groups, for all snow courases observed in the study area

SNOW MELT AND FLOW 49
Figu
re
8: Da
ily
flow
valu
es
of the
ye
ars
1972
-198
1 of
DSI
3-38
K
irkp
inar
lar
strea
m ga
ge
(197
3 an
d 19
75
reco
rds
were
no
t in
clud
ed
due
to fro
st
effe
ct.

İBRAHİM GÜRER
perio
d of
1972
-198
0.

SNOW MELT AND FLOW 51
Figu
re
10:
Mon
tly
grou
ndw
ater
le
vel
obse
rvat
ions
at
Burs
a an
d Ca
yirk
oy
plai
ns
by St
ate
Hyd
raul
ic
Wor
ks
(DSI
) du
ring
the
perio
d 19
71-1
981.