social norms campaign strategy final report · conclus ons: a high-intensity paid media social...
TRANSCRIPT
Social Norms Campaign Strategy | Final Report
This publication is distributed by the U.S. Department of Transportation, National Highway Traffic Safety Administration, in the interest of information exchange. The opinions, findings, and conclusions expressed in this publication are those of the author(s) and not necessarily those of the Department of Transportation or the National Highway Traffic Safety Administration. The United States Government assumes no liability for its content or use thereof. If trade or manufacturer’s names or products are mentioned, it is because they are considered essential to the object of the publication and should not be construed as an endorsement. The United States Government does not endorse products or manufacturers.
Social Norms Campaign Strategy | Final Report
1. Report No. 2. Government Accession No. 3. Recipient’s Catalog No.
4. Title and Subtitle 5. Report Date
6. Performing Organizational Code
8. Performing Organization Report No.7. Author(s)
9. Performing Organization Name and Address 10. Work Unit No. (TRAIS)
11. Contract or Grant No.
13. Type of Report and Period Covered 12. Sponsoring Agency Name and Address
14. Sponsoring Agency Code
15. Supplementary Notes
16. Abstract
17. Key Words 18. Distribution Statement
19. Security Classif. (of this report) 20. Security Classif. (of this page) 21. No. of Pages 22. Price
Technical Report Documentation Page
Form DOT F 1700.7 (8-72) Per FORM PRO/Delrina 04/04/94 Reproduction of completed page authorized
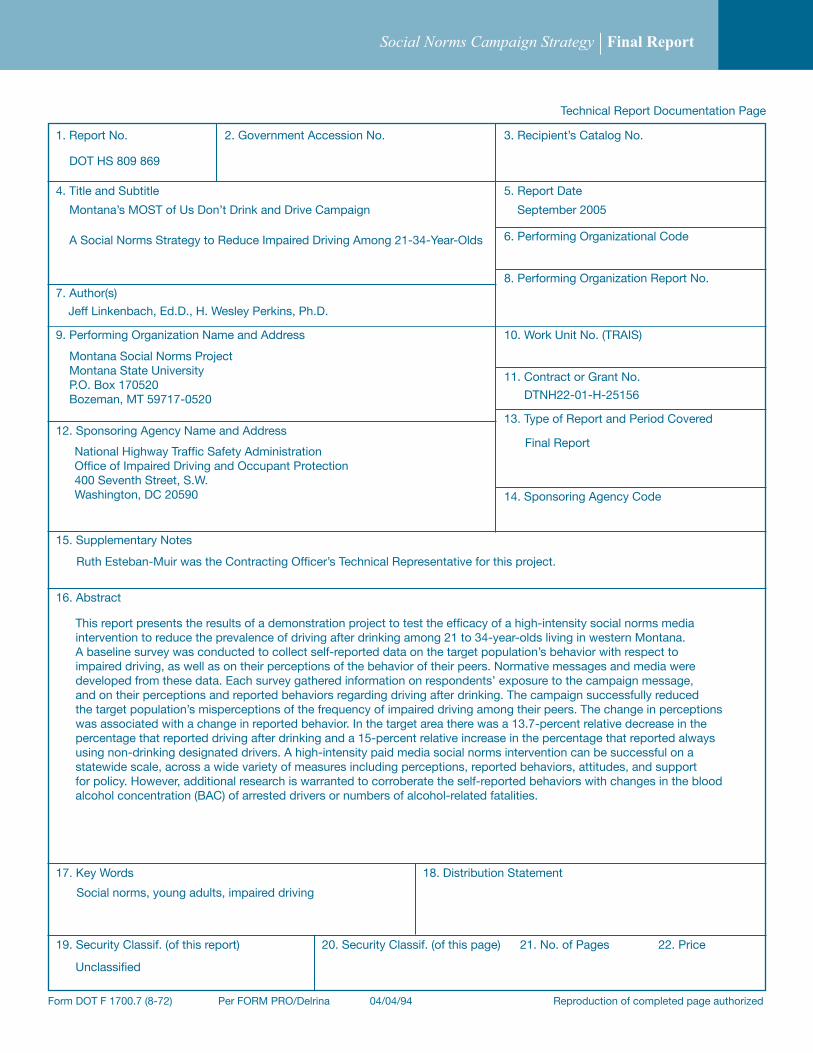
This report presents the results of a demonstration project to test the efficacy of a high-intensity social norms mediaintervention to reduce the prevalence of driving after drinking among 21 to 34-year-olds living in western Montana. A baseline survey was conducted to collect self-reported data on the target population’s behavior with respect to impaired driving, as well as on their perceptions of the behavior of their peers. Normative messages and media were developed from these data. Each survey gathered information on respondents’ exposure to the campaign message, and on their perceptions and reported behaviors regarding driving after drinking. The campaign successfully reduced the target population’s misperceptions of the frequency of impaired driving among their peers. The change in perceptions was associated with a change in reported behavior. In the target area there was a 13.7-percent relative decrease in the percentage that reported driving after drinking and a 15-percent relative increase in the percentage that reported alwaysusing non-drinking designated drivers. A high-intensity paid media social norms intervention can be successful on astatewide scale, across a wide variety of measures including perceptions, reported behaviors, attitudes, and support for policy. However, additional research is warranted to corroberate the self-reported behaviors with changes in the blood alcohol concentration (BAC) of arrested drivers or numbers of alcohol-related fatalities.
DOT HS 809 869
Montana’s MOST of Us Don’t Drink and Drive Campaign
A Social Norms Strategy to Reduce Impaired Driving Among 21-34-Year-Olds
September 2005
Jeff Linkenbach, Ed.D., H. Wesley Perkins, Ph.D.
Montana Social Norms ProjectMontana State UniversityP.O. Box 170520Bozeman, MT 59717-0520
National Highway Traffic Safety AdministrationOffice of Impaired Driving and Occupant Protection400 Seventh Street, S.W.Washington, DC 20590
DTNH22-01-H-25156
Final Report
Ruth Esteban-Muir was the Contracting Officer’s Technical Representative for this project.
Social norms, young adults, impaired driving
Unclassified

Social Norms Campaign Strategy | Final Report
WW
W.M
OSTO
FUS.
ORG
�
Table OF COnTenTS
List of Figures and Tables .......................................................................................................... ii
Abstract ...................................................................................................................................... 1
Executive Summary ................................................................................................................... 3
I. Introduction and Background ........................................................................................... 5
II. A New Approach to Prevention ........................................................................................ 6
The Social Norms Approach to Prevention
Perceptions and Social Norms
Misperceptions of Actual Norms: The Hidden Risk Factor
Causes of Misperceptions
Consequences of Misperceptions
The Science of the Positive versus Fear Tactics
III. The Montana Social Norms Project ................................................................................. 9
The Montana Model of Social Norms Marketing
Montana Young Adult Phone Survey
An Initial MOST of Us Prevent Drinking and Driving Campaign
IV. A High-Intensity Social Norms Media Intervention ...................................................... 12
Establishing an Experimental Design
Selecting the Campaign Target Area
Sampling Frame Selection, Survey Methodology, & Collection of Data
Selection of Message
Media Placement and Exposure
V. Results of the Media Intervention .................................................................................. 18
Evaluating a Social Norms Media Campaign
Social Norms Campaign Message Exposure
Unprompted Recall
Prompted Recall
Campaign Impact on Perceived Norms of Peers
Campaign Impact on Personal Attitudes and Behaviors
VI. Discussion of Results ..................................................................................................... 27
VII. Conclusions and Implications......................................................................................... 29
VIII. Recommendations for Future Research .......................................................................... 31
IX. Appendix ........................................................................................................................ 33
X. References ...................................................................................................................... 34
Acknowledgements .................................................................................................................. 36
Author Notes ............................................................................................................................ 36
Social Norms Campaign Strategy | Final ReportM
OST
OF U
S DO
n’T
DRin
k an
D DR
ive
��
liST OF FiGUReS
Figure 1: Actual Gender Norms versus Young Adult Perceptions of Gender Norms
Figure 2: Western Counties Selected for Experimental Intensive Media Intervention
Figure 3: MOST of Us Prevent Drinking and Driving Campaign Posters
Figure 4: Intervention, Buffer and Control Counties
Figure 5: Percent Recalling Social Norms Message About Drinking as the Main Message
Figure 6: Percent Recalling Any Social Norms Message About Drinking in Last 12 Months (including prompting with examples if no voluntary recall)
Figure 7: Percent Thinking the Average Montanan Their Age Has Driven Within One Hour of Consuming Two or More Drinks in the Past Month
Figure 8: Percent Perceiving Majority of Same Age Montanans Almost Always Have a Designated Non-Drinking Driver with Them When Drinking and Will Be Riding in a Car Later
Figure 9: Percent Driving After Having Two or More Drinks Within the Hour in Past Month
Figure 10: Percent Reporting They Always Make Sure They Have a Designated Non-Drinking Driver Before They Consume Alcohol if They Will Be Riding in a Car Later
Figure 11: Percent Supporting Changing BAC Legal Limit for Driving to 0.08-percent
liST OF TableS
Table 1: Percent of 18-to-24-year-old Montanans Who Reported Driving After Last Time Drinking by Main Type of Media Prevention Message Recalled
Table 2: Demographic Characteristics of Statewide Telephone Samples
Table 3: MOST of Us Media Activities
Table 4: Significance Tests for the Intervention/Control County Differences in the Item Change of Proportions Between November 2001 and June 2003
Social Norms Campaign Strategy | Final Report
WW
W.M
OSTO
FUS.
ORG
�
abSTRaCT
Object�ve: To test the efficacy of a high-intensity social norms media intervention to reduce the prevalence of driving after drinking among 21-to-34-year-olds living in western Montana.
Method: The efficacy of a high-intensity social norms media campaign was tested in this quasi-experimental controlled design. A baseline survey collected self-reported data on the target population’s behavior with respect to impaired driving, as well as on its perceptions of the behavior of their peers. Normative messages and media were developed from these data. Approximately half of the 21-to-34-year-olds in the State reside in 15 of its western counties. These Montana counties served as a high-dosage paid social norms media intervention area and were exposed to high levels of campaign television, radio, newspaper, billboard, and movie slide advertisements; 26 eastern counties served as a low-dosage control environment and were exposed only to low levels of free media (television and radio public service announcements) and paid newspaper advertisements. Promotional items bearing the campaign message were distributed statewide. In order to make the paid media intervention as powerful as possible, fear-producing, deterrent-based media efforts were eliminated or severely restricted in the treatment counties.
Random samples of the target population were surveyed a total of four times. At Time 1 (No-vember 2001) and Time 2 (November 2002) 1,000 respondents were surveyed. At Time 3 (March 2003) 1,005 respondents were surveyed; at Time 4 (June 2003) a reduced sample of 517 respondents was surveyed. Ten- to twelve-minute telephone interviews were conducted at each time point by trained interviewers through a computer-assisted telephone interview-ing laboratory. Each survey gathered information on respondents’ exposure to the campaign message, and on their perceptions and reported behaviors regarding driving after drinking. Results: The campaign successfully reduced the target population’s misperceptions of the frequency of impaired driving among their peers. When compared to the control counties, follow-up surveys found a 7.5-percent relative decrease in the percentage who believed the average Montanan their age drove after drinking during the previous month and an 11.0-percent relative increase in the percentage who accurately perceived that the majority of their peers use a non-drinking designated driver. The change in perceptions was associated with a change in reported behavior. In the target area there was a 13.7-percent relative decrease in the percentage that reported personally driving after drinking and a 15.0-percent relative increase in the percentage that reported always using non-drinking designated drivers. The campaign also affected attitudes towards impaired driving enforcement policy. Target county residents reported a 16.5-percent relative increase in the percentage who would support passing a law to decrease the blood alcohol concentration (BAC) legal limit for driving to 0.08 percent from 0.10 percent.
Conclus�ons: A high-intensity paid media social norms intervention can be successful on a statewide scale, across a variety of measures including perceptions, reported behaviors, attitudes, and support for policy. Self-reported surveys are a reliable and widely used method of data collection. However, the results of the data reported by respondents could not be corroborated with changes in BAC of arrested drivers or numbers of alcohol-related fatalities due to accessibility and availability of BAC data of arrested drivers.

Social Norms Campaign Strategy | Final Report
WW
W.M
OSTO
FUS.
ORG
�
eXeCUTive SUMMaRY
T he social norms approach, which communicates the accurate, positive norms already existent in populations, has proven effective in reducing the commonly held myths and misperceptions that contribute to risky behavior, and thus has led to reductions in risky
behavior itself.
Although there is compelling data about the efficacy of this strategy, most social norms interventions have targeted discrete, confined populations such as students at public schools or on college campuses. Additionally, most have taken the form of case studies, which lack matched control sites that can strengthen conclusions regarding program impact.
The project described in this report is titled the MOST of Us Prevent Drinking and Driving campaign. It was the first demonstration applying social norms theory to the problem of impaired driving in a large statewide population. This controlled social norms intervention was designed to reduce risky driving after drinking behavior among Montana’s young adults ages 21 to 34, a group that has been over-represented in alcohol-related crashes statewide. An initial campaign survey found that while only 20.4 percent of Montana young adults reported having driven within one hour of consuming two or more drinks in the previous month, 92 percent of respondents perceived that the majority of their peers had done so. Such a disparity between perception and behavior is precisely what social norms theory predicts, and by correcting this misperception, the MOST of Us Prevent Drinking and Driving campaign was able to reduce the prevalence of reported driving after drinking in its target population.
With funding from the National Highway Traffic Safety Administration (NHTSA) and the Montana Department of Transportation (MDT), a 15-month media campaign was carried out in a 15-county intervention area in the western portion of Montana. This intervention area is home to half of the State’s 21-to-34-year-old population. This quasi-experimental intervention exposed the selected counties to high doses of the social norms message, and then compared the resulting changes in perceptions, attitudes, and behaviors with the eastern Montana counties that served as the control group. The treatment counties were dosed with high-intensity, paid social norms radio and television commercials, theater slides, posters, billboards, local and college newspaper advertisements, and promotional items bearing social norms messages. A low-dosage control area in the eastern half of the State was exposed to low levels of free media, local and college newspaper advertisements, and promotional items. These campaign media in both the high- and low-dosage areas communicated the normative message that MOST Montana Young Adults (4 out of 5) Don’t Drink and Drive. Additional messages focused on the use of designated drivers and other protective factors, and some were tailored to particular markets with county-specific statistics. According to social norms theory, fear-based media efforts can compete with positive social norms messages by solidifying already-exaggerated misperceptions about the prevalence of impaired driving. For this reason, specific controls were used to eliminate or severely restrict the use of fear-based media efforts in the treatment counties. The non-targeted counties across the remainder of the State were allowed to operate with traditional fear-based campaign themes.
Social Norms Campaign Strategy | Final ReportM
OST
OF U
S DO
n’T
DRin
k an
D DR
ive
�
A baseline and three follow-up surveys were conducted at various points before, during, and after the campaign. In each survey, representative samples of respondents in both the treatment and control areas were asked identical questions about their attitudes and behaviors about impaired driving, as well as questions about their perceptions of the norms for these attitudes and behaviors among their peers. Analysis of this self-reported data showed unequivocally that the high-intensity social norms campaign improved the accuracy of the target audience’s perceived norms and increased its healthy, preventative attitudes and reported behaviors regarding impaired driving. Compared to data from the control counties, statistically significant results among young adults in the targeted counties showed:
◆ a 24.8-percent relative increase in recall of campaign messages about the majority norms regarding not driving while impaired;
◆ a 7.5-percent relative decrease in the percentage that believed the average Montanan their age drove after drinking during the previous month;
◆ an 11.0-percent relative increase in the percentage that accurately perceived the majority of their peers use a non-drinking designated driver;
◆ a 13.7-percent relative decrease in the percentage that reported personally driving after drinking;
◆ a 15.0-percent relative increase in the percentage that reported always using non-drinking designated drivers;
◆ a 16.5-percent relative increase in the percentage who would support passing a law to decrease the BAC legal limit for driving to 0.08 from 0.10.
By the end of the campaign, young adults in the intervention counties were seeing the normative environment more accurately in comparison to their counterparts in the control counties. The correction of their misperceptions about the pervasiveness of driving after drinking among their peers led to positive changes in their personal attitudes and to a reduction in reported frequency of risky behaviors. In contrast, young adults residing in the control counties who were exposed to the traditional fear-based messages reported increased risks associated with impaired driving.
This research provides practical implications for traffic safety programmers and signals the need for future research on the behavior-changing potential of promoting positive norms.
Social Norms Campaign Strategy | Final Report
WW
W.M
OSTO
FUS.
ORG
�
i. inTRODUCTiOn anD baCkGROUnD
T remendous advances in traffic safety have been made over the past two decades, with most successes coming from advances in engineering and changes in driver behavior. While new developments in automotive technology will continue to make automobiles
more crashworthy, the best-engineered car is only as safe as the person who drives it. For this reason, the personal and social domains – those of individual perceptions, attitudes, behaviors, and social understanding – must remain a major focus of efforts to improve the safety of our roads. This is especially true in the reduction of alcohol-related crashes and fatalities, which are entirely caused by personal choices and behavior and are therefore 100-percent preventable.
Rates of impaired driving in Montana are disturbing. In 2002, Montana ranked first in the nation for alcohol-related fatalities per Vehicle Miles Traveled (VMT), up from fourth in 1999.15 13 Although the State achieved a 60-percent reduction in alcohol-related crashes between the 1980s and the mid-1990s,11 progress has since stalled. Alcohol and/or drug-related crashes account for approximately 10 percent of all car crashes in the State, a figure that has been holding steady for the past five years.12
As in other States, differences exist between sub-populations and their relative representation in traffic injuries and fatalities. In Montana, young adults play a disproportionate role in incidence of crashes involving driver impairment. In 2002, 21-to-39-year-olds represented less than a third of the State’s licensed drivers, but were involved in nearly half of its alcohol- and drug-related crashes, with 21-to-24-year-olds having the highest percentage involvement.12
A common assumption drawn from this kind of data is that an underinformed public is not sufficiently aware of the serious consequences of impaired driving. If only the public perceived the urgency and seriousness of the problem, the logic goes, its behavior would change. But while most health and social justice groups vie for a share of the public’s attention, traffic safety advocates have been highly successful at putting the seriousness of impaired driving at the forefront of public awareness. Surveys from NHTSA have shown that Americans consider impaired driving a more pressing social issue than health care, poverty, or education.14 Clearly, widespread public awareness and concern for the prevention of impaired driving has not been enough to fuel continued success in reducing the number of alcohol-related crashes and fatalities.
This situation underscores the need for new research to help illuminate the ways in which media could be used to increase the protective factors and decrease the risk factors associated with impaired driving in young adults.
Social Norms Campaign Strategy | Final ReportM
OST
OF U
S DO
n’T
DRin
k an
D DR
ive
�
ii. a neW aPPROaCH TO PRevenTiOn
The Soc�al norms approach to Prevent�on
Montana’s MOST of Us Don’t Drink and Drive campaign is based on social norms theory, which maintains that our individual behavior is strongly influenced by our perceptions of the attitudes and behaviors of our peers. If people think harmful
behavior is typical, they are more likely to engage in it. If they think protective behavior is typical, then that type of behavior holds sway. For example, if young people hold an exaggerated idea of the rate of alcohol, drug, or tobacco use of their peers, they are more vulnerable to experimenting with, increasing, or continuing their own risky behavior.
Social norms programs focus on changing people’s commonly held, erroneous beliefs and perceptions about peer norms. This innovative, science-based approach to health promotion has a demonstrated track record of changing perceptions, attitudes, and behaviors in a variety of target groups and on an increasingly broad range of issues.19 The social norms approach to prevention emerged as a way of explaining and shaping human behavior based upon the powerful role of perceptions.20 The promise of and growing track record of social norms programs led MDT and NHTSA to grant the necessary funds to test out this approach in a demonstration project in Montana.
Percept�ons and Soc�al norms
Soc�al norms are simply the actual majority behaviors or attitudes of the people in any given community or group. For example, if most people in a community do not smoke, then not smoking is the social norm. Not smoking is normal, acceptable, perhaps even expected in that population.
Percept�ons of soc�al norms are people’s beliefs about the actual behavioral or attitudinal norms of their peers. Perceptions of social norms play an extremely important role in shaping our individual behavior. Our perception of what is acceptable, majority behavior – how fast we think “most people” drive, whether we think “most people” wear safety belts, how many drinks we think “most people” have before getting behind the wheel – play a large role in our own behavioral decisions. When we perceive that there is social support for or against certain activities, we are more likely to modify or continue our behavior to act in accordance with how we believe others behave or feel about an issue.
M�spercept�ons of actual norms: The H�dden R�sk Factor
The relationship between perceptions and behavior becomes more complex when we discover that most people do not accurately perceive the social norms of their peers. Social norms studies have found, again and again, that people hold remarkably exaggerated views of the risk-taking behavior of their peers.19 Identifying and reducing the often great disparity between perceived and actual norms is the basis of the social norms approach to prevention.16 19 Social norms interventions have shown that if people’s perceptions are corrected to reflect the less risky, more protective behaviors that are the actual norms in their communities, they are more likely to behave in accordance with those positive standards.1 19

Social Norms Campaign Strategy | Final Report
WW
W.M
OSTO
FUS.
ORG
�
For example, intensive social norms media campaigns were implemented at several college campuses to counteract student over-exaggerations of the prevalence of heavy episodic drinking. As the students grew informed about the actual majority norms of moderate alcohol use, each campus measured 18- to 21-percent reductions in high-risk drinking in as little as two years, against a national backdrop which remained virtually unchanged.3 4 5 18 21
Causes of M�spercept�ons
Why do misperceptions occur? Several factors may contribute, ranging from the way we mentally process information to the kinds of cultural stimuli we receive.16 18 First, we tend to think that unusual behaviors exhibited by other people are typical of them, whether or not this is the case (an “attribution error,” as it is described by psychologists). We assume that the behavior we observe in others is characteristic of them, even if it is a once-a-year or once-in-a-lifetime occurrence. We do this because we do not have enough information about most other people to contextualize such behavior as rare when we hear about or see it happening.
Second, casual conversation tends to focus on the escapades of peers who exhibit extreme or high-risk behaviors. Talk among friends usually emphasizes and exaggerates atypical, risky behaviors rather than the statistically normal behaviors that regularly occur. This amplified talk about the risky behavior, in turn, leads many to think such actions are normative.
The third factor involves the influential role of entertainment and the mass media, which is in the business of delivering sensational, memorable material. We are typically attracted to fictional stories and news coverage about the most dramatic, arresting, or shocking events. Information that is particularly vivid or emotionally evocative (such as media coverage of automobile crashes, or prevention campaigns that show gruesome images of the impacts of impaired driving) tends to have increased impact upon our perceptions, leading to exaggerated ideas about frequency and prevalence. Meanwhile, some of the most common killers of Americans – obesity, stroke and heart disease – seem to go relatively unnoticed. Thus, the process of media attending to and disregarding information contributes to the misperception of actual norms.
Consequences of M�spercept�ons
Misperceptions have been shown to fuel a less-protective social environment among college students with regard to alcohol abuse.18 The same is likely true of the misperceptions that exist in larger, statewide populations of young adults.8 People with ambivalent attitudes about a particular high-risk activity might nonetheless engage in it if they perceive it as the norm. Meanwhile, those people already at the high-risk end of the continuum will wrongly think their behavior is the acceptable practice of the majority, and this misperception perversely reinforces their high-risk behavior. Opposition or intervention by others to prevent high-risk behavior is also inhibited in an environment characterized by widespread misperceptions. People are reluctant to be “the only one” to refrain from a behavior or to intervene in their friends’ behavior if, in so doing, they risk social disapproval. Misperceptions of the prevalence of impaired driving and of permissive attitudes about it could similarly create a more risky behavioral environment. People are less likely to designate a non-drinking driver or take the keys away from someone who has been drinking if they think most others would not take these protective actions.
Social Norms Campaign Strategy | Final ReportM
OST
OF U
S DO
n’T
DRin
k an
D DR
ive
�
The Sc�ence of the Pos�t�ve versus Fear Tact�cs
Most people make positive decisions about their personal health and safety. Various social norms interventions have found that most people wear safety belts, drink moderately, and are drug- and tobacco-free.cf. 10 8 9 22 However, many prevention campaigns choose to highlight and publicize the dangerous activity of the minority, ignoring the fact that healthy, protective choices are normative. Fear, threats, shame, and anxiety are used in an attempt to scare people into good behavior. Inflating peoples’ fears can backlash against the goal of health promotion, however, and can even do demonstrable harm.2 6
Social norms campaigns do not include frightening, threatening messages, nor do they seek to forbid people from engaging in certain behaviors. The lack of an explicit “don’t do it” message does not mean that undesirable behaviors like impaired driving are supported or condoned. By providing people with clear, accurate information about the standards of behavior that exist in their communities, social norms campaigns change people’s misperceptions about their peers’ behavior. Misinformed decisions become informed decisions, and individuals become active stakeholders in their own community environments.
Social Norms Campaign Strategy | Final Report
WW
W.M
OSTO
FUS.
ORG
�
iii. THe MOnTana SOCial nORMS PROJeCT
The Montana Social Norms Project (MSNP) was started in 1998 with a grant from the Montana Department of Transportation. At that time, social norms campaigns had already proven successful at reducing high-risk drinking at several college campuses
nationwide.18 This initial grant allowed MSNP to begin implementing its pioneering effort to apply social norms theory to a large, statewide, non-campus population.
The Montana Model of Soc�al norms Market�ng
Implementing the first statewide social norms campaign called for the development of a model allowing for the application of successful social norms strategies on a wider, macro level. The Montana Model of Social Norms Marketing7 is a seven-step process that combines social marketing with the social norms approach to prevention. It is a social norms marketing model that can work on statewide level for a variety of issues, turning social science into social action by correcting misperceptions and building upon the positive attitudinal and behavioral norms that already exist in a culture. The Montana Model has been the foundation of several other MSNP campaigns, on issues ranging from tobacco use among teenagers to adult safety belt use.
Montana Young adult alcohol Phone Survey
In the spring of 1998, MSNP formulated and conducted the first Montana Young Adult Alcohol Phone Survey, a statewide phone canvass of 500 18-to-24-year-olds.8 Subjects were asked questions about their own alcohol consumption and a companion set of questions about their perceptions of the drinking behaviors of their peers. This survey was used to determine whether misperceptions existed in this statewide population of young adults.
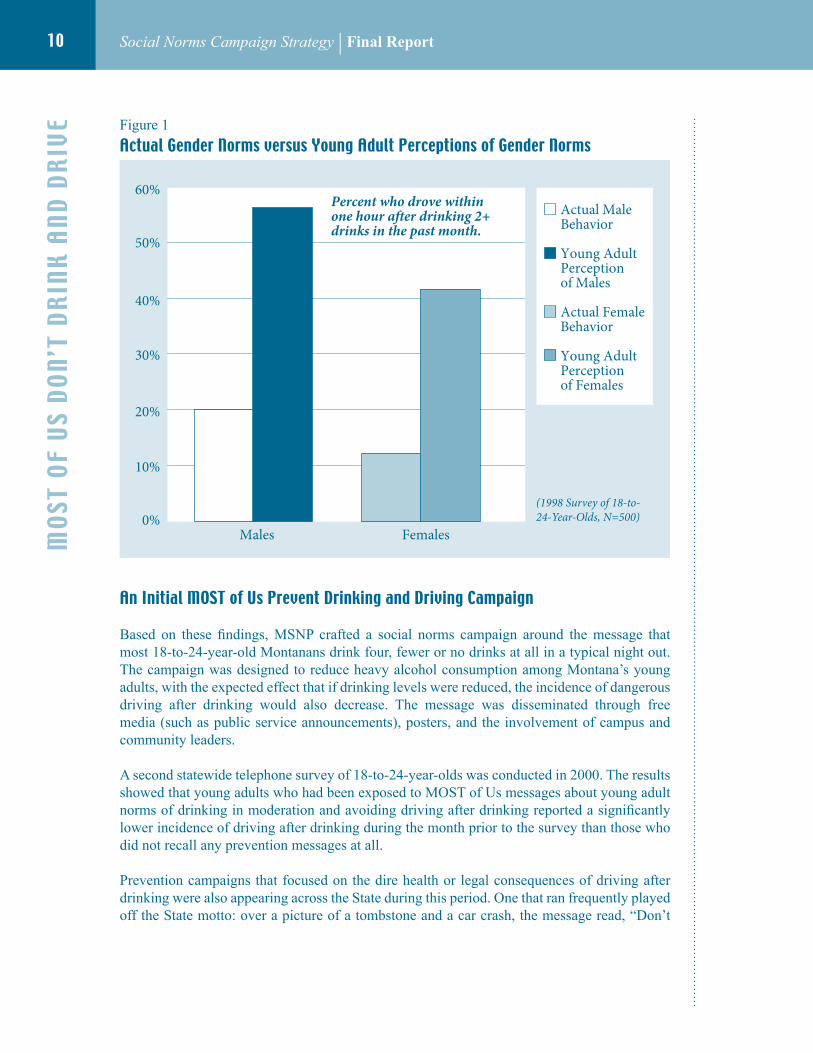
The young adults in this sample overwhelmingly reported moderation – or even total abstinence – as their predominant drinking behavior. Eighty-one percent reported they consumed four or fewer drinks during a typical night out, or chose not to drink at all. The average amount consumed by men was three drinks; for women, the average was two drinks. The average perception of the norm was quite different. Young adult men and women in Montana perceived that men their age were typically consuming seven drinks and that women their age were typically consuming five. In regard to drinking after driving, only 15 percent reported that they had driven within one hour of consuming two or more drinks during the previous month, but 96 percent believed that the average Montanan their age had done so. In spite of their own widely reported moderate behavior, respondents greatly over-exaggerated the frequency of excessive drinking and the prevalence and acceptance of driving after drinking among their peers. This result is just what social norms theory predicts: that individuals tend to exaggerate the rate at which their peers engage in dangerous behaviors, and simultaneously underestimate the ways in which community behavior mitigates towards health and safety. Figure 1 displays the extreme disparity between the actual norm, based on the aggregate of reported personal behaviors, and the perceived frequency of driving after drinking among the surveyed population.
Social Norms Campaign Strategy | Final ReportM
OST
OF U
S DO
n’T
DRin
k an
D DR
ive
�0
Figure 1
actual Gender norms versus Young adult Percept�ons of Gender norms
an in�t�al MOST of Us Prevent Dr�nk�ng and Dr�v�ng Campa�gn
Based on these findings, MSNP crafted a social norms campaign around the message that most 18-to-24-year-old Montanans drink four, fewer or no drinks at all in a typical night out. The campaign was designed to reduce heavy alcohol consumption among Montana’s young adults, with the expected effect that if drinking levels were reduced, the incidence of dangerous driving after drinking would also decrease. The message was disseminated through free media (such as public service announcements), posters, and the involvement of campus and community leaders.
A second statewide telephone survey of 18-to-24-year-olds was conducted in 2000. The results showed that young adults who had been exposed to MOST of Us messages about young adult norms of drinking in moderation and avoiding driving after drinking reported a significantly lower incidence of driving after drinking during the month prior to the survey than those who did not recall any prevention messages at all.
Prevention campaigns that focused on the dire health or legal consequences of driving after drinking were also appearing across the State during this period. One that ran frequently played off the State motto: over a picture of a tombstone and a car crash, the message read, “Don’t
Actual MaleBehavior
Young AdultPerceptionof Males
Actual FemaleBehavior
Young AdultPerceptionof Females
60%
50%
40%
30%
20%
10%
0%
Percent who drove withinone hour after drinking 2+drinks in the past month.
Males Females
(1998 Survey of 18-to-24-Year-Olds, N=500)
Social Norms Campaign Strategy | Final Report
WW
W.M
OSTO
FUS.
ORG
��
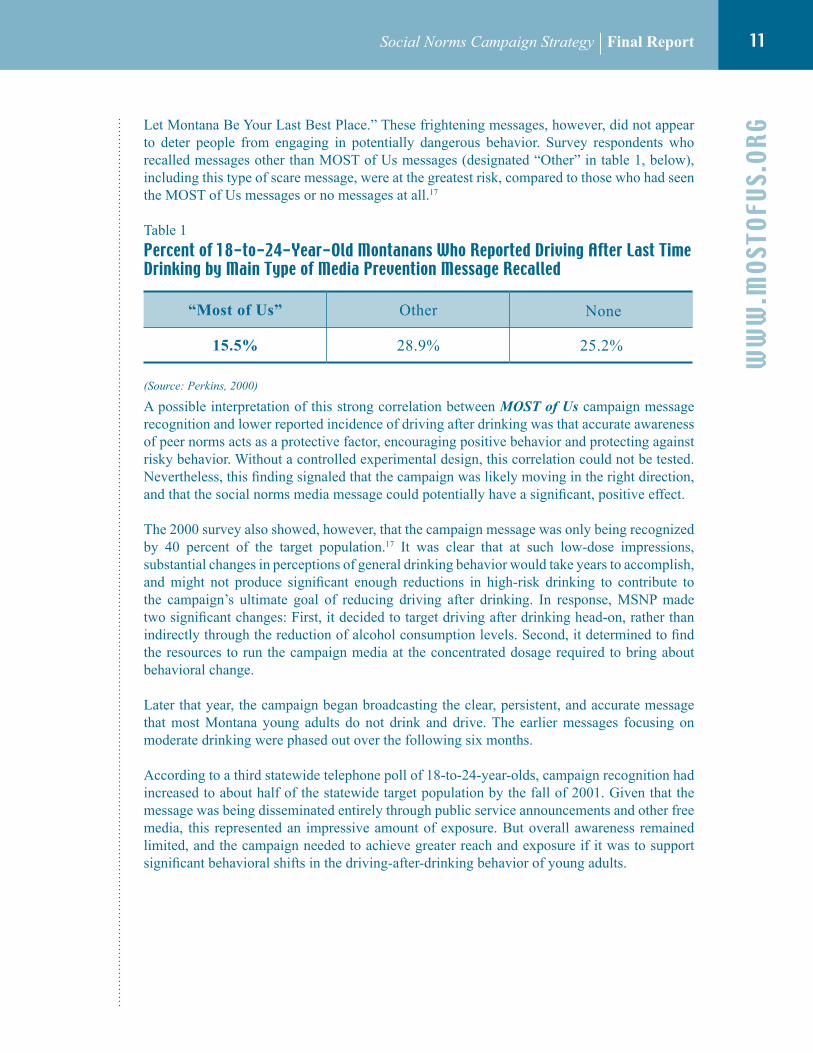
Let Montana Be Your Last Best Place.” These frightening messages, however, did not appear to deter people from engaging in potentially dangerous behavior. Survey respondents who recalled messages other than MOST of Us messages (designated “Other” in table 1, below), including this type of scare message, were at the greatest risk, compared to those who had seen the MOST of Us messages or no messages at all.17
Table 1
Percent of ��-to-2�-Year-Old Montanans Who Reported Dr�v�ng after last T�me Dr�nk�ng by Ma�n Type of Med�a Prevent�on Message Recalled
“Most of Us” Other None
15.5% 28.9% 25.2%
A possible interpretation of this strong correlation between MOST of Us campaign message recognition and lower reported incidence of driving after drinking was that accurate awareness of peer norms acts as a protective factor, encouraging positive behavior and protecting against risky behavior. Without a controlled experimental design, this correlation could not be tested. Nevertheless, this finding signaled that the campaign was likely moving in the right direction, and that the social norms media message could potentially have a significant, positive effect.
The 2000 survey also showed, however, that the campaign message was only being recognized by 40 percent of the target population.17 It was clear that at such low-dose impressions, substantial changes in perceptions of general drinking behavior would take years to accomplish, and might not produce significant enough reductions in high-risk drinking to contribute to the campaign’s ultimate goal of reducing driving after drinking. In response, MSNP made two significant changes: First, it decided to target driving after drinking head-on, rather than indirectly through the reduction of alcohol consumption levels. Second, it determined to find the resources to run the campaign media at the concentrated dosage required to bring about behavioral change.
Later that year, the campaign began broadcasting the clear, persistent, and accurate message that most Montana young adults do not drink and drive. The earlier messages focusing on moderate drinking were phased out over the following six months.
According to a third statewide telephone poll of 18-to-24-year-olds, campaign recognition had increased to about half of the statewide target population by the fall of 2001. Given that the message was being disseminated entirely through public service announcements and other free media, this represented an impressive amount of exposure. But overall awareness remained limited, and the campaign needed to achieve greater reach and exposure if it was to support significant behavioral shifts in the driving-after-drinking behavior of young adults.
(Source: Perkins, 2000)

Social Norms Campaign Strategy | Final ReportM
OST
OF U
S DO
n’T
DRin
k an
D DR
ive
�2
iv. a HiGH-inTenSiTY SOCial nORMS MeDia inTeRvenTiOn
I n the fall of 2001, MSNP received a grant from NHTSA to implement a demonstration program testing the ability of a high-visibility, high-intensity paid media campaign to change perceptions and reported behaviors associated with alcohol-related crashes. The
NHTSA grant, combined with ongoing grant resources from MDT, presented the opportunity to build upon the campaign foundation that had been established during the previous three years and fully test the potential of the social norms model.
establ�sh�ng an exper�mental Des�gn
In order to evaluate the effectiveness of this intense media intervention, a new experimental design was created to allow comparison of two different levels of social norms media exposure. A high-dosage paid media intervention area was established in 15 western Montana counties; this area would be compared to the low-dosage free media environment of the rest of the State. By focusing the paid media on a limited, regional market rather than using these resources to dose the entire State, MSNP was able to achieve the level of message saturation in the intervention area necessary to see measurable, statistically significant changes in behavior. This new, quasi-experimental design increased the scientific rigor of the project by allowing for a controlled test of the efficacy of the social norms approach to reduce impaired driving in a statewide population of young adults.
In order to make the paid media intervention as powerful as possible, fear-producing media efforts (such as ads that show mangled cars or child-sized coffins) were eliminated or severely restricted in the treatment counties. According to social norms theory, fear-based media efforts compete with positive social norms messages by solidifying already-exaggerated misperceptions about the prevalence of impaired driving, and thereby potentially reduce the impact of a social norms campaign. The low-dosage counties across the remainder of the State were allowed to operate with popular fear-based campaign themes.
In addition to implementing a new experimental design, MSNP chose to focus on a larger group of young adults of legal drinking age, 21-to-34-year-olds. This demographic group is also of particular interest given its high percentage involvement in alcohol-related crashes.
Select�ng the Campa�gn Target area
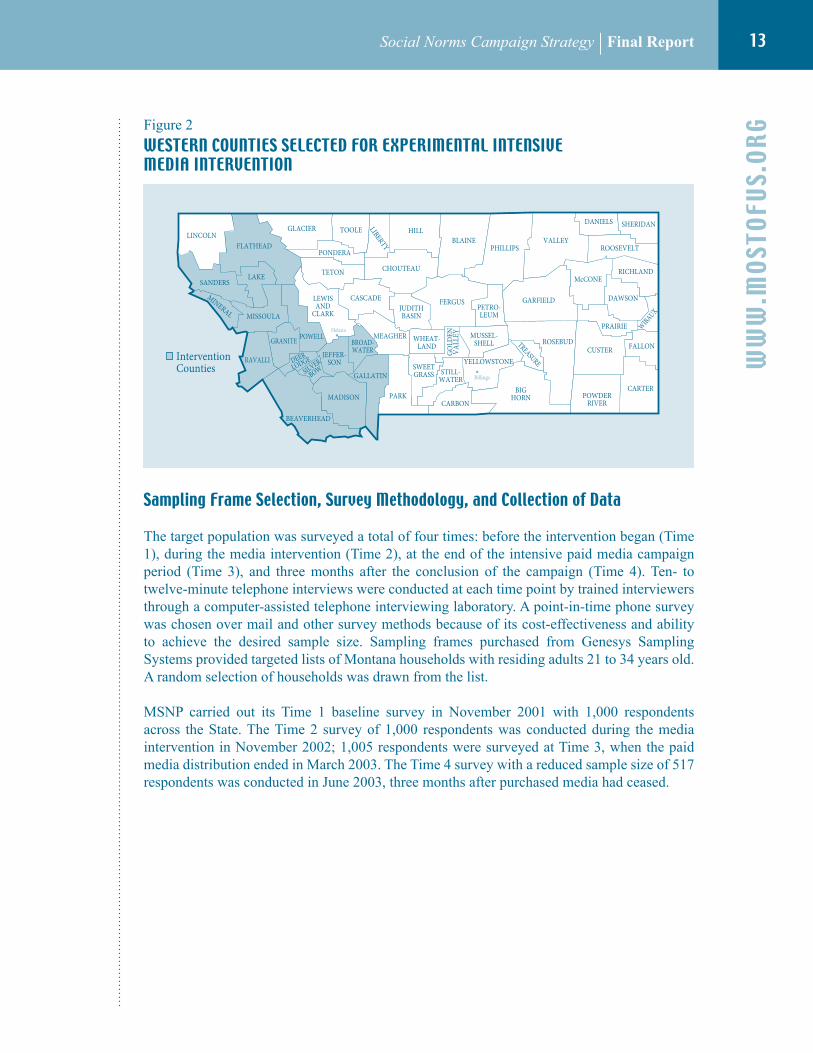
Fifteen western counties in Montana (Beaverhead, Broadwater, Deer Lodge, Flathead, Gallatin, Granite, Jefferson, Lake, Madison, Mineral, Missoula, Powell, Ravalli, Sanders, and Silver Bow) were selected as the campaign intervention area (see figure 2, page 13). Although these intervention counties cover only one quarter of the geographical area of the State, they are home to almost 50 percent of Montana’s 21-to-34-year-old population.23 Furthermore, this area comprises two Designated Marketing Areas (DMAs) for media distribution: the Butte/Bozeman market and the Missoula/Kalispell market. By purchasing airtime solely within these two DMAs, MSNP was able to reach all of the 15-county intervention area with the paid media placement while limiting such media exposure elsewhere.
Social Norms Campaign Strategy | Final Report
WW
W.M
OSTO
FUS.
ORG
��
Figure 2
WeSTeRn COUnTieS SeleCTeD FOR eXPeRiMenTal inTenSive MeDia inTeRvenTiOn
Sampl�ng Frame Select�on, Survey Methodology, and Collect�on of Data
The target population was surveyed a total of four times: before the intervention began (Time 1), during the media intervention (Time 2), at the end of the intensive paid media campaign period (Time 3), and three months after the conclusion of the campaign (Time 4). Ten- to twelve-minute telephone interviews were conducted at each time point by trained interviewers through a computer-assisted telephone interviewing laboratory. A point-in-time phone survey was chosen over mail and other survey methods because of its cost-effectiveness and ability to achieve the desired sample size. Sampling frames purchased from Genesys Sampling Systems provided targeted lists of Montana households with residing adults 21 to 34 years old. A random selection of households was drawn from the list.
MSNP carried out its Time 1 baseline survey in November 2001 with 1,000 respondents across the State. The Time 2 survey of 1,000 respondents was conducted during the media intervention in November 2002; 1,005 respondents were surveyed at Time 3, when the paid media distribution ended in March 2003. The Time 4 survey with a reduced sample size of 517 respondents was conducted in June 2003, three months after purchased media had ceased.
BEAVERHEAD
BIGHORN
BLAINE
BROAD-WATER
CARBON
CARTER
CASCADE
CHOUTEAU
CUSTER
DANIELS
DAWSON
DEERLODGE
FALLON
FERGUS
FLATHEAD
GALLATIN
GARFIELD
GLACIER
GOLD
ENVA
LLEY
GRANITE
HILL
JEFFER-SON
JUDITHBASIN
LAKE
LEWISAND
CLARK
LIBERTY
LINCOLN
McCONE
MADISON
MEAGHER
MINERAL MISSOULA
MUSSEL-SHELL
PARK
PETRO-LEUM
PHILLIPSPONDERA
POWDERRIVER
POWELLPRAIRIE
RAVALLI
RICHLAND
ROOSEVELT
ROSEBUD
SANDERS
SHERIDAN
SILVER
BOW STILL-WATER
SWEETGRASS
TETON
TOOLE
TREASURE
VALLEY
WHEAT-LAND
WIBAUX
YELLOWSTONE
Billings
Helena
InterventionCountiesBufferCountiesControlCounties

Social Norms Campaign Strategy | Final ReportM
OST
OF U
S DO
n’T
DRin
k an
D DR
ive
��
Each of the four survey sample groups provided respondents ranging in age from 21 to 34. The demographic characteristics of each sample are reported in table 2.
Table 2
Demograph�c Character�st�cs of Statew�de Telephone Samples
Nov-01 Nov-02 Mar-03 Jun-03N of Cases 1000 1000 1005 517
Gender (%Female) 50.0 50.0 54.6 50.7
Mean Age 28.4 29.5 27.5 27.4
College Student (%) 13.5 10.3 12.1 14.0
Living with a Partner (%) 72.5 68.0 71.7 63.7
Living with a Child (%) 64.7 61.8 63.9 56.3
Lived Most Time in Last Six Months in Western Target County (%)
49.5 49.2 47.9 42.6
Select�on of Message
Using the results of the Time 1 baseline survey, MSNP developed a positive, inclusive social norms message designed to promote the healthy norm in a manner that was credible and appealing to the target group: MOST of Us Don’t Drink and Drive.
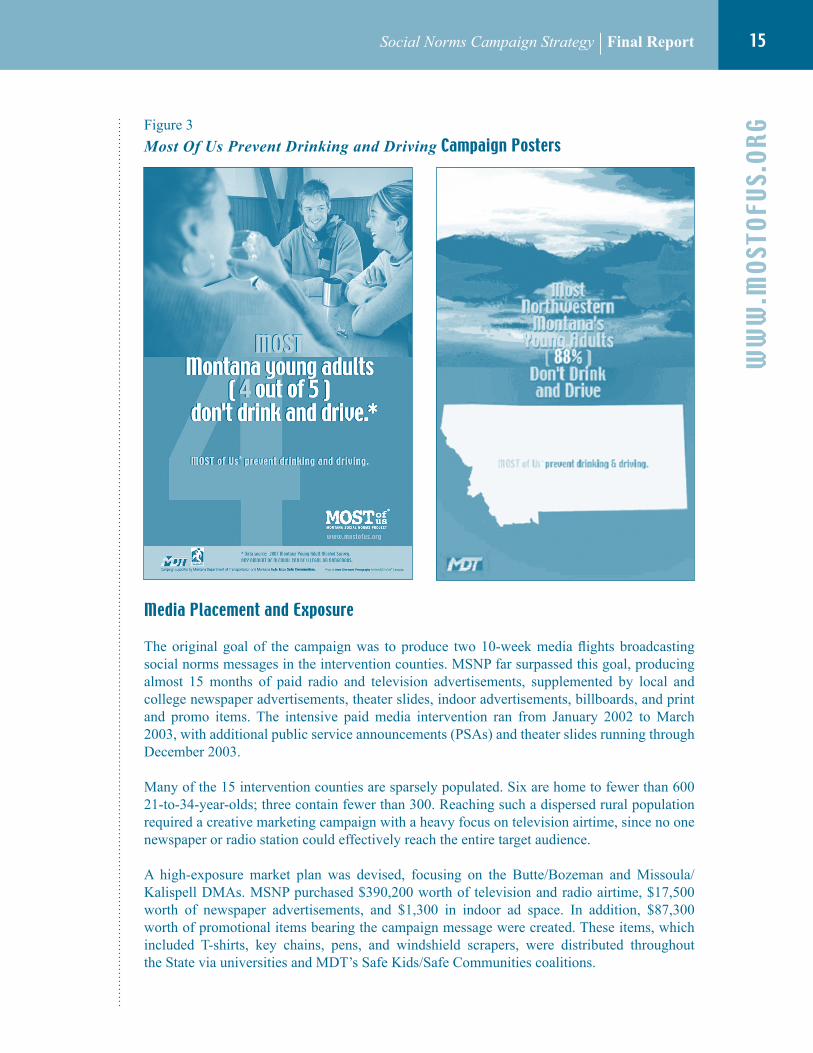
Television, radio, print and theater ads were created, along with various posters and promotional gift items, all unified by this clear, consistent message. Specific ads focusing on statistics (“MOST Montana Young Adults [4 out of 5] Don’t Drink and Drive”), noting the majority practicing protective behaviors (such as taking cabs and using designated drivers) or highlighting the local norms in each intervention county were created under this “umbrella” message.
Social Norms Campaign Strategy | Final Report
WW
W.M
OSTO
FUS.
ORG
��
Figure 3
Most Of Us Prevent Drinking and Driving Campa�gn Posters
Med�a Placement and exposure
The original goal of the campaign was to produce two 10-week media flights broadcasting social norms messages in the intervention counties. MSNP far surpassed this goal, producing almost 15 months of paid radio and television advertisements, supplemented by local and college newspaper advertisements, theater slides, indoor advertisements, billboards, and print and promo items. The intensive paid media intervention ran from January 2002 to March 2003, with additional public service announcements (PSAs) and theater slides running through December 2003.
Many of the 15 intervention counties are sparsely populated. Six are home to fewer than 600 21-to-34-year-olds; three contain fewer than 300. Reaching such a dispersed rural population required a creative marketing campaign with a heavy focus on television airtime, since no one newspaper or radio station could effectively reach the entire target audience.
A high-exposure market plan was devised, focusing on the Butte/Bozeman and Missoula/Kalispell DMAs. MSNP purchased $390,200 worth of television and radio airtime, $17,500 worth of newspaper advertisements, and $1,300 in indoor ad space. In addition, $87,300 worth of promotional items bearing the campaign message were created. These items, which included T-shirts, key chains, pens, and windshield scrapers, were distributed throughout the State via universities and MDT’s Safe Kids/Safe Communities coalitions.
Social Norms Campaign Strategy | Final ReportM
OST
OF U
S DO
n’T
DRin
k an
D DR
ive
��
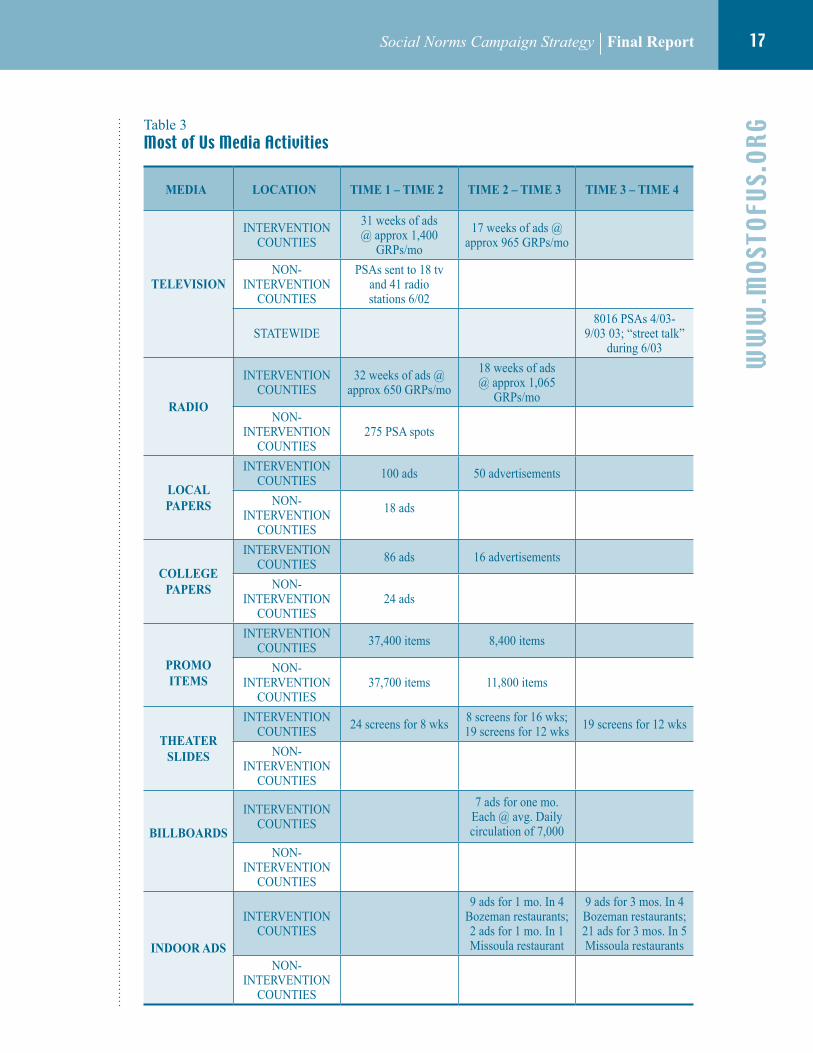
MSNP created nine television advertisements and nine radio advertisements, some of which were “lifts” of the audio from the television ads. These advertisements were always positive in their message and delivery. The television ads aired during two media flights, the first lasting five and a half months, the second lasting six months. The two radio flights lasted six and a half and six months, respectively.
Television and radio advertisements are measured in gross rating points (GRPs), which measure the total volume of delivery of a given message to a specific audience. GRPs are calculated by multiplying ad “reach” (the number of people who see the ad at least once) by “frequency” (the average number of times each person saw the ad). For example, if 1,000 people saw a television ad an average of three times, that ad earned 3,000 GRPs. GRPs are difficult to calculate exactly; for this reason, campaign message delivery was also measured using the exposure testing questions included in the intervention surveys.
According to the calculations of the media placement firm, the first television flight averaged 1,400 GRPs per month on broadcast and 3,100 GRPs per month on cable. The second flight averaged 965 GRPs per month. The first radio flight averaged 650 GRPs per month, the second 1,065 GRPs per month.
In addition, print ads were taken out in four local and four college newspapers, theater slides appeared on over 20 movie screens, and a billboard design appeared in seven locations for a two-month period.
The control portion of the State was dosed with television and radio public service announcements, local and college newspaper ads, and promotional items. It is important to note that other, fear-based media campaigns that were restricted in the intervention counties continued to run throughout the rest of the State during the campaign intervention period. A summary of the social norms campaign media is contained in table 3.
“Horse” TV Commercial
Scene: In a barn, a typical Montana ranch family prepares to ride their horses.Script: In Montana, our best defense against drinking and driving is each other. MOST of Us® Prevent Drinking and Driving. We take care of our friends, our families, and ourselves. Four out of five Montana young adults don’t drink and drive. Thanks for doing your part.Onscreen Tag: Sponsored by the National Highway Traffic Safety Administration.
Social Norms Campaign Strategy | Final Report
WW
W.M
OSTO
FUS.
ORG
��
Table 3Most of Us Med�a act�v�t�es
MEDIA LOCATION TIME 1 – TIME 2 TIME 2 – TIME 3 TIME 3 – TIME 4
TELEVISION
INTERVENTIONCOUNTIES
31 weeks of ads @ approx 1,400
GRPs/mo
17 weeks of ads @ approx 965 GRPs/mo
NON-INTERVENTION
COUNTIES
PSAs sent to 18 tv and 41 radio stations 6/02
STATEWIDE8016 PSAs 4/03-
9/03 03; “street talk” during 6/03
RADIO
INTERVENTIONCOUNTIES
32 weeks of ads @ approx 650 GRPs/mo
18 weeks of ads @ approx 1,065
GRPs/mo
NON-INTERVENTION
COUNTIES275 PSA spots
LOCAL pApERS
INTERVENTIONCOUNTIES 100 ads 50 advertisements
NON-INTERVENTION
COUNTIES
18 ads
COLLEgE pApERS
INTERVENTIONCOUNTIES 86 ads 16 advertisements
NON-INTERVENTION
COUNTIES24 ads
pROMO ITEMS
INTERVENTIONCOUNTIES 37,400 items 8,400 items
NON-INTERVENTION
COUNTIES37,700 items 11,800 items
THEATER SLIDES
INTERVENTIONCOUNTIES 24 screens for 8 wks 8 screens for 16 wks;
19 screens for 12 wks 19 screens for 12 wks
NON-INTERVENTION
COUNTIES
BILLBOARDS
INTERVENTIONCOUNTIES
7 ads for one mo. Each @ avg. Daily circulation of 7,000
NON-INTERVENTION
COUNTIES
INDOOR ADS
INTERVENTIONCOUNTIES
9 ads for 1 mo. In 4 Bozeman restaurants; 2 ads for 1 mo. In 1 Missoula restaurant
9 ads for 3 mos. In 4 Bozeman restaurants; 21 ads for 3 mos. In 5 Missoula restaurants
NON-INTERVENTION
COUNTIES
Social Norms Campaign Strategy | Final ReportM
OST
OF U
S DO
n’T
DRin
k an
D DR
ive
��
v. ReSUlTS OF THe MeDia inTeRvenTiOn
evaluat�ng a Soc�al norms Med�a Campa�gn
A social norms media intervention works in three stages:
1. The target group is exposed to high levels of the social norms campaign message;2. Repeated exposure to this message works to correct the target audience’s misperceptions
about its peers’ attitudes and behavior;3. These new, more accurate perceptions of peers help shift individual behavior in the
direction of actual norms.
Thus, there are three key evaluation questions in assessing the progress and success of a social norms campaign:
1. Did the campaign provide social norms message exposure?2. Did the campaign impact perceptions of peer norms?3. Did the campaign impact personal attitudes and reported behaviors?
This campaign successfully provided social norms message exposure, impacted the perception of peer norms, and changed personal attitudes and reported behaviors. Each of these evaluation questions will be addressed in turn.
Soc�al norms Campa�gn Message exposure
The MOST of Us Prevent Drinking and Driving campaign was designed to strategically test the effectiveness of paid media by separating the State into control and intervention areas. Data regarding campaign message recall collected in the Time 2, Time 3, and Time 4 surveys shows unequivocally that campaign recognition in the intervention counties was significantly higher than in the rest of the State.
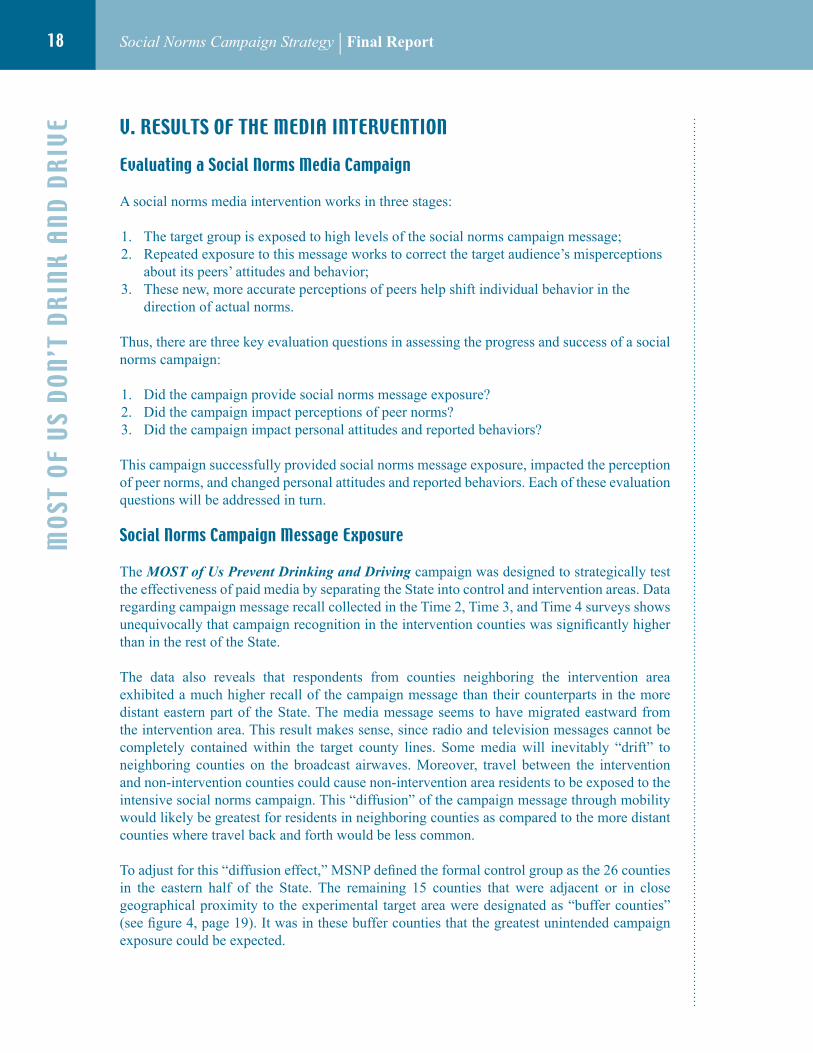
The data also reveals that respondents from counties neighboring the intervention area exhibited a much higher recall of the campaign message than their counterparts in the more distant eastern part of the State. The media message seems to have migrated eastward from the intervention area. This result makes sense, since radio and television messages cannot be completely contained within the target county lines. Some media will inevitably “drift” to neighboring counties on the broadcast airwaves. Moreover, travel between the intervention and non-intervention counties could cause non-intervention area residents to be exposed to the intensive social norms campaign. This “diffusion” of the campaign message through mobility would likely be greatest for residents in neighboring counties as compared to the more distant counties where travel back and forth would be less common.
To adjust for this “diffusion effect,” MSNP defined the formal control group as the 26 counties in the eastern half of the State. The remaining 15 counties that were adjacent or in close geographical proximity to the experimental target area were designated as “buffer counties” (see figure 4, page 19). It was in these buffer counties that the greatest unintended campaign exposure could be expected.
Social Norms Campaign Strategy | Final Report
WW
W.M
OSTO
FUS.
ORG
��
Figure 4intervent�on, buffer and Control Count�es
Unprompted Recall
In each of the four surveys, respondents were asked if they remembered seeing or hearing any alcohol prevention campaign advertisements (posters, radio or television commercials, brochures) and if so, what was the main message they remembered. If they volunteered having heard a message about “most of us,” “the majority,” or “4 out of 5” associated with drinking moderately, not driving after drinking, or using a designated driver, they were identified as recalling a social norms message as the main message.
At the outset of the campaign (Time 1) statewide campaign recognition was just under 52 percent. By the end of the campaign period (Time 3), unprompted recognition of the social norms message as the predominant media message about drinking (compared to recalling other or no message) had risen to 74 percent in the intervention counties. Three months later (Time 4) this level had fallen only slightly, to 71 percent. In the control counties, unprompted campaign recognition initially fell off sharply, to 29 percent at Time 2, but then steadily grew to 37 percent at Time 3 and 43 percent at Time 4. The difference in Time 1 to Time 4 change between the intervention and control counties was 24.8 percent (p≤.001).
BEAVERHEAD
BIGHORN
BLAINE
BROAD-WATER
CARBON
CARTER
CASCADE
CHOUTEAU
CUSTER
DANIELS
DAWSON
DEERLODGE
FALLON
FERGUS
FLATHEAD
GALLATIN
GARFIELD
GLACIER
GOLD
ENVA
LLEY
GRANITE
HILL
JEFFER-SON
JUDITHBASIN
LAKE
LEWISAND
CLARK
LIBERTY
LINCOLN
McCONE
MADISON
MEAGHER
MINERAL MISSOULA
MUSSEL-SHELL
PARK
PETRO-LEUM
PHILLIPSPONDERA
POWDERRIVER
POWELLPRAIRIE
RAVALLI
RICHLAND
ROOSEVELT
ROSEBUD
SANDERS
SHERIDAN
SILVER
BOW STILL-WATER
SWEETGRASS
TETON
TOOLE
TREASURE
VALLEY
WHEAT-LAND
WIBAUX
YELLOWSTONE
Billings
Helena
InterventionCountiesBufferCountiesControlCounties
Social Norms Campaign Strategy | Final ReportM
OST
OF U
S DO
n’T
DRin
k an
D DR
ive
20
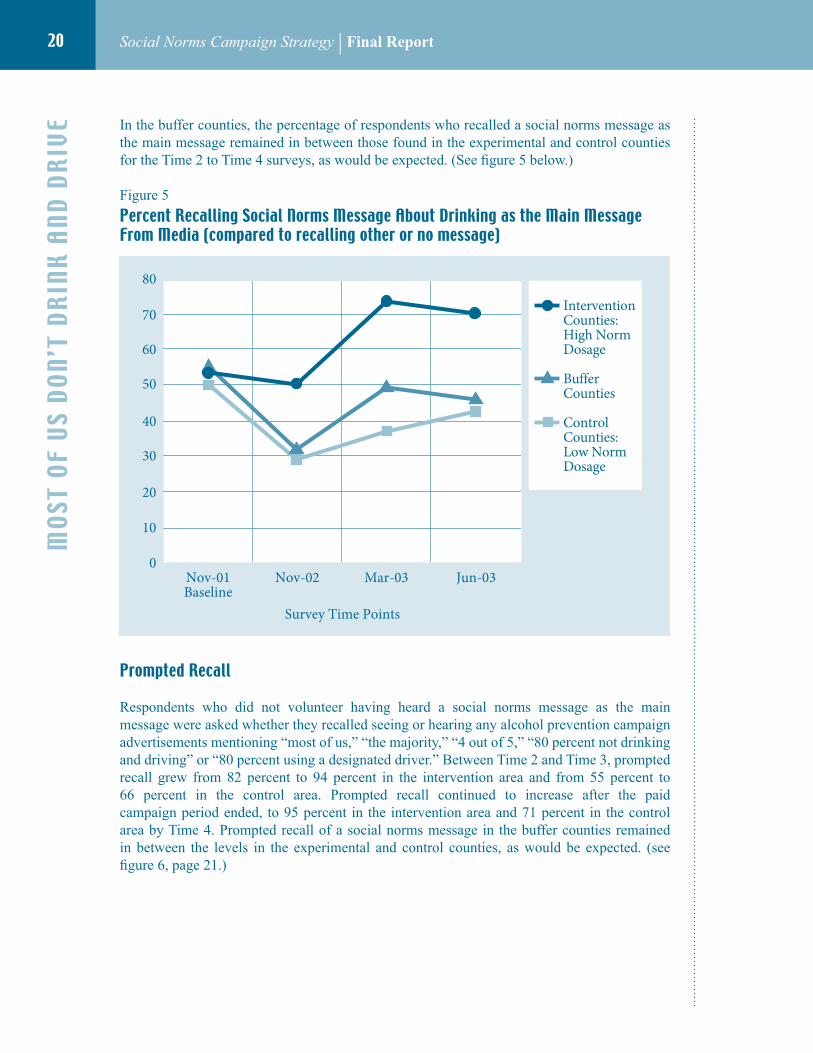
In the buffer counties, the percentage of respondents who recalled a social norms message as the main message remained in between those found in the experimental and control counties for the Time 2 to Time 4 surveys, as would be expected. (See figure 5 below.)
Figure 5
Percent Recall�ng Soc�al norms Message about Dr�nk�ng as the Ma�n MessageFrom Med�a (compared to recall�ng other or no message)
Prompted Recall
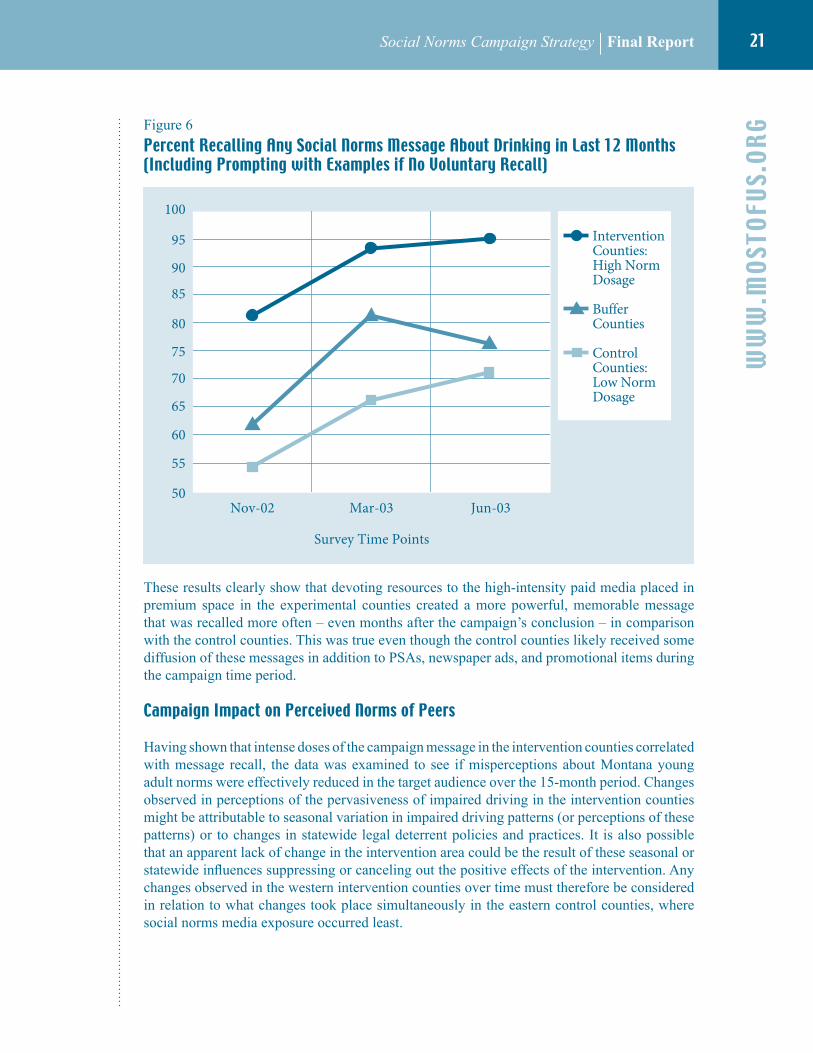
Respondents who did not volunteer having heard a social norms message as the main message were asked whether they recalled seeing or hearing any alcohol prevention campaign advertisements mentioning “most of us,” “the majority,” “4 out of 5,” “80 percent not drinking and driving” or “80 percent using a designated driver.” Between Time 2 and Time 3, prompted recall grew from 82 percent to 94 percent in the intervention area and from 55 percent to 66 percent in the control area. Prompted recall continued to increase after the paid campaign period ended, to 95 percent in the intervention area and 71 percent in the control area by Time 4. Prompted recall of a social norms message in the buffer counties remained in between the levels in the experimental and control counties, as would be expected. (see figure 6, page 21.)
InterventionCounties:High NormDosage
BufferCounties
ControlCounties:Low NormDosage
60
50
40
30
20
10
0
70
80
Nov-01Baseline
Nov-02 Mar-03 Jun-03
Survey Time Points
Social Norms Campaign Strategy | Final Report
WW
W.M
OSTO
FUS.
ORG
2�
Figure 6
Percent Recall�ng any Soc�al norms Message about Dr�nk�ng �n last �2 Months (includ�ng Prompt�ng w�th examples �f no voluntary Recall)
These results clearly show that devoting resources to the high-intensity paid media placed in premium space in the experimental counties created a more powerful, memorable message that was recalled more often – even months after the campaign’s conclusion – in comparison with the control counties. This was true even though the control counties likely received some diffusion of these messages in addition to PSAs, newspaper ads, and promotional items during the campaign time period.
Campa�gn impact on Perce�ved norms of Peers
Having shown that intense doses of the campaign message in the intervention counties correlated with message recall, the data was examined to see if misperceptions about Montana young adult norms were effectively reduced in the target audience over the 15-month period. Changes observed in perceptions of the pervasiveness of impaired driving in the intervention counties might be attributable to seasonal variation in impaired driving patterns (or perceptions of these patterns) or to changes in statewide legal deterrent policies and practices. It is also possible that an apparent lack of change in the intervention area could be the result of these seasonal or statewide influences suppressing or canceling out the positive effects of the intervention. Any changes observed in the western intervention counties over time must therefore be considered in relation to what changes took place simultaneously in the eastern control counties, where social norms media exposure occurred least.
InterventionCounties:High NormDosage
BufferCounties
ControlCounties:Low NormDosage
90
80
75
65
60
55
50
95
100
Nov-02 Mar-03 Jun-03
Survey Time Points
70
85
Social Norms Campaign Strategy | Final ReportM
OST
OF U
S DO
n’T
DRin
k an
D DR
ive
22
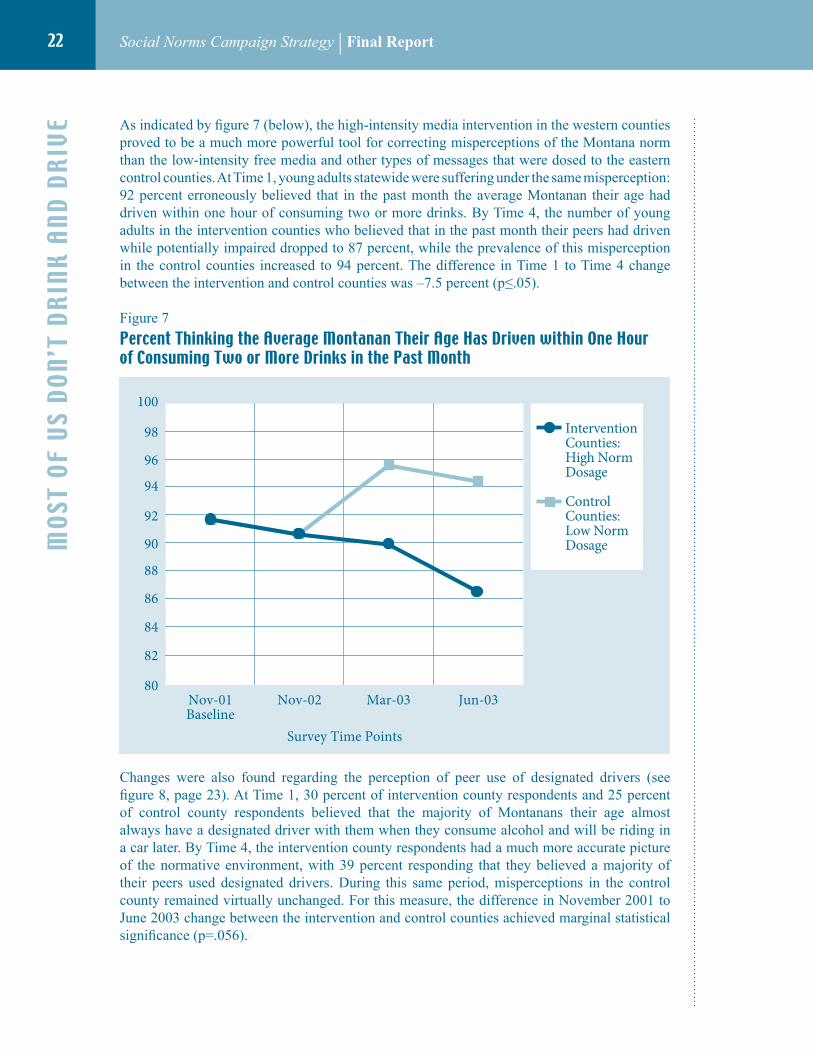
As indicated by figure 7 (below), the high-intensity media intervention in the western counties proved to be a much more powerful tool for correcting misperceptions of the Montana norm than the low-intensity free media and other types of messages that were dosed to the eastern control counties. At Time 1, young adults statewide were suffering under the same misperception: 92 percent erroneously believed that in the past month the average Montanan their age had driven within one hour of consuming two or more drinks. By Time 4, the number of young adults in the intervention counties who believed that in the past month their peers had driven while potentially impaired dropped to 87 percent, while the prevalence of this misperception in the control counties increased to 94 percent. The difference in Time 1 to Time 4 change between the intervention and control counties was –7.5 percent (p≤.05).
Figure 7
Percent Th�nk�ng the average Montanan The�r age Has Dr�ven w�th�n One Hour of Consum�ng Two or More Dr�nks �n the Past Month
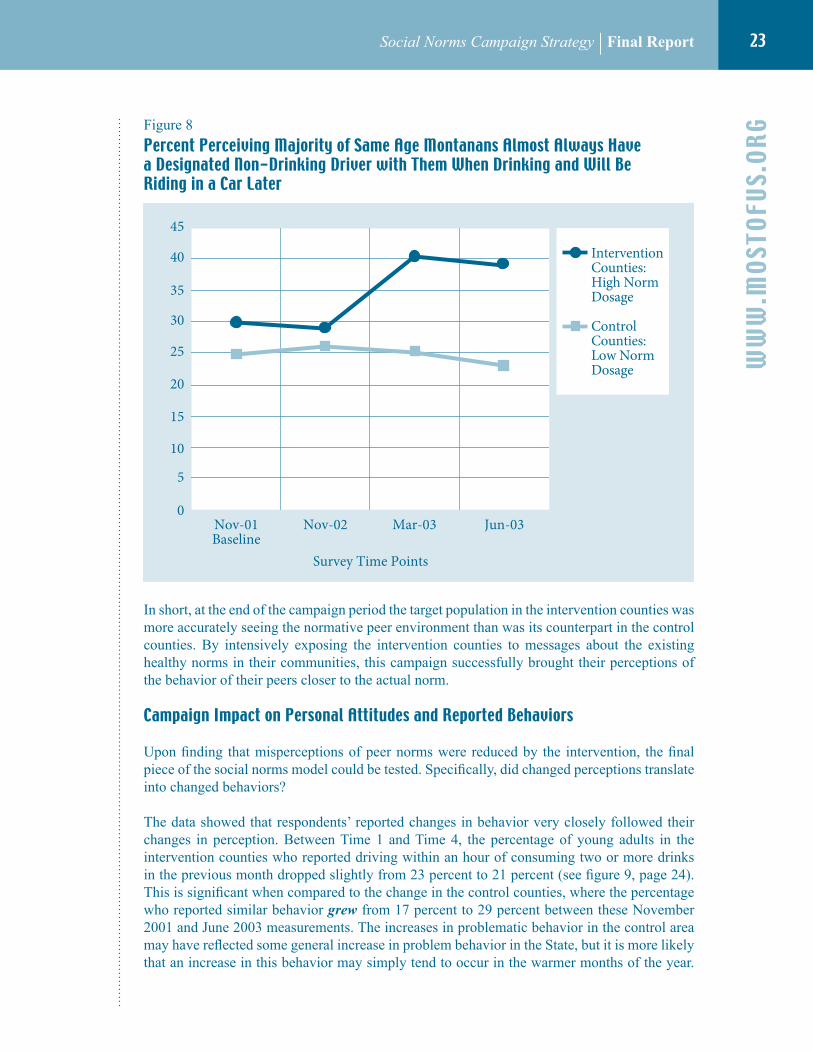
Changes were also found regarding the perception of peer use of designated drivers (see figure 8, page 23). At Time 1, 30 percent of intervention county respondents and 25 percent of control county respondents believed that the majority of Montanans their age almost always have a designated driver with them when they consume alcohol and will be riding in a car later. By Time 4, the intervention county respondents had a much more accurate picture of the normative environment, with 39 percent responding that they believed a majority of their peers used designated drivers. During this same period, misperceptions in the control county remained virtually unchanged. For this measure, the difference in November 2001 to June 2003 change between the intervention and control counties achieved marginal statistical significance (p=.056).
InterventionCounties:High NormDosage
ControlCounties:Low NormDosage
96
92
90
86
84
82
80
98
100
88
94
Nov-01Baseline
Nov-02 Mar-03 Jun-03
Survey Time Points
Social Norms Campaign Strategy | Final Report
WW
W.M
OSTO
FUS.
ORG
2�
Figure 8
Percent Perce�v�ng Major�ty of Same age Montanans almost always Have a Des�gnated non-Dr�nk�ng Dr�ver w�th Them When Dr�nk�ng and W�ll be R�d�ng �n a Car later
In short, at the end of the campaign period the target population in the intervention counties was more accurately seeing the normative peer environment than was its counterpart in the control counties. By intensively exposing the intervention counties to messages about the existing healthy norms in their communities, this campaign successfully brought their perceptions of the behavior of their peers closer to the actual norm.
Campa�gn impact on Personal att�tudes and Reported behav�ors
Upon finding that misperceptions of peer norms were reduced by the intervention, the final piece of the social norms model could be tested. Specifically, did changed perceptions translate into changed behaviors?
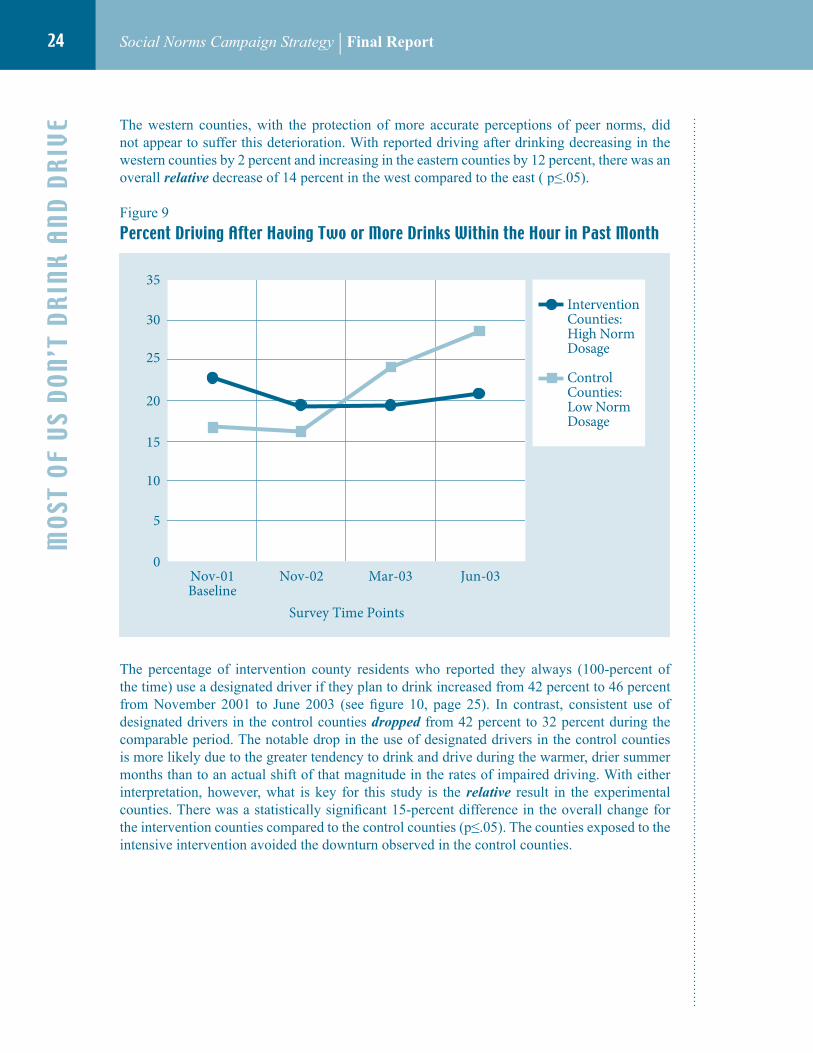
The data showed that respondents’ reported changes in behavior very closely followed their changes in perception. Between Time 1 and Time 4, the percentage of young adults in the intervention counties who reported driving within an hour of consuming two or more drinks in the previous month dropped slightly from 23 percent to 21 percent (see figure 9, page 24). This is significant when compared to the change in the control counties, where the percentage who reported similar behavior grew from 17 percent to 29 percent between these November 2001 and June 2003 measurements. The increases in problematic behavior in the control area may have reflected some general increase in problem behavior in the State, but it is more likely that an increase in this behavior may simply tend to occur in the warmer months of the year.
InterventionCounties:High NormDosage
ControlCounties:Low NormDosage
35
25
20
15
10
5
0
40
45
30
Nov-01Baseline
Nov-02 Mar-03 Jun-03
Survey Time Points
Social Norms Campaign Strategy | Final ReportM
OST
OF U
S DO
n’T
DRin
k an
D DR
ive
2�
The western counties, with the protection of more accurate perceptions of peer norms, did not appear to suffer this deterioration. With reported driving after drinking decreasing in the western counties by 2 percent and increasing in the eastern counties by 12 percent, there was an overall relative decrease of 14 percent in the west compared to the east ( p≤.05).
Figure 9
Percent Dr�v�ng after Hav�ng Two or More Dr�nks W�th�n the Hour �n Past Month
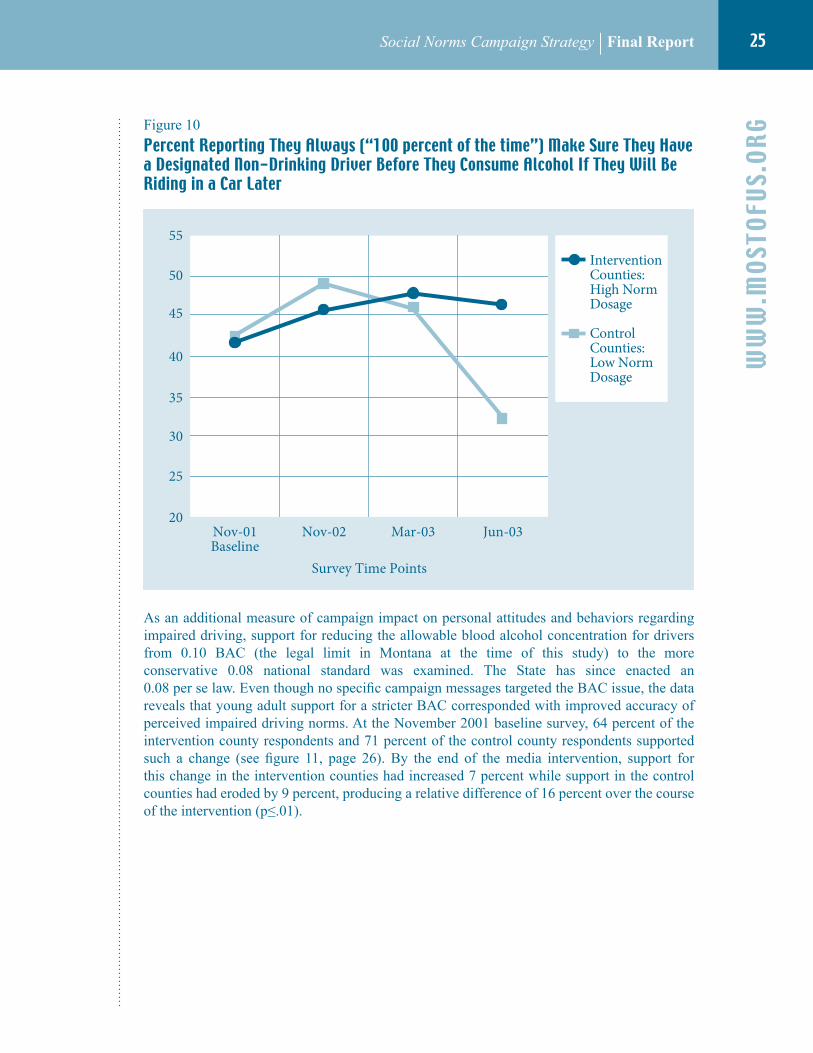
The percentage of intervention county residents who reported they always (100-percent of the time) use a designated driver if they plan to drink increased from 42 percent to 46 percent from November 2001 to June 2003 (see figure 10, page 25). In contrast, consistent use of designated drivers in the control counties dropped from 42 percent to 32 percent during the comparable period. The notable drop in the use of designated drivers in the control counties is more likely due to the greater tendency to drink and drive during the warmer, drier summer months than to an actual shift of that magnitude in the rates of impaired driving. With either interpretation, however, what is key for this study is the relative result in the experimental counties. There was a statistically significant 15-percent difference in the overall change for the intervention counties compared to the control counties (p≤.05). The counties exposed to the intensive intervention avoided the downturn observed in the control counties.
InterventionCounties:High NormDosage
ControlCounties:Low NormDosage
35
25
20
15
10
5
0
30
Nov-01Baseline
Nov-02 Mar-03 Jun-03
Survey Time Points
Social Norms Campaign Strategy | Final Report
WW
W.M
OSTO
FUS.
ORG
2�
Figure 10
Percent Report�ng They always (“�00 percent of the t�me”) Make Sure They Have a Des�gnated non-Dr�nk�ng Dr�ver before They Consume alcohol if They W�ll be R�d�ng �n a Car later
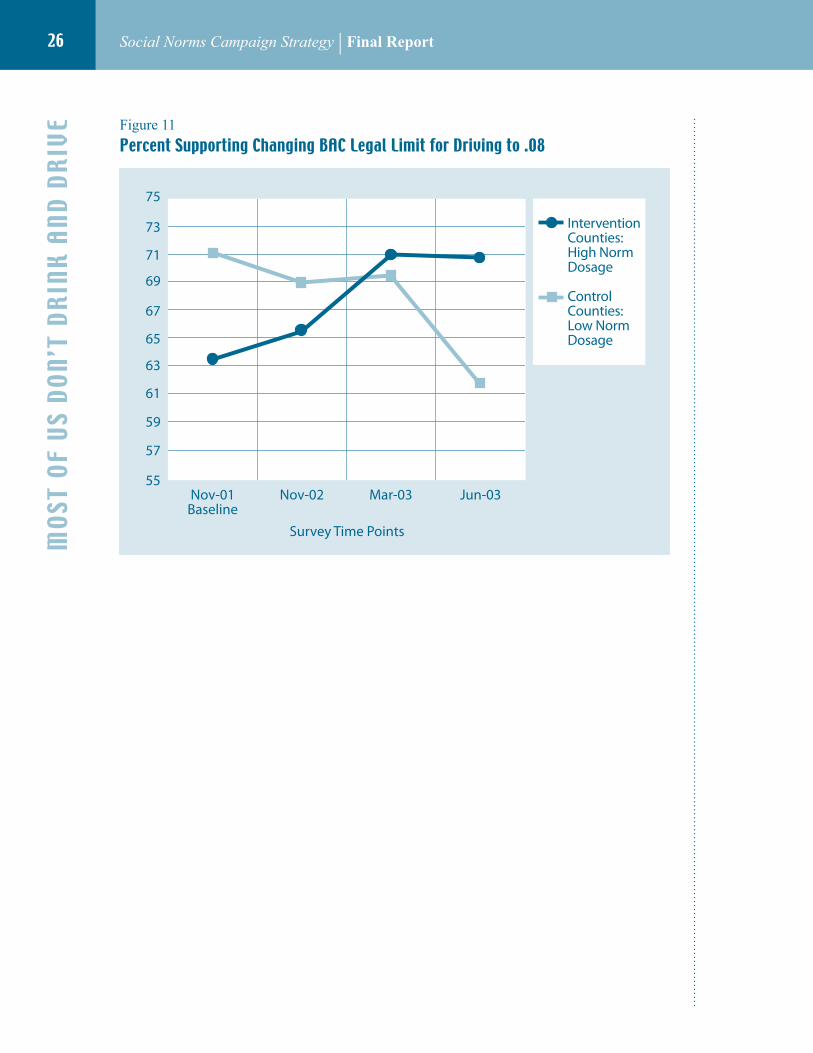
As an additional measure of campaign impact on personal attitudes and behaviors regarding impaired driving, support for reducing the allowable blood alcohol concentration for drivers from 0.10 BAC (the legal limit in Montana at the time of this study) to the more conservative 0.08 national standard was examined. The State has since enacted an 0.08 per se law. Even though no specific campaign messages targeted the BAC issue, the data reveals that young adult support for a stricter BAC corresponded with improved accuracy of perceived impaired driving norms. At the November 2001 baseline survey, 64 percent of the intervention county respondents and 71 percent of the control county respondents supported such a change (see figure 11, page 26). By the end of the media intervention, support for this change in the intervention counties had increased 7 percent while support in the control counties had eroded by 9 percent, producing a relative difference of 16 percent over the course of the intervention (p≤.01).
InterventionCounties:High NormDosage
ControlCounties:Low NormDosage
55
45
40
35
30
25
20
50
Nov-01Baseline
Nov-02 Mar-03 Jun-03
Survey Time Points
Social Norms Campaign Strategy | Final ReportM
OST
OF U
S DO
n’T
DRin
k an
D DR
ive
2�
Figure 11
Percent Support�ng Chang�ng baC legal l�m�t for Dr�v�ng to .0�
InterventionCounties:High NormDosage
ControlCounties:Low NormDosage
71
67
65
61
59
57
55
73
75
63
69
Nov-01Baseline
Nov-02 Mar-03 Jun-03
Survey Time Points
Social Norms Campaign Strategy | Final Report
WW
W.M
OSTO
FUS.
ORG
2�
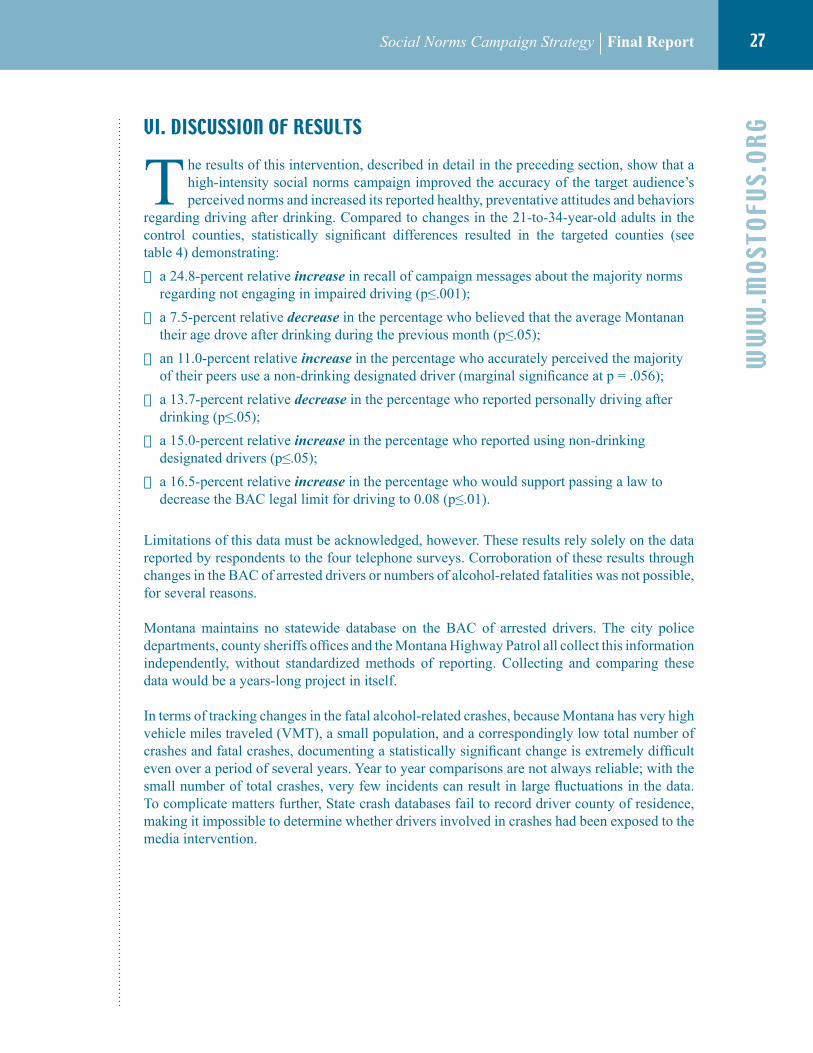
vi. DiSCUSSiOn OF ReSUlTS
T he results of this intervention, described in detail in the preceding section, show that a high-intensity social norms campaign improved the accuracy of the target audience’s perceived norms and increased its reported healthy, preventative attitudes and behaviors
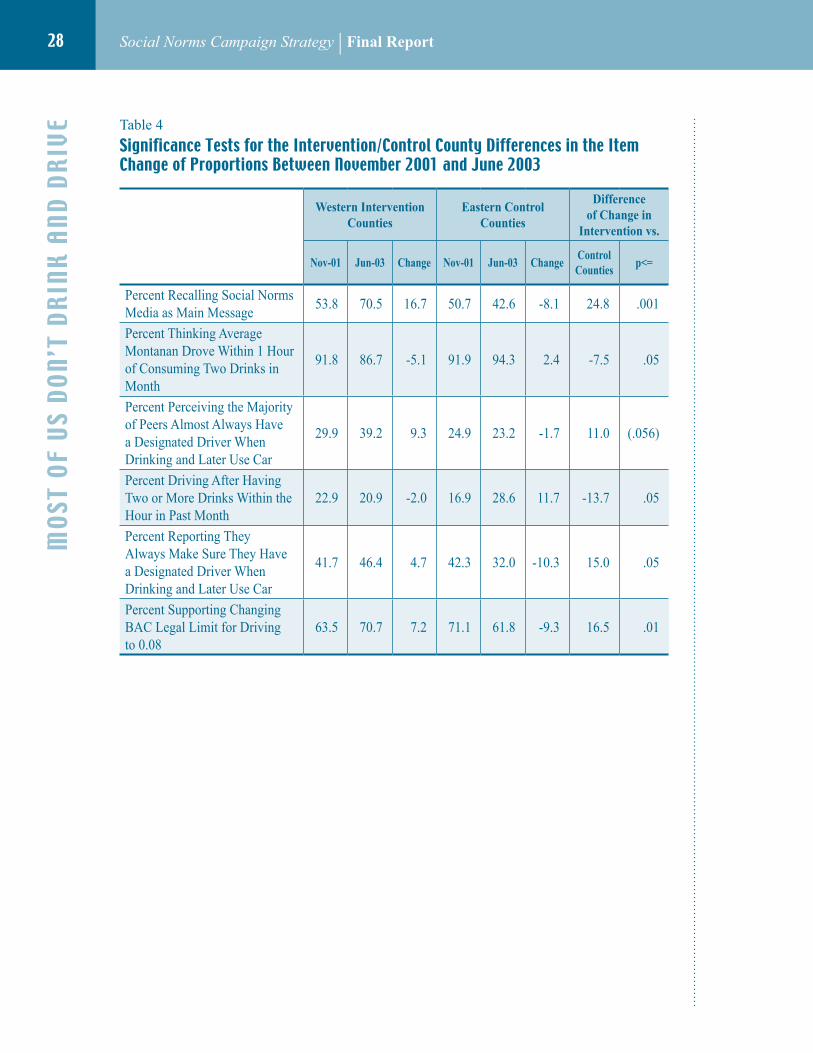
regarding driving after drinking. Compared to changes in the 21-to-34-year-old adults in the control counties, statistically significant differences resulted in the targeted counties (see table 4) demonstrating:
◆ a 24.8-percent relative increase in recall of campaign messages about the majority norms regarding not engaging in impaired driving (p≤.001);
◆ a 7.5-percent relative decrease in the percentage who believed that the average Montanan their age drove after drinking during the previous month (p≤.05);
◆ an 11.0-percent relative increase in the percentage who accurately perceived the majority of their peers use a non-drinking designated driver (marginal significance at p = .056);
◆ a 13.7-percent relative decrease in the percentage who reported personally driving after drinking (p≤.05);
◆ a 15.0-percent relative increase in the percentage who reported using non-drinking designated drivers (p≤.05);
◆ a 16.5-percent relative increase in the percentage who would support passing a law to decrease the BAC legal limit for driving to 0.08 (p≤.01).
Limitations of this data must be acknowledged, however. These results rely solely on the data reported by respondents to the four telephone surveys. Corroboration of these results through changes in the BAC of arrested drivers or numbers of alcohol-related fatalities was not possible, for several reasons.
Montana maintains no statewide database on the BAC of arrested drivers. The city police departments, county sheriffs offices and the Montana Highway Patrol all collect this information independently, without standardized methods of reporting. Collecting and comparing these data would be a years-long project in itself.
In terms of tracking changes in the fatal alcohol-related crashes, because Montana has very high vehicle miles traveled (VMT), a small population, and a correspondingly low total number of crashes and fatal crashes, documenting a statistically significant change is extremely difficult even over a period of several years. Year to year comparisons are not always reliable; with the small number of total crashes, very few incidents can result in large fluctuations in the data. To complicate matters further, State crash databases fail to record driver county of residence, making it impossible to determine whether drivers involved in crashes had been exposed to the media intervention.
Social Norms Campaign Strategy | Final ReportM
OST
OF U
S DO
n’T
DRin
k an
D DR
ive
2�
Table 4
S�gn�f�cance Tests for the intervent�on/Control County D�fferences �n the item Change of Proport�ons between november 200� and June 200�
Western Intervention Counties
Eastern Control Counties
Difference of Change in
Intervention vs.
Nov-01 Jun-03 Change Nov-01 Jun-03 ChangeControl Counties
p<=
Percent Recalling Social Norms Media as Main Message
53.8 70.5 16.7 50.7 42.6 -8.1 24.8 .001
Percent Thinking Average Montanan Drove Within 1 Hour of Consuming Two Drinks in Month
91.8 86.7 -5.1 91.9 94.3 2.4 -7.5 .05
Percent Perceiving the Majority of Peers Almost Always Have a Designated Driver When Drinking and Later Use Car
29.9 39.2 9.3 24.9 23.2 -1.7 11.0 (.056)
Percent Driving After Having Two or More Drinks Within the Hour in Past Month
22.9 20.9 -2.0 16.9 28.6 11.7 -13.7 .05
Percent Reporting They Always Make Sure They Have a Designated Driver When Drinking and Later Use Car
41.7 46.4 4.7 42.3 32.0 -10.3 15.0 .05
Percent Supporting Changing BAC Legal Limit for Driving to 0.08
63.5 70.7 7.2 71.1 61.8 -9.3 16.5 .01
Social Norms Campaign Strategy | Final Report
WW
W.M
OSTO
FUS.
ORG
2�
vii. COnClUSiOnS anD iMPliCaTiOnS
�. M�spercept�ons of norms are pervas�ve. The phenomenon of misperception of peer norms associated with driving after drinking occurs at statewide levels in young adults across a wide age range (18-34). This data clearly indicates the minority of young adults who do recklessly choose to drive under the influence of alcohol typically do so believing they are no different from most young people their age. Moreover, they do so with the tacit (albeit unintended) support of most other young people who think those who drink and drive are in the majority.
2. a h�dden r�sk factor ex�sts. To the extent these widely held misperceptions of norms have heretofore not been identified or challenged, they represent a hidden risk factor for the increased likelihood of driving after drinking among young adults. Evidence from this research demonstrates that correcting misperceptions is associated with reduced risk of driving after drinking on our roads and highways. Challenging misperceptions about the prevalence and acceptability of impaired driving with credible data about actual young adult norms is a crucial element of success in any broad-based prevention initiative. The extent to which misperceptions of norms extend beyond the young adult target group in Montana to other high-risk target groups across the Nation is a question for future research. In addition, other “carriers” of misperceptions outside of high-risk groups should also be studied.
�. Prevalence and ser�ousness are not the same. Impaired driving is an infrequent behavior among Montana young adults, but its prevalence is substantially over-perceived. The fact that impaired driving does not normally occur among most young adults does not minimize the seriousness of this deadly behavior. Instead, it serves to underscore the importance of accurately framing the context in which impaired driving occurs. Since the social norms approach represents a paradigm shift from traditional media that stresses harm, it is likely the general population will have to “warm up” to this positive approach.
�. Soc�al norms med�a works. This research demonstrates it is possible to construct a media intervention that successfully impacts the perceptions, attitudes, and reported behaviors of a large population spread over a large geographic region. Even on such a macro scale, the social norms model of correcting misperceptions to change behaviors is effective. Correcting misperceptions of norms can be done in a relatively short period of time (i.e., 1 to 2 years) with measurable results. An implication of this finding is that if social norms media were sustained over a longer period of time, then other positive synergistic benefits and long-term impacts might be measured.
Social Norms Campaign Strategy | Final ReportM
OST
OF U
S DO
n’T
DRin
k an
D DR
ive
�0
�. a med�a-based soc�al norms �ntervent�on can be constructed to ach�eve stat�st�cally pos�t�ve results across a var�ety of measures. In the MOST of Us Prevent Drinking and Driving campaign these included:
a. A change in awareness of the normative media message (MOST Of Us Don’t Drink and Drive);
b. A measured increase in accurate perceptions of peer norms;
c. A change in reported protective behaviors (increased reported use of designated drivers);
d. A change in reported drinking and driving behavior (a decrease in the percentage of young adults that reported driving within one hour of consuming 2 or more alcoholic drinks within an hour in previous 30 days); and
e. Support for policies to reduce impaired driving (increased support for passage of 0.08 BAC legislation).
�. intens�ve exposure to data-based normat�ve messages �s the key to success. The early efforts of the MOST of Us Prevent Drinking and Driving campaign showed that low levels of media exposure are not sufficient to correct perceptions and change behavior. The campaign message must be delivered with credible data from the population and delivered at doses intense enough to correct people’s perceptions and reframe the public conversation about impaired driving. It is also essential that even high levels of the social norms message not be watered down or diminished by competing negative, fear-based messages. Controlling the prevention environment in which the social norms campaign runs is crucial.
Social Norms Campaign Strategy | Final Report
WW
W.M
OSTO
FUS.
ORG
��
viii. ReCOMMenDaTiOnS FOR FUTURe ReSeaRCH
�. expand and cont�nue soc�al norms research. Social norms research and the study of the impacts of misperceptions of norms are very young fields. Additional studies which utilize an experimental design with randomly-assigned treatment and control groups will help to further our understanding of the potential for this promising strategy. Future interventions could increase the scientific rigor of their surveys by moving from multiple samples to a panel design. An intervention in which the same individuals are surveyed longitudinally through time would allow for more powerful statistical measures and outcome analyses.
2. Reduce d�ffus�on effects. Better experimental design is necessary to reduce diffusion of the campaign message into the control area through media bleed or travel of target population. Establishing a demographically matched control site in a different State could be a good strategy to keep control areas free of the campaign message. It is critical to measure whether people are traveling between the treatment and control areas. Next studies should ensure that the control areas are pristine and kept free of even low levels of the intervention.
�. Develop mult�ple messages. Although the MOST of Us Prevent Drinking and Driving intervention achieved statistically significant results by primarily using a single campaign message, the single-message approach has limitations and does not reflect current state-of-the-art practice in the social norms field. A single message is highly vulnerable to criticism, and can even erode campaign credibility if it is heard as a mantra or slogan rather than as an accurate reflection of true norms based upon data. Multiple messages allow a social norms campaign to activate different segments of the target audience and the community that surrounds it, so the entire social environment communicates and supports the desired change. In addition, by using multiple messages a campaign might better address the complexity and sophistication of the impaired driving issue.
�. evaluate med�a and messages. Media is considered to be an important component of any successful public health campaign. However, this research indicates that not all media messages may be equal. The use of fear-based strategies that may serve to raise awareness and concern for the issue of impaired driving may, for example, work against the promotion of accurate understanding of social norms. Future research should examine how the social norms approach to traffic safety issues can stress the seriousness of impaired driving while simultaneously reducing the risks associated with misperceptions. Future traffic safety media research should include a discussion of the impacts of various types of media messages on perceptions of norms. This research should include comparison of positive approaches with traditional, fear-based methods.
�. l�nk soc�al norms protect�on w�th long-term outcomes. The ultimate test of any intervention targeting impaired driving is whether it produces a measurable decrease in the number of alcohol-related incidents, crashes, and fatalities. Future research should seek other ways to link social norms interventions with these and other essential long-term outcomes.
Social Norms Campaign Strategy | Final ReportM
OST
OF U
S DO
n’T
DRin
k an
D DR
ive
�2
�. broaden appl�cat�ons of soc�al norms. Social norms research can be applied to domains other than media-based interventions. For example, although the Most of Us Prevent Drinking and Driving campaign did not include any specific messages or advertisements about the BAC issue, the project director, Dr. Jeff Linkenbach, summarized these findings in a guest editorial that appeared in several papers around the State (see Appendix) and presented them at a legislative sub-committee hearing in the State capital. The essence of social norms is shifting the environment and the public dialogue and future research must focus on innovative strategies for accomplishing this aim.
7. Coord�nate soc�al norms as synerg�st�c approach. Synergy is when two or more agents or forces interact such that their combined effect is greater than the sum of their individual effects. Social norms practitioners need to find ways to apply the social norms approach synergistically with other prevention strategies. It is a well-known and agreed-upon fact that the issue of impaired driving is complex and demands comprehensive strategies for success. What is not well understood is how to maximize the benefits of combining different approaches. It is common for traffic safety practitioners to employ as many strategies as possible and hope that one or some combination will prove effective. This type of implementation presupposes that different messages are additive (i.e., that two or three are better than one), failing to recognize that different strategies can compete and diminish each other’s effectiveness if they are not compatible. A successful social norms strategy will support law enforcement, policy change and other prevention measures—as long as they are administered together as part of a coordinated plan that takes advantage of their shared strengths and compatibilities.
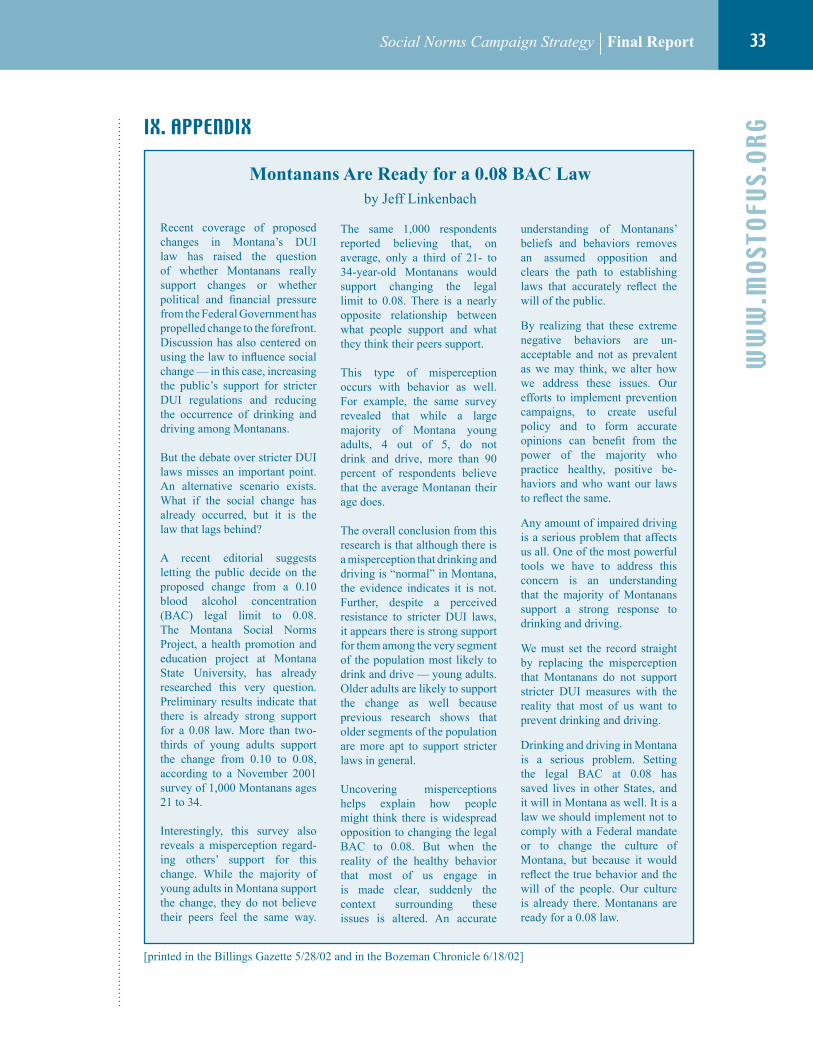
Social Norms Campaign Strategy | Final Report
WW
W.M
OSTO
FUS.
ORG
��
iX. aPPenDiX
Montanans Are Ready for a 0.08 BAC Lawby Jeff Linkenbach
Recent coverage of proposed changes in Montana’s DUI law has raised the question of whether Montanans really support changes or whether political and financial pressure from the Federal Government has propelled change to the forefront. Discussion has also centered on using the law to influence social change — in this case, increasing the public’s support for stricter DUI regulations and reducing the occurrence of drinking and driving among Montanans.
But the debate over stricter DUI laws misses an important point. An alternative scenario exists. What if the social change has already occurred, but it is the law that lags behind? A recent editorial suggests letting the public decide on the proposed change from a 0.10 blood alcohol concentration (BAC) legal limit to 0.08. The Montana Social Norms Project, a health promotion and education project at Montana State University, has already researched this very question. Preliminary results indicate that there is already strong support for a 0.08 law. More than two-thirds of young adults support the change from 0.10 to 0.08, according to a November 2001 survey of 1,000 Montanans ages 21 to 34.
Interestingly, this survey also reveals a misperception regard-ing others’ support for this change. While the majority of young adults in Montana support the change, they do not believe their peers feel the same way.
The same 1,000 respondents reported believing that, on average, only a third of 21- to 34-year-old Montanans would support changing the legal limit to 0.08. There is a nearly opposite relationship between what people support and what they think their peers support.
This type of misperception occurs with behavior as well. For example, the same survey revealed that while a large majority of Montana young adults, 4 out of 5, do not drink and drive, more than 90 percent of respondents believe that the average Montanan their age does.
The overall conclusion from this research is that although there is a misperception that drinking and driving is “normal” in Montana, the evidence indicates it is not. Further, despite a perceived resistance to stricter DUI laws, it appears there is strong support for them among the very segment of the population most likely to drink and drive — young adults. Older adults are likely to support the change as well because previous research shows that older segments of the population are more apt to support stricter laws in general.
Uncovering misperceptions helps explain how people might think there is widespread opposition to changing the legal BAC to 0.08. But when the reality of the healthy behavior that most of us engage in is made clear, suddenly the context surrounding these issues is altered. An accurate
understanding of Montanans’ beliefs and behaviors removes an assumed opposition and clears the path to establishing laws that accurately reflect the will of the public.
By realizing that these extreme negative behaviors are un-acceptable and not as prevalent as we may think, we alter how we address these issues. Our efforts to implement prevention campaigns, to create useful policy and to form accurate opinions can benefit from the power of the majority who practice healthy, positive be-haviors and who want our laws to reflect the same.
Any amount of impaired driving is a serious problem that affects us all. One of the most powerful tools we have to address this concern is an understanding that the majority of Montanans support a strong response to drinking and driving.
We must set the record straight by replacing the misperception that Montanans do not support stricter DUI measures with the reality that most of us want to prevent drinking and driving.
Drinking and driving in Montana is a serious problem. Setting the legal BAC at 0.08 has saved lives in other States, and it will in Montana as well. It is a law we should implement not to comply with a Federal mandate or to change the culture of Montana, but because it would reflect the true behavior and the will of the people. Our culture is already there. Montanans are ready for a 0.08 law.
[printed in the Billings Gazette 5/28/02 and in the Bozeman Chronicle 6/18/02]

Social Norms Campaign Strategy | Final ReportM
OST
OF U
S DO
n’T
DRin
k an
D DR
ive
��
X. ReFeRenCeS
1. Cialdini, R. B. (2003). Crafting normative messages to protect the environment. Current Directions in Psychological Science, 12 (4), 105-109.
2. Glassner, B. (1999.) The Culture of Fear. New York: Basic Books.
3. Haines, M.P. (1996). A Social Norms Approach to Preventing Binge Drinking at Colleges and Universities. Newton, MA: Higher Education Center for Alcohol and Other Drug Prevention.
4. Jeffrey, L. P., Negro, P., Miller, D.S., and Frisone, J.D. (2003). The Rowan University social norms project. The Social Norms Approach To Preventing School and College Age Substance Abuse (pp.100-110). San Francisco: Jossey-Bass.
5. Johannessen, K., Collins, C., Mills-Novoa, B. and Glider, P. (1999). A Practical Guide to Alcohol Abuse Prevention: A Campus Case Study in Implementing Social Norms and Environmental Management Approaches. Tucson: Campus Health Service, University of Arizona.
6. Linkenbach, J. (2001). Cultural cataracts: Identifying and correcting misperceptions in the media. The Report on Social Norms. Working Paper #1.
7. Linkenbach, J. (2003). The Montana model: development and overview of a seven-step process for implementing macro-level social norms campaigns. In H. W. Perkins (Ed.). The Social Norms Approach To Preventing School and College Age Substance Abuse (pp.182-205). San Francisco: Jossey-Bass.
8. Linkenbach, J., and Perkins, H.W. (2003a). Misperceptions of Peer Alcohol Norms in a Statewide Survey of Young Adults. In H.W. Perkins (Ed.). The Social Norms Approach To Preventing School and College Age Substance Abuse (pp. 173-181). San Francisco: Jossey-Bass.
9. Linkenbach, J., and Perkins, H.W. (2003b). MOST of Us are Tobacco Free: An Eight-Month Social Norms Campaign Reducing Youth Initiation of Smoking in Montana. In H.W. Perkins (Ed.). The Social Norms Approach To Preventing School and College Age Substance Abuse (pp. 224-234). San Francisco: Jossey-Bass.
10. Malenfant, L., Wells, J., Van Houten, R., and Williams, A. (1996). The use of feedback signs to increase observed daytime seat belt use in two cities in North Carolina. Accident Analysis and Prevention, 28(6), 771-777.
11. Montana Department of Transportation. Traffic Safety Problem Identification (FY 2002). Helena, Mont.: Engineering Division, Traffic and Safety Bureau, 2001.
12. Montana Department of Transportation. (2003). Traffic Safety Problem Identification (FY 2004). Helena, MT: State and Local Traffic Safety Program Section.
Social Norms Campaign Strategy | Final Report
WW
W.M
OSTO
FUS.
ORG
��
13. National Highway Traffic Safety Administration. (1999). Traffic Safety Facts 1999: Alcohol. DOT HS 809 086, National Center for Statistics and Analysis, U.S. Department of Transportation, Washington, DC, NHTSA. Available on the Web at www-nrd.nhtsa.dot.gov/pdf/nrd-30/NCSA/TSF99/Alcohol99.pdf
14. National Highway Traffic Safety Administration. (2000). National Survey of Drinking and Driving Attitudes and Behavior: 1999, Volume 1: Findings. Washington, DC: U.S. Department of Transportation.
15. National Highway Traffic Safety Administration. (2003). State Alcohol-Related Fatality Rates 2002. Washington, DC: National Center for Statistics and Analysis, Advanced Research and Analysis, U.S. Department of Transportation.
16. Perkins, H.W. (1997). College student misperceptions of alcohol and other drug norms among peers: exploring causes, consequences, and implications for prevention programs. Pp. 177-206 in Designing Alcohol and Other Drug Prevention Programs in Higher Education. Newton, MA: The Higher Education Center for Alcohol and Other Drug Prevention, U.S. Department of Education
17. Perkins, H.W. (2000). The 2000 Montana Young Adult Alcohol Survey: Overview Report for the Montana Social Norms Project, unpublished manuscript.
18. Perkins, H.W. (2002). Social Norms and the Prevention of Alcohol Misuse in Collegiate Contexts. Journal of Studies on Alcohol, Supplement no. 14, 164-172.
19. Perkins, H.W. (Ed.) (2003). The Social Norms Approach to Preventing School and College Age Substance Abuse. San Francisco: Jossey-Bass.
20. Perkins, H. W., and Berkowitz, A. D. (1986). Perceiving the community norms of alcohol use among students: some research implications for campus alcohol education programming. International Journal of the Addictions, 21, 961-976.
21. Perkins, H.W., and Craig, D. (2002). A Multifaceted Social Norms Approach to Reduce High-Risk Drinking: Lessons from Hobart and William Smith Colleges. Newton, MA: Higher Education Center for Alcohol and Other Drug Prevention.
22. Perkins, H.W., and Craig, D. (2003). The Imaginary Lives of Peers: Patterns of Substance Use and Misperceptions of Norms Among Secondary School Students. In H.W. Perkins (Ed.). The Social Norms Approach To Preventing School and College Age Substance Abuse (pp. 209-223). San Francisco: Jossey-Bass.
23. U.S. Bureau of the Census (March 2001). Montana County [Population], Population Density 2000.
Social Norms Campaign Strategy | Final ReportM
OST
OF U
S DO
n’T
DRin
k an
D DR
ive
��
aCknOWleDGeMenTS
T his project was possible because of the vision and commitment of the Montana Department of Transportation, Traffic Safety Division. It was a privilege to work with Dave Galt, Priscilla Sinclair, Albert Goke, and Jack Williams.
In addition to their generous funding, NHTSA, Washington, DC, and NHTSA Region VIII provided invaluable leadership and support. Thanks especially to Ruth Esteban-Muir, Heidi L. Coleman, J. DeCarlo Ciccel, Louis DeCarolis, and Robert Weltzer.
Finally, this project would not have been possible without Dr. Jamie Cornish, Dr. Gary Lande, Stacey Scott, Seetha Srinivasan, and Valerie Roche. Thank you to the entire MOST of Us team who worked on all phases of this project to ensure its success.
aUTHOR nOTeS
Jeff Linkenbach, Ed.D., is the director of the Montana Social Norms Project, home of the MOST of Us campaigns, and an assistant research professor in the Department of Health and Human Development at Montana State University.
H. Wesley Perkins, Ph.D., is professor of sociology in the Department of Anthropology and Sociology and co-director of the Alcohol Education Project at Hobart and William Smith Colleges in Geneva, New York.

DOT HS 809 869September 2005