social vulnerability to environmental hazards - … us… · construct an index of social...
TRANSCRIPT

Social Vulnerability to EnvironmentalHazardsn
Susan L. Cutter, University of South Carolina
Bryan J. Boruff, University of South Carolina
W. Lynn Shirley, University of South Carolina
Objective. County-level socioeconomic and demographic data were used toconstruct an index of social vulnerability to environmental hazards, called theSocial Vulnerability Index (SoVI) for the United States based on 1990data. Methods. Using a factor analytic approach, 42 variables were reduced to 11independent factors that accounted for about 76 percent of the variance. Thesefactors were placed in an additive model to compute a summary score—the SocialVulnerability Index. Results. There are some distinct spatial patterns in the SoVI,with the most vulnerable counties clustered in metropolitan counties in the east,south Texas, and the Mississippi Delta region. Conclusion. Those factors thatcontribute to the overall score often are different for each county, underscoring theinteractive nature of social vulnerability—some components increase vulnerability;others moderate the effects.
Generally speaking, vulnerability to environmental hazards means thepotential for loss. Since losses vary geographically, over time, and amongdifferent social groups, vulnerability also varies over time and space. Withinthe hazards literature, vulnerability has many different connotations,depending on the research orientation and perspective (Dow, 1992; Cutter,1996, 2001a). There are three main tenets in vulnerability research: theidentification of conditions that make people or places vulnerable to extremenatural events, an exposure model (Burton, Kates, and White, 1993;Anderson, 2000); the assumption that vulnerability is a social condition, ameasure of societal resistance or resilience to hazards (Blaikie et al., 1994;
nDirect all correspondence to Susan L. Cutter, Department of Geography, University ofSouth Carolina, Columbia, SC 29208 /[email protected]. This research was supported by agrant from the National Science Foundation (CMS9905352). We would like to thankDennis Mileti, Lori Peek, and Arleen A. Hill for their thoughtful comments on earlier draftsof this paper, and Katie Field and Jeffrey Vincent who helped compile some of the originaldata. Preliminary versions of this paper were presented at the annual meetings of theAssociation of American Geographers and the annual Natural Hazards Workshops. We willreadily share all data and coding information with those researchers who wish to replicate thestudy. The authors are responsible for any errors of omission or commission as well as theinterpretations and conclusions made in this paper.
SOCIAL SCIENCE QUARTERLY, Volume 84, Number 2, June 2003r2003 by the Southwestern Social Science Association

Hewitt, 1997); and the integration of potential exposures and societalresilience with a specific focus on particular places or regions (Kasperson,Kasperson, and Turner, 1995; Cutter, Mitchell, and Scott, 2000).
The Vulnerability Paradox
Although considerable research attention has examined components ofbiophysical vulnerability and the vulnerability of the built environment(Mileti, 1999), we currently know the least about the social aspects ofvulnerability. Socially created vulnerabilities are largely ignored, mainly dueto the difficulty in quantifying them, which also explains why social lossesare normally absent in after-disaster cost/loss estimation reports. Instead,social vulnerability is most often described using the individual character-istics of people (age, race, health, income, type of dwelling unit,employment). Social vulnerability is partially the product of socialinequalities—those social factors that influence or shape the susceptibilityof various groups to harm and that also govern their ability to respond.However, it also includes place inequalities—those characteristics ofcommunities and the built environment, such as the level of urbanization,growth rates, and economic vitality, that contribute to the socialvulnerability of places. To date, there has been little research effort focusedon comparing the social vulnerability of one place to another. For example,is there a robust and consistent set of indicators for assessing socialvulnerability that facilitates comparisons among diverse places, such aseastern North Carolina and southern California? How well do theseindicators differentiate places based on the level of social vulnerability andhow well do these factors explain differences in economic losses from naturalhazards? This article examines these questions through a comparativeanalysis of social vulnerability to natural hazards among U.S. counties.
This article utilizes the hazards-of-place model of vulnerability (Cutter,1996; Cutter, Mitchell, and Scott, 2000; Heinz Center for Science,Economics, and the Environment, 2002) to examine the components ofsocial vulnerability. In this conceptualization (Figure 1), risk (an objectivemeasure of the likelihood of a hazard event) interacts with mitigation(measures to lessen risks or reduce their impact) to produce the hazardpotential. The hazard potential is either moderated or enhanced by ageographic filter (site and situation of the place, proximity) as well as thesocial fabric of the place. The social fabric includes community experiencewith hazards, and community ability to respond to, cope with, recover from,and adapt to hazards, which in turn are influenced by economic,demographic, and housing characteristics. The social and biophysicalvulnerabilities interact to produce the overall place vulnerability. In thisarticle we examine only the social vulnerability portion of the conceptualmodel.
Social Vulnerability to Environmental Hazards 243

Redirecting Social Indicators Research
In the 1960s and 1970s, social indicators research was a thriving topicwithin the social sciences with volumes written on theoretical andmethodological issues (Duncan, 1969, 1984; Land, 1983; Land andSpilerman, 1975; Smith, 1973; Smith, 1981), and applications to socialpolicy formation (Rossi and Gilmartin, 1980). The development ofenvironmental indicators followed shortly thereafter, with quality-of-lifestudies emerging as an amalgam of the two (Cutter, 1985).
As a current research endeavor, social indicators and quality-of-life studieshave lost some of their original luster, although specialized journals (e.g.,Social Indicators Research) remain as outlets for focused empirical research onthe topic. Much of the contemporary work on social and quality-of-lifeindicators is relegated to popular rating places guides such as The PlacesRated Almanac (Savageau, 2000), America’s Top-Rated Cities (Garoogian,1999), or comparative rankings of environmental quality (Green Metro Indexby World Resources Institute, 1993; Green Index by Hall and Kerr, 1991).Also, there are a few examples of comparative measures of community healthat the county level (Miringhoff, 1999; Shaw-Taylor, 1999; U.S. Health andHuman Services Administration, 2001). One of the best nationalassessments that integrates demographic, public health, and environmentalquality indicators is now more than a decade old, however (Goldman,1991).
FIGURE1
The Hazards-of-Place Model of Vulnerability (Modified from Cutter, 1996)
244 Social Science Quarterly

Social and environmental indicators research is experiencing a renaissanceat present, especially in the arena of sustainability science. For example, theUnited Nations Development Program’s Human Development Index(UNDP, 2000) provides a composite indicator of human well-being, aswell as indicators of gender disparity and poverty among nations—measuresthat have been used for more than a decade. Similarly, the World Bank(2001) provides data on the links between environmental conditions andhuman welfare, especially in developing nations, to monitor nationalprogress toward a more sustainable future. An index has been developed tomeasure the environmental sustainability of national economies (WorldEconomic Forum, 2000, 2002; Esty and Cornelius, 2002). Meanwhile, a setof indicators to monitor and assess ecological conditions for public policydecisions has been proposed (National Research Council, 2000). Similarly,the U.S. Environmental Protection Agency (2002) is using a small set ofenvironmental indicators to track progress in hazardous waste remediation.Finally, the social capital embodied in various communities has beensurveyed in selected communities to determine a baseline and comparativeassessment of American social and civic engagement at the local level (SocialCapital Community Benchmark Survey, 2002). Despite these efforts, therestill is no consistent set of metrics used to assess vulnerability toenvironmental hazards, although there have been calls for just such anindex (Comfort et al., 1999; Cutter, 2001b).
Factors Influencing Social Vulnerability
There is a general consensus within the social science community aboutsome of the major factors that influence social vulnerability. These include:lack of access to resources (including information, knowledge, andtechnology); limited access to political power and representation; socialcapital, including social networks and connections; beliefs and customs;building stock and age; frail and physically limited individuals; and type anddensity of infrastructure and lifelines (Cutter, 2001a; Tierney, Lindell, andPerry, 2001; Putnam, 2000; Blaikie et al., 1994). Disagreements arise in theselection of specific variables to represent these broader concepts.
Those characteristics that influence social vulnerability most often foundin the literature are listed in Table 1, along with the relevant research thatidentified them. Among the generally accepted are age, gender, race, andsocioeconomic status. Other characteristics identify special needs popula-tions or those that lack the normal social safety nets necessary in disasterrecovery, such as the physically or mentally challenged, non-English-speaking immigrants, the homeless, transients, and seasonal tourists. Thequality of human settlements (housing type and construction, infrastructure,and lifelines) and the built environment are also important in understandingsocial vulnerability, especially as these characteristics influence potential
Social Vulnerability to Environmental Hazards 245

TABLE1
Social Vulnerability Concepts and Metrics
Concept Description
Increases (1) orDecreases
(� )Social
Vulnerability
Socioeconomicstatus (income,political power,prestige)
The ability to absorb losses and enhanceresilience to hazard impacts. Wealthenables communities to absorb andrecover from losses more quickly due toinsurance, social safety nets, andentitlement programs.
High status(1/� )
Low income orstatus (1)
Sources: Cutter, Mitchell, and Scott (2000),Burton, Kates, and White (1993), Blaikie etal. (1994), Peacock, Morrow, and Gladwin(1997, 2000), Hewitt (1997), Puente (1999),and Platt (1999).
Gender Women can have a more difficult timeduring recovery than men, often due tosector-specific employment, lower wages,and family care responsibilities.
Gender (1)
Sources: Blaikie et al. (1994), Enarson andMorrow (1998), Enarson and Scanlon(1999), Morrow and Phillips (1999),Fothergill (1996), Peacock, Morrow, andGladwin (1997, 2000), Hewitt (1997), andCutter (1996).
Race andethnicity
Imposes language and cultural barriersthat affect access to post-disasterfunding and residential locations in highhazard areas.
Nonwhite (1)Non-Anglo (1)
Sources: Pulido (2000), Peacock, Morrow,and Gladwin (1997, 2000), Bolin withStanford (1998), and Bolin (1993).
Age Extremes of the age spectrum affect themovement out of harm’s way. Parentslose time and money caring for childrenwhen daycare facilities are affected; elderlymay have mobility constraints or mobilityconcerns increasing the burden of careand lack of resilience.
Elderly (1)Children (1)
Sources: Cutter, Mitchell, and Scott (2000),O’Brien and Mileti (1992), Hewitt (1997),and Ngo (2001).
Commercial andindustrialdevelopment
The value, quality, and density ofcommercial and industrial buildings providesan indicator of the state of economic healthof a community, and potential losses in thebusiness community, and longer-term issueswith recovery after an event.
High density (1)High value(1/� )
246 Social Science Quarterly

Sources: Heinz Center for Science,Economics, and the Environment(2000) and Webb, Tierney, andDahlhamer (2000).
Employmentloss
The potential loss of employmentfollowing a disaster exacerbates thenumber of unemployed workers in acommunity, contributing to a slowerrecovery from the disaster.
Employmentloss (1)
Source: Mileti (1999).Rural/urban Rural residents may be more vulnerable
due to lower incomes and moredependent on locally based resourceextraction economies (e.g., farming,fishing). High-density areas (urban)complicate evacuation out of harm’s way.
Rural (1)Urban (1)
Source: Cutter, Mitchell, and Scott (2000),Cova and Church (1997), and Mitchell(1999).
Residentialproperty
The value, quality, and density ofresidential construction affects potentiallosses and recovery. Expensive homeson the coast are costly to replace; mobilehomes are easily destroyed and lessresilient to hazards.
Mobile homes(1)
Source: Heinz Center for Science,Economics, and the Environment (2000),Cutter, Mitchell, and Scott (2000), andBolin and Stanford (1991).
Infrastructureand lifelines
Loss of sewers, bridges, water,communications, and transportationinfrastructure compounds potentialdisaster losses. The loss of infrastructuremay place an insurmountable financialburden on smaller communities thatlack the financial resources torebuild.
Extensiveinfrastructure(1)
Source: Heinz Center for Science,Economics, and the Environment (2000)and Platt (1995).
Renters People that rent do so because they areeither transient or do not have thefinancial resources for home ownership.They often lack access to informationabout financial aid during recovery. In themost extreme cases, renters lack sufficientshelter options when lodging becomesuninhabitable or too costly to afford.
Renters (1)
Source: Heinz Center for Science,Economics, and the Environment(2000) and Morrow (1999).
TABLE1 — Continued
Social Vulnerability to Environmental Hazards 247

Occupation Some occupations, especially thoseinvolving resource extraction, may beseverely impacted by a hazard event.Self-employed fisherman suffer when theirmeans of production is lost and may nothave the requisite capital to resume workin a timely fashion and thus will seekalternative employment. Those migrantworkers engaged in agriculture and low-skilled service jobs (housekeeping,childcare, and gardening) may similarlysuffer, as disposable income fades and theneed for services declines. Immigrationstatus also affects occupational recovery.
Professional ormanagerial(� )
Clerical orlaborer (1)Service sector(1)
Source: Heinz Center for Science,Economics, and the Environment (2000),Hewitt (1997), and Puente (1999).
Family structure Families with large numbers ofdependents or single-parent householdsoften have limited finances to outsourcecare for dependents, and thus must jugglework responsibilities and care for familymembers. All affect the resilience to andrecovery from hazards.
High birth rates(1)
Large families(1)
Single-parenthouseholds(1)
Source: Blaikie et al. (1994), Morrow (1999),Heinz Center for Science, Economics,and the Environment (2000), and Puente(1999).
Education Education is linked to socioeconomicstatus, with higher educationalattainment resulting in greater lifetimeearnings. Lower education constrains theability to understand warning informationand access to recovery information.
Little education(1)
Highly educated(� )
Source: Heinz Center for Science,Economics, and the Environment (2000).
Populationgrowth
Counties experiencing rapid growth lackavailable quality housing, and the socialservices network may not have had timeto adjust to increased populations. Newmigrants may not speak the language andnot be familiar with bureaucracies forobtaining relief or recovery information,all of which increase vulnerability.
Rapid growth(1)
Source: Heinz Center for Science,Economics, and the Environment (2000),Cutter, Mitchell, and Scott (2000), Morrow(1999), and Puente (1999).
Medical services Health care providers, includingphysicians, nursing homes, andhospitals, are important post-event
Higher densityof medical(� )
TABLE1 — Continued
248 Social Science Quarterly

economic losses, injuries, and fatalities from natural hazards. Given theirgeneral acceptance in the literature, can we empirically define a robust set ofvariables that capture these characteristics, which then allows us to monitorchanges in social vulnerability geographically and over time?
Methods
To examine the social vulnerability, socioeconomic data were collected for1990 for all 3,141 U.S. counties, our unit of analysis. Using the U.S. Census(City and County Data Books for 1994 and 1998), specific variables werecollected that characterized the broader dimensions of social vulnerabilityidentified in Table 1. Originally, more than 250 variables were collected, butafter testing for multicollinearity among the variables, a subset of 85 raw andcomputed variables was derived. After all the computations and normal-ization of data (to percentages, per capita, or density functions), 42independent variables were used in the statistical analyses (Table 2). Theprimary statistical procedure used to reduce the data was factor analysis,
sources of relief. The lack of proximatemedical services will lengthen immediaterelief and longer-term recovery fromdisasters.
Source: Heinz Center for Science,Economics, and the Environment (2000),Morrow (1999), and Hewitt (1997).
Socialdependence
Those people who are totally dependenton social services for survival arealready economically and sociallymarginalized and require additionalsupport in the post-disaster period.
High dependence(1)
Low dependence(� )
Source: Morrow (1999), Heinz Center forScience, Economics, and theEnvironment (2000), Drabek (1996),and Hewitt (2000).
Special needspopulations
Special needs populations (infirm,institutionalized, transient, homeless),while difficult to identify and measure,are disproportionately affected duringdisasters and, because of their invisibilityin communities, mostly ignored duringrecovery.
Large special needspopulation (1)
Source: Morrow (1999) and Tobin andOllenburger (1993).
SOURCE: Cutter, Boruff, and Shirley (2001); Heinz Center for Science, Economics, and theEnvironment (2002).
TABLE1 — Continued
Social Vulnerability to Environmental Hazards 249
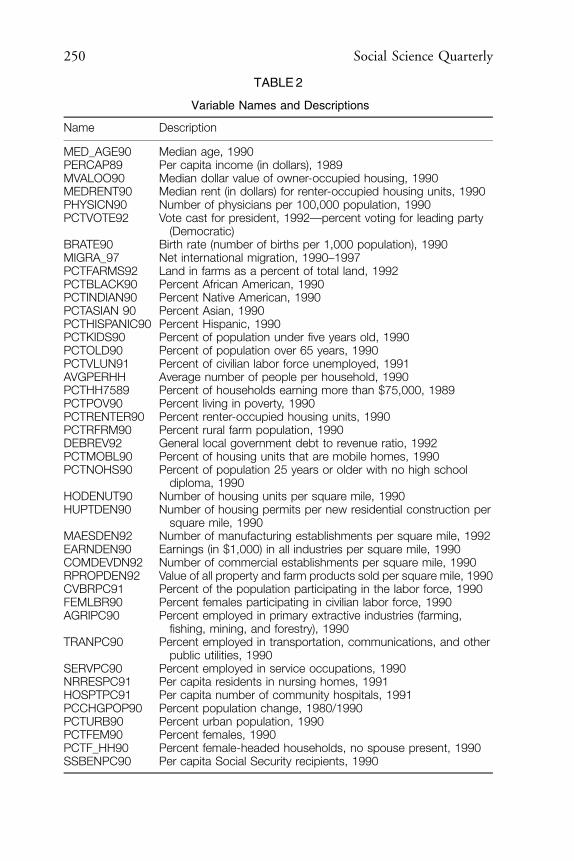
TABLE2
Variable Names and Descriptions
Name Description
MED_AGE90 Median age, 1990PERCAP89 Per capita income (in dollars), 1989MVALOO90 Median dollar value of owner-occupied housing, 1990MEDRENT90 Median rent (in dollars) for renter-occupied housing units, 1990PHYSICN90 Number of physicians per 100,000 population, 1990PCTVOTE92 Vote cast for president, 1992—percent voting for leading party
(Democratic)BRATE90 Birth rate (number of births per 1,000 population), 1990MIGRA_97 Net international migration, 1990–1997PCTFARMS92 Land in farms as a percent of total land, 1992PCTBLACK90 Percent African American, 1990PCTINDIAN90 Percent Native American, 1990PCTASIAN 90 Percent Asian, 1990PCTHISPANIC90 Percent Hispanic, 1990PCTKIDS90 Percent of population under five years old, 1990PCTOLD90 Percent of population over 65 years, 1990PCTVLUN91 Percent of civilian labor force unemployed, 1991AVGPERHH Average number of people per household, 1990PCTHH7589 Percent of households earning more than $75,000, 1989PCTPOV90 Percent living in poverty, 1990PCTRENTER90 Percent renter-occupied housing units, 1990PCTRFRM90 Percent rural farm population, 1990DEBREV92 General local government debt to revenue ratio, 1992PCTMOBL90 Percent of housing units that are mobile homes, 1990PCTNOHS90 Percent of population 25 years or older with no high school
diploma, 1990HODENUT90 Number of housing units per square mile, 1990HUPTDEN90 Number of housing permits per new residential construction per
square mile, 1990MAESDEN92 Number of manufacturing establishments per square mile, 1992EARNDEN90 Earnings (in $1,000) in all industries per square mile, 1990COMDEVDN92 Number of commercial establishments per square mile, 1990RPROPDEN92 Value of all property and farm products sold per square mile, 1990CVBRPC91 Percent of the population participating in the labor force, 1990FEMLBR90 Percent females participating in civilian labor force, 1990AGRIPC90 Percent employed in primary extractive industries (farming,
fishing, mining, and forestry), 1990TRANPC90 Percent employed in transportation, communications, and other
public utilities, 1990SERVPC90 Percent employed in service occupations, 1990NRRESPC91 Per capita residents in nursing homes, 1991HOSPTPC91 Per capita number of community hospitals, 1991PCCHGPOP90 Percent population change, 1980/1990PCTURB90 Percent urban population, 1990PCTFEM90 Percent females, 1990PCTF_HH90 Percent female-headed households, no spouse present, 1990SSBENPC90 Per capita Social Security recipients, 1990
250 Social Science Quarterly

specifically, principal components analysis.1 The use of a reductionisttechnique such as factor analysis allows for a robust and consistent set ofvariables that can be monitored over time to assess any changes in overallvulnerability. The technique also facilitates replication of the variables atother spatial scales, thus making data compilation more efficient. A total of11 factors was produced, which explained 76.4 percent of the varianceamong all counties.2
Empirically Defining the Underlying Dimensions of Social Vulnerability
Eleven composite factors were found that differentiated U.S. countiesaccording to their relative level of social vulnerability in 1990 (Table 3).Each of these is briefly described below.
Personal Wealth
The first factor identified the individual personal wealth of counties asmeasured by per capita income, percentage of households earning more than$75,000 per year, median house values, and median rents. The wealthvariables loaded positively on this factor and the lack of wealth (poverty)variables, negatively. The wealth factor explains 12.4 percent of the variance.Wealth enables communities to quickly absorb and recover from losses, butit also means that there may be more material goods at risk in the first place.On the other hand, there is more agreement that lack of wealth is a primarycontributor to social vulnerability as fewer individual and communityresources for recovery are available, thereby making the community lessresilient to the hazard impacts.
Age
The two demographic groups most affected by disasters, childrenand the elderly, are identified in the second factor, which explains 11.9percent of the variation among counties, an empirical finding also consistentwith the literature. The preponderance of children in the community
1This procedure cannot be performed with missing values, so in these cases a value of zerowas substituted. We recognize that assigning a value of zero for a missing variable for a casemay not accurately represent the true vulnerability based on that one variable, and that in alllikelihood it would underestimate the level of vulnerability for those affected counties. Fromour perspective, it was more important to include all U.S. counties in the analysis (a spatialdecision), rather than dropping them (the majority of which were in Alaska and Hawaii).
2To simplify the structure of underlying dimensions and produce more independenceamong the factors, a varimax rotation was used in the factor analysis. The varimax rotationminimizes the number of variables that load high on a single factor, thereby increasing thepercentage variation between each factor. Eigenvalues greater than 1.00 were used to generatethe 11 factors and were based on a scree diagram showing a distinct break in the values.
Social Vulnerability to Environmental Hazards 251

and high birth rates both load positively on this dimension. Median age,on the other hand, loads negatively. The other demographic group, theelderly, is measured by the percentage of the population over 65 andpercentage receiving Social Security benefits. These variables load negativelyon this dimension.
Density of the Built Environment
The third factor also confirms findings in the literature, and describes thedegree of development of the built environment. As measured by the densityof manufacturing and commercial establishments, housing units, and newhousing permits, this factor highlights those counties where significantstructural losses might be expected from a hazard event. Eleven percent ofthe variation in counties is captured by this factor.
TABLE3
Dimensions of Social Vulnerability
Factor Name
PercentVariationExplained
DominantVariable Correlation
1 Personal wealth 12.4 Per capita income 10.872 Age 11.9 Median age � 0.903 Density of the built
environment11.2 No. commercial
establishments/mi210.98
4 Single-sectoreconomicdependence
8.6 % employed inextractiveindustries
10.80
5 Housing stockand tenancy
7.0 % housing units thatare mobile homes
� 0.75
6 Race—AfricanAmerican
6.9 % African American 10.80
7 Ethnicity—Hispanic
4.2 % Hispanic 10.89
8 Ethnicity—NativeAmerican
4.1 % Native American 10.75
9 Race—Asian 3.9 % Asian 10.7110 Occupation 3.2 % employed in
serviceoccupations
10.76
11 Infrastructuredependence
2.9 % employed intransportation,communication,and public utilities
10.77
252 Social Science Quarterly

Single-Sector Economic Dependence
A singular reliance on one economic sector for income generation createsa form of economic vulnerability for counties. The boom and busteconomies of oil development, fishing, or tourism-based coastal areas aregood examples—in the heyday of prosperity, income levels are high, butwhen the industry sees hard times or is affected by a natural hazard, therecovery may take longer. The agricultural sector is no exception and is,perhaps, even more vulnerable given its dependence on climate. Any changein weather conditions or increases in hydrometeorological hazards, such asflooding, drought, or hail, can affect annual and decadal incomes and thesustainability of the resource base. This fourth factor explains 8.6 percent ofthe variation, with percentage rural farm population and percent employ-ment in extractive industries having the highest correlations.
Housing Stock and Tenancy
The quality and ownership of housing is an important component ofvulnerability. The fifth factor explains 7 percent of the variance, with themost dominant variables including mobile homes, renters, and urban living.The nature of the housing stock (mobile homes) and the nature ofownership (renters) and the location (urban) combine to produce the socialvulnerability depicted in this factor. The displacement of affectedpopulations from damaged dwellings is potentially greater in urban areasthan rural ones, while the destruction of mobile homes is potentially greaterin rural areas (where they are often the dominant form of housing).
Race
Race contributes to social vulnerability through the lack of access toresources, cultural differences, and the social, economic, and politicalmarginalization that is often associated with racial disparities. Our sixthfactor identifies race, specifically African American, as an indicator of socialvulnerability. This factor also correlates highly with percentage female-headed households, noting that counties with high percentages of African-American female-headed households are among the most vulnerable. Thisfactor explains 6.9 percent of the variation among U.S. counties. Factor 9identifies another racial group, Asians, and accounts for 3.9 percent of thevariability among counties.
Ethnicity
Like race, ethnicity also is a clearly defined factor contributing tovulnerability and this factor is mostly correlated with Hispanic in Factor 7
Social Vulnerability to Environmental Hazards 253

and Native American in Factor 8. These factors explain 4.2 percent and4.1 percent of the variation among U.S. counties, respectively.
Occupation
The literature suggests that occupation is an important dimension ofvulnerability. The 10th factor, in fact, distinguishes counties based onoccupations—primarily lower wage service occupations such as personalservices. As might be expected, counties heavily dependent on thisemployment base might suffer greater impacts from natural hazards andface slower recovery from disasters. This factor explains 3.2 percent of thevariance among counties.
Infrastructure Dependence
The 11th factor (explaining 2.9 percent of the variance) is a hybrid onethat loads highly on two individual indicators—large debt to revenue ratioand percent employed in public utilities and other infrastructure(transportation and communications). The economic vitality and revenue-generating capability of a county is a good indicator of its ability to divertresources to hazard mitigation and, ultimately, recovery should the disasteroccur. Those counties with high debt to revenue ratio and primarydependence on infrastructure employment have fewer localized resources forrecovery, thereby affecting their ability to successfully recover from a disaster.
The Social Vulnerability Index (SoVI)
The factor scores were added to the original county file as 11 additionalvariables and then placed in an additive model to produce the compositesocial vulnerability index score (SoVI) for each county. The SoVI is arelative measure of the overall social vulnerability for each county. Weselected an additive model, thereby making no a priori assumption about theimportance of each factor in the overall sum. In this way, each factor wasviewed as having an equal contribution to the county’s overall vulnerability.In the absence of a defensible method for assigning weights, we felt this wasthe best option. Further, all factors were scaled so that positive valuesindicated higher levels of vulnerability; negative values decreased or lessenedthe overall vulnerability. In those instances where the effect was ambiguous(both increased and decreased vulnerability), we used the absolute value. Todetermine the most and least vulnerable of the counties (e.g., the outliersbased on a normal curve), the SoVI scores were mapped based on standarddeviations from the mean into five categories ranging from –1 on the lowerend to 11 on the upper end.
254 Social Science Quarterly

The Geography of Social Vulnerability
As expected, the vast majority of U.S. counties exhibit moderate levels ofsocial vulnerability. The SoVI ranges from –9.6 (low social vulnerability) to49.51 (high social vulnerability) with mean vulnerability score of 1.54(SD5 3.38) for all U.S. counties. With some notable exceptions, the mostvulnerable counties appear in the southern half of the nation (Figure 2),stretching from south Florida to California—regions with greater ethnic andracial inequalities as well as rapid population growth.
Counties with SoVI scores greater than 11 standard deviations are labeledas most vulnerable. They include a geographic mix of highly urbanizedcounties, large Hispanic and/or Native American populations, and sociallydependent populations (those in poverty and lacking in education). A totalof 393 counties (12.5 percent of the total) were classified in the mostvulnerable category. The most socially vulnerable county in the nation isManhattan Borough (part of New York City), largely based on the densityof the built environment. This factor accounts for the placement of SanFrancisco County and Bronx County (New York City) among the top fivemost vulnerable counties as well. Two other counties round out the top five,but their vulnerability is derived entirely from different indicators. Kalawao,Hawaii is ranked second in overall social vulnerability based on three factors:
SOVI 1990< -1 Std. Dev.-1.0 - -0.5 Std. Dev.-0.5 - 0.5 Std. Dev.0.5 - 1.0 Std. Dev.> 1 Std. Dev. USC
Hazards Research Lab0 500 1000 Kilometers
FIGURE2
Comparative Vulnerability of U.S. Counties Based on the Social VulnerabilityIndex (SoVI)
Social Vulnerability to Environmental Hazards 255

age of residents (elderly), race/ethnicity (Asian and Native Hawaiian), andpersonal wealth (poverty). This is not surprising given the county’s history asa former leper colony. In 1990, there were fewer than 200 residents of thiscounty. Benton, Washington’s social vulnerability is defined by its large debtto revenue ratio and reliance on high percentage employment in utilities.Again, this is not surprising when one considers that Benton County ishome to Hanford Nuclear Reservation, a Department of Energy facility.A lower tax base (most of the county is in federal land ownership) coupledwith the need to provide services helps to account for the relatively high debtto revenue ratio, thus increasing its social vulnerability.
Counties labeled as the least vulnerable (more than –1 standarddeviation from the mean) are clustered in New England, along theeastern slopes of the Appalachian Mountains from Virginia to NorthCarolina, and in the Great Lakes states. Topping the list of least vulnerablecounties are Yellowstone National Park, MT; Poquoson, VA; Los Alamos,NM; Tolland, CT, and Moore, TN. The low social vulnerability score forYellowstone National Park County is not a surprise given that the county ismostly in a protected status with a very small population that has littleethnic, racial, or gender diversity. The remaining counties are all relativelyhomogenous—suburban, wealthy, white, and highly educated—character-istics that lower the level of social vulnerability. The exception is MooreCounty, TN, located in the south central portion of the state. The county isalso homogeneous, with predominately white, middle-class residents livingin owner-occupied housing who are employed in technical, sales, orexecutive positions. The county has relatively low unemployment as it ishome to the Jack Daniel’s Distillery, the primary source of employment inthe area.
Using SoVI to Predict Disaster Impacts
To initially test the reliability and usefulness of the SoVI, we examined thenumber of presidential disaster declarations by county for the 1990s. Werecognize that these declarations represent larger, singular events rather thansmaller, more chronic losses, and are often seen as political rewards ratherthan risk or impact-driven responses (Downton and Pielke, 2001).However, as a proof of concept, the relationship between the frequency ofdisaster declarations per county and its level of social vulnerability (asmeasured by the SoVI) might yield some useful insights.
We conducted a simple correlation between the frequency of presidentialdisaster declarations by county (during the 1990s) and the SoVI index score.There is a weak but negative relationship (r5 –0.099, s5 0.000) betweenthe number of disaster declarations and higher SoVI scores. This initiallysuggests no discernible trend in the relationship between presidentialdeclarations and the degree of social vulnerability. Nationally, the average
256 Social Science Quarterly

number of presidential disaster declarations per county is 2.4, yet amongthe most vulnerable counties (Figure 2), the mean is 1.97, while for theleast vulnerable the mean number of disaster declarations is 2.52. Thesedifferences, however, are not statistically significant.
Conclusions
There is no consensus within the social science community about socialvulnerability or its correlates. Using the hazards-of-place model ofvulnerability, we suggest that social vulnerability is a multidimensionalconcept that helps to identify those characteristics and experiences ofcommunities (and individuals) that enable them to respond to and recoverfrom environmental hazards. The correlates are largely derivative from localcase studies of disasters and community responses. There have been few,if any, attempts to develop larger theoretical or conceptual understandingsof comparative indicators of social vulnerability, despite the clear need todevelop such a robust and replicable set.
The factors identified in the statistical analysis are consistent with thebroader hazards literature and not only demonstrate the geographicvariability in social vulnerability, but also the range in the underlyingcauses of that vulnerability. As a comparative measure, this methodologyworks quite well, explaining about 76 percent of the statistical variance inU.S. counties, using 11 independent factors. Having said this, we realize thatthe SoVI is not a perfect construct and more refinements are necessary. Thisis very clear based on the lack of correlation with presidential disasterdeclarations, which may be a function of the SoVI, but is more likely afunction of the frequency and location of disaster events as well as thepolitical process involved in the declaration process itself.
The SoVI can be coupled with hazard event frequency (number of naturalhazards events, for example) and economic loss data to further examinethose individual factors that are the most important contributors to dollarlosses. This could be done on an individual hazard basis (e.g., floods,hurricanes) or by specific time period for all hazards. Not all factors areequal, and the need to develop a defensible weighting scheme is important.But what should determine those relative weights?
The next step is to examine how the overall social vulnerability asmeasured by the SoVI has changed over time and space. To do that requiresa historical reconstruction of the variables used in this analysis. In this way,one can monitor changes in the total social vulnerability score as well as itsunderlying dimensions from a set period, 1960 onward, for example.Further, the analysis can be projected into the future (in this case usingCensus 2000 and beyond) using this analog data to develop realisticscenarios of potential future vulnerabilities.
Social Vulnerability to Environmental Hazards 257

This methodology also can support specific subsetting of counties, such ascoastal or riverine counties, to ascertain similarities and differences inrelative levels of social vulnerability. The relationship between the level ofsocial vulnerability and biophysical risk is the obvious next step. How welldo the counties match up? Are those counties most exposed (higher hazardpotential or greater biophysical risk) also the most socially vulnerable? Inadding a physical component, vulnerability can be examined not just as asocial or a biophysical phenomenon, but as a complex interaction of the two.This integrative step will help advance our understanding of vulnerabilityscience at the local, regional, and national scales. The SoVI can assist localdecisionmakers in pinpointing those factors that threaten the sustainabilityand stability of the county (or community). Using this index in conjunctionwith biophysical risk data, means that mitigation efforts can be targeted atthe most vulnerable groups or counties. The development and integration ofsocial, built environment, and natural hazard indicators will improve ourhazard assessments and justify the selective targeting of communities formitigation based on good social science, not just political whim.
REFERENCES
Anderson, M. B. 2000. ‘‘Vulnerability to Disaster and Sustainable Development: A GeneralFramework for Assessing Vulnerability.’’ Pp. 11–25 in R. Pielke, Jr. and R. Pielke Sr., eds.Storms (Vol. 1). London: Routledge.
Blaikie, P., T. Cannon, I. Davis, and B. Wisner. 1994. At Risk: Natural Hazards, People’sVulnerability, and Disasters. London: Routledge.
Bolin, R. 1993. Household and Community Recovery After Earthquakes. Boulder, Colo.:Institute of Behavioral Science, University of Colorado.
Bolin, R., and L. Stanford. 1991. ‘‘Shelter, Housing and Recovery: A Comparison of USDisasters.’’ Disasters 15(1):24–34.
Bolin, R., with L. Stanford. 1998. The Northridge Earthquake: Vulnerability and Disaster.London: Routledge.
Burton, I., R. W. Kates, and G. F. White. 1993. The Environment as Hazard (2nd ed.).New York: Guildford.
Comfort, L., B. Wisner, S. Cutter, R. Pulwarty, K. Hewitt, A. Oliver-Smith, J. Wiener,M. Fordham, W. Peacock, and F. Krimgold. 1999. ‘‘Reframing Disaster Policy: The GlobalEvolution of Vulnerable Communities.’’ Environmental Hazards 1(1):39–44.
Cova, T. J., and R. L. Church. 1997. ‘‘Modeling Community Evacuation VulnerabilityUsing GIS.’’ International Journal of Geographical Information Science 11:763–84.
Cutter, S. L. 1985. Rating Places: A Geographer’s View on Quality of Life. Washington D.C.:Association of American Geographers.
——. 1996. ‘‘Vulnerability to Environmental Hazards.’’ Progress in Human Geography20(4):529–39.
——. ed. 2001a. American Hazardscapes: The Regionalization of Hazards and Disasters.Washington, D.C.: Joseph Henry Press.
258 Social Science Quarterly

——. 2001b. ‘‘A Research Agenda for Vulnerability Science and Environmental Hazards.’’IHDP Update (Newsletter of the IHDP) 2:8–9.
Cutter, S. L., B. Boruff, and W. L. Shirley. 2001. ‘‘Indicators of Social Vulnerability toHazards.’’ Unpublished paper. Columbia, S.C.: University of South Carolina, HazardsResearch Lab.
Cutter, S. L., J. T. Mitchell, and M. S. Scott. 2000. ‘‘Revealing the Vulnerability of Peopleand Places: A Case Study of Georgetown County, South Carolina.’’ Annals of the Associationof American Geographers 90(4):713–37.
Dow, K. 1992. ‘‘Exploring Differences in Our Common Future(s): The Meaning ofVulnerability to Global Environmental Change.’’ Geoforum 23(3):417–36.
Downton, M. W., and R. A. Pielke. 2001. ‘‘Discretion Without Accountability: PoliticsFlood Damage, and Climate.’’ Natural Hazards Review 2(4):157–66.
Drabek, T. E. 1996. Disaster Evacuation Behavior: Tourists and Other Transients. Program onEnvironment and Behavior Monograph No. 58, Institute of Behavioral Science. Boulder,Colo.: University of Colorado.
Duncan, O. D. 1969. Towards Social Reporting: New Steps. New York: Russell SageFoundation.
——. 1984. Notes on Social Measurement, Historical and Critical. Beverly Hills, Cal.: RussellSage Foundation.
Enarson, E., and B. Morrow. 1998. The Gendered Terrain of Disaster. New York: Praeger.
Enarson, E., and J. Scanlon. 1999. ‘‘Gender Patterns in Flood Evacuation: A Case Study inCanada’s Red River Valley.’’ Applied Behavioral Science Review 7(2):103–24.
Esty, D., and P. K. Cornelius, eds. 2002. Environmental Performance Measurement: TheGlobal Report 2001–2002. New York: Oxford University Press.
Fothergill, A. 1996. ‘‘Gender, Risk, and Disaster.’’ International Journal of Mass 14(1):33–56.
Garoogian, D. 1999. 2000 America’s Top-Rated Cities: A Statistical Handbook (7th ed.).Lakeville, Conn.: Grey House Publishing.
Goldman, B. A. 1991. The Truth About Where You Live. An Atlas for Action on Toxics andMortality. New York: Random House.
Hall, B., and M. L. Kerr. 1991. 1991–1992 Green Index. Washington D.C.: Island Press.
Heinz Center for Science, Economics, and the Environment. 2000. The Hidden Costs ofCoastal Hazards: Implications for Risk Assessment and Mitigation. Covello, Cal.: Island Press.
——. 2002. Human Links to Coastal Disasters. Washington, D.C.: The H. John Heinz IIICenter for Science, Economics and the Environment.
Hewitt, K. 1997. Regions of Risk: A Geographical Introduction to Disasters. Essex, U.K.:Longman.
——. 2000. ‘‘Safe Place or ‘Catastrophic Society’? Perspectives on Hazards and Disasters inCanada.’’ Canadian Geographer 44(4):325–41.
Kasperson, J. X., R. E. Kasperson, and B. L. Turner, eds. 1995. Regions at Risk: Comparisonsof Threatened Environments. Tokyo: United Nations University Press.
Land, K. C. 1983. ‘‘Social Indicators.’’ Annual Review of Sociology 9:1–26.
Land, K. C., and S. Spilerman. 1975. Social Indicator Models. New York: Russell SageFoundation.
Social Vulnerability to Environmental Hazards 259

Mileti, D. 1999. Disasters by Design: A Reassessment of Natural Hazards in the United States.Washington, D.C.: Joseph Henry Press.
Mitchell, J. K., ed. 1999. Crucibles of Hazard: Mega-Cities and Disasters in Transition. Tokyo:United Nations University Press.
Miringhoff, M. L. 1999. The Social Health of the Nation: How America Is Really Doing.New York: Oxford University Press.
Morrow, B. H. 1999. ‘‘Identifying and Mapping Community Vulnerability.’’ Disasters23(1):11–18.
Morrow, B. H., and B. Phillips. 1999. ‘‘What’s Gender ‘Got to Do With It’?’’ InternationalJournal of Mass Emergencies and Disasters 17(1):5–11.
Ngo, E. B. 2001. ‘‘When Disasters and Age Collide: Reviewing Vulnerability of the Elderly.’’Natural Hazards Review 2(2):80–89.
National Research Council. 2000. Ecological Indicators for the Nation. Washington, D.C.:National Academy Press.
O’Brien, P., and D. Mileti. 1992. ‘‘Citizen Participation in Emergency Response Followingthe Loma Prieta Earthquake.’’ International Journal of Mass Emergencies and Disasters 10:71–89.
Peacock, W., B. H. Morrow, and H. Gladwin, eds. 1997. Hurricane Andrew and theReshaping of Miami: Ethnicity, Gender, and the Socio-Political Ecology of Disasters. Gainesville,Fla.: University Press of Florida.
——. 2000. Hurricane Andrew and the Reshaping of Miami: Ethnicity, Gender, and the Socio-Political Ecology of Disasters. Miami, Fla.: Florida International University, InternationalHurricane Center.
Platt, R. 1995. ‘‘Lifelines: An Emergency Management Priority for the United States in the1990s.’’ Disasters 15:172–76.
——. 1999. Disasters and Democracy: The Politics of Extreme Natural Events. Washington,D.C.: Island Press.
Puente, S. 1999. ‘‘Social Vulnerability to Disaster in Mexico City.’’ Pp. 295–334 inJ. K. Mitchell, ed., Crucibles of Hazard: Mega-Cities and Disasters in Transition. Tokyo:United Nations University Press.
Pulido, L. 2000. ‘‘Rethinking Environmental Racism: White Privilege and UrbanDevelopment in Southern California.’’ Annals of the Association of American Geographers90:12–40.
Putnam, R. D. 2000. Bowling Alone: Collapse and Revival of the American Community.New York: Simon & Schuster.
Rossi, R. J., and K. J. Gilmartin. 1980. The Handbook of Social Indicators: Sources,Characteristics and Analysis. New York: Garland STPM Press.
Savageau, D. 2000. Places Rated Almanac. Foster City, Cal.: IDG Books.
Shaw-Taylor, Y. 1999. Measurement of Community Health: The Social Health Index. Lanham,Md.: University Press of America.
Smith, D. 1973. Geography of Social Well Being. New York: McGraw Hill.
Smith, T. W. 1981. ‘‘Social Indicators: A Review Essay.’’ Journal of Social History 14:739–47.
260 Social Science Quarterly

Social Capital Community Benchmark Survey. 2002. Available at /http://www.cfsv.org/communitysurvey/results.htmlS.
Tierney, K. J., M. K. Lindell, and R. W. Perry. 2001. Facing the Unexpected: DisasterPreparedness and Response in the United States. Washington, D.C.: Joseph Henry Press.
Tobin, G. A., and J. C. Ollenburger. 1993. Natural Hazards and the Elderly. Boulder, Colo.:University of Colorado, Natural Hazards Research and Applications Information Center.
United Nations Development Program (UNDP). 2000. Human Development Report 2000.New York: Oxford University Press.
U.S. Environmental Protection Agency. 2002. Environmental Indicators. Available at/http://www.epa.gov/epaoswer/hazwaste/ca/eis.htmS.
U.S. Health and Human Services Administration. 2001. Community Health Status ReportAvailable at /www.communityhealth.hrsa.govS.
Webb, G. R., K. J. Tierney, and J. M. Dahlhamer. 2000. ‘‘Business and Disasters: EmpiricalPatterns and Unanswered Questions.’’ Natural Hazards Review 1(2):83–90.
World Bank. 2001. World Development Indicators. Environmental Indicators. Available at/www.worldbank.org/wdi2001/environment.htmS.
World Economic Forum. 2000. Pilot Environmental Sustainability Index. New Haven,Conn.: Yale Center for Environmental Law and Policy.
——. 2002. Environmental Sustainability Index. Available at /www.ciesin.columbia.edu/indicators/ESI/downloads.htmlS.
World Resources Institute. 1993. The 1993 Information Please Environmental Almanac.Boston, Mass.: Houghton Mifflin.
Social Vulnerability to Environmental Hazards 261