soil testing and soil health: forage...
TRANSCRIPT

Clain Jones, Soil Fertility [email protected] 994-6076
Soil Testing and Soil Health:Forage Focus
Sanders County Soils WorkshopMarch 21, 2018
Image by Ann Ronning

Why should land owners know something about soils?
• For healthy plants, tasty vegetables, good forage yields, and cover for livestock and wildlife
• To protect the environment
• For efficient use of resources (water, fertilizer, $)

Today’s topics
Explain soil health vs quality Present what can be learned from a soil test
• Soil nutrients• Soil properties
Explain limitations, to know which properties you can influence
Provide fertilizer guidelines and example calculation for forage
Compare fertilizer sources Consider options other than soil tests to guide
soil nutrient management

Hands-on is the best way to learn, but we’ll use clickers because….
1. I just had my nails done2. Clicker training isn’t just
for dogs3. There isn’t enough “dirt”
on the floor to get a good soil sample
33%33%
33%
Response Counter

What describes a good soil?
• Good aeration, drainage and tilth• Organic matter and organisms!• Doesn’t crust after planting• Soaks up heavy rains with little runoff• Stores moisture for drought periods• Has few clods and no hardpan• Resists erosion and nutrient loss• Produces healthy, high quality vegetables and crops

Soil Quality vs Soil Health
Soil Quality = properties that change little, if at all, with land use management practices• Texture• pH• Cation Exchange Capacity
Soil Health = dynamic properties which may be subjective to measure, but can be changed• Aggregation• Microbial activity• Tilth• Nutrient availability• Water holding capacity• Compaction
Which is measured with conventional soil tests?
SOM often is included in both lists

Soil test• To identify nutrient deficiency
or imbalance• To help calculate fertilizer rates• Can increase yield and/or save
on fertilizer costs, and decrease environmental risks
• Best done in early spring, but not when soil is wet, therefore in our climate perhaps best done in late fall
• See publications listed at end for details on ‘how-to’

Factor Value Impact/considerNutrient content
Nutrientdependent
Too little = hungry plants, too much = contaminate water, burn plants
Soil organicmatter
≤ 1 (%) Minimize bare soil, increase N, add legumes
> 3 (%) Little need for extra N on pasture
What to look for on a soil test report? Factors affecting plant health and production
Factor Value Impact/considerNutrient content
Nutrientdependent
Too little = hungry plants, too much = contaminate water, burn plants
Soil organicmatter
≤ 1 (%) Minimize bare soil, increase N, add legumes
> 3 (%) Little need for extra N on pasture
Soil pH
< 5 Poor seedling establishment< 6 Poor legume nodulation
> 8.3 Nutrients tied up
Soluble salts (EC)
> 4 (mmhos/cm)
Too saline, water stress, nutrient imbalance
Soil texture and CEC Water and nutrient holding capacity
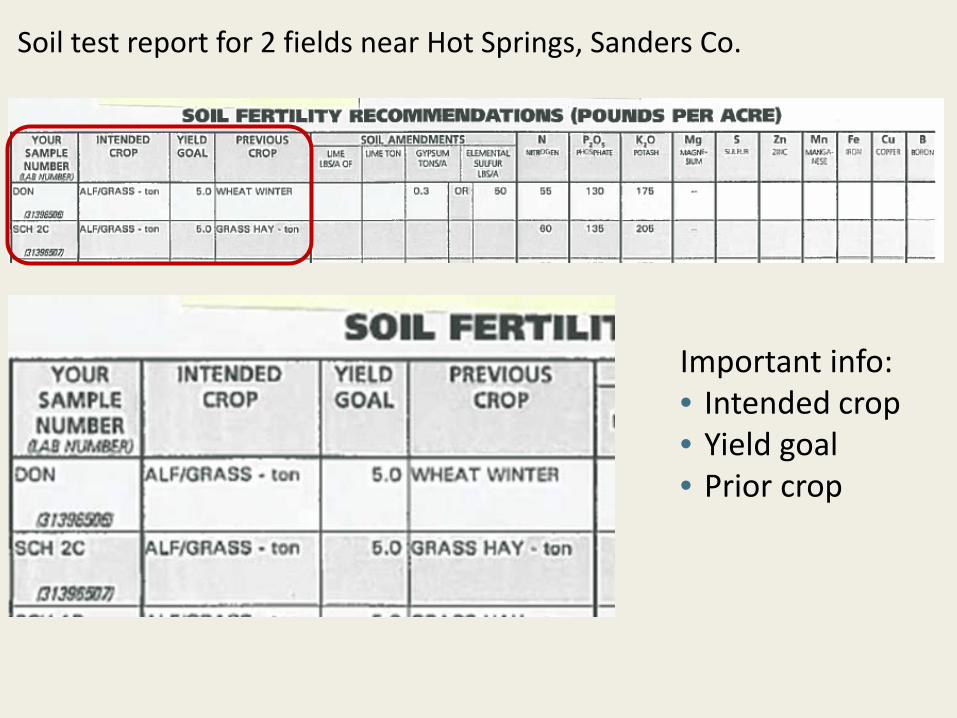
Soil test report for 2 fields near Hot Springs, Sanders Co.
Important info:• Intended crop• Yield goal• Prior crop
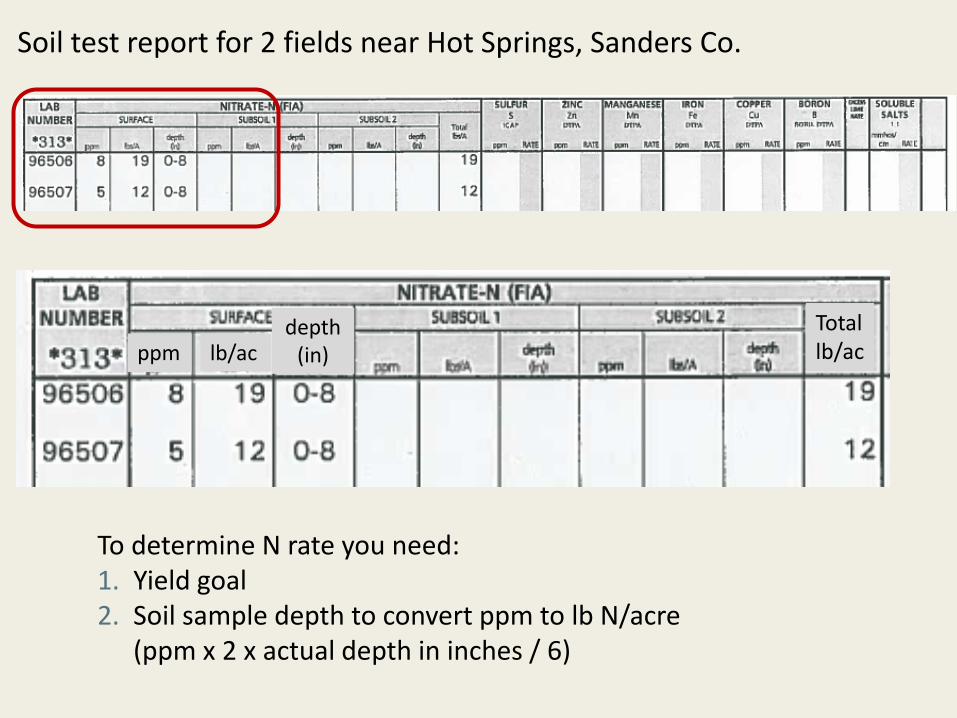
Soil test report for 2 fields near Hot Springs, Sanders Co.
To determine N rate you need:1. Yield goal2. Soil sample depth to convert ppm to lb N/acre
(ppm x 2 x actual depth in inches / 6)
Total lb/acppm lb/ac
depth (in)

Soil test report for 2 fields near Hot Springs, Sanders Co.
• P: MSU guidelines are based on Olsen P. Bray works in pH < 7.3, Olsen works pH > 6.
• SOM: soil organic matter• K • pH and CEC
ppm rate ppm rate ppm rate
Weak Bray Strong Bray Olsen
ppm rateK
pH CEC

Six questions to ask yourself before you add fertilizer1. Which elements do I need? (N, P, K, S, Ca)2. How much do I apply? 3. What type of material do I use?4. Which application method is best?5. When is the best time to apply it?6. Will I get a return ($ or environmental) on my
investment?
How do I know what to add to my soil???
A. Miller
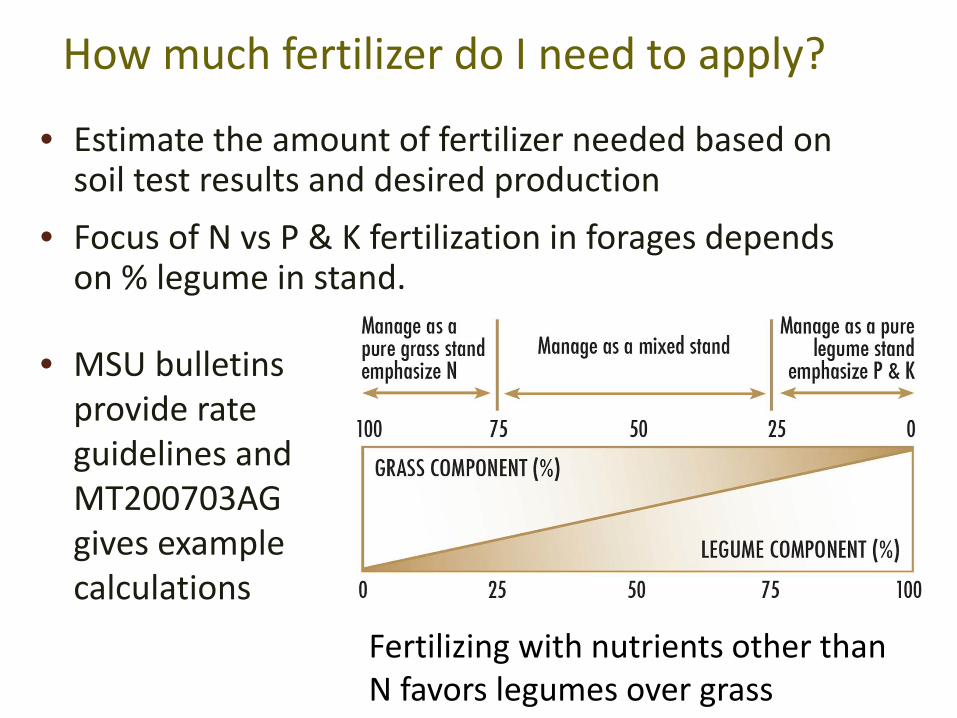
How much fertilizer do I need to apply?
• Estimate the amount of fertilizer needed based on soil test results and desired production
• Focus of N vs P & K fertilization in forages depends on % legume in stand.
• MSU bulletins provide rate guidelines and MT200703AG gives example calculations
Fertilizing with nutrients other than N favors legumes over grass
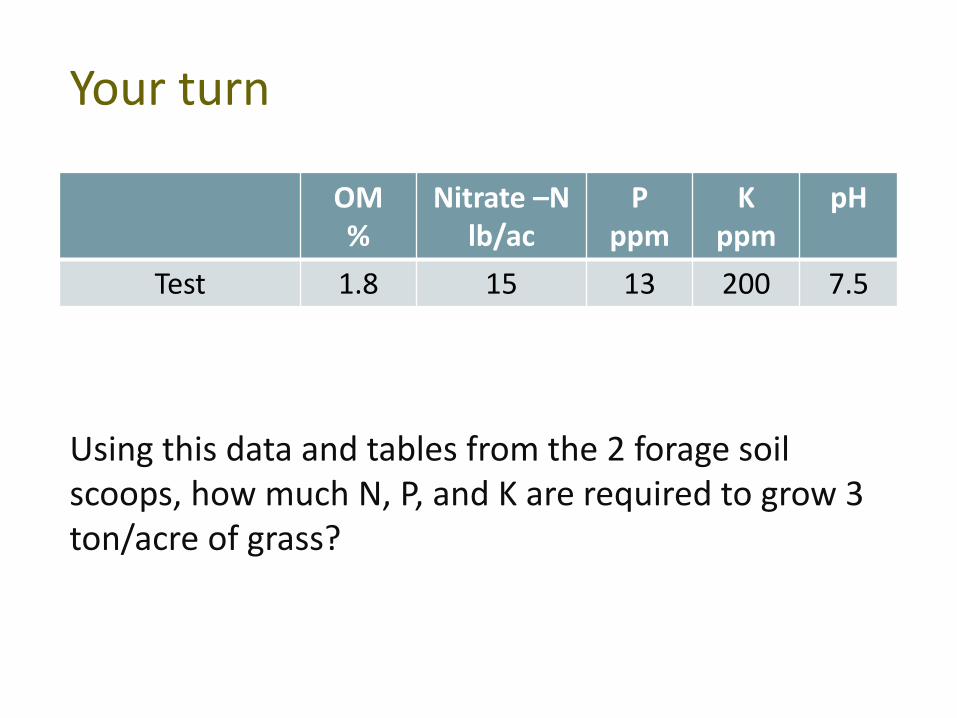
Using this data and tables from the 2 forage soil scoops, how much N, P, and K are required to grow 3 ton/acre of grass?
OM %
Nitrate –N lb/ac
P ppm
K ppm
pH
Test 1.8 15 13 200 7.5
Your turn
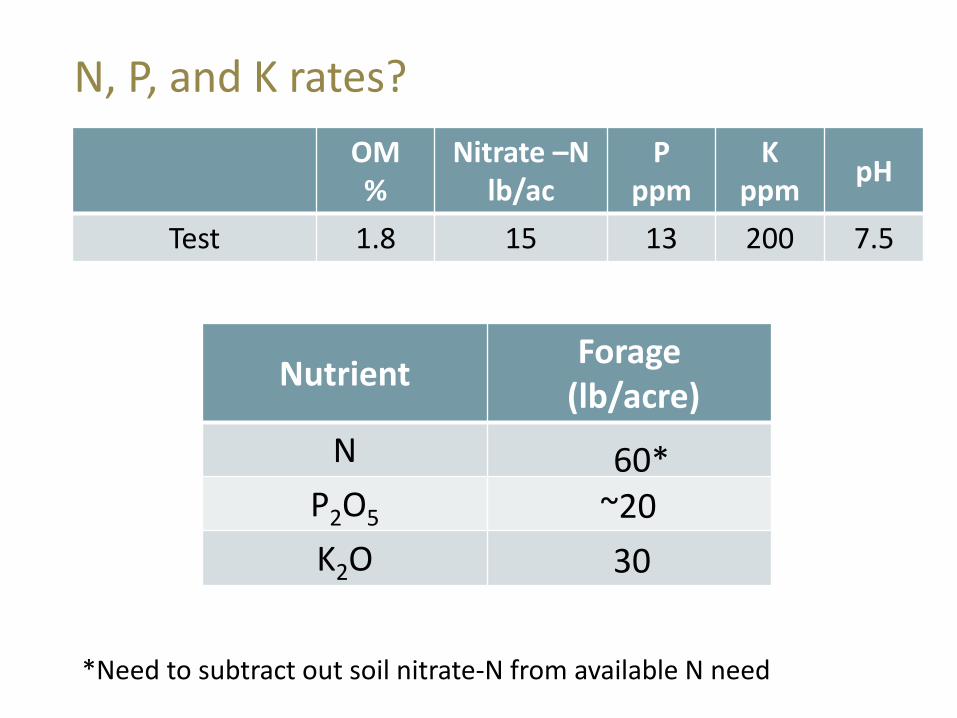
N, P, and K rates?
Nutrient Forage(lb/acre)
NP2O5
K2O
OM %
Nitrate –N lb/ac
P ppm
K ppm pH
Test 1.8 15 13 200 7.5
*Need to subtract out soil nitrate-N from available N need
60*~2030
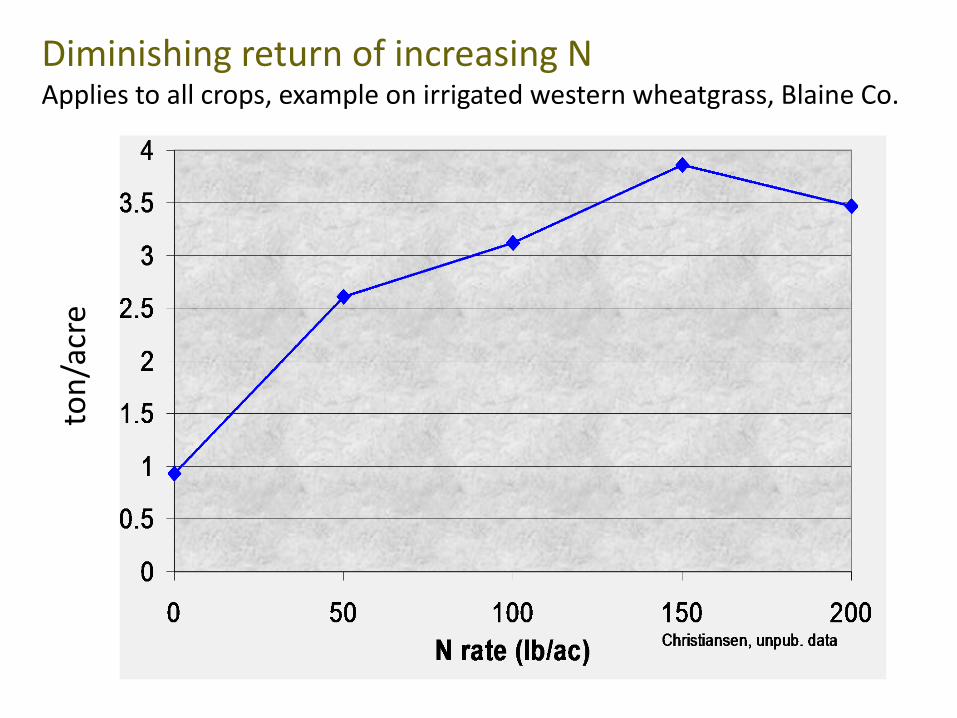
Diminishing return of increasing NApplies to all crops, example on irrigated western wheatgrass, Blaine Co.
ton/
acre

Challenges to high N use efficiency in perennial systems, and N options
• Plant residue intercepts fertilizer increases volatilization can tie up N
• Surface band liquid N• Polymer coated N works for
extended forage season or late cutting
• Legume in pasture mix or legume cover crop in market gardens may be best N source
• Urea needs 0.5” water or tillage to incorporate N
Malhi et al. 2002, Eckville, Alberta17.5” avg annual and 10.5” May-Aug precip

Sulfur tissue tests and visual symptoms are better than soil tests
Standard sulfate soil test too unreliable
Better to use• visual symptoms (yellow or light
green upper leaves)• tissue tests critical values
provided by lab or our documents• Last year production performance
Wheat, image from IPNI

Forage fertilization strategy• If a field containing < 75% legumes will be rotated to a different crop
soon, consider N for immediate gain• If goal is low input, long-term sustainable production rather
Lorbeer et al. 1994, Jacobsen et al.1996, Havre
than prime quality hay, adequate P and K are key and cheaper than re- or interseeding
• If you need to buy hay or rent pasture, consider fertilizing for long term benefit
• A single 50 lb N/acre on dryland grass was more economical over 5-yrs than a single 100 lb N/acre
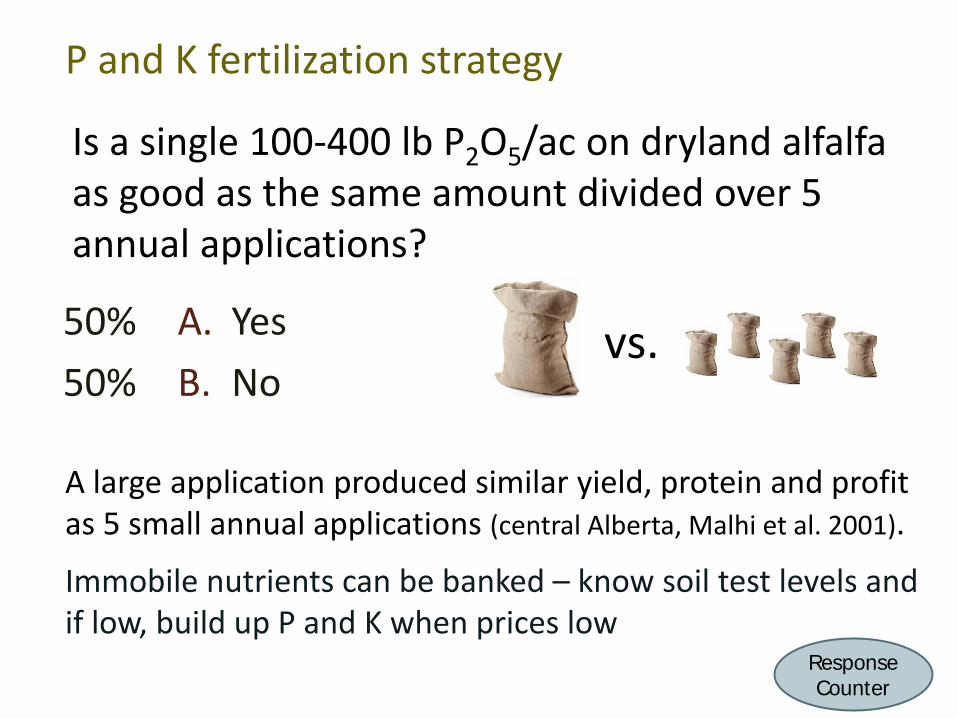
Is a single 100-400 lb P2O5/ac on dryland alfalfa as good as the same amount divided over 5 annual applications?
A. YesB. No
P and K fertilization strategy
vs.
A large application produced similar yield, protein and profit as 5 small annual applications (central Alberta, Malhi et al. 2001).
Immobile nutrients can be banked – know soil test levels and if low, build up P and K when prices low
Response Counter
50%50%

Questions?
On to conventional vs organic matter

Conventional/chemical fertilizers
• No carbon• Easy to store• Higher nutrient concentration• Custom formulated• Easy to use – but calibrate your
equipment• Liquid and solid• Coated specialty products reduce
leaching, volatilization, runoff losses.

Organic Fertilizers• Bulkier• Nutrient content low• Nutrient content difficult
to quantify• Supply organic matter and
other soil quality benefits
General % of dry weightType N P2O5 K2OManure compost 0.3 - 0.5 0.1 – 0.5 0.2 – 0.6Garden waste 1 – 1.5 0.2 – 0.5 0.5 – 1.5
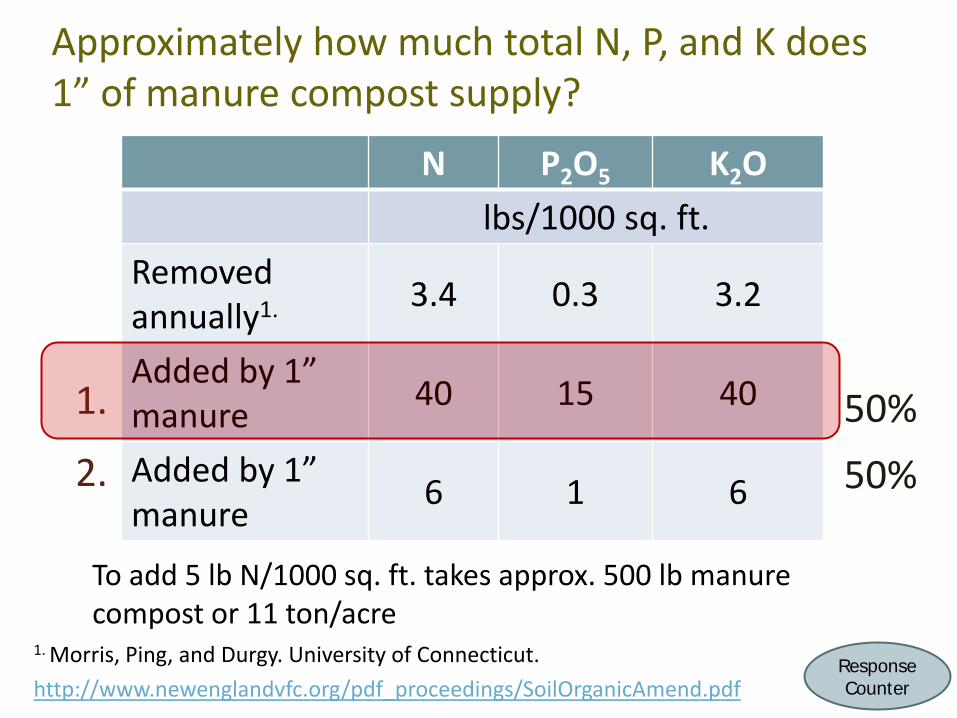
Approximately how much total N, P, and K does 1” of manure compost supply?
1. .
2. .
N P2O5 K2Olbs/1000 sq. ft.
Removed annually1. 3.4 0.3 3.2
Added by 1” manure 40 15 40
Added by 1” manure 6 1 6
50%50%
Response Counter
1. Morris, Ping, and Durgy. University of Connecticut. http://www.newenglandvfc.org/pdf_proceedings/SoilOrganicAmend.pdf
To add 5 lb N/1000 sq. ft. takes approx. 500 lb manure compost or 11 ton/acre
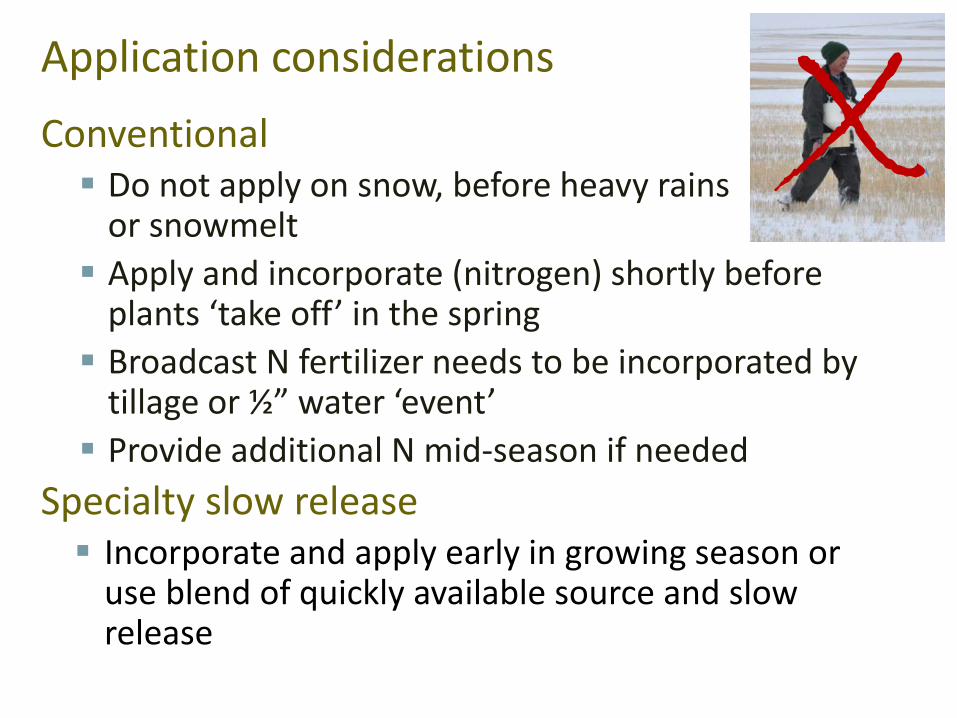
XApplication considerationsConventional Do not apply on snow, before heavy rains
or snowmelt Apply and incorporate (nitrogen) shortly before
plants ‘take off’ in the spring Broadcast N fertilizer needs to be incorporated by
tillage or ½” water ‘event’ Provide additional N mid-season if needed
Specialty slow release Incorporate and apply early in growing season or
use blend of quickly available source and slow release
Application considerations: organic material
Incorporate in the fall or spread composted in the spring, once ground thaws, but before growth starts
Do not apply on snow or frozen ground N can be ‘tied up’ due to high C Manure:
• Creates rapid buildup of P and K if fertilizing to meet N needs. Feed to P and K demands and use legumes to supply N
• Consider the salt, weed seed and pathogen content• Herbicide residual; SOM has huge CEC, CEC holds onto
herbicides - know your source!

Questions?
On to other factors that influence soil nutrient management

What else from a soil test?
Published rates are developed for entire state and sometimes based on neighbor state’s trials. They are likely not accurate for a particular field.

Which soil property does NOT influence nutrient availability?
A. Texture/surface areaB. pHC. CEC (cation exchange capacity
= the parking spaces in soil for nutrients)
D. SOM (soil organic matter)E. Color
22%21%16%
18%24%
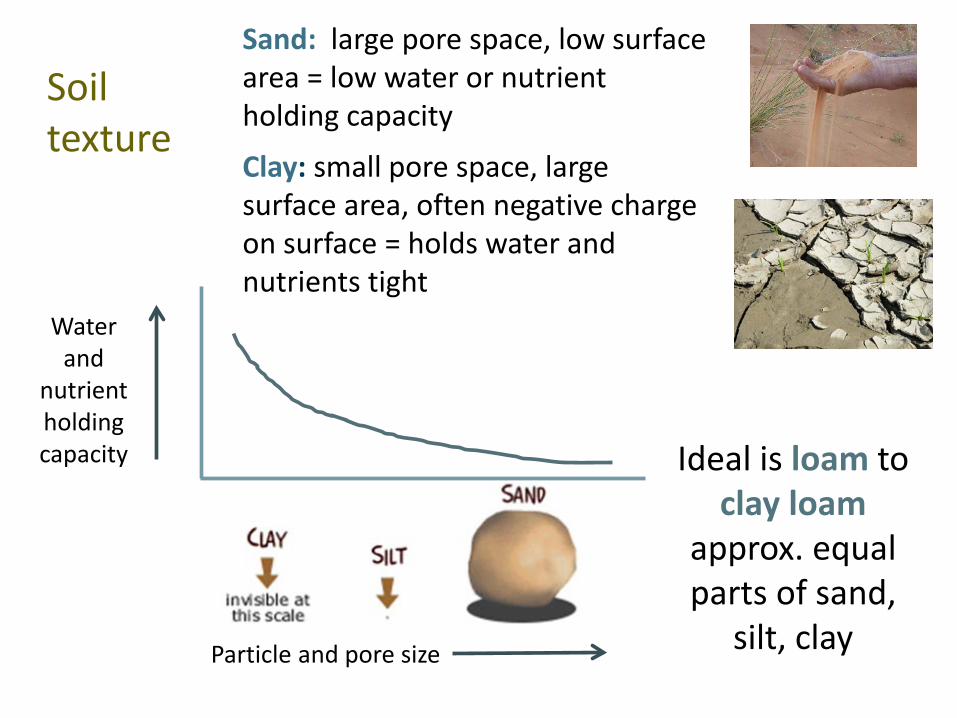
Particle and pore size
Water and
nutrient holding capacity
Sand: large pore space, low surface area = low water or nutrient holding capacity
Clay: small pore space, large surface area, often negative charge on surface = holds water and nutrients tight
Soil texture
Ideal is loam toclay loam
approx. equal parts of sand,
silt, clay

DrainageWater
holding capacity
Aeration CEC
Sand excellent poor excellent low
Silt good good good medium
Clay poor excellent poor high
Texture Effects on Soil Properties
Soils with large surface areas, such as clay and organic matter, have more cation exchange capacity and surface area and therefore are generally more fertile.
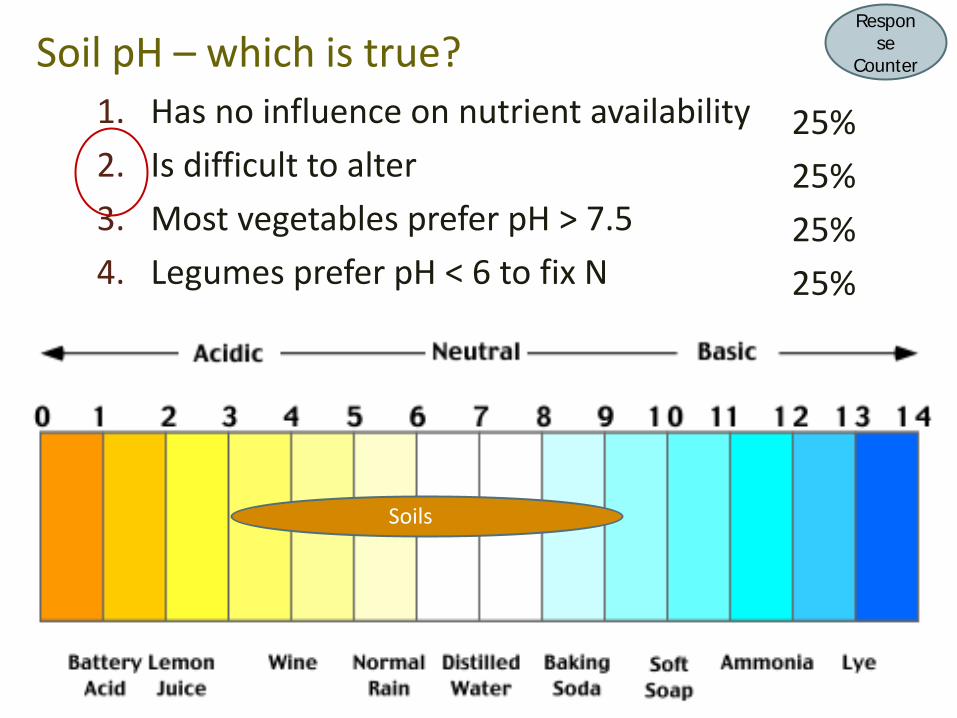
Soil pH – which is true?1. Has no influence on nutrient availability2. Is difficult to alter 3. Most vegetables prefer pH > 7.54. Legumes prefer pH < 6 to fix N
25%25%25%25%
Soils
Response
Counter
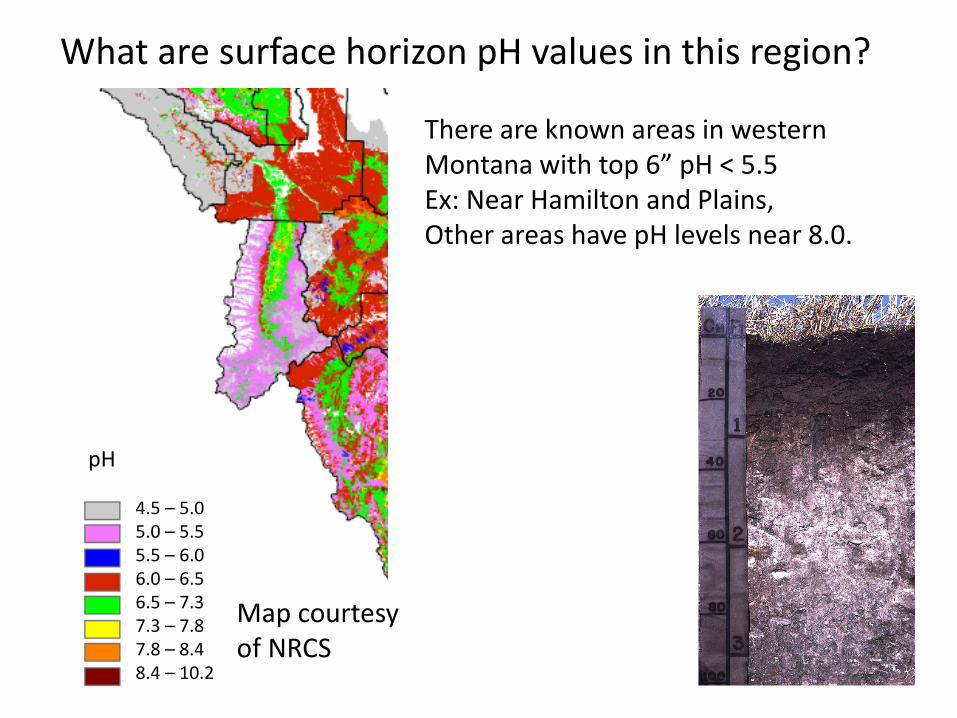
What are surface horizon pH values in this region?
There are known areas in western Montana with top 6” pH < 5.5Ex: Near Hamilton and Plains,Other areas have pH levels near 8.0.
4.5 – 5.05.0 – 5.55.5 – 6.06.0 – 6.56.5 – 7.37.3 – 7.87.8 – 8.48.4 – 10.2
pH
Map courtesy of NRCS

pH affects soil nutrient availability
High pH, alkaline calcareous soils – may limit P, Fe, Mn, B, Cu, Zn because they stick tight to the soil, plant can’t get them
Low pH, acidic soils –may limit N, Ca, Mg, Mo because they don’t stick tight and can leach away (Fe) or form minerals (P)

What is the best option to lower pH in highly calcareous soils?
A. Add elemental sulfur (S)
B. Add gypsum (CaSO4)
C. Add pine needles
D. No reasonable option to lower significantly and QUICKLY on LARGE scale
E. Use ammonia based N fertilizers (e.g., urea)
F. Plant legumes
17%
17%
17%
17%
17%
17%
Response Counter
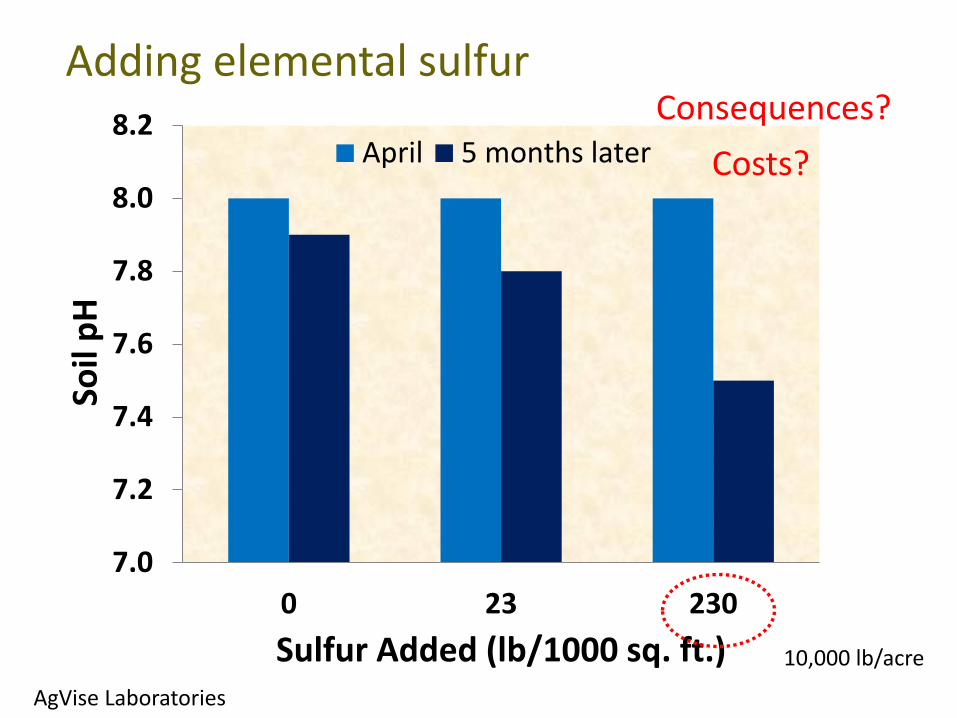
7.0
7.2
7.4
7.6
7.8
8.0
8.2
0 23 230
Soil
pH
Sulfur Added (lb/1000 sq. ft.)
April 5 months later
Adding elemental sulfurConsequences?
Costs?
AgVise Laboratories
10,000 lb/acre
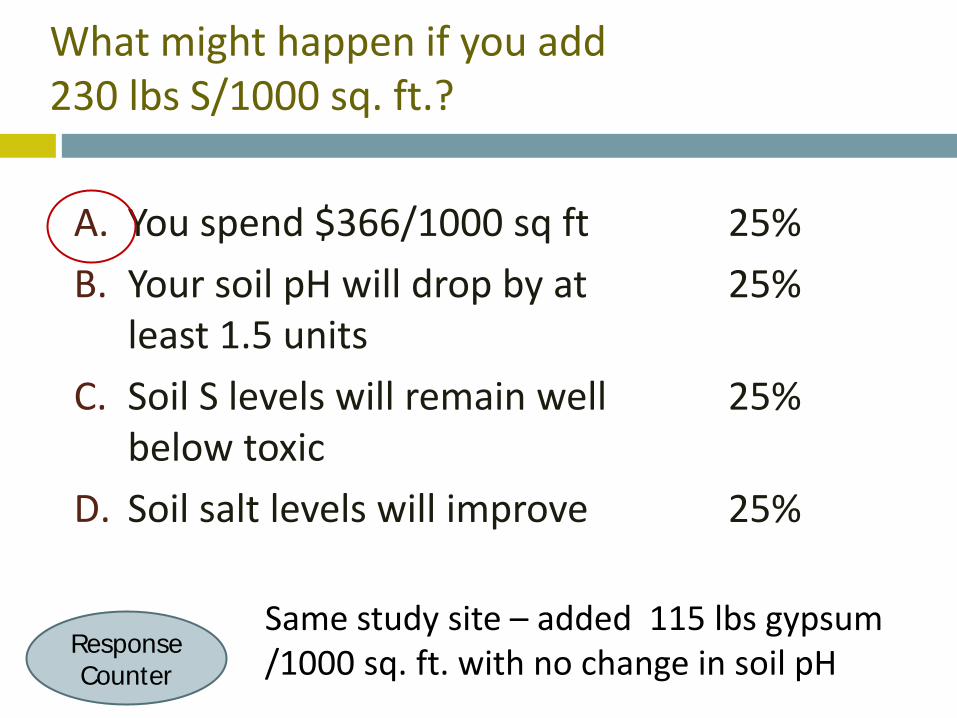
What might happen if you add 230 lbs S/1000 sq. ft.?
A. You spend $366/1000 sq ftB. Your soil pH will drop by at
least 1.5 unitsC. Soil S levels will remain well
below toxicD. Soil salt levels will improve
25%25%
25%
25%
Same study site – added 115 lbs gypsum /1000 sq. ft. with no change in soil pHResponse
Counter

Acid soils have many negative impacts
• Herbicide persistence (Raeder et al., 2015)
• Damaging to rhizobia (N-fixing by legumes)
• Increase in fungal diseases
• Increase Al and Mn to toxic levels
Image from CIMMYT, Int.
Images from Creative Commons
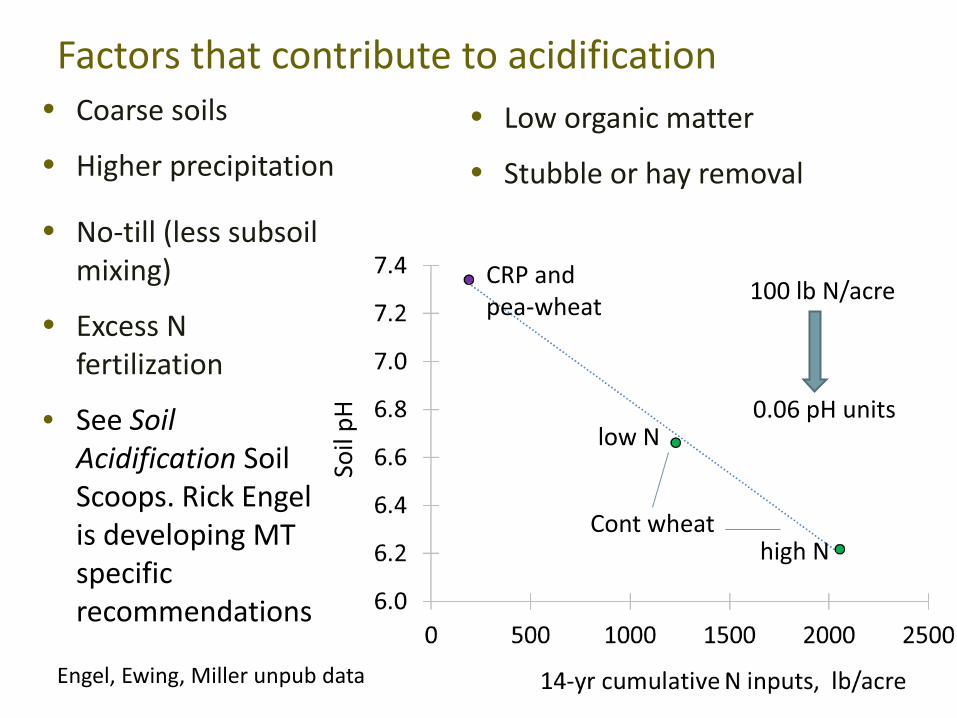
• Coarse soils
• Higher precipitation
CRP and pea-wheat
Cont wheathigh N
low N
100 lb N/acre
0.06 pH units
Engel, Ewing, Miller unpub data
• Low organic matter
• Stubble or hay removal
• No-till (less subsoil mixing)
• Excess N fertilization
• See Soil Acidification Soil Scoops. Rick Engel is developing MT specific recommendations
Factors that contribute to acidification
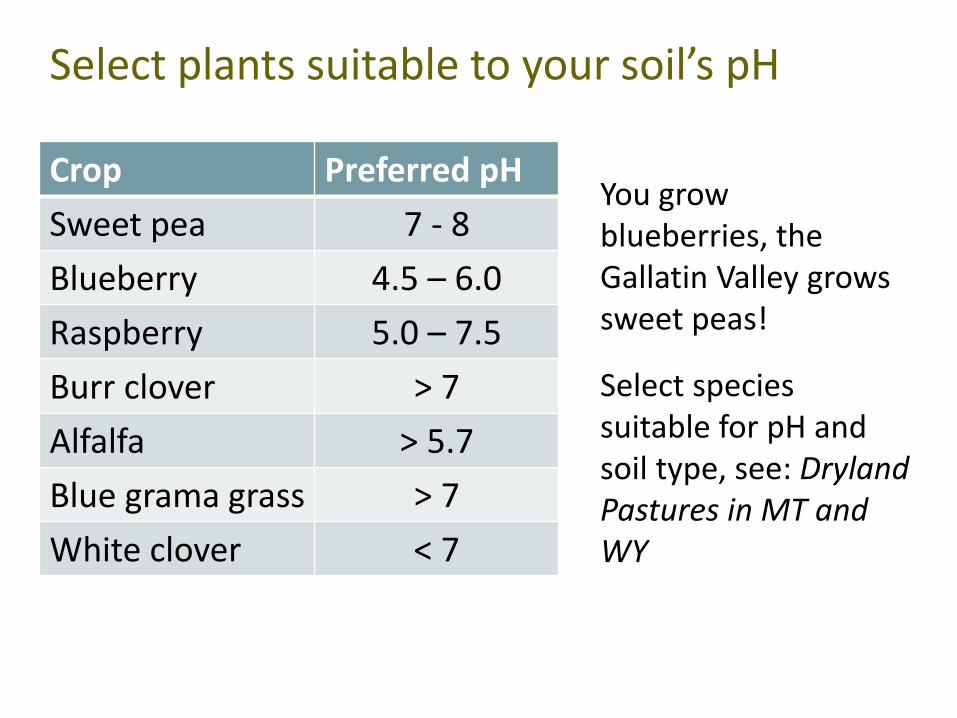
Select plants suitable to your soil’s pH
Crop Preferred pHSweet pea 7 - 8Blueberry 4.5 – 6.0Raspberry 5.0 – 7.5Burr clover > 7Alfalfa > 5.7Blue grama grass > 7White clover < 7
Select species suitable for pH and soil type, see: Dryland Pastures in MT and WY
You grow blueberries, the Gallatin Valley grows sweet peas!
Questions?
On to cation exchange capacity CEC and soil organic matter SOM
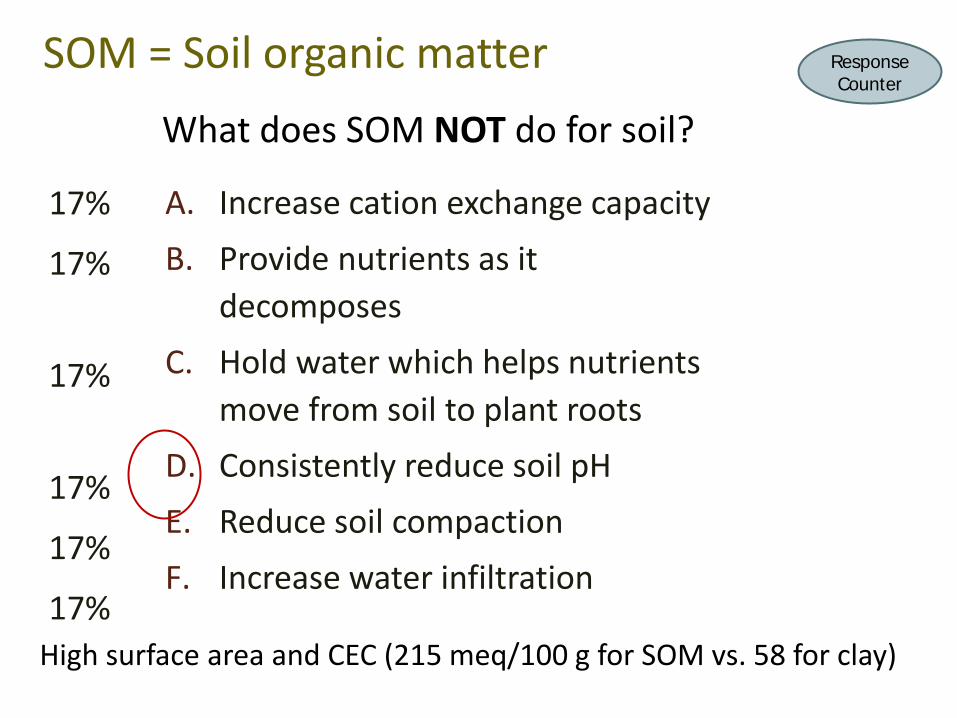
What does SOM NOT do for soil?
A. Increase cation exchange capacityB. Provide nutrients as it
decomposesC. Hold water which helps nutrients
move from soil to plant rootsD. Consistently reduce soil pHE. Reduce soil compactionF. Increase water infiltration
SOM = Soil organic matter
High surface area and CEC (215 meq/100 g for SOM vs. 58 for clay)
17%
17%
17%
17%
17%
17%
Response Counter

We can’t change CEC of mineral soil or soil pH very well, but can increase SOM to influence soil CEC
Guesses on how long to increase SOM from 1.4 to 1.5% SOM can change:
• takes a long time on cropland/pasture – MSU study, CRP (ungrazed, unharvested alfalfa) increased from 1.4% SOM to 1.48% SOM in 10 years in top foot.
• If you harvest hay, or graze pasture you are maybe maintaining, most likely losing SOM
Changing SOM

What is/was deficient here?
A. Ability to spellB. Time to read the bag labelC. Shouldn’t have handed the dog the
spreader
33%33%33%
Response Counter
ID of ‘problem’ is not always clear cut
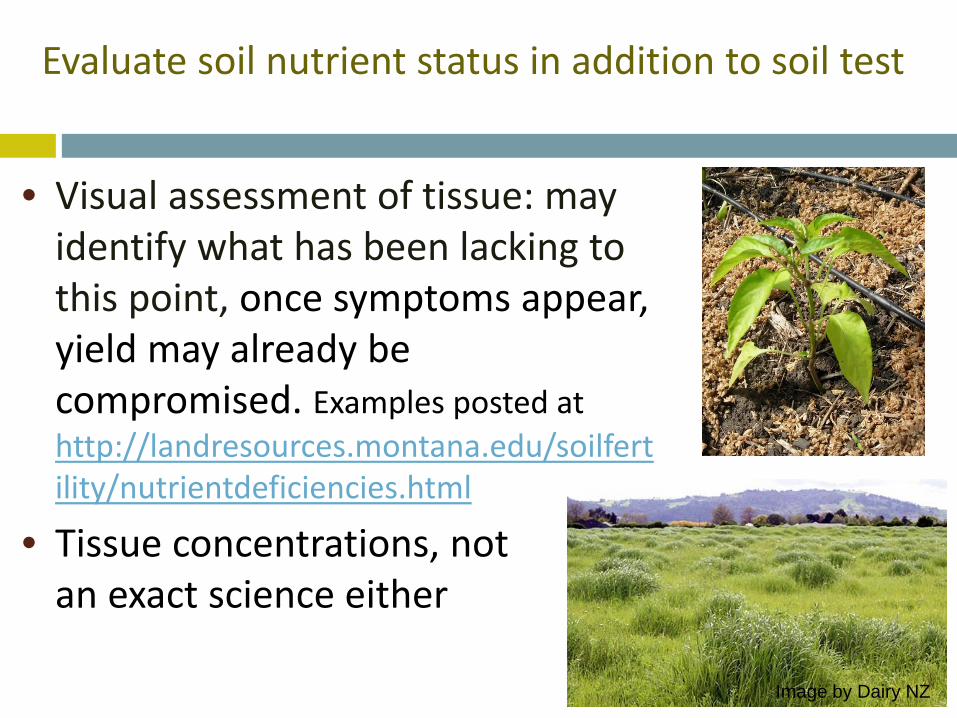
Evaluate soil nutrient status in addition to soil test
• Visual assessment of tissue: may identify what has been lacking to this point, once symptoms appear, yield may already be compromised. Examples posted at http://landresources.montana.edu/soilfertility/nutrientdeficiencies.html
• Tissue concentrations, not an exact science either
Image by Dairy NZ

How can I manage for healthy soils?
• Know your soil’s properties and only add amendments as needed
• The right source, rate and timing leads to optimal fertilizer use and plant health
• Observe and adjust to your specific conditions• Avoid compaction by:
• Reducing traffic and tillage when wet• Increase the organic matter content by:
• Moderate grazing• Adding manure
• Maintain soil cover with vegetation
ResourcesOn soil fertility website under Extension Publications
http://landresources.montana.edu/soilfertility/
Soil Nutrient Management for Forages: N (EB0217)
Soil Nutrient Management for Forages: PKSMicros (EB0216)
Soil Sampling Strategies (MT200803AG)
Interpretation of Soil Test Reports for Agriculture (MT200702AG)
Developing Fertilizer Recommendations for Agriculture (MT200703AG)
Soil Sampling and Laboratory Selection (4449-1) http://landresources.montana.edu/NM/
The Soil Scoop http://landresources.montana.edu/soilfertility/soilscoop.html

Questions?
Photo by Ann Ronning