solar optical telescope onboard hinode for diagnosing the solar ... · plasma and fusion research:...
TRANSCRIPT
Plasma and Fusion Research: Regular Articles Volume 2, S1009 (2007)
Solar Optical Telescope onboard Hinode for Diagnosingthe Solar Magnetic Fields
Kiyoshi ICHIMOTO and Hinode/SOT teamNational Astronomical Observatory/NINS, Mitaka, Tokyo 181-8588, Japan
(Received 13 December 2006 / Accepted 15 May 2007)
The Solar Optical Telescope (SOT) onboard Hinode is a 50 cm aperture telescope to observe the sun in visiblelights (388-668 nm) for the first time with high and extremely stable spatial resolution from space. The focal planepackage of SOT consists of Broad-band Filter Imager which provides the highest spatial resolution images of thesolar photosphere, the Narrow-band Filter Imager which takes 2-dimentional Dopplergram and Magnetogram ofphotosphere and chromosphere in high cadence and with wide field of view, and the Spectro-Polarimeter whichtakes full Stokes line profiles to provide the highest precision magnetic field maps of the photosphere. The mostoutstanding characteristics of SOT is its continuous and uniform data quality with the unprecedentedly highprecision and high spatial resolution of 0.2-0.3 arcsec.
The door of the telescope was deployed on 25th Oct. followed by a successful SOT first light. Initial check-outs of the instrument were conducted and superior performance of SOT was confirmed. SOT is starting theregular observation of the daily target region on the sun and producing excellent scientific data. Overview of theSOT instrument is summarized and initial results are demonstrated.c© 2007 The Japan Society of Plasma Science and Nuclear Fusion Research
Keywords: optical telescope, sun, solar atmosphere, magnetic field, polarization, spectroscopy
DOI: 10.1585/pfr.2.S1009
1. IntroductionThe solar atmosphere is highly magnetized plasma re-
vealing various type of active phenomena like mass ejec-tion (jets), sudden eruption of prominence (cool materialsuspended in the corona), vital explosion called as flare,and so on. The very existence of the hot and tenuous at-mosphere, corona, is one of the long-standing mysteryin astrophysics. It is recognized from the recent ground-based observations that the magnetic fields which drivesthe active phenomena in the corona is highly structured atthe photospheric level with a spatial scale of 0.2 arcsec orless [1], and high resolution observations of fundamentalprocess in solar photosphere is of a crucial importance tounderstand the dynamics of the solar plasma. This was thedriving force for us to start the Solar-B project in early1990th.
The Solar Optical Telescope (SOT) onboard Hinode isaimed to study fundamental processes taking place on thesolar surface and to provide definite boundary conditionsthat drive the various active phenomena observed in theouter solar atmosphere (corona) [2, 3]. Following the suc-cessful launch of Hinode satellite on 23rd Sep. 2006, thetop door of the telescope was deployed on 25th Oct. 2006and we met very successful first light immediately. Thanksto the sun-synchronous orbit of Hinode, SOT is now pro-viding continuous observation of the selected target regionon the sun, and sending us unprecedentedly high quality
author’s e-mail: [email protected]
images.In this paper, we describe the overview of the SOT
instrument, its performance in orbit, and demonstrate someof initial results.
2. The SOT Instrument2.1 Overview of the optical system
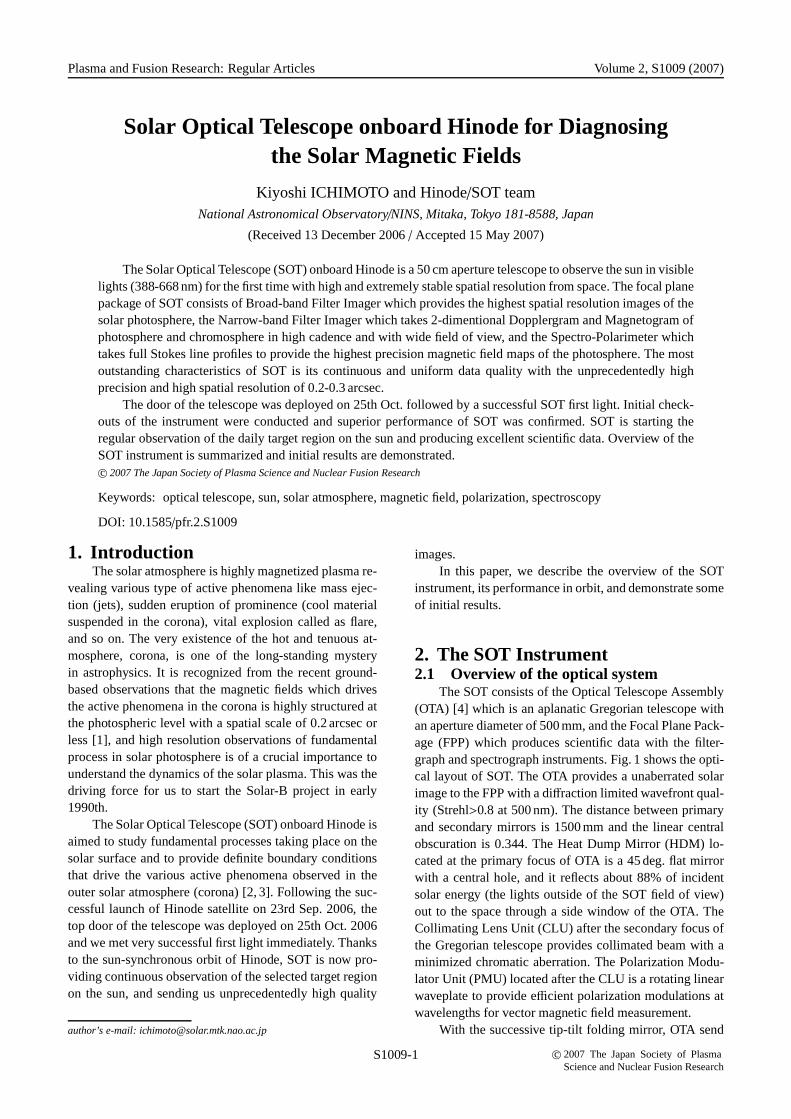
The SOT consists of the Optical Telescope Assembly(OTA) [4] which is an aplanatic Gregorian telescope withan aperture diameter of 500 mm, and the Focal Plane Pack-age (FPP) which produces scientific data with the filter-graph and spectrograph instruments. Fig. 1 shows the opti-cal layout of SOT. The OTA provides a unaberrated solarimage to the FPP with a diffraction limited wavefront qual-ity (Strehl>0.8 at 500 nm). The distance between primaryand secondary mirrors is 1500 mm and the linear centralobscuration is 0.344. The Heat Dump Mirror (HDM) lo-cated at the primary focus of OTA is a 45 deg. flat mirrorwith a central hole, and it reflects about 88% of incidentsolar energy (the lights outside of the SOT field of view)out to the space through a side window of the OTA. TheCollimating Lens Unit (CLU) after the secondary focus ofthe Gregorian telescope provides collimated beam with aminimized chromatic aberration. The Polarization Modu-lator Unit (PMU) located after the CLU is a rotating linearwaveplate to provide efficient polarization modulations atwavelengths for vector magnetic field measurement.
With the successive tip-tilt folding mirror, OTA send
c© 2007 The Japan Society of PlasmaScience and Nuclear Fusion Research
S1009-1
Plasma and Fusion Research: Regular Articles Volume 2, S1009 (2007)
Fig. 1 Optical layout of SOT.
Table 1 Basic parameters of four optical path.
the pointing stabilized beam to the FPP. The diameter ofHDM limits the allowable maximum offset pointing angleof SOT (or Solar-B) from the sun center; which is 19.6arcmin (for details of OTA, see Ichimoto etal. 2005 andShimizu 2004).
FPP has four observing paths; Narrowband Filter Im-ager (NFI), Broadband Filter Imager (BFI), Spectropo-larimeter (SP) and Correlation Tracker (CT). The entranceof FPP is the reimaging lens which refocus the solar imageinside the FPP. A focus error of SOT after the launch iseliminated by adjusting the position of the reimaging lensin orbit. The beam splitter assembly following the reimag-ing lens distributes the beam from OTA to four opticalpaths in FPP. Basic instrumental parameters of the four ob-serving paths are summarized in Table 1, while the observ-
Table 2 Observing wavelengths of SOT.
ing wavelengths and their scientific aim are summarized inTable 2.
NFI takes vector magnetograms and Dopplergramsin selected spectral lines and Hα images by using a tun-able Lyot-type filter. The tunable filter has a bandpass ofapproximately 0.1 A, and is located in a F/31 telecentricbeam. BFI takes photospheric images in the highest spatialresolution with a spatial sampling of 0.054 arcsec/pixel. A
S1009-2

Plasma and Fusion Research: Regular Articles Volume 2, S1009 (2007)
common CCD with a format of 4096× 2048 pixels is usedfor NFI and BFI. SP takes high precision full Stokes pro-files in magnetically sensitive FeI lines at 630.25 A and630.15 nm. By tilting a folding mirror in the SP path, thesolar image on the slit is shifted in east-west direction witha step of 0.16 arcsec and a range of 328 arcsec to take twodimensional map. CT produces a pointing error signal at580 Hz by taking the cross-correlation of granulation im-ages, and the signal is used to control the tip-tilt mirrorin OTA to stabilize the solar image on CCDs. By a closedloop control of CT and tip-tilt mirror, the pointing stabilityof < 0.03 arcsec rms is achieved [5].
2.2 Data productsThe PMU is a continuously rotating linear waveplate
with a rate of 1.6 sec/rev. Its retardance is designed to pro-duce an efficient polarization modulation in boh linear andcircular polarization at the wavelengths for vector mag-netic field measurement at FeI 630 nm and MgI 517 nm.
SP takes 16 images in every rotation of PMU witha fixed exposure length of 0.1 sec. By the processing ofthe successive frames (addition and subtraction), a full setof Stokes parameters of the pair of the FeI spectral linesat 630.15 nm and 630.25 nm is accumulated on board. SPtakes both of orthogonally polarized spectra simultane-ously to mitigate polarization noise induced by residualimage motions during the sampling. Typical onboard in-tegration time is for PMU 3 rotations (4.8 sec) for each slitposition and a photometric accuracy is about 0.001 in con-tinuum.
For NFI, a mechanical shutter can be used to iso-late the exposure duration against the phase of PMU. Inthis shutter-mode, full field of view observation is possiblewith a certain cost of the modulation speed and photomet-ric accuracy. The maximum exposure length is 0.4 sec forV measurement and 0.2 sec for Q and U measurements.The scheme of exposure sequence to obtain a set of po-larized images is flexibly controlled by the software. NFIhas a focal plane mask wheel with which the field of viewis restricted to enable a continuous readout of CCD insynchronous with the PMU without using the mechani-cal shutter. In this shutterless-mode, the NFI takes 16 im-ages in every revolution of PMU as SP, and onboard ac-cumulation and demodulation are performed to achievethe photometric accuracy of ∼0.001. The selectable fieldof view with the mask wheel is 16′′, 32′′, 64′′×163.8′′
corresponding1 × 1, 2 × 2 and 4 × 4 pixel binning.The BFI provides simple wide field of view images
with the mechanical shutter. Timing of exposures with re-spect to the PMU angle are again selectable.
The sequence of SOT observation is conducted by socalled ‘observation tables’ stored in the Mission Data Pro-cessor (MDP) onboard Hinode satellite. We can make aquite flexible planning of observation regarding the com-bination of observables, time cadence, field of view, etc.,
within the constraint of the allocated data rate. The datais compressed by MDP using the algorithm of DPCM orJPEG, where the quality (compression rate) is selectablefor JPEG. Thanks to the Svalbard Station which carries 15downlinks of the mission data every day, SOT can take thedata of about 10 GB/day after decompression at this point.The planning is conducted in daily basis in collaborationwith XRT and EIS instrument teams.
3. Instrument CheckoutAfter the deployment of the side door of OTA on 14th
October 2006, electrical components of SOT were turnedon and basic functional tests of moving mechanisms andcameras were carried out successfully. The period afteropening the side door and before opening the top door isdesignated as the initial bakeout phase of the OTA priorto introducing the sun light into the telescope, and decon-tamination heaters of the primary and secondary mirrors ofOTA were turned on to maintain the temperature of criticalsurfaces higher than other parts of the telescope. A numberof dark images of SP and FG were obtained in this periodfor forthcoming data reduction.
The top door of OTA was deployed on 25th Octoberwith the successful first light followed immediately. Theposition of the reimaging lens for the best focus was deter-mined and we confirmed that it is fairly close to the predic-tion from the pre-launch ground testing. The first light im-age in BFI/G-band (Figure 2) after the initial focus adjust-ment already reveals the diffraction limited performance ofSOT.
Image stabilization system consisting of CT and tip-tilt mirror is in operation after Hinode started the trackingof target regions on the sun by compensating the solar ro-tation. Figure 3 shows the time profiles of pointing errorproduced by CT. An excellent performance of the imagestabilization system is obvious with the achieved imagestability of ∼0.01 arcsec rms (three times better than the re-quirement). More quantitative results of the image qualityand CT performance will be described in separate papers.
Basic performance of the instruments, i.e., image
Fig. 2 G-band (430.5 nm) image of quiet region with BFI. Thesize of the smallest feature is about 0.2 arcsec (∼140 km)which correspods to the diffraction limit of this wave-length with 50 cm aperture.
S1009-3
Plasma and Fusion Research: Regular Articles Volume 2, S1009 (2007)
Fig. 3 Pointing error (signal from CT at 580 Hz; top and secondplots) and angle of tip-tilt mirror (third and bottom plots).Around 9:44, CT servo control was turned off. The point-ing error is about 0.01 arcsec rms during CT is in opera-tion.
quality, vignetting, light level and so on, were confirmed tobe fine as expected for all wavelengths of BFI and SP. It isalso confirmed that the NFI provides excellent longitudinalmagnetogram in FeI 630.25 nm line. However there foundunexpected degradation of a part of the NFI field of viewdue to a shade created in the tunable filter after launch. Bythis reason, the NFI is operated at this point under the lim-ited function, and engineering checkout is still on-going tofind the way of operating the tunable filter with minimuminfluence of the artifacts in NFI observation.
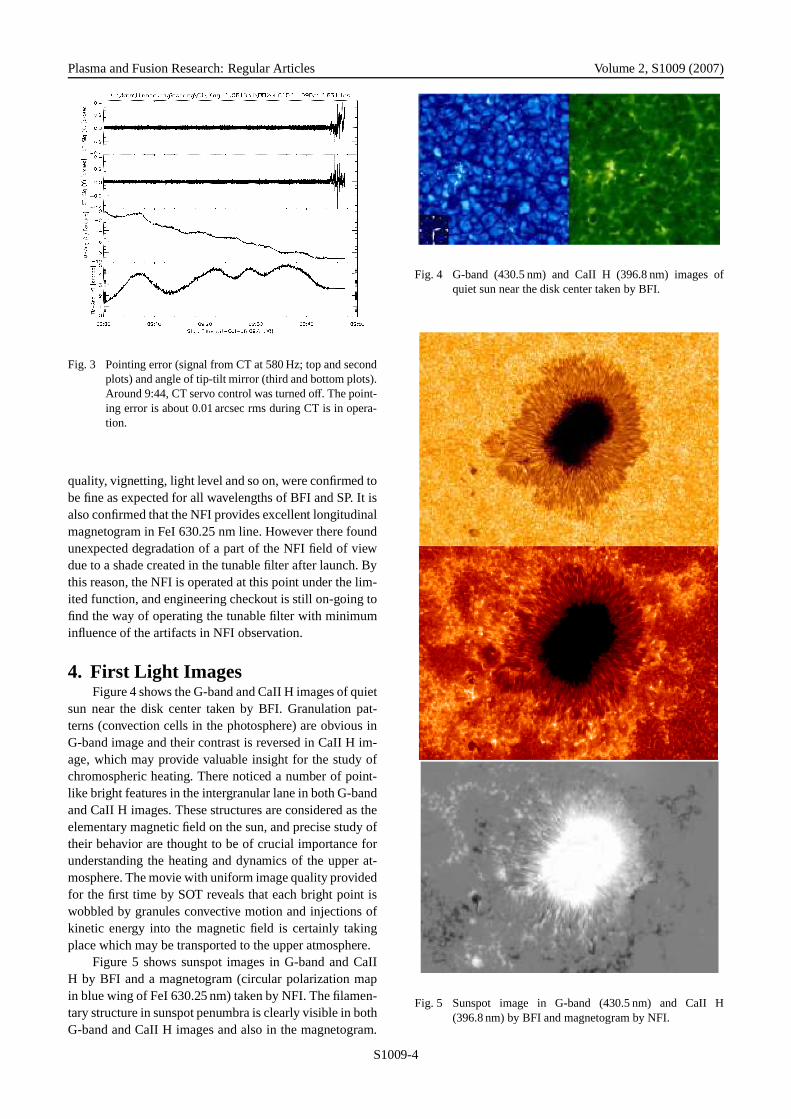
4. First Light ImagesFigure 4 shows the G-band and CaII H images of quiet
sun near the disk center taken by BFI. Granulation pat-terns (convection cells in the photosphere) are obvious inG-band image and their contrast is reversed in CaII H im-age, which may provide valuable insight for the study ofchromospheric heating. There noticed a number of point-like bright features in the intergranular lane in both G-bandand CaII H images. These structures are considered as theelementary magnetic field on the sun, and precise study oftheir behavior are thought to be of crucial importance forunderstanding the heating and dynamics of the upper at-mosphere. The movie with uniform image quality providedfor the first time by SOT reveals that each bright point iswobbled by granules convective motion and injections ofkinetic energy into the magnetic field is certainly takingplace which may be transported to the upper atmosphere.
Figure 5 shows sunspot images in G-band and CaIIH by BFI and a magnetogram (circular polarization mapin blue wing of FeI 630.25 nm) taken by NFI. The filamen-tary structure in sunspot penumbra is clearly visible in bothG-band and CaII H images and also in the magnetogram.
Fig. 4 G-band (430.5 nm) and CaII H (396.8 nm) images ofquiet sun near the disk center taken by BFI.
Fig. 5 Sunspot image in G-band (430.5 nm) and CaII H(396.8 nm) by BFI and magnetogram by NFI.
S1009-4
Plasma and Fusion Research: Regular Articles Volume 2, S1009 (2007)
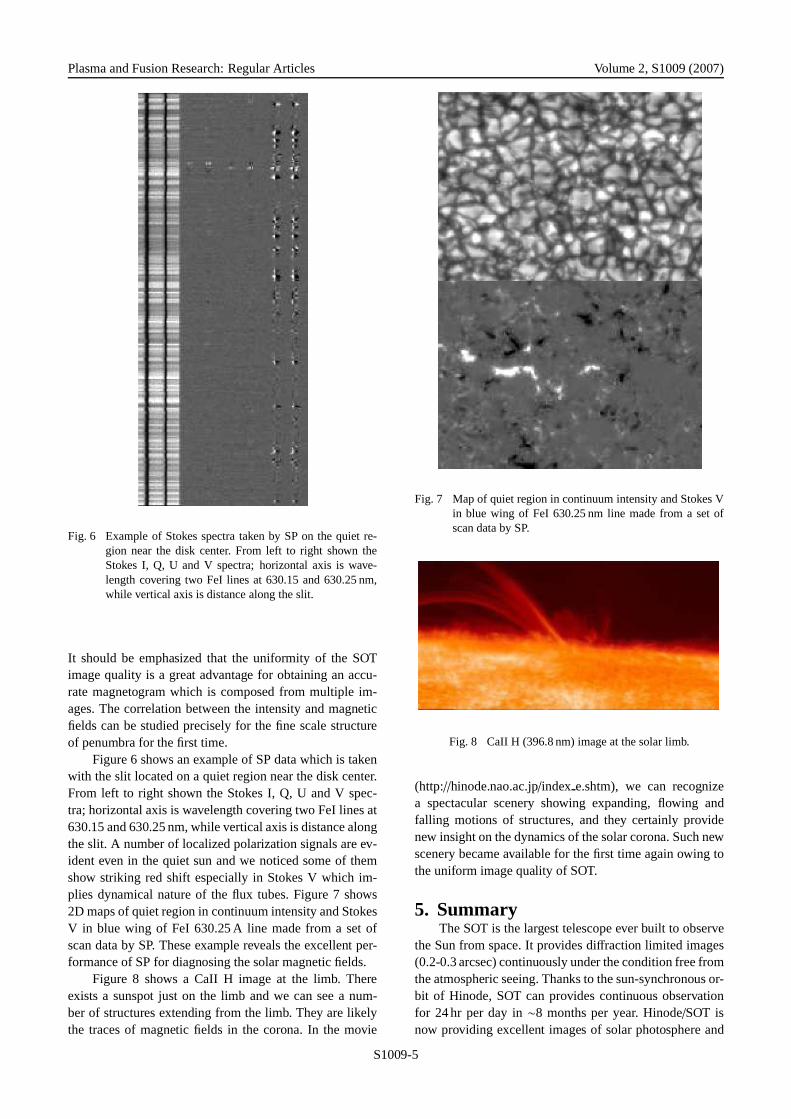
Fig. 6 Example of Stokes spectra taken by SP on the quiet re-gion near the disk center. From left to right shown theStokes I, Q, U and V spectra; horizontal axis is wave-length covering two FeI lines at 630.15 and 630.25 nm,while vertical axis is distance along the slit.
It should be emphasized that the uniformity of the SOTimage quality is a great advantage for obtaining an accu-rate magnetogram which is composed from multiple im-ages. The correlation between the intensity and magneticfields can be studied precisely for the fine scale structureof penumbra for the first time.
Figure 6 shows an example of SP data which is takenwith the slit located on a quiet region near the disk center.From left to right shown the Stokes I, Q, U and V spec-tra; horizontal axis is wavelength covering two FeI lines at630.15 and 630.25 nm, while vertical axis is distance alongthe slit. A number of localized polarization signals are ev-ident even in the quiet sun and we noticed some of themshow striking red shift especially in Stokes V which im-plies dynamical nature of the flux tubes. Figure 7 shows2D maps of quiet region in continuum intensity and StokesV in blue wing of FeI 630.25 A line made from a set ofscan data by SP. These example reveals the excellent per-formance of SP for diagnosing the solar magnetic fields.
Figure 8 shows a CaII H image at the limb. Thereexists a sunspot just on the limb and we can see a num-ber of structures extending from the limb. They are likelythe traces of magnetic fields in the corona. In the movie
Fig. 7 Map of quiet region in continuum intensity and Stokes Vin blue wing of FeI 630.25 nm line made from a set ofscan data by SP.
Fig. 8 CaII H (396.8 nm) image at the solar limb.
(http://hinode.nao.ac.jp/index e.shtm), we can recognizea spectacular scenery showing expanding, flowing andfalling motions of structures, and they certainly providenew insight on the dynamics of the solar corona. Such newscenery became available for the first time again owing tothe uniform image quality of SOT.
5. SummaryThe SOT is the largest telescope ever built to observe
the Sun from space. It provides diffraction limited images(0.2-0.3 arcsec) continuously under the condition free fromthe atmospheric seeing. Thanks to the sun-synchronous or-bit of Hinode, SOT can provides continuous observationfor 24 hr per day in ∼8 months per year. Hinode/SOT isnow providing excellent images of solar photosphere and
S1009-5
Plasma and Fusion Research: Regular Articles Volume 2, S1009 (2007)
chromosphere (∼10 GB/day); the BFI and SP are in oper-ation with their full performance, NFI is in operation butwith limited wavelength tuning; engineering checkout isstill ongoing.
It is promising that Hinode/SOT will provide over thenext 3-10 years unprecidented observations of the mag-netic field evolution in the photosphere, and, togetherwith the XRT/EIS observations, Hinode will open the newworld in the plasma physics of the solar atmosphere.
AcknowledgementThe SOT team members are S. Tsuneta, Y. Sue-
matsu, Y. Katsukawa, M. Noguchi, M. Nakagiri, S. Kamio(NAOJ), T. Shimizu, M. Kubo (JAXA/ISAS), T. Tarbell,R. Shine, A. Title, T. Berger (LMSAL), B. Lites, D. El-
more (HAO), T. Okamoto, S. Nagata (Kyoto-Univ.). SOTis a joint program between JAXA and NASA. The authorlikes to express his deep thanks to late Professor T. Ko-sugi of ISAS and Dr. L. Hill and J. Owens of NASA forcontinuous support of the development of SOT. OTA wasconstructed by Mitsubishi Electrical Corporation and FPPwas built by Lockheed Martin Corporation.
[1] J. Stenflo, Solar Magnetic Field (2001).[2] Y. Suematsu and the Solar-B Team., ASP conference series
289, 37 (2003).[3] T. Shimizu., ASP conference series 325, 3 (2004).[4] K. Ichimoto et al., SPIE conference series 5487, 1142
(2004).[5] T. Shimizu et al., SPIE conference series 5487, 1152
(2004).
S1009-6