some aspects of demographic consequences of the breakup of
TRANSCRIPT

41
Some ASpectS of DemogrAphic conSequenceS of the BreAkup
of former YugoSlAviA
Péter reményi
IntroductIon
The disintegration of former Yugoslavia can be seen as one of the major political
geographical changes in post-bipolar Europe. Civil war, the formation of short-lived
statelets, rapid and turbulent changes of borders, mass migration and large scale
devastation characterized the process as a result of which seven successor states had
emerged by the first decade of the 21st century.
We consider one of the major consequences of the above mentioned ‘political
geographical transition’ to be demographic. Mass migration was only one
(quantitative) element of this change, which was accompanied by a more worrisome
phenomenon: ethnic homogenization. This latter we take to be the qualitative element
of the demographic changes occurring in the region. Scholars who investigate the
history, society and politics of the fall of Yugoslavia agree in the presence of the
above phenomena, but there is still a dearth of measurement or objective comparison
of them in the specialist literature. Our objective is to present the results of a
mathematical formula which we think to be useful in measuring such changes. We
also aim to review and analyze the impacts of the breakup of Yugoslavia on individual
settlements, primarily from the aspects listed below:
• Demographic alteration, whether the population increased or decreased during
the examined period and if such change had any regularity
• Changes in the ethnic composition, specifically if there is any regularity in the
alterations.

42
Péter Reményi
ApplIed Methods
Our primary sources were the data from the 1991 and ‘around 2000’1 censuses and the
estimates of the national statistical institutes and those of international organizations
present in the region. In the case of the census it has to be noted that the method by
which the 1991 census was carried out differed from that of around 2000. Thus the
calculations based on these numbers cannot be considered fully accurate, still, they
prove to be a reliable source for comparison since they reflect the tendencies, the
directions and the volume of the changes.
Further primary sources are the analysis and reports run by various international
organizations and Think Tanks (specialized organizations of the UN, OSCE,
International War and Peace Reporting, International Crisis Group, Balkan
Investigative Reporting Network, Bosnia Institute, etc.), the EU’s reports on the
region, its security, integration and the documents of the affected countries on
regional development. The fieldwork we conducted in the target region also proved
essential in our work. Our primary tool was borrowed from mathematical statistics.
As we have stated above, one of the most significant impacts of the ‘political
geographical changes’ of the region is the changes in ethnic content; the previous
mosaic structures ceasing to exist and the homogenization of ethnic spaces and cities.
Since the ethnic groups differ from region to region we consider it insufficient to rely
on the approach of merely describing the migration of ethnic groups by identifying
both old and new locations and establishing whether they formed minorities or
majorities in the new territories. We led the examination based on the so-called
diversity index, since almost all regions in the analysis are affected by homogenous
tendencies in which all ethnic groups are involved. The so-called Simpson diversity
index, originally coming from the field of biology and measuring biodiversity in an
ecosystem, later being applied to geography in Hungary by Péter Bajmócy, shows the
likelihood of a member in a community belonging to a given ethnic group meeting
other members of the same or different ethnic groups (Bajmócy P. 2004). Applying the
following mathematical formula we arrive at values between 0 and 1, where 0 indicates
a completely homogenous population while 1 is a community where everyone is of
different ethnicity.
1 Serbia 2002, Macedonia 2002, Croatia 2001, Montenegro 2003, N.B. There were no censuses after 1991 in Bosnia-Herzegovina and Kosovo. Data on these areas are retrieved from estimations of national statistical offices and international organizations (Alfaro 2000, OSCE 2005-2006).

43
Some Aspects of Demographic Consequences of the Breakup of Former Yugoslavia
, where
L: a population of settlement (općina)
e1, e2,….en: number of persons belonging to the ethnic groups
EDI: ethnic diversity index
Comparisons of diversity indices of the individual states lead to false results due
to the fact that the censuses of 1991 and ‘around 2000’ do not treat the same number
of ethnic groups. However, these censuses did contain the same ethnic groups in
relation to states regarding the two censuses, and so we can compare the diversity
indices and the extent of changes at state level between the two points of time, which
can also be carried out at settlement level. In other words, it is not only the diversity
index (EDI) but alterations in it (ΔEDI=EDI1991-EDI2001) which are our most important
measurements in evaluating the ethnic changes of settlements.
the deMogrAphIc IMpAct of YugoslAvIA’s breAkup
changes within population
We consider the changes of population in numbers the most important demographical
alteration of the breakup. The Wars of Yugoslav Succession have resulted in the
greatest European population movement since WWII. In the war-affected regions the
population declined (the vast majority of Bosnian regions, Krajinas, Slavonia) while
on the other hand the population on some parts of the ‘peaceful’ (not directly affected
by extensive armed conflict) regions increased due to the mass inflows of refugees.
In proportion, the most significant decline was that of Croatian Krajinas due to
the expelled Serbian population only partially being replaced by Croatian settlers. The
population in Central and Eastern Slavonia decreased as well but to a lesser extent,
because of the peaceful return of Eastern Slavonia (Erdut Agreement, 1998) and of
larger-scale Croatian settlement induced by the more favorable natural and settlement
conditions.
In Bosnia-Herzegovina the regions to experience declines in population were
mainly as follow: settlements in Central Bosnia, the Bosnian Krajinas, settlements
along the Drina and the area known as the Posavina corridor. The Serb, Bosniak and

44
Péter Reményi
Croat ethnic regions adjoin the Central Bosnian settlements, meaning that maximum
ethnic diversity presentes not only two- but three-sided struggles.
Table 1: Municipalities with the highest absolute and relative population decline, 1991-2004.
city (općina) persons city (općina) rate of decline
Sarajevo metropolitan area (BiH) -123 162 Donji Lapac (Hr) -76,62%
Peć (Kos) -45 943 Bos. Grahovo (BiH) -70,03%
Belgrade metropolitan area (Sr) -41 610 Dvor (Hr) -60,73%
Vukovar (Hr) -21 346 Glamoč (BiH) -59,90%
Knin (Hr) -20 655 Obrovac (Hr) -58,65%
Zavidovići (BiH) -20 461 Kupres (BiH) -58,57%
Maglaj (BiH) -19 744 Vrginmost (Gvozd) (Hr) -57,55%
Jajce (BiH) -19 246 Benkovac (Hr) -57,42%
Travnik (BiH) -19 033 Glina (Hr) -57,00%
Benkovac (Hr) -18 973 Novo Brdo (Kos) -56,74%
Zenica (BiH) -17 082 Gračac (Hr) -54,70%
Osijek (Hr) -16 975 Vareš (BiH) -54,33%
Zadar (Hr) -16 949 Knin (Hr) -48,93%
Kotor Varoš (BiH) -16 740 Bos. Petrovac (BiH) -47,23%
Negotin (SR) -16 130 Kotor Varoš (BiH) -45,65%
Source: Own calculations from data from statistical institutions
However, the population in the third region where serious armed clashes
took place did not decline. During early 1991 and early 2000 the most significant
population increase in the post-Yugoslav region can be found in Kosovo, with only
a few settlements as exceptions. Kosovo is an administrative entity where the figures
(even in the census of 1991) were only estimated or else politically influenced, thereby
providing unreliable data for population changes. That said, Albanian’s highest
natural reproductive index within Europe should also be taken into consideration.
The picture for Serbia is an even more complex mosaic; generally speaking, the
population is declining in the eastern and southern municipalities while the cities
and the area of Novi Sad are experiencing positive changes even if the Belgrade
agglomeration is suffering from significant losses.
We cannot make such strict distinctions for Macedonia FYR. There different
municipalities are experiencing either increasing or decreasing populations, but
unlike in the case of the other succession states no sharp contrasts can be detected.

45
Some Aspects of Demographic Consequences of the Breakup of Former Yugoslavia
While the highland areas are declining demographically, unsurprisingly the areas
with Albanian inhabitants show positive tendencies.
Besides the above-mentioned southern part of Vojvodina the cities and the urban
areas (Pančevo Čačak, Niš, Vranje, Novi Pazar, Sombor) and coastal zones with high
standards of living also demonstrate positive tendencies. In Croatia these positive poles
are the Zagreb agglomeration, the coastal area of Istria and the Kvarner Islands, the
Split agglomeration and the South Dalmatian towns and cities. In all cases the positive
migrational balance is the main reason for the increase, where both the push factor
(escaping from hostile territories) and the pull factor (prospect of better living) exist.
The areas in Bosnia-Herzegovina which remained safe from armed conflict did
not suffer from significant decline in population and also accepted large numbers of
refugees from less fortunate areas. Banja Luka and Bijeljina, the western part of the
Posavina Flatland, became the most desired targets for the Serbians. The southern rim
of the Posavina corridor became a shelter for the Muslim population, the least fierce
battles occurring in this area. Herzegovina’s eastern settlements grew in number due
to Serbian migration and the western ones due to Croatian settlers. The area was not
severely impacted by war and pre-war ethnic diversity was smaller; thus, the number
of people leaving the area remained low as well.Figure 1: Population changes of Yugoslav succession states at the settlement level,
between 1991 and early 2000.
Source: data and estimates from statistic institutions; cartography: Á. Németh.

46
Péter Reményi
ethnic homogenization
The primary objectives of the war accompanying the breakup of the state were the
securing of political independence in the occupied areas, the satisfying of nationalist
territorial needs and the homogenization of the possessed and the occupied territories.
Since the ethnic composition of the region prior to 1991 was the most diverse in the
whole of Europe, the individual national objectives could only be achieved at the
expense of other nations (Juhász J. 1997). We do not state that the breakup was a
direct consequence of ethnic tensions, nor do we think that ancient ethnic hatreds
caused the conflict, but once it broke out the main driving force was ethnic-based
territorial power. The mismatch of ethnic and administrative borders and in Bosnia-
Herzegovina the lack of ethnically homogenous territories which could have been a
base for territorial political formations was the main obstacle to peaceful separation.
The change in this situation resulted in ethnic-based conflicts, ethnic cleansing and
homogenization.
The fear and the conflict itself forced millions to leave their homes. This forced
migration is undoubtedly of an ethnic nature and generally, though not in all affected
regions, has led to ethnic homogenization of the area. As a result, the multicultural
region of the Western Balkans has disappeared, just as have the ethnic mosaic structures
of several areas.
The statistically provable homogenization is detectable not so much over larger
territorial units (the Western Balkans, the federal republics) but rather at territorial
meso-levels (entities, counties, municipalities) and settlement level, while the ethnic
homogeneity of the former state has hardly changed. The succession states of former
Yugoslavia—Slovenia excluded—show a growth of only 0.3% in the homogenization
index.
From evaluating the data we came to the conclusion that it is not primarily the
proportion of various ethnicities, not the region’s ethnic diversity that became modified
by the war but that the settlement areas of ethnic groups of the region began to become
clearly distinguishable. This is supported by the fact that the ethnic homogenization
of the former Yugoslavia can be considered insignificant, but that of the individual
succession states and the territorial units within them are considerable.

47
Some Aspects of Demographic Consequences of the Breakup of Former Yugoslavia
Table 2: The change of ethnic diversity index of Yugoslav successor states and other subnational territorial formations between 1991 and 2004.
Republic / entity / autonomous area ΔEDI (pp)
BOSNIA AND HERZEGOVINA -5
Federation of Bosnia and Herzegovina -22
Bosnian Serb Republic -26
CROATIA -18
MACEDONIA 2
MONTENEGRO 11
SERBIA PRIOR 2008 (Serbia Proper + Vojvodina + Kosovo) 1
SERBIA AFTER 2008 (Serbia Proper + Vojvodina) -5
SERBIA PROPER -4
KOSOVO -13
VOJVODINA -9
YUGOSLAVIA (EXCLUDING SLOVENIA) -0,3
Source: statistic institutions
Using the ethnic diversity index, the Yugoslav successor states can be grouped into
two categories; the change in the ethnic diversity is either only minor, easily supported
by natural processes such as assimilation or the cessation of “Yugoslav” as a category,
or considerable, the result of significant homogenization.
The ethnic homogenization of the population that took place in Croatia and
Kosovo was due to the majority driving out the undesirable minorities by force and
overcoming them by demographical means. The expulsion of Serbs from both regions
and in Kosovo the faster natural growth of Albans are the main explanation for this.
The population of Serbia has undergone slight homogenization. It has also
obtained a collective result deriving from the decrease in the number of people that
chose Yugoslav as their ethnic category at the census of 2002, from Serbs driven
out of Croatia, Bosnia-Herzegovina and Kosovo settling in Serbia and from the
natural process of assimilation of such minorities as Hungarians, Slovaks and other
minority groups. Due to counter-homogenetic demographical processes – the higher
reproduction rates of Albans (Bujanovac, Preševo) and Bosniaks (Sandžak) and the
growing numbers of the Vlachs (Eastern Serbia) all lead towards diversity - the ethnic
homogenization of the Serbs was of smaller degree than might have been expected
based on the large number of refugees moving to the country.
As much research has concluded (Kicošev S.–Kocsis K. 1998), a large proportion
of the refugees from the successor states of former Yugoslavia ending up in Serbia

48
Péter Reményi
chose to settle down in Vojvodina. This, and the number of Hungarians leaving
the territory are visible in the 9% drop rate of the diversity index of Vojvodina. The
absolute value of this rate is quite small but after the war-hit entities, Vojvodina is the
former Yugoslav region where the highest rate of homogenization can be observed.
The ethnic diversity of Macedonia and Montenegro have also increased, but for two
different reasons. One quarter of Macedonia’s population are Albans, and as a result
of their higher reproductive rate and opposition to assimilation the country shows a
pattern of growing ethnic diversity emanating from the growing proportion of one
minority within the population as whole. In Montenegro the aim for independence
had an extremely divisive impact upon society, for the choice of ethnic identity was
also a political choice and vice versa. In 1991 the majority of the population identified
themselves as Montenegrin but in 2003 those who were for maintaining the federal
state called themselves Serbs and the opposing factions Montenegrin.
Despite the fact that no official data on actual ethnic proportion are available
for Bosnia-Herzegovina, it can be stated with some assurance that at the state level
diversity has changed little, and that the 5% rate is the same as that of Serbia.Figure 2: Ethnic homogenization of successor states of former Yugoslavia
(based on alterations of ethnic diversity index) between 1991 and early 2000.
Source: own calculations from data and estimates of statistic institutions. Cartography: Á Németh

49
Some Aspects of Demographic Consequences of the Breakup of Former Yugoslavia
The ethnic structures with slight changes at state level present a larger alteration
at subnational levels. Following the Dayton Agreement, an extreme and legitimized
version of separation came into existence in Bosnia-Herzegovina. Serbs enjoy
a majority in Republika Srpska, while the other two major ethnic groups in the
Federation have an absolute majority. Further homogenization can be seen in the
cantons, indicating extreme ethnic segregation of the country.
Table 3: Ethnic changes and diversity indices for the cantons of the Federation of Bosnia and Herzegovina, 1991-2004. Statistical institutions
Ethnic changes (pp) ΔEDI (pp)Name of canton Serbian Croatian Bosniak
Unsko-Sanski -17,53 -1,02 21,95 -32Posavski -9,44 12,27 0,98 -18
Tuzlanski -9,94 -1,56 20,08 -30Zeničko-Dobojski -12,25 -5,38 25,11 -31
Bosansko-Podrinjski -26,48 -0,06 29,84 -42Srednjobosanski -9,23 0,63 14,24 -13
Hercegovačko-Neretvanski -11,58 9,81 9,18 -14Zapadno Hercegovački -0,09 1,97 -1,07 -4
Kanton Sarajevo -15,94 -0,31 28,79 -30Kanton 10 -23,26 27,54 -2,21 -24altogether -13,1 -0,37 20,52 -22
In analyzing ethnic homogenization at the municipality level we can identify
several other types of areas. Homogenization most extremely affects those municipalities
which suffered from armed activities, e.g. Slavonia, Kosovo, several parts of Croatian
and Bosnian Karjinas, Central Bosnia, the majority of the Bosnian Serb Republic (no
reliable data available for the whole region). In these areas homogenization is mainly
due to the minorities leaving the regions. In Dalmatia, Istria and Novi Sad the absolute
value of the minorities has not declined; there has, however, been a growth in the
majority group. These are the peaceful destination areas for large number of refugees.

50
Péter Reményi
Table 4: The top 15 settlements with highest rate of homogenization in the territory of former Yugoslavia (the Bosnian Serb Republic excluded 2),
with the changes of numbers in the top ethnic groups.
ΔEDI (pp) Croat Bosniak Serb Yug.. CG Alb. roma other Total
Zavidovići (BiH) -53 -7429 1572 -10959 -2703 0 0 0 -942 -20461
Travnik (BiH) -46 -21893 14629 -7269 -3688 0 0 0 -812 -19033
Kos. Polje (Kos) -45 -37 -1675 -5107 -65 -898 16626 -2996 -672 5127
Konjic (BiH) -44 -9506 3468 -5763 -1379 0 0 0 -447 -13627
Fojnica (BiH) -43 -5806 2212 -98 -396 0 0 0 -1028 -5116
Lukavac (BiH) -41 -609 11813 -11585 -3384 0 0 0 -1087 -4852
Čapljina (BiH) -40 2187 -5767 -3510 -1018 0 0 0 -342 -8450
Z. Potok (Kos) -40 -1 0 7749 -5 -26 -4711 0 -11 2995
Busovača (BiH) -39 1332 -7726 -374 -505 0 0 0 -159 -7432
Tešanj (BiH) -39 -8237 12680 -2743 -1038 0 0 0 -379 283
Jablanica (BiH) -39 -2063 3611 -387 -573 0 0 0 -178 410
Kladanj (BiH) -36 -6 3710 -3667 -272 0 0 0 -14 -249
Benkovac (Hr) -36 -474 -26 -18142 -165 1 -18 0 -161 -18973
Olovo (BiH) -34 -344 -17 -3154 -282 0 0 0 -100 -3897
Banovići (BiH) -34 24 8316 -4021 -1925 0 0 0 17 2411
Source: statistic institutions
In contrast, in areas where the absolute majority was not the state majority, the
change in ethnic diversity showed an increase. Such are the core territories of the
Croatian and Bosnian Krajinas, where the Serb population was 90% of the whole
ante bellum and during the war neither did all of them flee nor did there arrive large
numbers of Croatian refugees.
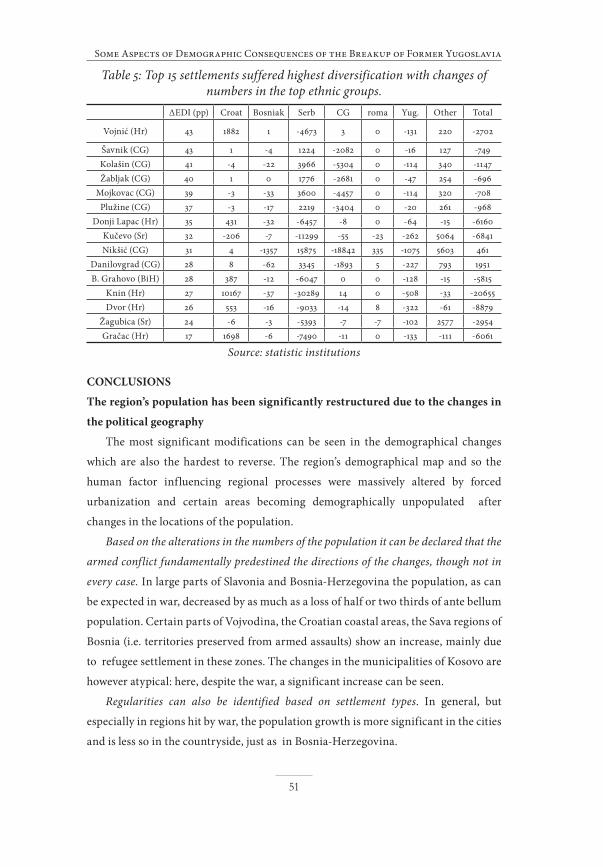
Vojvodina’s settlements with Hungarian (Subotica, Kanjiža, Senta, Čoka,
Bačka Topola, Bečej, Mali Iđos) and Slovakian (Bački Petrovac) majorities are also
characterized by diversification, this time resulting from a decreasing population not
because of the war but as a collective outcome of Serbs from the Krajinas settling
here and of the assimilation of the majorities (Hungarians and Slovaks) and their
moving into Hungary and Slovakia. Though the Serbs settling among the Hungarians
strengthen the diversity at the local level, the same phenomenon seen at the Vojvodina
or Serbia level demonstrates ethnic homogenization. Further diversification is visible
for reasons stated previously in the municipality of Montenegro. The East Serbian
diversification is the result of the strengthening identity of the Vlach ethnicity.
2 Not even officially estimated data can be found in connection to RS, unofficial estimate figures are dealt with due foresight.
51
Some Aspects of Demographic Consequences of the Breakup of Former Yugoslavia
Table 5: Top 15 settlements suffered highest diversification with changes of numbers in the top ethnic groups.
ΔEDI (pp) Croat Bosniak Serb CG roma Yug. Other Total
Vojnić (Hr) 43 1882 1 -4673 3 0 -131 220 -2702
Šavnik (CG) 43 1 -4 1224 -2082 0 -16 127 -749Kolašin (CG) 41 -4 -22 3966 -5304 0 -114 340 -1147Žabljak (CG) 40 1 0 1776 -2681 0 -47 254 -696
Mojkovac (CG) 39 -3 -33 3600 -4457 0 -114 320 -708Plužine (CG) 37 -3 -17 2219 -3404 0 -20 261 -968
Donji Lapac (Hr) 35 431 -32 -6457 -8 0 -64 -15 -6160Kučevo (Sr) 32 -206 -7 -11299 -55 -23 -262 5064 -6841Nikšić (CG) 31 4 -1357 15875 -18842 335 -1075 5603 461
Danilovgrad (CG) 28 8 -62 3345 -1893 5 -227 793 1951B. Grahovo (BiH) 28 387 -12 -6047 0 0 -128 -15 -5815
Knin (Hr) 27 10167 -37 -30289 14 0 -508 -33 -20655Dvor (Hr) 26 553 -16 -9033 -14 8 -322 -61 -8879
Žagubica (Sr) 24 -6 -3 -5393 -7 -7 -102 2577 -2954Gračac (Hr) 17 1698 -6 -7490 -11 0 -133 -111 -6061
Source: statistic institutions
conclusIons
the region’s population has been significantly restructured due to the changes in
the political geography
The most significant modifications can be seen in the demographical changes
which are also the hardest to reverse. The region’s demographical map and so the
human factor influencing regional processes were massively altered by forced
urbanization and certain areas becoming demographically unpopulated after
changes in the locations of the population.
Based on the alterations in the numbers of the population it can be declared that the
armed conflict fundamentally predestined the directions of the changes, though not in
every case. In large parts of Slavonia and Bosnia-Herzegovina the population, as can
be expected in war, decreased by as much as a loss of half or two thirds of ante bellum
population. Certain parts of Vojvodina, the Croatian coastal areas, the Sava regions of
Bosnia (i.e. territories preserved from armed assaults) show an increase, mainly due
to refugee settlement in these zones. The changes in the municipalities of Kosovo are
however atypical: here, despite the war, a significant increase can be seen.
Regularities can also be identified based on settlement types. In general, but
especially in regions hit by war, the population growth is more significant in the cities
and is less so in the countryside, just as in Bosnia-Herzegovina.
52
Péter Reményi
The ethnic changes due to the conflict were of differing degree on the various
administrative levels
In the case of ethnic homogenization we find it important to outline the regular
changes in the extent of homogenization per territorial levels. The maximum degree of
homogenization from the level of former Yugoslavia through meso-levels to settlement
level has increased, from which we can conclude that this is a process that can be
apprehended typically at the settlement level and is primarily the outcome of ethnic
changes within the region. The ethnic diversity of the Post Yugoslav region changed
very little; however, there was hardly any settlement where the ethnic composition did
not change.
The cities of Bosnia-Herzegovina, Slavonia and Kosovo stand out from all the
settlements that suffered from armed assaults and homogenization. In these instances
the changes in the ethnic structures derived from genocide and escaping from and
settling in the given areas. Homogenization is also traceable for settlements in areas
not impacted by war, e.g. Vojvodina and the coastal zones of Croatia. That of Zagreb,
as an area already containing a Serb/Croat majority, is due to further settlement
by refugees. On the other hand, in relation to those settlements in Vojvodina with
Hungarian majorities (in the NE along river Tisza) just as in the case of the cities
inhabited by Croatian and Bosniak Krajinas and with Serb majorities, diversification
was strengthened by incoming minorities and leaving majorities.
references
Alfaro, M. (2000): Returnee Monitoring Study: Minority returnees to the Republika
Srpska – Bosnia and Herzegovina. UNHCR, hely nélkül, 43 p.
Bertić, I. (1987): Veliki geografski atlas Jugoslavije. SNL, Zagreb, 272 p.
Bajmócy P. (2004). A nemzetiségi és vallási szerkezet változása Magyarországon a
XX. században. In: II. Magyar Földrajzi Konferencia. SZTE Természeti Földrajzi
és Geoinformatikai Tanszék, CD-kiadvány, Szeged, 16 p.
Juhász J. (1997): A délszláv háborúk. Napvilág Kiadó, Budapest, 157 p.
Kicošev S.–Kocsis K (1998): A menekültügy társadalmi-demográfiai aspektusai a
Vajdaságban. – Regio. 9. évf. 3. sz. pp. 63–74.
Kostadinova-Daskalovska, K. (é.n.): Data and Indicators of the Municipalities in
Macedonia. H.n. State Statistical Office of Macedonia. Pp. 66–73 and 82–89.
MONSTAT (2006): Statistical Yearbook 2006. Podgorica, 346 p.

53
Some Aspects of Demographic Consequences of the Breakup of Former Yugoslavia
OSCE (2005-2006): Municipality profiles of Kosovo municipalities. www.osce.org/
kosovo downloaded: 19-10-07
Savezni Zavod za Statistiku (1992): Nacionalni sastav Stanovništva po opštinama.
Statistički Bilten broj 1934. Belgrade, 43 p.
Statistical Office of Kosovo (SOK) (2008): Demographic changes of the Kosovo
population 1948–2006. Pristina, 27 p. www.ks-gov.net/esk letöltve: 2008.09.23.
Statistical Office of the Republic of Serbia (2002): Final results of the census
2002. Population by national or ethnic groups, gender and age groups in the
Republic of Serbia, by municipalities. Communication No. 295 • Issue LII,
December 24, 2002. Belgrade 36 p.
demographic data presented on the webpages of statistical offices of:
Bosnia-Herzegovina – http://www.bhas.ba/
Federation of Bosnia-Herzegovina – http://www.fzs.ba/
Republika Srpska – http://www.rzs.rs.ba/
Croatia – http://www.dzs.hr/default_e.htm
