some aspects of the chinese industrialization · some aspects of the chinese industrialization...
TRANSCRIPT

Some Aspects of the Chinese Industrialization∗
Murat Ungor†
August 15, 2011
Abstract
I study the industrialization of China documenting some facts and developing asectoral growth accounting exercise that links changes in sectoral productivity to theinstitutional reforms since 1978. I also examine the liberalization process of the Chi-nese foreign trade focusing on the changes in dynamic comparative advantage usingboth aggregated and disaggregated data.
JEL Classification: C82, F13, F14, O11, O14.Key Words: China, industrialization, sectoral productivities, trade.
∗This is a revised version of the first chapter of my dissertation submitted to the University of SouthernCalifornia. I am very grateful to Caroline M. Betts and Ayse Imrohoroglu for their criticism and encourage-ment. I thank Robert Dekle, Rahul Giri, Yong Kim, John Strauss, and Rubina Verma. The views expressedherein are those of the author and not necessarily those of the Central Bank of the Republic of Turkey.†Research and Monetary Policy Department, Central Bank of the Republic of Turkey, Istiklal Caddesi 10,
Ulus, 06100 Ankara, Turkey. E-mail address: [email protected]
1 Introduction
The dramatic emergence of China’s role in the world economy is one of the central topicsof the current research in international economics. This paper reviews the three aspects ofthis phenomenon since 1978. First, it is characterized by very high growth rates of GDPper capita. Second, there is an association of long-run economic growth with a significantshift in the composition of economic activity. Third, the transformation of the Chineseeconomy has been accompanied by a huge increase in international trade.
Beginning in 1978, China adopted a series of economic reforms leading to rapid eco-nomic growth and structural transformation with significant and persistent shifts in theproportions of the labor force employed, and of income originating in the major sectorsof the economy. China’s economic reforms, initiated in the rural areas, succeeded re-markably in boosting rapid growth rates in the rural economy. Changes in the structureof employment have been set in motion by an increase in the productivity of the agri-cultural sector, especially until 1984. Market reforms were extended to urban areas andstate-owned enterprises in 1984. China began further economic reforms, which focusedon the manufacturing sector in urban areas. Along with the reform of the centralizedplanned allocation mechanism, prices for products and production factors were gradu-ally readjusted or partially liberalized.
For many years, the development of China remained largely indigenous, mainly be-cause of China’s isolation from other countries. However, China has become an increas-ingly important part of the global trading system, especially over the last two decades.In 2009, China, accounting for nearly 10 percent of the world merchandise exports, over-took Germany as the lead exporter of merchandise. China’s share in world merchandiseimports increased to 7.9 percent in 2009, resulting in China becoming the second largestimporter while the United States remained the world’s leading importer.1
The paper is organized as follows. Section 2 provides historical patterns of aggregategrowth and productivity. Section 3 examines the structural transformation of the Chineseeconomy between 1978 and 2005. Section 4 lays out a sectoral growth accounting exerciseand links changes in sectoral productivity to the institutional reforms. Section 5 exam-ines the liberalization process of the Chinese foreign trade focusing on the changes indynamic comparative advantage using both aggregated and disaggregated data. Section6 concludes.
1http://www.wto.org/english/res e/statis e/its2010 e/its2010 e.pdf
1

2 Aggregate Growth and Productivity
Figure 1 plots annual average growth rates of GDP per capita (in 1990 Geary-Khamisdollars) over the period 1978-2008 against annual average growth rates over the period1950-1977 for one hundred and one countries (see Appendix). China grows at an an-nual average rate of 2.6 percent during 1950-1977 and then at a rate of 7.1 percent during1978-2008. China, the world’s most populous country, is also the fastest growing countrysince 1978 and sustains an annual average rate of growth of GDP per capita more than 5percentage points higher than that of the United States.2
-4
-2
0
2
4
6
8
-8 -6 -4 -2 0 2 4 6 8
19
78
-20
08
China
-8
-6
-4
1950-1977
Figure 1: Growth Rates of GDP per Capita (%)
Figure 2 displays the GDP per capita relative to the United States in a set of coun-tries between 1950 and 2008.3 In 1950 Chinese GDP per capita is 3.6 percent of that inthe United States. By 2008, it increases to 19.1 percent. Relative income in Japan startsabout 20 percent of the U.S. level, increases to above 84 percent in 1991, and declines to
2Perkins and Rawski (2008) anticipate that China’s economy can achieve real GDP growth at averagerates of 6-8 percent per annum between 2005 and 2025.
3For all countries, data for the years 1950-2008 are from the Conference Board, Total Economy Database,January 2009. Western Europe consists of Austria, Belgium, Denmark, Finland, France, Germany, Italy,Netherlands, Norway, Sweden, Switzerland, and the United Kingdom. Latin America consists of Ar-gentina, Bolivia, Brazil, Chile, Colombia, Mexico, Peru, Uruguay, and Venezuela. Asian countries are HongKong, Singapore, South Korea, and Taiwan.
2

74 percent in 2008. During the 1990s Japan’s rapid growth is replaced by protracted eco-nomic stagnation.4 Asian Dragons start at a GDP per capita level that is about 10 percentof that in the United States in 1950 and they reach to about 70 percent of the U.S. levelby 2008. Latin American countries, on the other hand, show relative stagnation, if notdeterioration.
1950 1970 1990 20100
10
20
30
40
50
60
70
80
%90
Latin America
East Asia
China
JapanWestern Europe
Figure 2: GDP per Capita as a Percentage of the U.S.
When the People’s Republic of China was founded in 1949, more than 80 percent of thepopulation was in agriculture. China, under the socialist government, chose the heavy-industry oriented development strategy as the so-called “engine” of economic develop-ment with distorted factor and product prices to “leap forward” the nation. China startedindustrialization within a socialist camp with the leaning-on-one-side policy, which placeda heavy reliance upon trade with and the assistance from the U.S.S.R and industrializa-tion was virtually synonymous with economic development. Great emphasis was put oninvestment and the rapid development of heavy industry.5
4Japan was the first country in Asia which responded successfully to the Western economic growthand began to catch-up after the Meiji restoration, in 1868, while China in the same period failed to doso. However, since 1978, China’s macroeconomic performance has rivaled that of Japan. Maddison (2005,p.8) notes that the experience of China, particularly since the 1978 economic reforms, shows that China’seconomic growth has involved a very significant element of catch-up.
5According to the Chinese Statistical Yearbooks heavy industry refers to the industry which producescapital goods, and provides various sectors of the national economy with necessary material and techni-cal basis. It consists of the following three branches according to the purpose of production or the use ofproducts: (1) Mining, quarrying and logging industry refers to the industry that extracts natural resources,including extract ion of petroleum, coal, metal and non-metal ores and logging. (2) Raw materials indus-
3

Naughton (2007, p. 55) labels this development strategy ”big push industrialization”.Heavy industry makes intensive use of capital, yet capital was very scarce in the begin-ning of the leap-forward development strategy. To generate and allocate resources forheavy industrial development, China relied on mechanisms such as investment licensesand import quotas rather than a price mechanism working through markets.
Lin (1994, pp. 28-29) summarizes the key characteristics of this heavy-industry de-velopment strategy as consisting of low interest rates, an overvalued exchange rate, lowwage rates, and low prices for raw materials and living necessities. Under the centralplan raw material prices were kept low, and final good prices high, generating substan-tial surpluses in manufacturing and processing industries, which funded the governmentbudget (Young, 2000).
The resulting misallocation of resources through government planning, from 1949 to1978, did not bring sustainable economic development to China, i.e., low aggregate totalfactor productivity (TFP) growth. Chow (1993) finds that growth is almost entirely capitalaccumulation driven during 1952-1980 and TFP growth is absent. Borensztein and Ostry(1996) estimate the TFP growth is negative at about -0.7 percent average rate during 1953-1978.
Rosenberg (1994, pp. 105-106) argues that the Chinese government before 1978 didnot give importance to the role of technological innovation in the attainment of an effi-cient industrial society and the preoccupation with ”big-ness” in industry was hostile totechnological innovation. Brandt and Sutton (2008) discuss that noneconomic policy ob-jectives, weak institutions, and poor incentives are the underlying causes of productivitystagnation.
A simple aggregate growth accounting exercise suggests that the aggregate TFP is thesingle most important factor behind the aggregate output growth in the Chinese economysince 1978. This exercise decomposes the factors that contribute to GDP per working-agepopulation as follows:
Yt/Nt = TFP1/(1−α)t (Kt/Yt)
α/(1−α)(Et/Nt), (1)
where Yt is the aggregate GDP,Nt is the economically active population, Kt andEt are thequantities of capital and labor employed at time t and the capital share is given by α. TFP
try refers to the industry that provides various sectors of the national economy with raw materials, fuelsand power. It includes smelting and processing of metals, coking and coke chemistry, chemical materialsand building materials such as cement, plywood, and power, petroleum refining and coal dressing. (3)Manufacturing industry refers to the industry that processes raw materials. It includes machine buildingindustry which equips sectors of the national economy, industries of metal structure and cement products,industries producing means of agricultural production, such as chemical fertilizers and pesticides.
4

represents total factor productivity and the power 1/(1− α) represents the magnificationeffect of TFP. An increase in TFP generates a proportionate increase in the capital stock, sothe capital intensity factor, (Kt/Yt)
α/(1−α), represents only the part of capital accumulationnot induced by TFP growth.
According to the results in Table 1, over the period 1978-2005, GDP per economicallyactive person grows at 7.45 percent per year, which is completely accounted for by a 9.67percent growth rate in TFP factor, which implies that the average annual growth in TFPbetween 1978 and 2005 is 4.85 percent.6 These results suggest that most of the fluctuationsin output per working-age person are due to changes in the TFP factor, rather than tochanges in the capital-output ratio or in the employment rate.7
Table 1: Growth Accounting
Average annual rate of growth in percents
Sources of Growth 1978-1984 1984-2005 1978-2005
GDP per economically active person, Yt/Nt 6.05 7.85 7.45
TFP Factor, TFP 1/(1−α)t 8.92 9.89 9.67
Capital Intensity Factor, (Kt/Yt)α/(1−α) -2.65 -1.06 -1.42
Employment Rate, Et/Nt 0.01 -0.80 -0.62
Several previous studies find that TFP growth ranges around or above 3 percent peryear since the beginning of the economic reforms and my findings are consistent withthese studies.8 Blanchard and Giavazzi (2006, Table 4) and Cao, Ho, Jorgenson, Ren, Sun,and Yue (2009, Table 1) report the estimates of TFP growth computed by various studies.These studies cover different periods and employ different methods, and a complete ac-count of their differences and a reconciliation of their results with my findings are beyondthe scope of this paper.
6Aggregate labor, capital, and output are obtained as the summation of the sectoral figures that I discussin the related sections. I set the capital share as α = 0.487 following Bai, Hsieh, and Qian (2006). Theydiscuss the changing nature of the importance of capital and labor in the aggregate economy, and arguethat the average labor share between 1978 and 2005 is 51.3 percent. I measure population as those who areaged 16 and over who are capable to work, rather than the total population based on the definitions of CSY.
7These results do not reflect any adjustments for the contribution of human capital and other such factors(Heston and Sicular, 2008). Lee and Malin (2010) find that about 13 percent of aggregate growth in outputper worker from 1978 to 2004 is accounted for by an increased education, with 11 percent coming fromthrough the labor-reallocation channel and 2 percent attributable to increased within-sector human capital.
8For example, Perkins and Rawski (2008) obtain TFP growth of 3.8 percent per year for 1978 - 2005 netof the contribution of rising education levels.
5

3 Structural Transformation
The Chinese economy is divided into three broad sectors: agriculture, industry, and ser-vices. They are also known as primary, secondary, and tertiary, respectively. Primaryrefers to agriculture, forestry, animal husbandry and fishery. Secondary refers to miningand quarrying, manufacturing, production and supply of electricity, water and gas, andconstruction. Tertiary refers to all other economic activities not included in primary orsecondary industry.
Reallocation of Labor from Agriculture. The most striking feature of the structuraltransformation of the Chinese economy is seen on shifts in the pattern of employment. Iuse two sources for employment data: the Chinese Statistical Yearbook of the NationalBureau of Statistics of China (CSY) and Holz (2006). Holz (2006, p. 57) and Brandt, Hsieh,and Zhu (2008) discuss the problems regarding the total and sectoral employment seriesreported in CSY. Brandt, Hsieh, and Zhu follow Holz’s method to get the revised sectoralemployment data. Holz (2006, Appendix 13) reports the revised employment values (end-year), where he revises the period 1978-1989.9
Figure 3 displays the evolution of sectoral employment shares based on revised em-ployment data in China between 1978 and 2005. Agricultural employment share fallsrapidly in the early stages of economic reforms, at low levels of income, giving rise torapid increases in the share of non-agricultural sector in total employment. Even thoughthe importance of agriculture in China’s economy falls, it is still a large sector, accountingfor more than 40 percent of employment in 2005.10
The employment share of the service sector climbs from 12.2 percent in 1978 to 31.3percent in 2005. The employment share of the industrial sector does not rise as fast as thatof the service sector during the period 1978-2005. Banister (2005) argues that manufac-turing employment in China increases during the 1980s and early 1990s, peaks in about1995-1996, declines during the late 1990s until 2000-1, and increases again 2002. Brandt,Rawski, and Sutton (2008) argue that the stagnation of employment in the secondarysector is due to the result of the massive state-owned enterprise (SOE) layoffs since the
9Prior to 1990, the published economy-wide number of laborers constituted the sum of laborers acrossindustrial sectors. Since 1990, the economy-wide number of laborers exceeds the sum across industrialsectors significantly in each year, but continues to, as in all reform years, equal the sum across economicsectors. Since the economy-wide number following the new time series for the years after 1990 is the onecompiled according to international definitions of employment, the economy-wide number of laborers inthe years prior to 1990 was adjusted following the population censuses of 1982 and 1990 (later-year officialvalues rely on population census data).
10De-agriculturalization fosters the urbanization and off-farm migration facilitates the development ofthe nonagricultural sectors in the Chinese economy. The share of rural population in the total is falling, butremains high at 57.0 percent in 2005.
6

mid-1990s.
1978 1984 1990 1996 2002 200812
22
32
42
52
62
%72
Agriculture
Industry
Services
Figure 3: Employment Shares
The Measurement of Sectoral Output. The primary sector’s share of GDP (at currentprices) declines from 27.9 percent in 1978 to 12.6 percent in 2005. On the other hand, GDPshare of the tertiary sector increases from 24.2 percent in 1978 to 39.9 percent in 2005. Thesecondary sector dominates the production structure with the average share of this sectorin total GDP is 45.3 percent over the sample period.
For output statistics in China, the deflators used to measure sectoral real output are themajor points of the discussion.11 Holz (2006) offers the following approach: The outputseries rely on the post-economic census benchmark revision data as far as the revisionsreach back. Holz uses real growth rates calculated from the first published implicit de-flator and nominal values whenever feasible. First, nominal values are post-economic
11Ruoen (1997, p.122) and Young (2003) compare the sectoral implicit GDP deflators with the indepen-dent survey based price indices and they suggest alternative price indices instead of the implicit deflators.They choose the index for ”overall farm and sideline products purchasing price” as an alternative for aprimary industry index. Ruoen chooses ”industrial products producer index” to serve as the deflator forthe secondary industry. Young compares Ruoen’s choice with two other possible alternatives: the indus-trial products rural retail price index and the retail price index. Young argues that the Ruoen’s choice is asuperior deflator. For tertiary industry, Ruoen uses the index for services from the overall residents’ con-sumer price indices. Young has a similar approach and combines urban service price index and the overallservice price index. Chow (2004) argues that Young’s method leads to serious errors, and that his findingscontradict the alternative estimates of the rates of growth for the periods 1978-1998 and 1988-1989 providedby Young. Dekle and Vandenbroucke (2009) follow Young’s methodology to choose the sectoral deflators.On the other hand, Bosworth and Collins (2007) prefer to use the official output data for the primary andtertiary sectors and the alternative (the ex-factory industrial price index) only for the secondary industry.
7

census values across all sectors after 1993, all other nominal values are not revised, andthe earlier published nominal values are used in those instances. Second, the output val-ues are in constant year 2000 prices, which imply applying real growth rates to year 2000(post-economic census) nominal value added in order to obtain time series of constantprice output. First published implicit deflators are available for the primary, secondary,and tertiary sector after 1987.
Figure 4 displays the evolution of value added shares at constant 2000 prices (yuan)between 1978 and 2005. In 1978, agriculture captures 40.0 percent of the Chinese valueadded, while in 2005 it has the lowest contribution to Chinese total value added, with11.5 percent. The value added share of the secondary (tertiary) sector increases from 31.8(28.1) percent in 1978 to 46.0 (42.5) percent in 2005. China’s real output in the secondary(tertiary) sector grows at an average annual rate of 11.6 (11.8) percent since 1978.
1978 1984 1990 1996 2002 200811
23
35
%47
Agriculture
Industry
Services
Figure 4: Real GDP Shares
Capital by Sector. The Chinese official statistics provide no standard estimation ofthe capital stock at any industry level or by any category. The sectoral gross fixed capitalformation (GFCF) data are available only at the provincial level and only for 1978-95,where the total sectoral provincial GFCF accounts for an average of 78.86 percent of theannual value of national GFCF.
I follow Holz (2006) to construct the sectoral GFCF data for the period 1978-95. GFCFis divided into the three main economic sectors using sectoral share values available forthe individual provinces in GFCF 1978-95. Provincial sectoral shares are shares in the
8

provincial sum-across sector-GFCF value. Holz (2006) uses GDP shares of the three sec-tors to allocate the nation-wide GFCF into these sectors. However, these shares seem tooverstate investment in agriculture, since agriculture’s share in production is very highcompared to the capital formation rate. To avoid such a bias, I use the shares of the year1995 that I compute from Hsueh and Li (1999) for the remaining years, 1996-2005.12,13
The ideal index to deflate nominal investment figures is the price index of investmentin fixed assets. The CSY, however, began to provide this index only after 1993. Jefferson,Rawski and Zheng (1996) estimate China’s price index of investment in fixed assets be-tween 1979 and 1992. Zhang (2006, p. 290) argues that the estimates of Jefferson, Rawskiand Zheng are consistent with the official figures since both sources estimate their indicesby averaging the deflators of construction/installation and machinery/equipment pur-chases; and constructs China’s price index of investment in fixed assets between 1978 and2000. Using the CSY, I extend this index to the year 2005. Zhang (2006) does not reportthe value of the index for the year 1978. I take the value in 1979 as the correspondingobservation for the year 1978.
Sectoral capital stock series are calculated using the perpetual inventory approachwith 10 percent depreciation rate.14 The initial capital stock series in each sector is calcu-lated by the formula Ij0/(gj + δ), where Ij0 is the first year of the sectoral real investmentseries, gj is the average growth of the sectoral investment in the first five years of thesectoral real GFCF series, and δ is depreciation rate. This approach ensures that the 1978values of the capital stocks are independent of the 1978-2005 data used in our analysis.Moreover, given the relatively small capital stocks in 1978 and the high levels of invest-ment, the estimates for later years are not sensitive to the 1978 benchmark values of thecapital stocks. All real series are valued at 2000 prices.
Figure 5 plots the (real) capital-output ratios for the whole economy, and by sector. Theaverage capital-output ratio for the entire economy is 1.96 for the sample period.15 The
12Hsueh and Li (1999, p.137) define their methodology as follows: “According to the type of industry,gross fixed capital formation can be divided into the investment by the primary, secondary and tertiaryindustrial sectors. The principle behind this division according to industrial sectors is the nature of theproduction activities undertaken after the construction units have completed the projects or have handedthem to be put into production, or the particular nature of production that other social economic activitiestake in the process of production.”
13An alternative methodology described in Dekle and Vandenbroucke (2009), following Young (2003),is to construct the sectoral GFCF data as follows: they pursue a similar approach for the period of 1978-95, except that they use the sum of provincial total GFCF value for the nation-wide GFCF. For the yearsafter 1995, they obtain the distributional GFCF data from the individual Provincial Statistical Yearbooks,and aggregate across the provinces. They use the sectoral distribution reported in Hsueh and Li (1999) toallocate overall national GFCF between the three sectors.
14Bai, Hsieh, and Qian (2006) argue that 10 percent is a plausible number for the period 1978-2005.15Bai, Hsieh, and Qian (2006) estimate that the average nominal capital-output ratio between 1978 and
9

capital-output ratios in agriculture and services demonstrate U-shape patterns since 1978.The capital-output ratio in agriculture (services) increases after 1995 (1993). In contrast,there is a reduction in the capital-output ratio in industry, starting with value of 4.91 in1978 and falling to about 1.63 in 2005, reflecting the higher efficiency of capital in industry.
1978 1984 1990 1996 2002 20080
1
2
3
4
5
Agriculture
Industry
Services
Aggregate
Figure 5: Capital-Output Ratios
The capital intensity and the investment rate increase after 1997 consistent with thefact that the capital share of aggregate income increases steadily. The investment rateincreases from 31.80 percent in 1997 to 41.49 percent in 2005, whereas the period averageis 31.68 percent during 1978-2005.16 Capital formation increases the capital stock which, inturn, expands production capacity. Bai, Hsieh, and Qian (2006) interpret this observationas a gradual restructuring of China’s industrial sector, in favor of more capital-intensiveindustries, requiring higher aggregate investment rates in the steady state.
4 Sectoral Growth Accounting and Economic Reforms
Framework. I assume that capital and labor are the two primary production factors foreach sector. Moreover, land is the third input in the production of the agricultural goods,
2005 is 1.46.16I use the expenditure components of GDP as investment rate and follow Young (2003) by expressing it
as the ratio of gross fixed capital formation to nominal GDP (see CSY, Table 3.12).
10

it is a nonreproducible factor, constant and also it does not depreciate.17 Since it is con-stant, its contribution is submerged in the TFP of the agricultural sector. I specify thetechnologies at the sector level and employ the Cobb-Douglas functional form. The pro-duction function for the agricultural sector is:
YAt = TFPAtKυAtE
θAt. (2)
KAt and EAt are the quantities of capital and labor employed in agriculture at time t.YAt is the sectoral output produced in this sector and TFPAt is the agricultural TFP attime t. The share parameters for capital and labor in are given by υ and θ, respectively(υ + θ < 1). The agricultural production function is consistent with a literature on cross-country agricultural production functions (Vollrath 2009).
Non-agricultural goods are produced using two factors of production, capital and la-bor, combined in constant returns to scale technology in secondary and tertiary sectors:
Yjt = TFPjtKαj
jt E1−αj
jt , j ∈ {industry, services}. (3)
Kjt and Ejt are the quantities of capital and labor employed in sector j at time t. Yjt issectoral output, TFPjt is sectoral TFP at time t, and αj denotes the capital share of sectorj.
Sectoral TFPs and Growth Accounting. Data for labor, capital, and output are dis-cussed in the previous sections.18 I need to determine the sectoral factor shares to conductsectoral growth accounting exercises. Holz (2006) reports the time series for the sectorallabor shares in the primary, secondary, and tertiary sectors in the Chinese economy dur-ing 1978-2002; and calculates the labor share by sector as the share of labor remunerationin the sum of labor remuneration, depreciation, and operating surplus.19 Holz calculates
17Agricultural land has been almost a fixed quantity since 1952 in China. The average annual growthrates of cultivated land area and total sown land area were 0.35 and 0.18 percent during 1952-2005, respec-tively. (China Data Online, Production condition for agriculture of China, http://chinadataonline.org/)
18Note that labor input is measured in stock terms as the number of persons employed in a sector at theend of each year. This measure, changes in labor input measured by persons employed, does not reflectchanges in hours worked per full-time and part-time worker, or changes in the shares by sector of totalemployment. However, I do not have time-series data on hours worked as the labor input measure. Abetter measure would be total number of hours worked, broken down by type of labor input. Data on thenumber of persons employed or number of jobs, by sector can generate biased measures of productivity ifhours per person change (OECD, 2001).
19Net taxes on production are split proportionally between labor and capital, where capital’s share ismeasured by the sum of depreciation and the operating surplus. Since there is no national data on thesesources of renumeration, all shares are based on the sum of provincial values. Holz also notes that allvalues are pre-economic census values; revised values have so far not been released, and are unlikely tobe forthcoming. Since the sum provincial pre-economic census value added comes very close to the post-economic census national value added, these provincial pre-economic census values may be quite accurate
11

that the average labor income shares in the primary, secondary, and tertiary sectors are0.884, 0.475, and 0.502, respectively between 1978 and 2002.20 I use these figures as thesectoral labor shares for the entire period. I assume identical capital and land shares inagriculture following Dekle and Vandenbroucke (2009). Turning to sectoral capital inputin the secondary and tertiary sectors I take the share of capital by sector to be simply oneminus the share of labor.
Figure 6 shows the actual path of sectoral TFPs in China between 1978 and 2005.21 TFPgrowth in Chinese agriculture averages 4.55 percent per annum between 1978 and 2005.The average growth rate of TFP in the secondary sector is the highest of the three sectors.TFP growth in the secondary sector averages 6.11 percent per annum and TFP growth inthe tertiary sector averages 2.91 percent per annum between 1978 and 2005.
1978 1984 1990 1996 2002 20080
1
2
3
4
5
1978
=1
Agriculture
Industry
Services
Figure 6: TFP by Sector
All sectors experience declines in TFP growth rates during the late 80s. This coincideswith the violent repression of the student movement at Tiananmen Square in June of 1989,which puts a temporary end to the steady liberalization of the Chinese economy and leadsto temporary re-centralization of many economic activities (Naughton 1995, p. 4).
(Holz, 2006, Appendices 32 and 33).20Young (2003) argues that the labor share in the non-agricultural sector increases steadily between 1978
and 1995 and is slightly below 0.5.21I observe that agricultural TFP growth is not affected significantly in the presence of land. That’s why I
exclude the land, for the rest of the analysis, from the production function so that the agricultural produc-tion function looks like the other two sectors’ production functions.
12

In order to measure the contribution made by factors of production relative to thatmade by TFP, I conduct a growth accounting exercise at the sectoral level.
Yjt/Ejt = TFP1/(1−αj)jt (Kjt/Yjt)
αj/(1−αj), j ∈ {primary, secondary, tertiary}. (4)
The first term on the right of (4) is the sectoral TFP factor in sector j. The second termmeasures the sectoral capital intensity factor. The power 1/(1− αj) represents the magni-fication effect of sectoral TFP that an increase in TFP generates a proportionate increase inthe sectoral capital stock, so the capital intensity factor represents only the part of sectoralcapital accumulation.
Table 2 reports the average annual growth rate of sectoral GDP per worker and itsfactors shown for post-reform China.
Table 2: Sectoral Growth Accounting
Average annual rate of growth in percents
Economic Activity / Sources of Growth 1978-1984 1984-2005 1978-2005
Agriculture
Output per Worker 5.88 4.73 4.98
Capital Intensity Factor -0.94 0.04 -0.18
TFP Factor 6.88 4.68 5.17
Industry
Output per Worker 3.37 9.76 8.31
Capital Intensity Factor -3.87 -4.55 -4.40
TFP Factor 7.53 14.99 13.29
Services
Output per Worker 3.75 6.66 6.00
Capital Intensity Factor 0.54 0.00 0.12
TFP Factor 3.19 6.65 5.87
Real GDP per worker of the primary sector grows by 5.88 percent average annualgrowth rate during 1978-1984. Rapid growth rate in the wake of the early post-1978 re-forms then falls to an annual average rate of 4.73 percent for the years between 1984 and2005. For the primary sector, there is no increase in capital intensity: between 1978 and
13

1984, the capital-output ratio declines. A high per-worker GDP growth rate is brought bya very high TFP growth. This observation is consistent with earlier findings. For example,Stavis (1991) views that technological change is the engine of agricultural growth for theperiod 1978-1984.
What caused the high TFP growth rate in agriculture in the early reform period? Chinaadopted a strategy of gradual economic transformation that maintained the existing sys-tem and created new economic activities on top of it. Between 1978 and 1984 significantdevelopments took place agriculture. In the early reform period (1978-1984), the house-hold responsibility system (HRS), which replaced the production team system as the unitof production and income distribution, significantly increased agricultural productivitytransferring the collective agricultural production system to individual farms by contract-ing land-use rights to individual rural households, price and marketing reforms improv-ing the peasants’ work incentives (see, for example, Lin 1988, 1994; Lin, Cai, and Li 2003,Chapter 5; and Naughton 1995, Chapter 4 for details of the HRS).
Lin (1988) argues that the failure of the collectivization period is not due to its socialistnature but it is because of the difficulties inherent in supervising agricultural work. Farm-ers are residual claimants in the HRS. Since the end of the year 1978 the HRS has graduallyreplaced the commune system. By the end of 1983 less than 3 percent of households hadnot adopted the responsibility system. This suggests that the institutional transformationfrom a collective to the HRS of farm management was essentially completed by the mid1980s. The decline in the growth rate, according to this view, has been associated with thecompletion of one-off effects of the HRS since the institutional reforms were one time onlyevents. Huang and Rozelle (1996) argue that earlier studies may have over-estimated theimpact of decollectivization.
There are important reforms in the non-agricultural sectors: gradual reduction of cen-tralized controls on prices, inputs and outputs, and the rising share of production outsideof the state enterprise sector; and the freedom of townships and villages to establish in-dustrial enterprises outside of the central plan (Jian, Sachs, and Warner, 1996).22
China’s real output per worker in the secondary sector grows at an average annualrate of 8.31 percent since 1978. Brandt, Rawski, and Sutton (2008) divide reforms in the
22One of the major institutional features of the Chinese economy is the coexistence of state-owned en-terprises (hereafter, SOEs) and non-state sector. The non-state sector, including private enterprises, jointventures, urban collectives, and township and village enterprises (TVEs), has crowded out SOEs in manymarkets. TVEs are economic units which are either collectively owned by local residents in the rural areasof China or mainly owned and controlled by the peasants (Fu and Balasubramanyam, 2003). Brandt andZhu (2001) make clarification for the definition of the non-state sector: although it does include private en-terprises and joint ventures, until recently the non-state sector was primarily made up of urban collectivesand TVEs.
14

secondary sector into two periods: reforms concentrated on incentives and market mech-anism to prevent resource misallocation problem. Beginning in the mid-1990s, the priva-tization and subsequent stock market listing of SOEs have been integral parts of China’sstate enterprise reforms. In the beginning of the reform period, SOEs dominated the in-dustrial structure.
In the secondary sector, policies were introduced to increase the autonomy of enter-prise managers, to reduce the dominance of planned quotas, and to allow enterprises toproduce and sell goods in the market. More market-oriented polices have emerged withthe growing importance of the urban private sector, as SOEs are being downsized andthe real sector of the economy has been liberalized substantially and goods and factormarkets have become increasingly competitive.
Huang and Duncan (1997) discuss that studies of TFP in the state sector have differentresults: some studies find no TFP growth during the post-1978 period; some other studiesargue that state sector has positive TFP growth during the reform period. Liu and Otsuka(2004) show statistically that in order for SOEs to compete with TVEs, a major ownershipreform of SOEs is essential.
Real GDP per worker of the tertiary sector grew by 6.00 percent average annual growthrate during 1978-2005. The production of services is likely to become increasingly impor-tant to China’s overall economic development over the coming decades. Being a WorldTrade Organization (WTO) member since 2001, increased market access has opened neweconomic opportunities for China, with an expected favorable impact on trade and invest-ment for years to come. Services created 27.15 million new jobs, which was 85 percent ofall employment creation, during the 9th Five-Year Plan, 1995-2000 (OECD 2003).
5 Foreign Trade
From 1949 to 1978, China was a planned economy and trade flows were entirely con-trolled by the state. Since 1978, China has been moving toward a market economy and,thus, a more liberal trade system. In 1980-81 four special economic zones (Shantou, Shen-zhen, Xiamen, and Zhuhai) were established. These zones were new areas created in lo-calities far away from the power center and concentrated on the southern coast of China.Some argue that China’s rapidly growing coastal provinces have benefited from the prox-imity to the Chinese-speaking economies of Hong Kong and Taiwan (see, for example,Goodfriend and McDermott 1998 and Naughton 1996).
China has attempted different reforms in three broad areas to liberalize foreign trade:the gradual elimination of central plans and the introduction of market competition in
15
the tradable sectors; the reduction of barriers to trade including both tariff and non-tariffrestrictions; and the reform of the foreign exchange regime. The rate of decreases in tradebarriers has increased especially in the 1990s.23
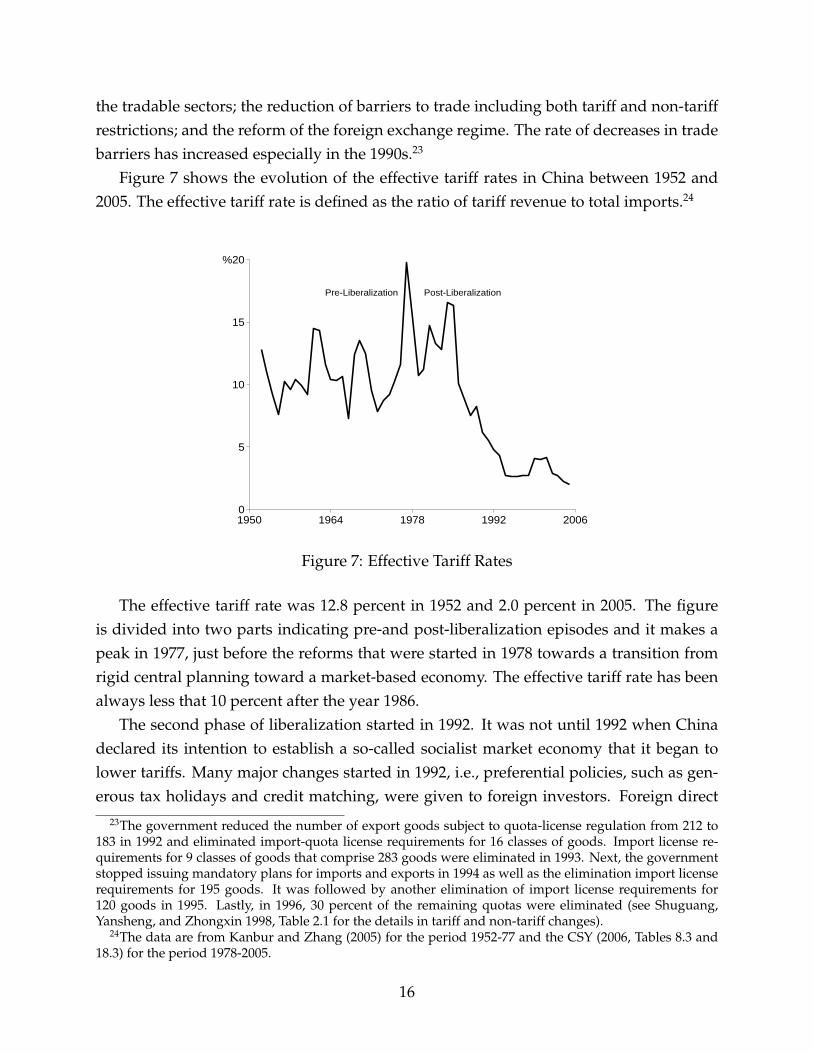
Figure 7 shows the evolution of the effective tariff rates in China between 1952 and2005. The effective tariff rate is defined as the ratio of tariff revenue to total imports.24
1950 1964 1978 1992 20060
5
10
15
%20
Pre-Liberalization Post-Liberalization
Figure 7: Effective Tariff Rates
The effective tariff rate was 12.8 percent in 1952 and 2.0 percent in 2005. The figureis divided into two parts indicating pre-and post-liberalization episodes and it makes apeak in 1977, just before the reforms that were started in 1978 towards a transition fromrigid central planning toward a market-based economy. The effective tariff rate has beenalways less that 10 percent after the year 1986.
The second phase of liberalization started in 1992. It was not until 1992 when Chinadeclared its intention to establish a so-called socialist market economy that it began tolower tariffs. Many major changes started in 1992, i.e., preferential policies, such as gen-erous tax holidays and credit matching, were given to foreign investors. Foreign direct
23The government reduced the number of export goods subject to quota-license regulation from 212 to183 in 1992 and eliminated import-quota license requirements for 16 classes of goods. Import license re-quirements for 9 classes of goods that comprise 283 goods were eliminated in 1993. Next, the governmentstopped issuing mandatory plans for imports and exports in 1994 as well as the elimination import licenserequirements for 195 goods. It was followed by another elimination of import license requirements for120 goods in 1995. Lastly, in 1996, 30 percent of the remaining quotas were eliminated (see Shuguang,Yansheng, and Zhongxin 1998, Table 2.1 for the details in tariff and non-tariff changes).
24The data are from Kanbur and Zhang (2005) for the period 1952-77 and the CSY (2006, Tables 8.3 and18.3) for the period 1978-2005.
16

investments surged to US$ 11.3 billion in 1992 from US$ 4.6 billion the year before (Bao,Chang, Sachs, and Woo 2002). China officially started its WTO membership applicationin 1986 and she formally became a member of the WTO on 11 December 2001. WTO ac-cession gives China greater access to the world’s markets. As a result of the negotiations,China has agreed to undertake a series of important commitments to open and liberalizeits regime in order to better integrate in the world economy and offer a more predictableenvironment for trade and foreign investment in accordance with WTO rules.
Dynamic Changes in Comparative Advantage. The composition of internationaltrade has changed considerably in the post-1978 period. The declining role of agriculturein total employment and output is accompanied by a declining share of primary goods’trade in China’s total commodity trade.25 In 1980, primary goods’ share in total commod-ity trade was 42.15 percent. By 2005, it declined to 13.84 percent (CSY 2006, Tables 18.5and 18.6). On the other hand, the share of manufactures in total exports increased. Table 3breaks down the Chinese nominal trade balance (in current billion U.S. dollars) in 1984and in 2005 into industries using one-digit SITC codes.
Table 3 shows that China imports raw materials and chemicals (SITC industries 2, 3and 5) and exports manufactured goods (SITC industries 6, 7 and 8). Similarly, decom-posing China’s real export growth since 1992, Amiti and Freund (forthcoming) find thatthere has been a significant decline in the share of agriculture and soft manufactures, suchas textiles and apparel, with growing shares in hard manufactures, such as consumer elec-tronics, appliances, and computers.
Dean and Lovely (forthcoming) study the trends in the composition of China’s tradeand find significant changes in the sectoral composition of Chinese trade between 1995and 2005. For example, in 1995, textiles and apparel accounted for the largest shares ofChinese exports to the world. These shares fell by about a third by 2004, while the exportshare of office and computing machinery grew by a factor of five, and that of communica-tions equipment more than doubled. The largest shares of Chinese imports in 1995 wereattributable to textiles and machinery. These shares fell by about 70 percent and 40 per-cent, respectively, by 2004, while import shares in office and computing machinery andin communications equipment more than doubled. Dean and Lovely aggregate the Chi-nese trade data to HS (6-digit) and then convert to ISIC Rev. 3 using the official Chineseconcordance.
SITC industries at the one-digit level are rather broad, and some important detailsabout changes in the structure of Chinese trade are likely to be obscured. In a compan-
25Primary goods include food and live animals used chiefly for food; beverages and tobacco; non-edibleraw materials; mineral fuels, lubricants and related materials; animal and vegetable oils, fats and wax.
17

Table 3: Chinese Trade Balance in current billion US$
SITC Code Industry 1984 2005
0 Food and Live Animals 0.9 13.1
1 Beverages and Tobacco -0.01 0.4
2 Crude Materials, Except Fuels -0.1 -62.7
3 Mineral Fuels, Lubricants and Related Materials 5.6 -46.7
4 Animal and Vegetable Oils, Fats and Waxes 0.1 -3.1
5 Chemicals and Related Products -2.7 -41.2
6 Manufactured Goods Chiefly by Materials -2.1 49.2
7 Machinery and Transport Equipment -5.7 61.6
8 Miscellaneous Manufactured Article 3.3 132.0
9 Commodities Not Classified Elsewhere -0.6 -0.4Source: United Nations Statistics Division, Commodity Trade Statistics Database
ion to the analysis of Table 3, I conduct an exercise in which I compute the specializationindices of China using one-digit SITC codes. Kwan (2002, pp. 15-17) argues that therevealed comparative advantage of a country can be shown by calculating the specializa-tion indices for its major industries. For a particular industry, the specialization index isdefined as its trade balance divided by the volume of two-way trade, with a higher valueimplying stronger international competitiveness for the industry concerned.
Following Kwan (1994), a country’s comparative advantage structure (as revealed byits trade structure) can be classified into one of four categories based on the relative mag-nitude of the specialization indices of the country’s primary commodities (SITC Rev. 2,sections 0 - 4), machinery (SITC Rev. 2, section 7, a proxy for capital-and-technology-intensive products), and other manufactures (SITC Rev. 2, sections 5, 6, 8, 9, a proxy forlabor-intensive products).
A country typically passes from one category to another in the following sequence:(i) the developing country stage, with primary commodities more competitive than othermanufactures and machinery; (ii) the young NIE (newly industrialized economy) stage,with other manufactures becoming more competitive than primary commodities, whichmaintains its lead over machinery; (iii) the mature NIE stage, with machinery overtakingprimary commodities while other manufactures maintain their overall lead; and (iv) theindustrial country stage, with machinery overtaking other manufactures, which maintain
18

their lead over primary commodities.Figure 8 shows the development of China’s trade structure between 1984 and 2005 in
terms of broad sectors of merchandise trade.
1983 1991 1999 2007-1.0
-0.8
-0.6
-0.4
-0.2
0.0
0.2
0.4
0.6
Other Manufactures
Primary
Machinery
Figure 8: Stages of China’s Trade Structure
Figure 8 exhibits that China became a young NIE in 1991, when the specializationindex of other manufactures surpassed that of primary commodities. Subsequently, itattained the mature NIE stage in 1999, when the specialization index of machinery alsoovertook that of primary commodities. In 1984, the specialization indices for China indi-cated that machinery and transport equipment (SITC 7) were the lowest, while the highestwas for the miscellaneous manufactured articles (SITC 8). If the current trend in the sec-toral specialization indices continues, the specialization index of machinery may overtakethat of other manufactures in the near future.
Trade in New Products. Another dimension of the changing nature of China’s com-parative advantage is the observation of the emergence of previously non-exported prod-ucts. Hummels and Klenow (2005) and Kehoe and Ruhl (2009) decompose the growth ofindividual countries’ trade into that part due to countries exporting new products - whatthey call the ”extensive margin” - and that part due to countries exporting more of thesame products - the ”intensive margin”.
I perform the following new goods in trade exercise based on Kehoe and Ruhl (2009).I take four-digit SITC (Rev. 2) bilateral trade data obtained from United Nations Com-modity Trade Statistics Database for the years between 1985 and 2005. There are 786 cat-
19

egories of goods in these data. First, I rank categories in order of base-year exports, fromcategories with the smallest amount of trade to the categories with the largest amount.Second, I form ten sets of ”10 percentile” export groups by cumulating export productcategories - the first 677.08 categories account for 10 percent of exports, for example; thenext 50.56 categories account for 10 percent of exports; the next 15.72 categories accountfor 10 percent of exports; and so on. Third, I calculate the share of exports in subsequentyears accounted for by each set of categories.
Figure 9 shows the values of the 10 sets of codes in 1985 for Chinese exports to the restof the world.
677.08
50.56
15.72 10.363.95
11.745.02 3.21 2.72 5.64
0.0
0.1
0.2
0.3
0.4
0.5
0.6
0.7
0.8
0.1 0.2 0.3 0.4 0.5 0.6 0.7 0.8 0.9 1
Cumulative Fraction of 1985 Export Value
Fra
cti
on
of
2005 E
xp
ort
Valu
e
number of categories in the set
Figure 9: Composition of Exports: China to the Rest of the World
The numbers above each bar in the figure are the number of SITC codes needed toaccount for 10 percent of the trade flow and the bars are the fractions of trade in 2005.The trade data do have the very large positive spike in share of trade accounted for bythe least traded goods even though the movements in the shares of the trade shares of thehighest nine sets of goods are not uniform.
Figure 9 shows that the largest increases in the share of exports occur for those sets ofcategories that accounted for the smallest amount of trade in 1985. The 677.08 smallestcategories of exports from China to the rest of the world accounted for 10 percent ofexports in 1985, but in 2005 these same 677.08 categories accounted for 68.50 percent of
20

exports.Figure 10 depicts the evolution, over the period 1985-2005, of the export shares of the
set of categories least traded in 1985. The share of the least-traded goods in total exportshas increased gradually and continuously over time. The goods exported from China thatwere the least traded in 1985 account for a disproportionate portion of growth in trade.26
0.0
0.1
0.2
0.3
0.4
0.5
0.6
0.7
0.8
1985 1989 1993 1997 2001 2005
Year
Fra
cti
on
of
To
tal E
xp
ort
Valu
e
least traded goods in 1985
Figure 10: Export Shares of the Set of Categories Least Traded in 1985
The findings suggest that the goods exported from China that were the least tradedin 1985 account for a disproportionate portion of growth in trade, and document theexpansion in export varieties from China due to the acceptance into the World TradeOrganization after the year 2001 (see, also, Kehoe and Ruhl 2009 for similar findings).
Exchange Rate. Figure 11 shows the nominal exchange rate of the RMB in Japaneseyen and in U.S. dollars between 1981 and 2005.27 I observe a stable parity around 8.3 Yuan/ US$ after a major devaluation of the RMB in 1994. On 21 July 2005, the government ofChina revalued the RMB against the dollar-though by only 2.1 percent-and announcedthe implementation of a new managed floating system (Frankel 2006).
26Broda and Weinstein (2006) note that China exported 710 different goods to the United States in 1972as opposed to 10,315 in 2001.
27The name of the Chinese currency is the renminbi (RMB) and its unit is the yuan. I use them inter-changeable.
21

During most of the period between 1994 to the present day, the U.S. has had a substan-tial trade deficit in Sino-American trade. McKinnon and Schnabl (2006) argue that thiscommon presumption of RMB undervaluation is wrong, and its appreciation need notreduce China’s trade surplus but would cause serious deflation in China. Groenewoldand He (2007) estimate the effect on the US - China trade balance of a revaluation of theRMB and present a range of computations but, likely, changes in the value of the RMB arenot predicted to make much inroad into the trade imbalance between the US and China -a 10 percent revaluation is likely to improve the trade balance by less than 10 percent.
1981 1987 1993 1999 20050
2
4
6
8
10
Yuan / US$
Yuan / (100*Japanese Yen)
Figure 11: Nominal Exchange Rate of the RMB
Some argue that China’s exchange rate policy artificially holds down the value of theyuan to the detriment of U.S. manufacturing output and employment in both import-competing and exporting industries (see, for example, Goldstein 2004; Holtz-Eakin 2003;and Hua 2007).28 Schott (2008) argues that manufacturing in industrialized countries ismore exposed to direct competition from China and industrialized countries should com-pete with China by raising the quality of their exports.
28There is some empirical evidence that changes in exchange rate, in terms of appreciation and deprecia-tion of and volatility in exchange rates, have an important influence on domestic employment. Gourinchas(1999) finds that traded sectors’ job creation and destruction are very responsive to real exchange rate move-ments studying firm level data in France between 1984 and 1992. Klein, Schuh, and Triest (2003) find strongevidence that movements in real exchange rates significantly affect gross job flows in U.S. manufacturing.
22

6 Concluding Remarks
In the last decade or so, a considerable amount of interest in Chinese economic devel-opment has been generated outside China. China has been following a pattern of in-dustrialization characterized by very rapid growth of industrial sector and increasingparticipation in the international economy.29
This paper has studied data, combining information from different sources, that in-clude sectoral variables regarding the economic growth and international trade. The mainpolicy message is that a deeper analysis of the productivity-enhancing economic reformsat the sector level is crucial to develop a comprehensive understanding of the Chineseeconomic development.30
Appendix
Countries in Figure 1 are selected such that there is no missing observation in the sample.GDP per capita for a given country is measured in millions of U.S. dollars (converted atGeary-Khamis PPPs). Data are from the Conference Board, Total Economy Database,January 2009. Countries are Albania, Algeria, Angola, Argentina, Australia, Austria,Bahrain, Bangladesh, Barbados, Belgium, Bolivia, Brazil, Bulgaria, Burkina Faso, Cam-bodia, Cameroon, Canada, Chile, China, Colombia, Costa Rica, Cote d’Ivoire, Cyprus,Denmark, Dominican Republic, DR Congo, Ecuador, Egypt, Ethiopia, Finland, France,Ghana, Greece, Guatemala, Hong Kong, Hungary, Iceland, India, Indonesia, Iran, Iraq,Ireland, Israel, Italy, Jamaica, Japan, Jordan, Kenya, Kuwait, Luxembourg, Madagascar,Malawi, Malaysia, Mali, Malta, Mexico, Morocco, Mozambique, Myanmar, Netherlands,New Zealand, Niger, Nigeria, Norway, Oman, Pakistan, Peru, Philippines, Poland, Portu-gal, Qatar, Romania, Saudi Arabia, Senegal, Singapore, South Africa, South Korea, Spain,Sri Lanka, St. Lucia, Sudan, Sweden, Switzerland, Syria, Taiwan, Tanzania, Thailand,Trinidad and Tobago, Tunisia, Turkey, Uganda, United Arab Emirates, United Kingdom,United States, Uruguay, Venezuela, Vietnam, West Germany, Yemen, Zambia, and Zim-babwe.
29Parente and Prescott (2005) state that the recent catching up done by China is primarily a result of itbecoming a free trade club.
30Sectoral heterogeneity matters for economic development. There is quite a large literature on conver-gence at the sectoral level. For example, see, Bernard and Jones 1996; Caselli and Tenreyro 2004; Duarte andRestuccia 2010; Herrendorf and Valentinyi forthcoming; and Sørensen 2001.
23

References
[1] Amiti, Mary, and Caroline Freund. Forthcoming. “The Anatomy of China’s ExportGrowth.” In China’s Growing Role in World Trade, ed. Robert Feenstra and Shang-JinWei, The University of Chicago Press.
[2] Bai, Chong-En, Chang-Tai Hsieh, and Yingyi Qian. 2006. “The Return to Capital inChina.” Brookings Papers on Economic Activity, 2: 61-88.
[3] Banister, Judith. 2005. “Manufacturing Employment and Compensation in China.”The U.S. Department of Labor, Bureau of Labor Statistics Research Report.http://www.bls.gov/fls/chinareport.pdf
[4] Bao, Shuming, Gene H. Chang, Jeffrey D. Sachs, and Wing T. Woo. 2002. “Geo-graphic Factors and China’s Regional Development under Market Reforms, 1978-1998.” China Economic Review, 13(1): 89-111.
[5] Bernard, Andrew B., and Charles I. Jones. 1996. “Productivity Across Industries andCountries: Time Series Theory and Evidence.” The Review of Economics and Statistics,78(1): 135-46.
[6] Blanchard, Olivier, and Francesco Giavazzi. 2006. “Rebalancing Growth in China:A Three-Handed Approach.” China & World Economy, 14(4): 1-20.
[7] Borensztein, Eduardo, and Jonathan D. Ostry. 1996. “Accounting for China’sGrowth Performance.” American Economic Review Papers and Proceedings, 86(2): 224-28.
[8] Bosworth, Barry, and Susan. Collins. 2007. “Accounting for Growth: ComparingChina and India.” National Bureau of Economic Research Working Paper 12943.
[9] Brandt, Loren, and John Sutton. 2008. “China’s Great Economic Transformation.”In China’s Great Economic Transformation, ed. Loren Brandt and Thomas G. Rawski,1-26. Cambridge: Cambridge University Press.
[10] Brandt, Loren, and Xiadong Zhu. 2001. “Soft Budget Constraint and Inflation Cy-cles: A Positive Model of the Macro-Dynamics in China during Transition.” Journalof Development Economics, 64(2): 437-57.
[11] Brandt, Loren, Thomas G. Rawski, and John Sutton. 2008. “China’s Industrial De-velopment.” In China’s Great Economic Transformation, ed. Loren Brandt and ThomasG. Rawski, 569-632. Cambridge: Cambridge University Press.
[12] Brandt, Loren, Chang-Tai Hsieh, and Xiaodong Zhu. 2008. “Growth and StructuralTransformation in China.” In China’s Great Economic Transformation, ed. Loren Brandtand Thomas G. Rawski, 683-728. Cambridge: Cambridge University Press.
[13] Broda, Christian, and David E. Weinstein. 2006. “Globalization and the Gains fromVariety.” Quarterly Journal of Economics, 121(2): 541-85.
24
[14] Cao, Jing, Mun S. Ho, Dale W. Jorgenson, Ruoen Ren, Linlin Sun, and Ximing Yue2009. “Industrial and Aggregate Measures of Productivity Growth in China, 1982-2000.” Review of Income and Wealth, 55(1): 485-513.
[15] Caselli, Francesco, and Silvana Tenreyro. 2004. “Is Poland the Next Spain?” InNBER International Seminar on Macroeconomics 2004, ed. Richard H. Clarida, JeffreyFrankel, Francesco Giavazzi, and Kenneth D. West, 459-524, The MIT Press.
[16] Chow, Gregory C. 1993. “Capital Formation and Economic Growth in China.” Quar-terly Journal of Economics, 108(3): 809-42.
[17] Chow, Gregory C. 2004. “Another Look at the Growth of Output in China.”http://www.princeton.edu/∼gchow/Chinaoutputgrowth.htm.
[18] Dean, Judith M, and Mary E. Lovely. Forthcoming. “Trade Growth, ProductionFragmentation, and China’s Environment.” In China’s Growing Role in World Trade,ed. Robert Feenstra and Shang-Jin Wei, The University of Chicago Press.
[19] Dekle, Robert and Vandenbroucke, Guillaume. 2009. “A Quantitative Analysis ofChina’s Structural Transformation.” http://guillaumevdb.net/China Paper.pdf
[20] Duarte, Margarida, and Diego Restuccia. 2010. “The Role of the Structural Trans-formation in Aggregate Productivity.” Quarterly Journal of Economics, 125(1): 129-73.
[21] Frankel, Jeffrey. 2006. “On the Yuan: The Choice between Adjustment under aFixed Exchange Rate and Adjustment under a Flexible Rate.” CESifo Economic Stud-ies, 52(2): 246-75.
[22] Fu, Xiaolan, and V. N. Balasubramanyam. 2003. “Township and Village Enterprisesin China.” Journal of Development Studies, 39(4): 27-46.
[23] Goldstein, Morris. 2004. “Adjusting China’s Exchange Rate Policies.”http://www.iie.com/publications/wp/wp04-1.pdf
[24] Goodfriend, Marvin, and John McDermott. 1998. “Industrial Development and theConvergence Question.” American Economic Review, 88(5): 1277-89.
[25] Gourinchas, Pierre-Olivier. 1999. “Exchange Rates Do Matter: French Job Allocationand Exchange Rate Turbulence, 1984-1992.” European Economic Review, 43(7): 1279-1316.
[26] Groenewold, Nicolaas, and Lei He. 2007. “The US - China Trade Imbalance: WillRevaluing the RMB Help (Much)?” Economic Letters, 96(1): 127-32.
[27] Groningen Growth and Development Centre. 2009. The Conference Board, Total Econ-omy Database. Groningen: Groningen Growth and Development Centre.
[28] Herrendorf, Berthold, and Akos Valentinyi. Forthcoming. “Which Sectors MakePoor Countries So Unproductive?” Journal of the European Economic Association.
25

[29] Heston, Alan, and Terry Sicular. 2008. “China and Development Economics. ” InChina’s Great Economic Transformation, ed. Loren Brandt and Thomas G. Rawski, 27-67. Cambridge: Cambridge University Press.
[30] Holtz-Eakin, Douglas. 2003. “The Chinese Exchange Rate and U.S. Manufacturing.”Congressional Budget Office Testimony.
[31] Holz, Carsten A. 2006. “Measuring Chinese Productivity Growth, 1952-2005.”Unpublished.
[32] Hsueh, Tien-tung, and Xiaochao Li. 1999. “Chinese National Economic AccountingSystem.” In Chinas National Income, 1952-1995, ed. TientungHsueh and Qiang Li ,65-152. Boulder, Colorado: Westview Press.
[33] Hua, Ping. 2007. “Real Exchange Rate and Manufacturing Employment in China.”China Economic Review, 18(3): 335-53.
[34] Huang, Jikun, and Scott Rozelle. 1996. “Technological Change: Rediscovering theEngine of Productivity Growth in China’s Rural Economy.” Journal of DevelopmentEconomics, 49(2): 337-69.
[35] Huang, Yiping, and Ron Duncan. 1997. “How Successful Were China’s State SectorReforms?” Journal of Comparative Economics, 24(1): 65-78.
[36] Hummels, David, and Peter J. Klenow. 2005. “The Variety and Quality of a Nation’sExports.” American Economic Review, 95(3): 704-23.
[37] Jefferson, Gary H., Thomas G. Rawski, and Yuxin Zheng. 1996.“Chinese IndustrialProductivity: Trends, Measurement Issues, and Recent Developments.” Journal ofComparative Economics, 23(2): 146-80.
[38] Jian, Tianlun, Jeffrey D. Sachs, and Andrew M. Warner. 1996.“Trends in RegionalInequality in China.” China Economic Review , 7(1): 1-21.
[39] Johnston, Bruce F. 1970. “Agriculture and Structural Transformation in DevelopingCountries: A Survey of Research.” Journal of Economic Literature, 8(2): 369-404.
[40] Kanbur, Ravi, and Xiaobo Zhang. 2005. “Fifty Years of Regional Inequality in China:A Journey through Central Planning, Reform, and Openness.” Review of DevelopmentEconomics, 9(1): 87-106.
[41] Kehoe, Timothy J., and Kim J. Ruhl. 2009. “How Important is the New Goods Mar-gin in International Trade.” Federal Reserve Bank of Minneapolis Research Depart-ment Staff Report 324.
[42] Klein, Michael W., Scott Schuh, and Robert K. Triest. 2003. “Job Creation, Job De-struction, and the Real Exchange Rate.” Journal of International Economics, 59(2): 239-65.
26

[43] Kwan, C. H. 1994. Economic Interdependence in the Asia-Pacific Region: Towards a YenBloc. New York: Routledge.
[44] Kwan, C. H. 2002 “The Rise of China as an Economic Power: Implications for Asiaand Japan.” In Japan and China: cooperation, competition, and conflict,ed. Hanns Gun-ther Hilpert and Rene Haak, 12-31. New York: Palgrave.
[45] Lee, Soohyung, and Benjamin A. Malin. 2010. “Education’s Role in China’s Stuc-tural Transformation.” http://www.soohyunglee.com/research
[46] Lin, Justin Yifu. 1988. “The Household Responsibility System in China’s Agricul-tural Reform: A Theoretical and Empirical Study.” Economic Development and CulturalChange, Supplement: Why Does Overcrowded, Resource-Poor East Asia Succeed:Lessons for the LDCs, 36(3): S199-S224.
[47] Lin, Justin Yifu. 1994. “Chinese Agriculture: Institutional Changes and Perfor-mance..” In Agriculture and Trade in China and India: Policies and Performance since1950, ed. T. N Srinivasan, 23-72. California: An International Center for EconomicGrowth Publication.
[48] Lin, Justin Yifu, Fang Cai, and Zhou Li. 2003. The China Miracle: Development Strat-egy and Economic Reform. 2nd ed. Hong Kong: The Chinese University Press.
[49] Liu, Deqiang, and Keijiro Otsuka. 2004. “A Comparison of Management Incentives,Abilities and Efficiency between SOEs and TVEs: The Case of the Iron and SteelIndustry in China.” Economic Development and Cultural Change, 52(4): 759-80.
[50] Maddison, Angus. 2005. Growth and Interaction in the World Economy: The Roots ofModernity. Washington, D.C.: The American Enterprise Institute Press.
[51] McKinnon, Ronald, and Gunther Schnabl. 2006. “China’s Exchange Rate and In-ternational Adjustment in Wages, Prices and Interest Rates: Japan Dj Vu?” CESifoEconomic Studies, 52(2): 276-303.
[52] National Bureau of Statistics of China. 2006. China Statistical Yearbook, Beijing:China Statistics Press.
[53] Naughton, Barry. 1995. Growing out of the Plan: Chinese Economic Reform, 1978-1993.New York, NY: Cambridge University Press.
[54] Naughton, Barry. 1996. “China’s Emergence and Prospects as a Trading Nation.”Brookings Papers on Economic Activity, 2: 273-337.
[55] Naughton, Barry. 2007. The Chinese Economy : Transitions and Growth. Cambridge:MIT Press.
[56] Organization for Economic Cooperation and Development (OECD). 2001. Mea-suring Productivity: Measurement of Aggregate and Industry-Level Productivity Growth.Paris: OECD.
27

[57] Organization for Economic Cooperation and Development (OECD). 2003. Asia andEurope: Services Liberalization. Paris: OECD.
[58] Parente, Stephen, and Edward C. Prescott. 2005. “A Unified Theory of the Evolutionof International Income Levels.” In Handbook of Economic Growth, ed. Philippe Aghionand Steven N. Durlauf, 1371-1416. Elsevier Science: North Holland
[59] Perkins, Dwight H., and Thomas G. Rawski. 2008. “Forecasting China’s EconomicGrowth to 2025.” In China’s Great Economic Transformation, ed. Loren Brandt andThomas G. Rawski, 829-886. Cambridge: Cambridge University Press.
[60] Rosenberg, Nathan. 1994. Exploring the Black Box: Technology, Economics, and History.Cambridge: Cambridge University Press.
[61] Ruoen, Ren. 1997. China’s Economic Performance in an International Perspective. Paris:OECD.
[62] Schott, Peter K. 2008. “The Relative Sophistication of Chinese Exports.” EconomicPolicy, 23(53): 1-49.
[63] Shuguang, Zhang, Zhang Yansheng, and Wan Zhongxin. 1998. Measuring the Costsof Protection. Washington, D.C.: Institute for International Economics.
[64] Sørensen, Anders. 2001. “Comparing Apples to Oranges: Productivity Convergenceand Measurement across Industries and Countries: Comment.” American EconomicReview, 91(4): 1160-67.
[65] Stavis, Benedict. 1991. “Market Reforms and Changes in Crop Productivity: Insightsfrom China.” Pacific Affairs, 64(3): 373-83.
[66] Young, Alwyn. 2000. “The Razor’s Edge: Distortions and Incremental Reform in thePeople’s Republic of China.”Quarterly Journal of Economics, 115(4): 1091-1135.
[67] Young, Alwyn. 2003. “Gold into Base Metals: Productivity Growth in the People’sRepublic of China during the Reform Period.” Journal of Political Economy, 111(6):1220-61.
[68] Zhang, Jun. 2006. “Investment, Investment Efficiency and Economic Growth inChina.” In China, Hong Kong and the World Economy, ed. Lok Sang Ho and RobertAsh, 273-96. New York: Palgrave Macmillan.
28