south coast central route strategy evidence report
TRANSCRIPT
Safe roads, reliable journeys, informed travellers
An executive agency of the Department for Transport
South Coast Central Route Strategy
Evidence Report
April 2014

South Coast Central route-based strategy evidence report
i
Document History
South Coast Central route-based strategy evidence report
Highways Agency This document has been issued and amended as follows:
Version Date Description Author Approved by
6 03/04/14 Fifth Draft Peter Phillips Simon Jones
5 17/03/2014 Fourth Draft post stakeholder comments Peter Phillips Simon Jones
4 31/01/2014 Third Draft Peter Phillips Simon Jones
3 15/01/2014 Second Draft amended Peter Phillips Simon Jones
2 14/01/2014 Second Draft Peter Phillips Simon Jones
1 04/12/2013 First Draft Peter Phillips Simon Jones

South Coast Central route-based strategy evidence report
ii
Table of Contents
Tables ........................................................................................................................ iii
1 Introduction ......................................................................................................... 4
1.1 Background ........................................................................................................ 4
1.2 The scope of the stage 1 RBS evidence report.................................................. 5
1.3 Route description ............................................................................................... 5
2 Route capability, condition and constraints ................................................... 10
2.1 Route performance .......................................................................................... 10
2.2 Road safety ...................................................................................................... 18
2.3 Asset condition ................................................................................................. 23
2.4 Route operation ............................................................................................... 25
2.5 Technology ...................................................................................................... 27
2.6 Vulnerable road users ...................................................................................... 28
2.7 Environment ..................................................................................................... 30
3 Future considerations ....................................................................................... 37
3.1 Overview .......................................................................................................... 37
3.2 Economic development and surrounding environment .................................... 40
3.3 Network improvements and operational changes ............................................ 44
3.4 Wider transport networks ................................................................................. 46
4 Key challenges and opportunities ................................................................... 49
4.1 Introduction ...................................................................................................... 49
4.2 Operational challenges and opportunities ........................................................ 54
4.3 Asset condition challenges and opportunities .................................................. 55
4.4 Capacity challenges and opportunities ............................................................ 56
4.5 Safety challenges and opportunities ................................................................ 58
4.6 Social and environmental challenges and opportunities .................................. 58
4.7 Conclusion ....................................................................................................... 66
Appendix A Route map ........................................................................................... 68
Appendix B Glossary............................................................................................... 71
Appendix C Stakeholder involvement .................................................................... 73

South Coast Central route-based strategy evidence report
iii
Tables Table 2.1 Ten busiest sections on the route (1st April 2012 to 31st March 2013) 11
Table 2.2 Ten least reliable journey-time locations on the route (1st April to 31st March 2013) 12
Table 2.3 AQMAs by local authority 30
Table 3.1 Key housing and economic growth proposals 41
Table 3.2 Committed SRN enhancement schemes 45
Table 3.3 Declared pipeline schemes 46
Table 3.4 Committed local transport network enhancement schemes 46
Table 4.1 Schedule of challenges and opportunities 61

South Coast Central route-based strategy evidence report
4
1 Introduction 1.1 Background
1.1.1 The Highways Agency is responsible for planning the long term future and development of the strategic road network.
1.1.2 Route-based strategies (RBSs) represent a fresh approach to identifying investment needs on the strategic road network. Through adopting the RBS approach, we aim to identify network needs relating to operations, maintenance and where appropriate, improvements to proactively facilitate economic growth.
1.1.3 The development of RBSs is based on one of the recommendations included in Alan Cook’s report A Fresh Start for the Strategic Road Network, published in November 2011. He recommended that the Highways Agency, working with local authorities (LA) and local enterprise partnerships (LEPs), should initiate and develop route-based strategies for the strategic road network.
1.1.4 The then Secretary of State’s accepted the recommendation in the Government’s response (May 2012), stating that it would enable a smarter approach to investment planning and support greater participation in planning for the strategic road network from local and regional stakeholders.
1.1.5 The Highways Agency completed the following three pilot strategies which have been published on the Agency website:
A1 West of Newcastle
A12 from the M25 to Harwich (including the A120 to Harwich)
M62 between Leeds and Manchester. 1.1.6 Building on the learning from those pilot strategies, we have divided the
strategic road network into 18 routes. A map illustrating the routes is provided in Appendix A. The South Coast Central route is one of that number.
1.1.7 RBS are being delivered in two stages. Stage 1 establishes the necessary evidence base to help identify performance issues on routes and anticipated future challenges, takes account of asset condition and operational requirements, whilst gaining a better understanding of the local growth priorities.
1.1.8 In the second stage we will use the evidence to take forward a programme of work to identify possible solutions for a prioritised set of challenges and opportunities. It is only then that potential interventions are likely to come forward, covering operation, maintenance and if appropriate, road improvement schemes.
1.1.9 The RBS process will be used to bring together national and local priorities to inform what is needed for a route, while delivering the outcomes in the performance specification.
South Coast Central route-based strategy evidence report
5
1.1.10 Using the evidence base and solutions identification studies, we will establish outline operational and investment priorities for all routes in the strategic road network for the period April 2015 – March 2021. This will in turn feed into the Roads Investment Strategy, announced by the Department for Transport in Action for Roads. That document also mentioned that the A27 Feasibility Study would be taken forward as a separate study. This study has commenced and draws on all the past studies of the route as well as any evidence from this report
1.2 The scope of the stage 1 RBS evidence report
1.2.1 During the first stage of RBS, information from both within the Agency and from our partners and stakeholders outside the Agency has been collected to gain an understanding of the key operational, maintenance and capacity challenges for the route. These challenges take account of the possible changes that likely local growth aspirations, or wider transport network alterations will have on the routes.
1.2.2 The evidence reports:
Describe the capability, condition and constraints along the route;
Identify local growth aspirations;
Identify planned network improvements and operational changes;
Describe the key challenges and opportunities facing the route over the five year period;
Give a forward view to challenges and opportunities that might arise beyond the five year period.
1.2.3 The 18 evidence reports across the strategic road network will be used to:
Inform the selection of priority challenges and opportunities for further investigation during stage 2 of route-based strategies.
Inform the development of future performance specifications for the Highways Agency.
1.2.4 A selection of the issues and opportunities identified across the route are contained within this report, with a more comprehensive list provided within the technical annex. This is for presentational reasons and is not intended to suggest a weighting or view on the priority of the issues.
1.2.5 The evidence reports do not suggest or promote solutions, or guarantee further investigation or future investment.
1.3 Route description
1.3.1 The RBS covers 281.85km of the strategic road network and contains a mixture of motorway and trunk road sections comprising the following roads
The A27 extending from the junction with the A3 to the west through to Pevensey in East Sussex

South Coast Central route-based strategy evidence report
6
the A259 from Pevensey through Hastings and onto Brenzett to the south of Ashford
the A2070 between Brenzett and Ashford,
the A21 between junction 5 of the M25 and Hastings , and
the A23 between junction 9 on the M23 down to Brighton 1.3.2 The extent of the RBS is shown in Figure 1. 1.3.3 The A27 section of the route extends along the length of the south coast
between Portsmouth and Hastings, and then the route continues through to Ashford via the A2070, and A259 in the east. In the west of the route it services the densely populated conurbations adjacent to the M27/A27, including Eastleigh, Hedge End, Fareham, and Havant. The road then transitions into the A27 which skirts the conurbations of Chichester, Arundel, Worthing and Brighton. To the east of Brighton the road runs adjacent to population centres which include Lewes, Newhaven, Eastbourne, Bexhill and Hastings.
1.3.4 The route also includes the A21 that extends northward from Hastings through to junction 5 of the M25. In following this route the road runs in close proximity to the towns of Pembury, Tunbridge Wells and Tonbridge and Sevenoaks, as well as through a number of smaller communities in East Sussex.
1.3.5 The route also extends along the A23 as far as junction 9 on the A23/M23 corridor linking Brighton and Hove to the population and employment centres in around Crawley, Horsham, East Grinstead and Gatwick.
1.3.6 The extent of the route means it abuts other RBS corridors including the M25 to Solent RBS to the west in the vicinity of the A3, the London and M25 RBS at junction 9 on the A3/M23, and via the A21 with the M25 to Kent to RBS at the junction with the M26 and M25 and at the A2070 junction with the M20.
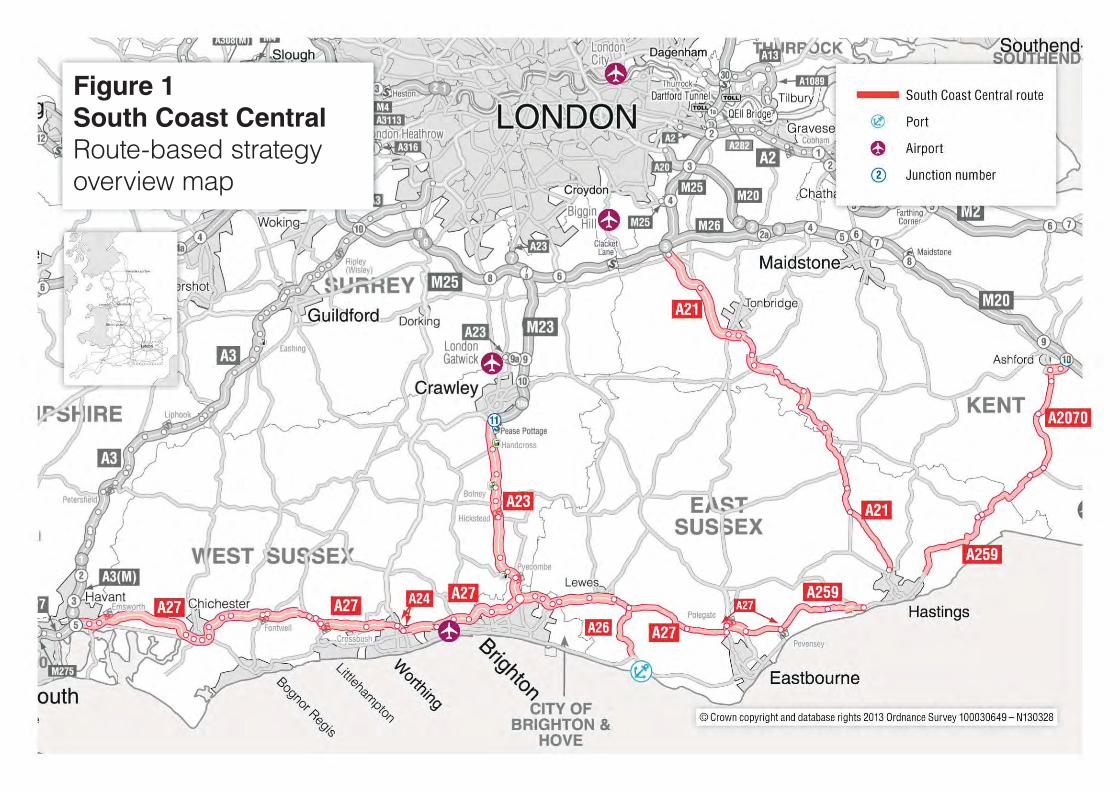
EurotunnelEurotunnel
Figure 1South Coast CentralRoute-based strategy overview map

South Coast Central route-based strategy evidence report
8
1.3.7 The extent of the road network in the South Coast Central RBS, and the variable standard of the roads (ranging from single two lane sections of the A27 and A259, through to six lane motorway standard sections on the A23) means that the RBS therefore cannot really be considered in terms of a continuous corridor. However for the purposes of this document, the RBS will be referred to as a route.
1.3.8 The quality of many of the roads in the route means that it also has characteristics which would not normally be considered as acceptable for the Strategic Road Network (SRN). In particular, many of the SRN roads in the route exhibit the following characteristics:
A poor quality user experience, due to congestion reliability and speed issues at Chichester, Arundel and Worthing;
Experience unacceptably high accidents and safety issues at many hotspot sections such as on the A27 at Chichester, Arundel Worthing and between Lewes and Polegate. Also on the A259 in Bexhill and the A21 north of Hastings.
Provides poor travel and severance issues for vulnerable user groups in particular on the A27 for Arundel, Salvington, Broadwater, Sompting and Lancing, Selmeston and Wilmington and in Hurst green on the A21.
Suffers from severe environmental and air-quality impacts. 1.3.9 The congested nature of parallel local roads and limited scope for traffic
divergence on to alternative routes also means small problems or incidents on the network can quickly escalate into major congestion problems and delays. Inevitably these issues then manifest themselves through high levels of customer complaints and a poorer quality of service for users, particularly on the A27 and A259 and A21.
1.3.10 The M3 and the M27 (including the A27) form a part of the TEN-T with, in general terms, the section of road between Portsmouth and Brighton providing an a opportunity for more strategic traffic movement traffic from the west through to the M25 and Gatwick Airport via the A23/M23 corridor. The Trans-European Network - Transport (TEN-T) programme was created by the EU to support the development of the single market by providing funding for transport infrastructure projects on a set of defined networks (GOV.UK). In particular the programme aims to, cross natural barriers, complete main routes cross-borders and improve interoperability and interconnections.
1.3.11 Inevitably the route is well defined between Portsmouth and Brighton as it is constrained to the north by the South Downs National Park and various towns and the sea to the south. The road is predominantly of at least a dual two standard route across this section, with notable exception at Arundel and Worthing where it reduces to single carriageway in residential areas. This section of the route in particular experiences considerable peak hour traffic and suffers from having a number of local accesses which mean that it attracts considerable peak local access movements which reduce its strategic road function. Congestion problems also tend to be exacerbated by seasonality
South Coast Central route-based strategy evidence report
9
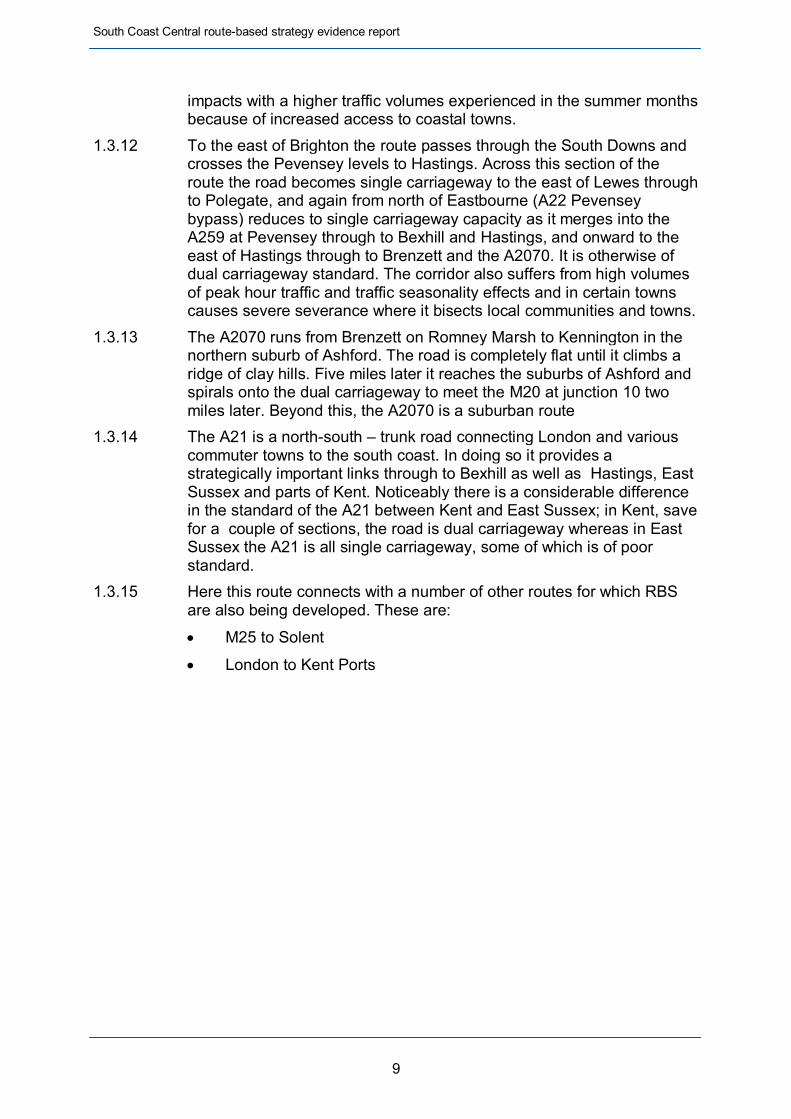
impacts with a higher traffic volumes experienced in the summer months because of increased access to coastal towns.
1.3.12 To the east of Brighton the route passes through the South Downs and crosses the Pevensey levels to Hastings. Across this section of the route the road becomes single carriageway to the east of Lewes through to Polegate, and again from north of Eastbourne (A22 Pevensey bypass) reduces to single carriageway capacity as it merges into the A259 at Pevensey through to Bexhill and Hastings, and onward to the east of Hastings through to Brenzett and the A2070. It is otherwise of dual carriageway standard. The corridor also suffers from high volumes of peak hour traffic and traffic seasonality effects and in certain towns causes severe severance where it bisects local communities and towns.
1.3.13 The A2070 runs from Brenzett on Romney Marsh to Kennington in the northern suburb of Ashford. The road is completely flat until it climbs a ridge of clay hills. Five miles later it reaches the suburbs of Ashford and spirals onto the dual carriageway to meet the M20 at junction 10 two miles later. Beyond this, the A2070 is a suburban route
1.3.14 The A21 is a north-south – trunk road connecting London and various commuter towns to the south coast. In doing so it provides a strategically important links through to Bexhill as well as Hastings, East Sussex and parts of Kent. Noticeably there is a considerable difference in the standard of the A21 between Kent and East Sussex; in Kent, save for a couple of sections, the road is dual carriageway whereas in East Sussex the A21 is all single carriageway, some of which is of poor standard.
1.3.15 Here this route connects with a number of other routes for which RBS are also being developed. These are:
M25 to Solent
London to Kent Ports

South Coast Central route-based strategy evidence report
10
2 Route capability, condition and constraints 2.1 Route performance
2.1.1 The strategic road network comprises only three per cent of England’s road network, but it carries one-third of all traffic. Around 80 per cent of all goods travel by road, with two-thirds of large goods vehicle traffic transported on our network.
2.1.2 Throughout the day and over the whole of the year the Agency measure traffic volumes and traffic speeds on sections of road between junctions. Our data enables us to identify the sections of road that experience lower speeds than the typical free flow speed we have measured for that section. When we refer to in the report to the worst congested sections of road we are comparing the data for different sections of road with reference to this measure. We also have ways of calculating delays at junctions from our data sources.
2.1.3 The 7 day Annual Average Daily Traffic (AADT) flow data for 2012 is used to compare typical flows rather than a peak month such as may be experienced in August on holiday routes or winter months where flows are reduced due to wintry weather. Unless otherwise stated, AADT is quoted on a bi-directional flow basis between junctions.
2.1.4 For this route the AADT on the A23 for the North of M23 junction 7 both directions is reasonably low, the maximum flows recorded were 18,956 in August and minimum flows in February at 14,140. However most of the flows for the other links were between 25,000 and 35,000. Most of the links for the A23 peak in March, May and June; and decline gradually in the winter months.
2.1.5 The AADT data for the A21 are reasonably stable throughout the year but there is a small increase towards March, peak in August and decline in October. The Chipstead junction on the A21 at the junction with M25 junction 5 is the busiest section both directions with maximum flows of 27,462 in July. Whilst the quietest section is on the A21 southbound between A2100 near Battle (north) and A28 with minimum flows of 5,150 in December.
2.1.6 The AADT data for the A259 when plotted graphically shows two distinct patterns: higher flows around Hastings (8,000-12,000) and lower flows around Rye (2,000-6,000). The highest AADT flows are on the A266 Glyne Gap Bexhill/Hastings at 16,662 in May, although data for 6 months of the year is missing. The lowest is on the A263 east of Rye with 2,007 in February; however data for 10 months of the year is missing.
2.1.7 The A27 has extremely high flows averaging at 26,422 vehicles per day for all links. The highest flows were between A3(M) - A2030 at 67,069 in August but the average for that section was 64,363. The lowest were on the Pevensey Bypass averaging 7,856.
South Coast Central route-based strategy evidence report
11
2.1.8 The data for the M23 shows the busiest sections are around between junction 9-10 with flows at 51,838. The least busy section was on the M23 southbound within J11 at 22,081.
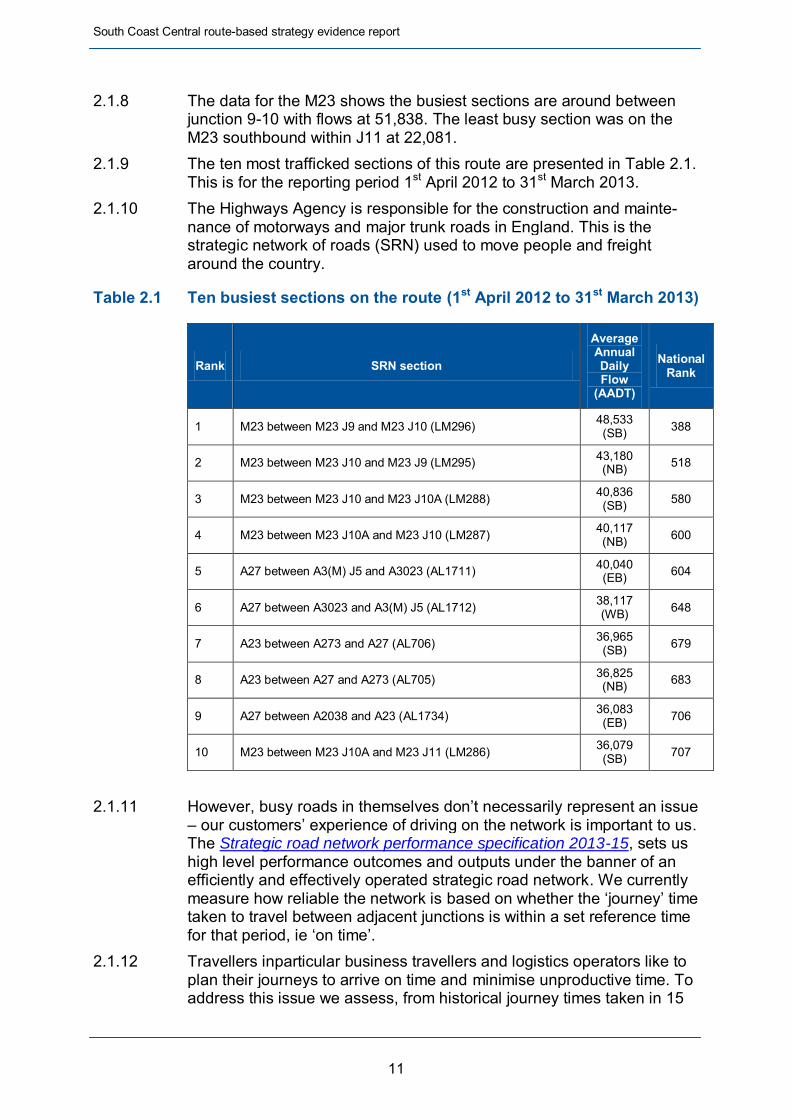
2.1.9 The ten most trafficked sections of this route are presented in Table 2.1. This is for the reporting period 1st April 2012 to 31st March 2013.
2.1.10 The Highways Agency is responsible for the construction and mainte-nance of motorways and major trunk roads in England. This is the strategic network of roads (SRN) used to move people and freight around the country.
Table 2.1 Ten busiest sections on the route (1st April 2012 to 31st March 2013)
Rank SRN section
Average Annual Daily Flow
(AADT)
National Rank
1 M23 between M23 J9 and M23 J10 (LM296) 48,533 (SB) 388
2 M23 between M23 J10 and M23 J9 (LM295) 43,180 (NB) 518
3 M23 between M23 J10 and M23 J10A (LM288) 40,836 (SB) 580
4 M23 between M23 J10A and M23 J10 (LM287) 40,117 (NB) 600
5 A27 between A3(M) J5 and A3023 (AL1711) 40,040 (EB) 604
6 A27 between A3023 and A3(M) J5 (AL1712) 38,117 (WB) 648
7 A23 between A273 and A27 (AL706) 36,965 (SB) 679
8 A23 between A27 and A273 (AL705) 36,825 (NB) 683
9 A27 between A2038 and A23 (AL1734) 36,083 (EB) 706
10 M23 between M23 J10A and M23 J11 (LM286) 36,079 (SB) 707
2.1.11 However, busy roads in themselves don’t necessarily represent an issue
– our customers’ experience of driving on the network is important to us. The Strategic road network performance specification 2013-15, sets us high level performance outcomes and outputs under the banner of an efficiently and effectively operated strategic road network. We currently measure how reliable the network is based on whether the ‘journey’ time taken to travel between adjacent junctions is within a set reference time for that period, ie ‘on time’.
2.1.12 Travellers inparticular business travellers and logistics operators like to plan their journeys to arrive on time and minimise unproductive time. To address this issue we assess, from historical journey times taken in 15
South Coast Central route-based strategy evidence report
12
minute segments throughout the day, the typical time taken by vehicles to travel sections of road and in each direction. We calculate the number of times during the last year period where the typical time is exceeded. A 100% reliability measure would mean that travellers would experience the typical time a 100% of the time; a 50% measure means this time is exceeded on 50% of the time. We also rank this reliability measure nationally so we can compare the reliability of different sections of road.
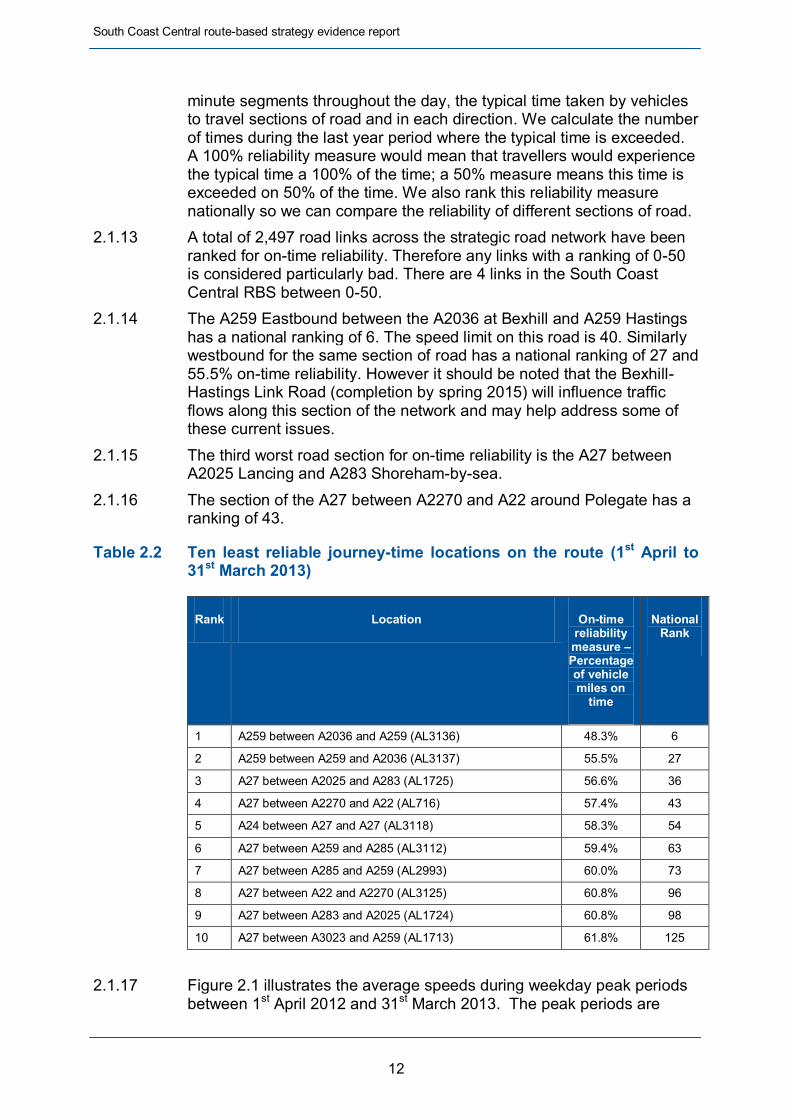
2.1.13 A total of 2,497 road links across the strategic road network have been ranked for on-time reliability. Therefore any links with a ranking of 0-50 is considered particularly bad. There are 4 links in the South Coast Central RBS between 0-50.
2.1.14 The A259 Eastbound between the A2036 at Bexhill and A259 Hastings has a national ranking of 6. The speed limit on this road is 40. Similarly westbound for the same section of road has a national ranking of 27 and 55.5% on-time reliability. However it should be noted that the Bexhill-Hastings Link Road (completion by spring 2015) will influence traffic flows along this section of the network and may help address some of these current issues.
2.1.15 The third worst road section for on-time reliability is the A27 between A2025 Lancing and A283 Shoreham-by-sea.
2.1.16 The section of the A27 between A2270 and A22 around Polegate has a ranking of 43.
Table 2.2 Ten least reliable journey-time locations on the route (1st April to 31st March 2013)
Rank Location On-time reliability measure – Percentage of vehicle miles on
time
National Rank
1 A259 between A2036 and A259 (AL3136) 48.3% 6
2 A259 between A259 and A2036 (AL3137) 55.5% 27
3 A27 between A2025 and A283 (AL1725) 56.6% 36
4 A27 between A2270 and A22 (AL716) 57.4% 43
5 A24 between A27 and A27 (AL3118) 58.3% 54
6 A27 between A259 and A285 (AL3112) 59.4% 63
7 A27 between A285 and A259 (AL2993) 60.0% 73
8 A27 between A22 and A2270 (AL3125) 60.8% 96
9 A27 between A283 and A2025 (AL1724) 60.8% 98
10 A27 between A3023 and A259 (AL1713) 61.8% 125
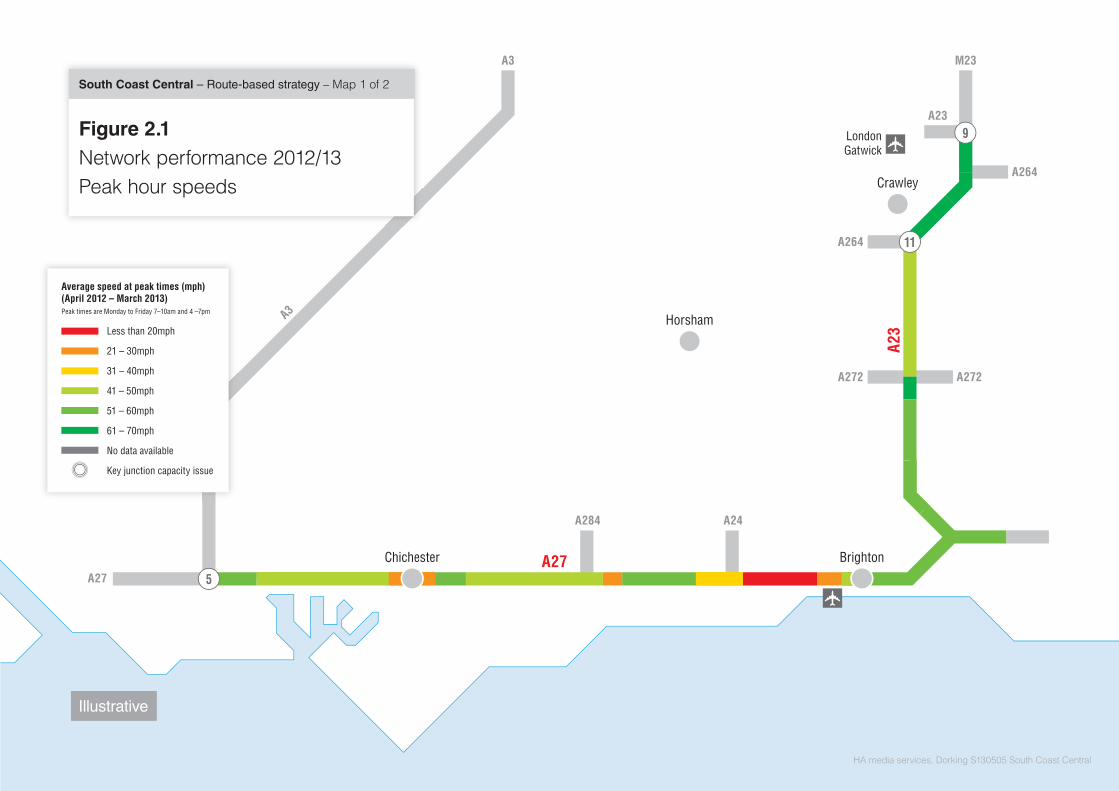
2.1.17 Figure 2.1 illustrates the average speeds during weekday peak periods
between 1st April 2012 and 31st March 2013. The peak periods are
South Coast Central route-based strategy evidence report
13
generally the busiest periods on the network and help us to understand the impact of the worst congestion on customers’ journey times. Figure 2.1 also shows any known performance or capacity issues where the local road network interfaces with the route.
2.1.18 Speeds across the route tend to be particularly negatively impacted by peak hour congestion and delays.
2.1.19 The speed maps developed for the engagement events, highlight that the A27 to the west of Brighton experiences peak hour speed reductions around the Chichester bypass, and in the vicinity of Arundel and through Worthing. The A23 / M23 to the north of Brighton operates without the major speed reductions with the road only experiencing some travel speed reductions in the vicinity of Handcross to Warninglid and delays around the A23 / A27 junction for a significant number of movements.
2.1.20 To the east of Brighton, there are significant lengths where average speeds are between 31- 40mph. There are significantly lower speeds to the west of Hastings and lower speeds also through the Polegate junctions with the A22.
2.1.21 On the A21 there is some reduction in speed on the section of road skirting to the north of Tunbridge Road, and further speed reductions are evident on narrower and poorly aligned sections of the road to the north of Hastings.
2.1.22 To the east of Hastings the A27 experiences minor localised speed reductions in built up areas such as at Rye, whilst the A2070 through to Ashford generally does not suffer from reduced speeds.
2.1.23 The strategic road network is key in promoting growth of the UK economy, and alleviating congestion can realise economic benefits.
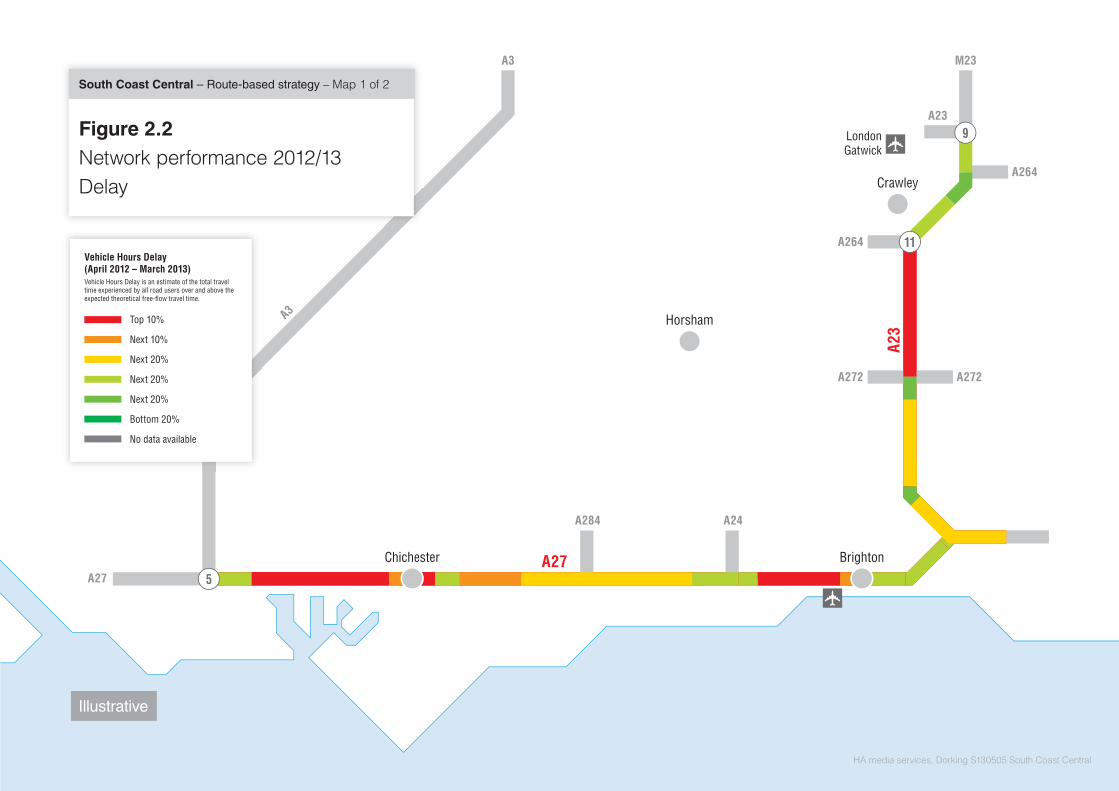
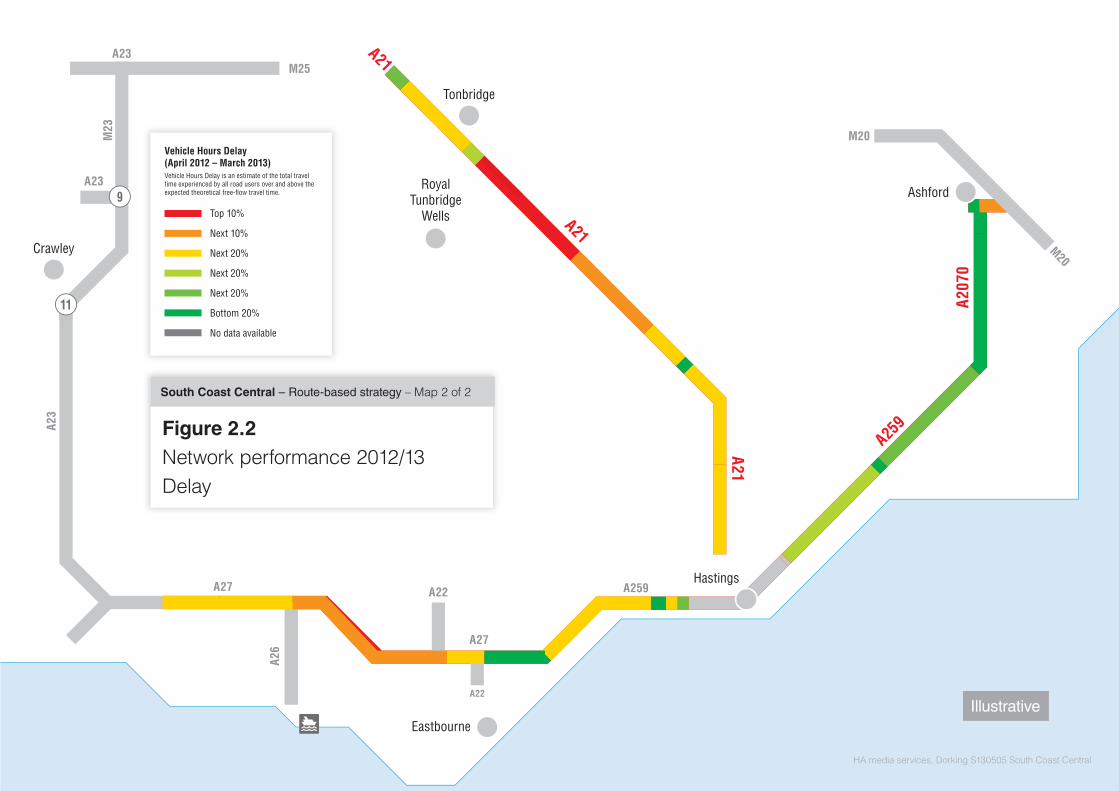
2.1.24 Figure 2.2 shows the delay on our network compared with a theoretical free-flowing network.
A272A272 A272A272
A264A264
A264A264
A284A284 A24A24
A27A27
A23A23
A27A27
A3A3
A3A3 M23M23
A23
A23
CrawleyCrawleyCrawley
LondonGatwickLondonGatwick
BrightonBrightonBrightonChichesterChichesterChichester
HorshamHorshamHorsham
5
11
9
HA media services, Dorking S130505 South Coast Central
Illustrative
Less than 20mph
21 – 30mph
31 – 40mph
41 – 50mph
51 – 60mph
61 – 70mph
No data available
Key junction capacity issue
Average speed at peak times (mph)(April 2012 – March 2013)Peak times are Monday to Friday 7–10am and 4 –7pm
Figure 2.1Network performance 2012/13Peak hour speeds
South Coast Central – Route-based strategy – Map 1 of 2

Illustrative
A23
A23
A27A27
A23A23
A23A23
A21A21
A26
A26
M23
M23
A27A27
CrawleyCrawleyCrawley
11
A259
A259
A207
0A2
070
A27A27
A21A21
A26
A26
A27A27
A22A22
A22A22
A259A259
A21A21
A21A21
A21A21
M20M20
M20M20
M25M25
EastbourneEastbourneEastbourne
TonbridgeTonbridgeTonbridge
RoyalTunbridge
Wells
RoyalTunbridge
Wells
RoyalTunbridge
Wells
HastingsHastingsHastings
AshfordAshfordAshford9
HA media services, Dorking S130505 South Coast Central
Less than 20mph
21 – 30mph
31 – 40mph
41 – 50mph
51 – 60mph
61 – 70mph
No data available
Key junction capacity issue
Average speed at peak times (mph)(April 2012 – March 2013)Peak times are Monday to Friday 7–10am and 4 –7pm
Figure 2.1Network performance 2012/13Peak hour speeds
South Coast Central – Route-based strategy – Map 2 of 2
A272A272 A272A272
A264A264
A264A264
A284A284 A24A24
A27A27
A23A23
A27A27
A3A3
A3A3 M23M23
A23
A23
CrawleyCrawleyCrawley
LondonGatwickLondonGatwick
BrightonBrightonBrightonChichesterChichesterChichester
HorshamHorshamHorsham
5
11
9
HA media services, Dorking S130505 South Coast Central
Illustrative
Top 10%
Next 10%
Next 20%
Next 20%
Next 20%
Bottom 20%
No data available
Vehicle Hours Delay(April 2012 – March 2013)Vehicle Hours Delay is an estimate of the total travel time experienced by all road users over and above the expected theoretical free-flow travel time.
Figure 2.2Network performance 2012/13Delay
South Coast Central – Route-based strategy – Map 1 of 2
Illustrative
A23
A23
A27A27
A23A23
A23A23
A21A21
A26
A26
M23
M23
CrawleyCrawleyCrawley
11
A259
A259
A207
0A2
070
A27A27
A21A21
A26
A26
A27A27
A22A22
A22A22
A259A259
A21A21
A21A21
A21A21
M20M20
M20M20
M25M25
EastbourneEastbourneEastbourne
TonbridgeTonbridgeTonbridge
RoyalTunbridge
Wells
RoyalTunbridge
Wells
RoyalTunbridge
Wells
HastingsHastingsHastings
AshfordAshfordAshford9
HA media services, Dorking S130505 South Coast Central
Top 10%
Next 10%
Next 20%
Next 20%
Next 20%
Bottom 20%
No data available
Vehicle Hours Delay(April 2012 – March 2013)Vehicle Hours Delay is an estimate of the total travel time experienced by all road users over and above the expected theoretical free-flow travel time.
Figure 2.2Network performance 2012/13Delay
South Coast Central – Route-based strategy – Map 2 of 2
South Coast Central route-based strategy evidence report
18
2.2 Road safety
2.2.1 As a responsible network operator and through the Strategic road network performance specification 2013-15, the Highways Agency works to ensure the safe operation of the network.
2.2.2 By 2020, The strategic framework for road safety 2011 forecasts the potential for a 40% reduction in the number of killed or seriously injured (KSI) on the roads compared with 2005-2009. We are working toward this aspirational goal.
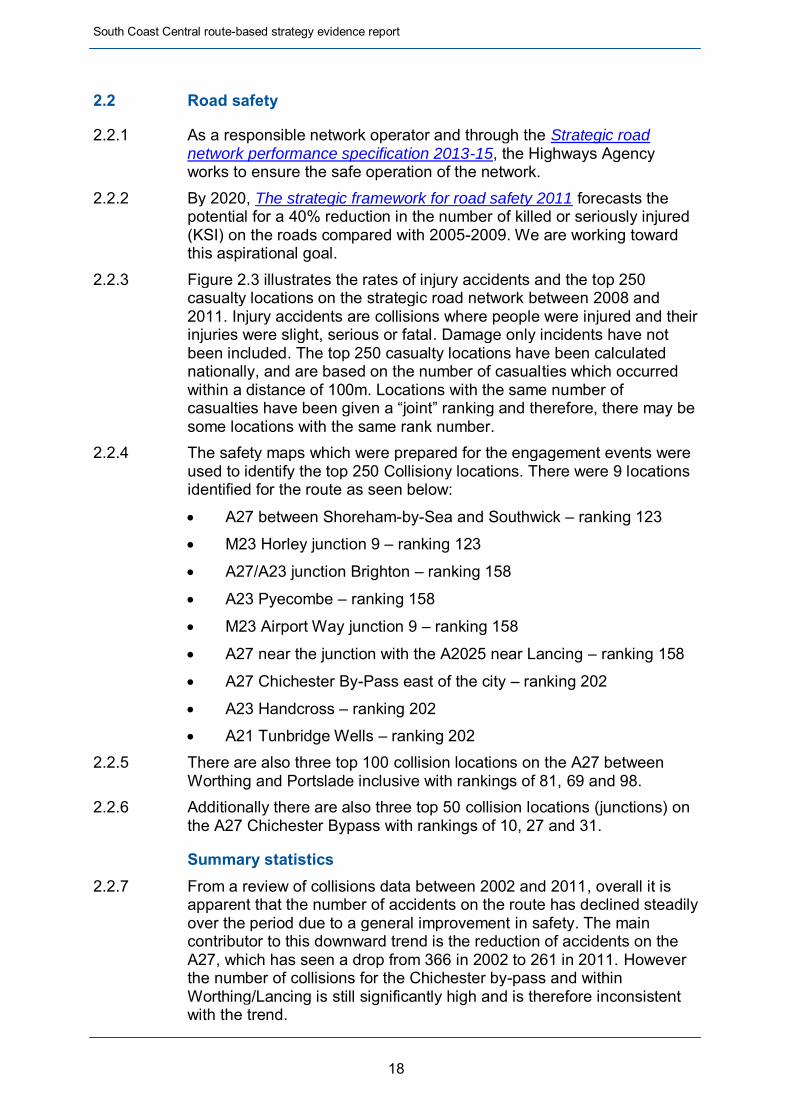
2.2.3 Figure 2.3 illustrates the rates of injury accidents and the top 250 casualty locations on the strategic road network between 2008 and 2011. Injury accidents are collisions where people were injured and their injuries were slight, serious or fatal. Damage only incidents have not been included. The top 250 casualty locations have been calculated nationally, and are based on the number of casualties which occurred within a distance of 100m. Locations with the same number of casualties have been given a “joint” ranking and therefore, there may be some locations with the same rank number.
2.2.4 The safety maps which were prepared for the engagement events were used to identify the top 250 Collisiony locations. There were 9 locations identified for the route as seen below:
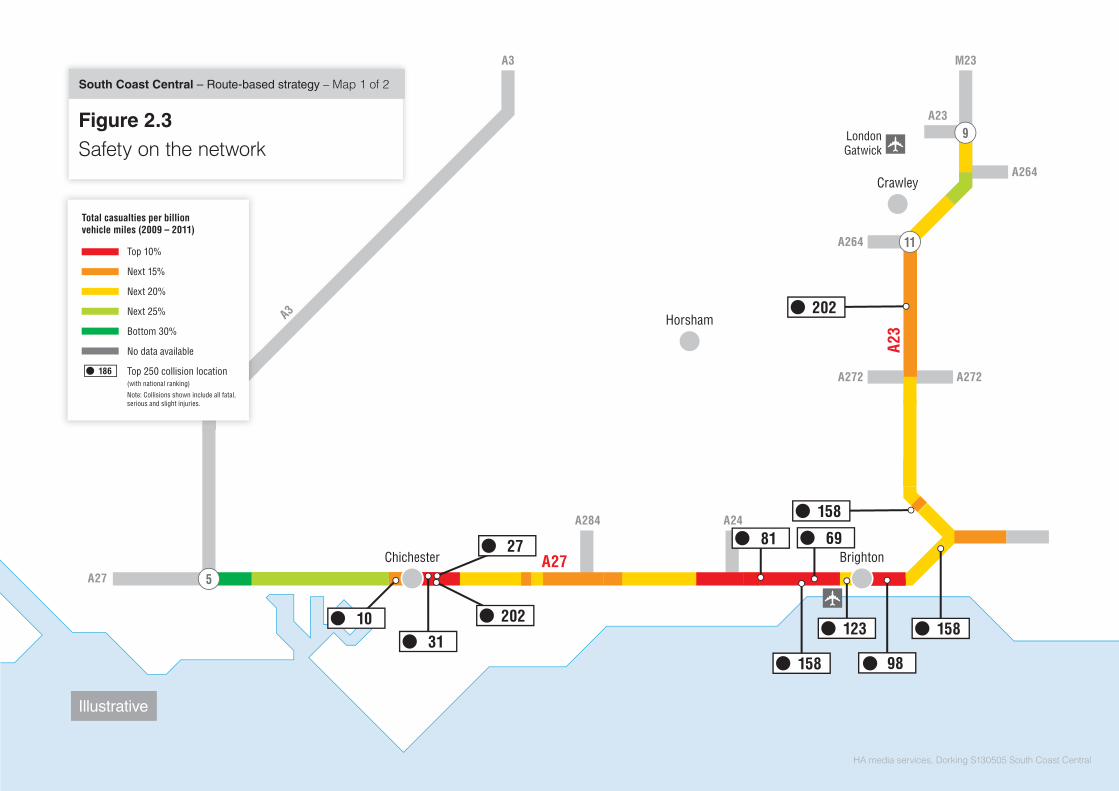
A27 between Shoreham-by-Sea and Southwick – ranking 123
M23 Horley junction 9 – ranking 123
A27/A23 junction Brighton – ranking 158
A23 Pyecombe – ranking 158
M23 Airport Way junction 9 – ranking 158
A27 near the junction with the A2025 near Lancing – ranking 158
A27 Chichester By-Pass east of the city – ranking 202
A23 Handcross – ranking 202
A21 Tunbridge Wells – ranking 202 2.2.5 There are also three top 100 collision locations on the A27 between
Worthing and Portslade inclusive with rankings of 81, 69 and 98. 2.2.6 Additionally there are also three top 50 collision locations (junctions) on
the A27 Chichester Bypass with rankings of 10, 27 and 31.
Summary statistics 2.2.7 From a review of collisions data between 2002 and 2011, overall it is
apparent that the number of accidents on the route has declined steadily over the period due to a general improvement in safety. The main contributor to this downward trend is the reduction of accidents on the A27, which has seen a drop from 366 in 2002 to 261 in 2011. However the number of collisions for the Chichester by-pass and within Worthing/Lancing is still significantly high and is therefore inconsistent with the trend.
South Coast Central route-based strategy evidence report
19
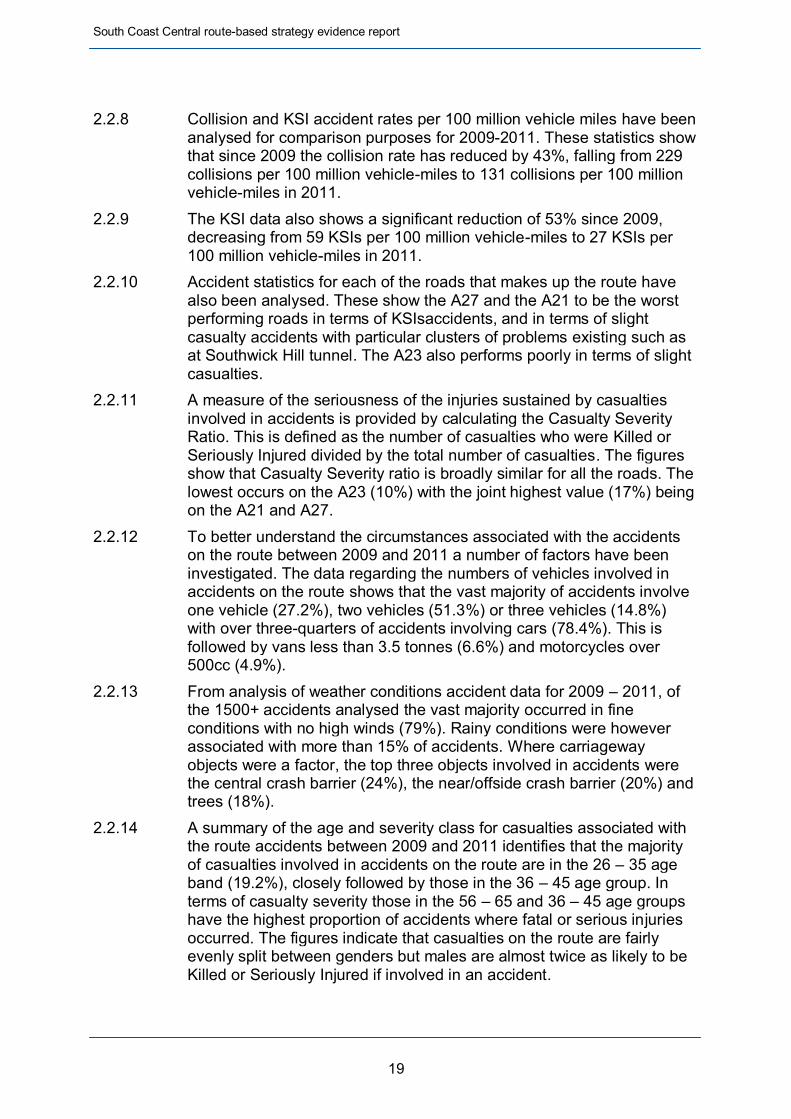
2.2.8 Collision and KSI accident rates per 100 million vehicle miles have been
analysed for comparison purposes for 2009-2011. These statistics show that since 2009 the collision rate has reduced by 43%, falling from 229 collisions per 100 million vehicle-miles to 131 collisions per 100 million vehicle-miles in 2011.
2.2.9 The KSI data also shows a significant reduction of 53% since 2009, decreasing from 59 KSIs per 100 million vehicle-miles to 27 KSIs per 100 million vehicle-miles in 2011.
2.2.10 Accident statistics for each of the roads that makes up the route have also been analysed. These show the A27 and the A21 to be the worst performing roads in terms of KSIsaccidents, and in terms of slight casualty accidents with particular clusters of problems existing such as at Southwick Hill tunnel. The A23 also performs poorly in terms of slight casualties.
2.2.11 A measure of the seriousness of the injuries sustained by casualties involved in accidents is provided by calculating the Casualty Severity Ratio. This is defined as the number of casualties who were Killed or Seriously Injured divided by the total number of casualties. The figures show that Casualty Severity ratio is broadly similar for all the roads. The lowest occurs on the A23 (10%) with the joint highest value (17%) being on the A21 and A27.
2.2.12 To better understand the circumstances associated with the accidents on the route between 2009 and 2011 a number of factors have been investigated. The data regarding the numbers of vehicles involved in accidents on the route shows that the vast majority of accidents involve one vehicle (27.2%), two vehicles (51.3%) or three vehicles (14.8%) with over three-quarters of accidents involving cars (78.4%). This is followed by vans less than 3.5 tonnes (6.6%) and motorcycles over 500cc (4.9%).
2.2.13 From analysis of weather conditions accident data for 2009 – 2011, of the 1500+ accidents analysed the vast majority occurred in fine conditions with no high winds (79%). Rainy conditions were however associated with more than 15% of accidents. Where carriageway objects were a factor, the top three objects involved in accidents were the central crash barrier (24%), the near/offside crash barrier (20%) and trees (18%).
2.2.14 A summary of the age and severity class for casualties associated with the route accidents between 2009 and 2011 identifies that the majority of casualties involved in accidents on the route are in the 26 – 35 age band (19.2%), closely followed by those in the 36 – 45 age group. In terms of casualty severity those in the 56 – 65 and 36 – 45 age groups have the highest proportion of accidents where fatal or serious injuries occurred. The figures indicate that casualties on the route are fairly evenly split between genders but males are almost twice as likely to be Killed or Seriously Injured if involved in an accident.

South Coast Central route-based strategy evidence report
20
2.2.15 From looking at Casualty Severity Class data it is apparent that four out of five casualties are travelling in car. The next two most likely forms of transport to be result in casualties are motorcycles >500cc (6.7%) and vans / small goods vehicles. When compared with the average severity ratio across all vehicle types, the data indicates that accidents involving motorcycles, pedestrians, and large goods vehicles (>7.5 tonnes) result in casualties with disproportionately high fatalities or serious injuries.
2.2.16 The ‘Shiny Side Up’ campaign consists of erecting poster style signs on the network to emphasize to motorcyclists the possible hazards of the road ahead of them. The campaign signs were placed on the A27 at the following locations:
2009: A2030 junction.
2010: Portsbridge Roundabout.
2011: Portsbridge Roundabout.
2012: None (No Motorcycle collisions 2011 therefore no justification for A27 route).
2.2.17 The A27 route saw an increase in total collisions from 12 collisions in 2011 to 18 collisions in 2012. Motorcycle collisions rose from no collisions in 2011 to 3 collisions in 2012. However as there were no motorcycle collsions in 2011no signs were erected in 2012 as they were not required. Motorcycle collisions did increase after the campaign was removed from this route, but this increase is due to random variation which is intrinsic with collision data.
2.2.18 Kent County Council has a campaign called "Help Save 478 Lives", which targets three main areas:
Speed - inappropriate and illegal speeds
Impairment - alcohol, drugs, mobile phone use, fatigue
Perception - understanding the risks and consequences 2.2.19 It is unclear which roads they are targeting with this campaign but this
may impact the SRN. 2.2.20 While we aim to reduce the numbers of KSIson the SRN, we will always
identify more safety interventions than our budget allows us to implement. We use a prioritisation process to help us and we review this regularly to ensure we are targeting the locations with the greatest opportunity to save lives and reduce the severity of injury.
A272A272 A272A272
A264A264
A264A264
A284A284 A24A24
A27A27
A23A23
A27A27
A3A3
A3A3 M23M23
A23
A23
CrawleyCrawleyCrawley
LondonGatwickLondonGatwick
BrightonBrightonBrightonChichesterChichesterChichester
HorshamHorshamHorsham
5
11
9
HA media services, Dorking S130505 South Coast Central
Top 10%
Next 15%
Next 20%
Next 25%
Bottom 30%
No data available
Top 250 collision location(with national ranking)
Note: Collisions shown include all fatal,serious and slight injuries.
Total casualties per billionvehicle miles (2009 – 2011)
186
158
123
98
158
69
158
81
202
3110 202
27
South Coast Central – Route-based strategy – Map 1 of 2
Figure 2.3Safety on the network
Illustrative

Illustrative
A23
A23
A23A23
A23A23
A21A21
A26
A26
M23
M23
CrawleyCrawleyCrawley
11
A259
A259
A207
0A2
070
A27A27
A21A21
A26
A26
A27A27
A22A22
A22A22
A259A259
A21A21
A21A21
A21A21
M20M20
M20M20
M25M25
EastbourneEastbourneEastbourne
TonbridgeTonbridgeTonbridge
RoyalTunbridge
Wells
RoyalTunbridge
Wells
RoyalTunbridge
Wells
HastingsHastingsHastings
AshfordAshfordAshford9
HA media services, Dorking S130505 South Coast Central
202
4135
202
60
Top 10%
Next 15%
Next 20%
Next 25%
Bottom 30%
No data available
Top 250 collision location(with national ranking)
Note: Collisions shown include all fatal,serious and slight injuries.
Total casualties per billionvehicle miles (2009 – 2011)
186
South Coast Central – Route-based strategy – Map 2 of 2
Figure 2.3Safety on the network
South Coast Central route-based strategy evidence report
23
2.3 Asset condition
2.3.1 We carry out routine maintenance and renewal of roads, structures and technology to keep the network safe, serviceable and reliable. We also ensure that our contractors deliver a high level of service on the Strategic Road Network to support operational performance and the long-term integrity of the asset.
2.3.2 From new, assets have an operational ‘life’ within which, under normal conditions and maintenance, the risk of failure is expected to be low. Beyond this period, the risk of asset failure is expected to increase, although for many types of asset the risk of failure remains low and we do not routinely replace assets solely on the basis that they are older than their expected operational life. We use a combination of more regular maintenance and inspection along with a risk-based approach to ensure that assets remain safe while achieving value for money from our maintenance and renewal activities.
2.3.3 We maintain a National Asset Management Plan as an annual summary of the Agency’s network asset inventory and condition. It is aimed at ensuring there is sight of future issues affecting the asset and enabling strategic decision making.
Carriageway Surface 2.3.4 The road surface on the strategic road network is primarily surfaced with
two types of flexible bituminous materials, namely Hot Rolled Asphalt (HRA) which has an approximate design life of 25 years and Thin Surface Course System (TSCS) with a lower construction cost and shorter design life of 10-15 years. Large tranches of HRA were laid in the 1990s and TSCS tranches laid in the 2000s resulting in a significant proportion of the network reaching the end of its design life by 2020.
2.3.5 It should be noted that, although carriageway surfacing may be identified as reaching or exceeding its design life, the surfacing will not necessarily require treatment at this point. Carriageway surfacing that is beyond its design life is at a higher risk of failure, with such risk increasing the further that the surfacing exceeds its design life. The increasing age of the surfacing could manifest in an increased frequency of maintenance interventions which, if a renewals scheme is not funded, may result in a higher cost both financially and in terms of disruption to road users to maintain the asset in a safe and serviceable condition.
2.3.6 In assessing the Asset conditions National and more localised Asset management plans have been reviewed. In the Highways Agency operational area in which this route sits 50% of the network comprises thin surfacing while 42% is hot rolled asphalt and 6% pavement quality concrete. The remaining 2% (47 lane km’s) is High Friction surfacing
2.3.7 On the A27 corridor a significant proportion of the flexible pavement surface reaching its design life by 2020 exist on the dual carriageway to the west of Chichester and then on selected sections of the corridor between Chichester and Worthing and to the north of Brighton.

South Coast Central route-based strategy evidence report
24
2.3.8 To the east of Brighton the dual carriageway section of the road through to Lewes is similarly affected, as are the dual carriageway Polegate bypass, and sections of the single carriageway road on the approach to Hastings. The A259 and A2070 to the east of Hastings are generally forecast to remain operationally robust up to 2020 with only some sections, such as to the south of Ashford, experiencing considerable deterioration of effective design life.
2.3.9 The majority of the A23 is projected as similarly deteriorated with only the newly resurfaced sections around Handcross Warninglid being identified as adequate by 2020 and much of the rest of the corridor projected to have reached its design life.
2.3.10 For pavements, which cover 68% of the expenditure on the Roads portfolio, there are specific issues of safety that must be addressed in the allocations for 2013/14. The ‘Do Minimum’ activities for 2013/14 that must be funded to ensure safety on the network is approximately £13 million in excess of the ‘bid tolerance’ for the year. This includes treatment to sites that are considered to be below acceptable level of ‘skid resistance’. The following risks were identified:
Fatalities where Skid Resistance deficiencies are concerned.
Increasing pothole related claims.
Severe user delays and lane closures if the thin surfacing and HRA peaks (from the double bump) are left to fail together at the same time rather than flattening out the combined coming peak.
2.3.11 We also have concrete road surface material but this is only a very small proportion when compared to the length of flexible road surfaces. The amount of concrete road surface is also reducing as it is replaced by flexible material at the end of its serviceable life. Concrete is not a material we now use in new carriageway construction on any of the motorway and trunk road network.
Structures 2.3.12 During the 1964-1979 road building period, the construction techniques
and material specifications have resulted in defects which have since affected the original design life of 120 years. Also the design life generally did not consider the requirement for proactive maintenance during the structures lifetime.
2.3.13 In term of bridges on the route, the A27 and A23 structures have an average age of twenty eight years, whilst the A21 average bridge age is thirty four years, and the A2070 is seventeen years. A259 bridges have an average age of construction of 56 years. From previous studies, it is known that several Area 4 structures are considered as desirable for improvement particularly on the A27.
2.3.14 Reviewing the inspections and structural testing/investigations on some of the Highway Agency’s older structures has also shown that many assets in the route generally are becoming in need of essential works rather than simple low cost minor repairs.

South Coast Central route-based strategy evidence report
25
Other key asset issues for routes 2.3.15 The effectiveness of programme delivery is being delivered through:
Revising the programme of Geotechnical Principal inspections based on a risk based approach rather than a route based approach, resulting in cost savings and allowing a focus on areas most at risk.
Ensuring a complete inventory of the geotechnical asset to enable the collation of more accurate information and a better quality of data for future works.
From summary data available in Asset Mgt plans for the programme between 2013-14 to 2016-17, it is apparent that 96.2% of the geotechnical network is in a fair or above fair condition. Consequently only 8.5 percent requires some form of planned maintenance action. This will remove the actual observed defect, but will not remove the underlying cause. Therefore the percentages of high and severe risks are anticipated to decrease, but then increase in later years.
2.3.16 Also due to the severe weather in 2012, it is likely that new defects will have appeared on the network. Therefore overall for 2012/13 an increase in the ‘at risk’ length would be expected.
2.3.17 Lighting is in a similar situation as the geotechnical asset in that all the works in 2012-2013 are a ‘do minimum’. This approach mitigates a percentage of an element and as such the majority of the underlying risk remains. Therefore the number of critical and high risks will decrease, but then increase in later years. As a consequence the overall risk, though managed, will continue to increase year on year.
2.3.18 It is further seeking to deliver efficiencies from their programme and drive down costs through:
Developing a collaborative planning system to enable teams to deliver the same amount of work with less resource.
Developing a Value Stream Mapping approach for benchmarking and collaboratively finding efficiencies by removing waste.
Establishing traffic management efficiencies.
Undertaking a Techmac Review leading to cost savings reduction through a focus on outcome based deliverables.
2.4 Route operation
Incident Management
2.4.1 We work hard to deliver a reliable service to customers and to reduce the number and impacts of incidents on road users.
2.4.2 Across the whole network, the Highways Agency Traffic Officer Service responds to around 20,000 incidents each month. We measure how

South Coast Central route-based strategy evidence report
26
effective we are at managing incidents by looking at the time incidents affecting the running lanes.
2.4.3 The Agency has produced a map on the Traffic Officer Service (TOS) in September 2013, which identified that all the roads in the South Coast Central RBS have the following Level of Service:
Customer information – Smart phone apps, Traffic England etc.
Incident detection (virtual patrolling)
NTOC overview, Strategic Traffic Operations (STO) Event planning and co-ordination (CMM)
RCC co-ordination of incident management Resource (Police/contractors/Traffic Officer Service etc.)
Control of on-road technology – Emergency Response Teams (ERTs), Closed Circuit Television (CCTV), Visible Message Signs (VMS), Managed Motorways (MM) etc. (where available)
National Vehicle Recovery Service (NVRS) (where available) (exceptional circumstances)
Limited TOS on-road response 2.4.4 All the SRN roads for the route have significantly reduced on-road
services. However there is more emphasis on information services, strategic overview (National Traffic Operation Centres) and tactical overview (Regional Control Centres), but no dedicated TOS on-road incident management response.
2.4.5 There is a Regional Control Centre called Weatherhill Outstation on the M23 at junction 9. This is on the boundary of the South Coast Central strategy.
2.4.6 We have a good understanding of the types of incidents which are quick to clear up and those which take longer. In general, there are far more incidents which don’t affect the running lanes for very long, and mostly these are caused by breakdowns in the live lanes, debris or damage only collisions. The longest duration incidents are mostly caused by infrastructure issues, such as road surface repairs, bridge strikes, barrier collisions and spillages.
2.4.7 We continue to work with our partners in the emergency services to reduce the impacts on our network from serious collisions and long-duration incidents. Of significance in this regard however is the lack of network resilience which exists in the route with there often only being limited opportunities for traffic diversion because of either a lack of alternative parallel routes or the lack of available capacity on these routes.
2.4.8 The section of the A27 between Portsmouth and Brighton has several sections of high incident duration in both directions these have been identified as the Chichester By-Pass and section of road between the junctions with the A285 and the A29. Also there is high delay caused by incidents between Worthing and Brighton. It is known there are high

South Coast Central route-based strategy evidence report
27
delays around Arundel, however the engagement map does not demonstrate this information.
2.4.9 On the A23 between Brighton and Crawley there is high delay between Handcross and Warninglid in both directions. This is showing 30-60 minute level of average lane impact durations on this A23 stretch. Although this is potentially due to the road widening scheme which is to continue into 2014. There are also high delays around between junction 9 and 10 of the M23 around Gatwick Airport.
2.4.10 The section of the A27 and A259 between Brighton and Hastings, has high traffic delay travelling in both directions on the A27 between Eastbourne and Lewes. In addition there are high travel delays in the Polegate area, Table 2.2 shows the least reliable journey times on the network.
2.4.11 On the A21 between Hastings and Tonbridge there is high delay between Tonbridge and A268 junction at Flimwell in both directions.
2.4.12 On the A2070 near Ashford there is a high delay area between Hastings and Ashford.
Flooding
2.4.13 We have a responsibility to reduce flooding. Flooding of the Agency network impacts upon network performance and the safety of road users. Flooding off the network has an impact on third parties living adjacent to the network.
2.4.14 Based on recorded flooding incidents, we have identified those parts of the network that are at risk of repeated flooding.
Severe Weather
2.4.15 The Agency aims to minimise where possible the impacts of severe weather, that is strong winds and snow, on network performance and the safety of road users.
2.5 Technology
2.5.1 The Agency works hard to deliver a reliable service to customers through effective traffic management and the provision of accurate and timely information. We provide information to our customers before and during their journeys.
2.5.2 We monitor key parts of our network using CCTV and use sensors in the road to monitor traffic conditions. These are used by our National Traffic Operations Centre and seven Regional Control Centres to provide information to customers before their journeys, eg on the Traffic England website or through the hands-free traffic app for smart phones. Whilst on the network, we also inform our customers using variable message signs (VMS).
2.5.3 Technologies such as overhead gantries, lane specific signals and driver information signs also form part of how we can operate our
South Coast Central route-based strategy evidence report
28
network efficiently. In some locations we have controlled motorways, which is where we can use variable mandatory speed limits to help keep traffic moving. Smart motorways use both variable mandatory speed limits and the hard shoulder as an additional live traffic lane during periods of congestion. Ramp metering manages traffic accessing the network via slip roads during busy periods to help avoid merging and mainline traffic from bunching together and disrupting mainline traffic flow.
2.5.4 The Highways Agency owns over 1,500 Traffic Cameras and has been using them to assist with the management of traffic on the trunk road and motorway network in England for nearly 30 years.
2.5.5 On the route, CCTV is currently in use at the following location:
Two cameras on the entrance to A27 Southwick Tunnel (westbound) and to cover when the tunnel closes.
2.5.6 VMS is also currently in use at the following location:
A23 approaching A27 (southbound) Aside from this there is generally only low level of technology in the route so there is little scope for linking use to performance issues.
2.6 Vulnerable road users
2.6.1 The needs and access requirements of vulnerable users are of particular significance in this route with high levels of local accessibility required for either access within towns, or for recreational users accessing local sites and features. This is particularly true of areas adjacent to the National Park or other sites of local / regional interest. The problems of catering for this are exacerbated by a lack of on/offline facilities on adjacent routes.
2.6.2 The local traffic function of many roads such as the A27 and A21 also means that vulnerable users will often seek to cross or access roads despite the fact that these routes form a part of the SRN. Consequently, more safe crossings are needed for the range of vulnerable user traffic along a number of sections of the corridor.
2.6.3 In terms of cyclists the National Cycle Network 2 is a long distance cycle route which, when complete, will link Dover in Kent with St. Austell in Cornwall via the south coast of England. The route crosses the A27 east of Chichester at the Bognor Road Roundabout (via a footbridge), it goes under the A27 west of the city at Fishbourne. It also crosses the A27 at Alfriston and Pevenseyand the A259 at Rye.
2.6.4 National Route 18 of the National Cycle Network also runs from Canterbury to Royal Tunbridge Wells and intersects with the SRN A21 at Pembury. National Route 20 connects the River Thames at Wandsworth with Brighton. This route follows the SRN A23 between Crawley and Brighton.
2.6.5 There is also the National Cycle Network route 222 which is also called the Sussex Downs Link which is a coastal link from Upper Beeding to

South Coast Central route-based strategy evidence report
29
Shoreham-by-Sea by the side of the River Adur and then goes on to Guildford. This route crosses underneath the A27 Adur Viaduct.
2.6.6 Regional Cycle Route 12 The Tudor Trail runs from Tonbridge Castle to Penshurst Place intersecting with the A21 Tonbridge By-Pass.
2.6.7 There are also a number of local cycle routes which cross the A27. These include the Tangmere Cycle Route, Bognor Regis Cycle Route and routes within Worthing
2.6.8 Horses and their riders in the South Downs National Park are also particularly vulnerable. Many of these riders feel there is no safe way of crossing the A27 to access the Rights of Way. There are no bridleway links between Hunston, Mundham, Runcton or Sidlesham and the highway links are too hazardous. This has caused the riders and carriage drivers to use horseboxes to access the South Downs, but they are finding this increasingly difficult due the number of height bars on car parks.
2.6.9 With 25 local businesses totally or partially dependant on local horse owners/riders it is important that infrastructure is provided to support and encourage the continued keeping of horses in the local area. The South Downs Way walking trail is a160 kilometre long National Trail that follows the chalk escarpment and ridges of the South Downs. This historic trail runs from Winchester in Hampshire to Eastbourne in East Sussex and allows cyclists, horses and walkers to enjoy the countryside.
2.6.10 Other long distance trails include The Arun Way which runs through West Sussex from Littlehampton to Pulborough along the Lower Arun Valley crossing the A27 at Arundel. This route has a varied landscape of beach, riverside, National Park and remote villages. The route crosses the South Downs Way National Trail and the Monarch's Way and is partly coincident with the Wey-South Path.
2.6.11 Monarch's Way is marked on OS mapping and runs from Powick Bridge, Worcester to Shoreham-by-Sea, W Sussex. This trail is the longest in England at 615 miles in length and follows the route taken by King Charles II during his escape after defeat by Cromwell in the final battle of the Civil Wars at Worcester in 1651. This trail crosses the A27 at Shoreham-by-Sea.
2.6.12 The Sussex Border Path marked on OS mapping starts at Emsworth, Hants and ends at Rye East Sussex. The path crosses the A21 near Flimwell.
2.6.13 There are also a number of severance issues where the A27 acts as a barrier to movements for example Arundel station is situated on the A27. Also the A27 causes severe problems of community severance in particularly for Salvington, Broadwater, Sompting and Lancing; which is adversely affecting road safety and the environment.

South Coast Central route-based strategy evidence report
30
2.7 Environment
2.7.1 As a responsible network operator and through the Strategic road network performance specification 2013-15, the Highways Agency works to enhance the road user experience whilst minimising the impacts In relation of the strategic road network on local communities and both the natural and built environment. In accordance with Circular 2/2013 relation to the South Downs National Park we recognise that we should seek to mitigate existing light and noise pollution so as to enhance the Park environment. In connection with new development we will work with developers and planning authorities to encourage development in more sustainable locations and to encourage sustainable transport solutions in preference to capacity enhancements. We are also conscious that deficiencies in the strategic routes can result in traffic using routes through the Park and other environmentally sensitive areas. We are also guided by the Action for Roads Command Paper, 2013 where the government, for economic and safety reasons is seeking to upgrade much of its all purpose single carriageway roads and substandard dual carriageways to modern dual carriageway.
Air quality 2.7.2 We recognise that vehicles using our road network are a source of air
pollution which can have an effect on human health and the environment. We also appreciate that construction activities on our road network can lead to short-term air quality effects which we also need to manage.
2.7.3 The Highways Agency is committed to delivering the most effective solutions to minimise the air quality impacts resulting from traffic using our network. We will operate and develop our network in a way that works toward compliance with statutory air quality limits as part of our broader Environmental Strategy.
2.7.4 Each local authority in the UK is required to review and assess the air quality in their area, to make sure that national air quality objectives will be achieved throughout the UK by the relevant deadlines. If a local authority finds any places where the air quality objectives are not likely to be achieved, it must declare an Air Quality Management Area (AQMA) at that location. The Local Authority will then prepare an Air Quality Action Plan to improve the air quality.
2.7.5 Table 2.3 below summarises the local authorities with AQMA’s with pollutants which may exceed annual national air quality objectives. Nitrogen Dioxide is predominantly produced by traffic. The AQMAs in brackets are the AQMAs which are impacted by the SRN.
Table 2.3 AQMAs by local authority

South Coast Central route-based strategy evidence report
31
Local Authority Number of AQMA’s Pollutant of Concern Portsmouth City Council 9 (1: AQMA No. 1) Nitrogen Dioxide
Chichester District Council 3 (1: Stockbridge Roundabout AQMA)
Nitrogen Dioxide
Adur District Council 2 (1: Shoreham AQMA Nitrogen Dioxide
Worthing Borough Council 1 (1: Worthing AQMA) Nitrogen Dioxide
Brighton and Hove Council 1 (None) Nitrogen Dioxide
Hastings Borough Council 1 (1: AQMA No. 1) Particulate Matter (PM)
Lewes District Council 1 (None) Nitrogen Dioxide
Horsham District Council 2 (None) Nitrogen Dioxide
Reigate and Banstead Borough Council
9 (6: AQMA No.1,2 5, 10 ,11 and 12.
Nitrogen Dioxide
Sevenoaks District Council 11 (None) Nitrogen Dioxide
Tonbridge and Malling Borough Council
8 (None) Nitrogen Dioxide
Mid Sussex District Council 1 (None) Nitrogen Dioxide
Tunbridge Wells Borough Council
1 (None) Nitrogen Dioxide
2.7.6 Using the engagement maps developed at the stakeholder events, it
can be identified that the section of the A27 between Southerham and Beddingham is very busy carrying traffic to and from Newhaven on the A26. This has had detrimental effects on the air quality in the area in the past. However the Beddingham crossing improvement has reduced these pressures and is expected to have a positive air quality impact along the A27 and A26.
2.7.7 In evidence submitted by Gatwick Airport Limited to the Davies Commission Evidence Report (July 2013) regarding expansion at Gatwick Airport, the new runway options proposed do not breach current air quality statutory Nitrogen Oxide (NOx) and Particulate Matter (PM10 and PM2.5) levels. Also the Nitrogen Dioxide (NO2), particulate matter (PM10) and particulate matter (PM2.5) concentrations are forecast to be below the average annual limit values. Consequently vehicle emissions from the M23 and airport expansion are not predicted to impact on the surrounding area. This will be the result of a combination of a cleaner more modern fleet mix and development of innovative surface access solutions.
2.7.8 Gatwick airport new runways options have recently been agreed as accepted for further consideration as a part of ongoing Davies Commission works.
Cultural heritage 2.7.9 Wherever possible, balanced against other factors, Agency schemes
are designed to avoid impacts on cultural heritage assets.
South Coast Central route-based strategy evidence report
32
2.7.10 Environmental data has been analysed for cultural heritage sites within 500 metres of the route. Cultural heritage sites include World Heritage Sites, listed buildings, scheduled monuments, registered parks and gardens, registered battlefields, conservation areas, historic landscapes, locally listed buildings.
2.7.11 Scheduled monuments are predominantly clustered in a belt across the South Downs National Park. These are mainly around the A27, east of the A23 there are 14 and west of the A23 there are 12. The other scheduled monuments are sparsely scattered around the other roads in the route, as follows: A21 (3), A23 (4), M23 (2) and A259 (3).
2.7.12 There are no World Heritage Sites in this route. 2.7.13 There are dense concentrations of listed buildings in conurbations and
towns such as Chichester, Hastings, Brighton and Hove, Rye, Lewes, Royal Tunbridge Wells and Eastbourne. In West Sussex there are listed buildings along the A27: (West of the A23) there are 445 (East of the A23) there are 246. On the following roads the numbers of listed buildings were recorded: A259 (79), A23 (88), A21 (330) and M23 (96). The historic City of Chichester has a Grade 1 listed cathedral and there are several valuable assets in the surrounding built up area.
2.7.14 There are a several registered parks and gardens which are spread out along the various roads in the route west of the A23 there are two and east of the A27 there are three. The other roads have the following number of registered parks and gardens along them: A21 (4), A23 (2) M23 (1) and A259 (1).
2.7.15 There are no registered battlefields within 500m of the route SRN.
Ecology 2.7.16 The Agency’s activities, including road construction projects and
maintenance schemes, have the potential to impact on protected sites, habitats and species. We aim to minimise the impact of our activities on the surrounding ecology and wherever possible contribute to the creation of coherent and resilient ecological networks by maximising opportunities for protecting, promoting, conserving and enhancing our diverse natural environment.
2.7.17 The following environmental data was downloaded from magic.gov.uk and a buffer area has been applied to the route SRN for ecology sites within one kilometre of the carriageway. The search identified the following statutory designated ecological sites: Special Protection Area (SPA), Special Area of Conservation (SAC), Ramsar sites, and Site of Special Scientific Interest (SSSI) and National Nature Reserves (NNR).
2.7.18 A Special Protection Area (SPA) according to Natural England is an area of land, water or sea which has been identified as being of international importance for the breeding, feeding, wintering or the migration of rare and vulnerable species of birds found within the European Union. SPAs are European designated sites, classified under the European Wild Birds Directive which affords them enhanced

South Coast Central route-based strategy evidence report
33
protection. There is only one SPA in the route which is located west of the A23 on the A27.
2.7.19 A Special Area of Conservation (SAC) according to Natural England is an area which has been given special protection under the European Union’s Habitats Directive. SACs provide increased protection to a variety of wild animals, plants and habitats and are a vital part of global efforts to conserve the world’s biodiversity. There are two SACs in the area, Lewes Downs SAC on the A27 east of the A23 and Pevensey Levels SAC on the A259.
2.7.20 Ramsar sites are wetlands of international importance, which are designated under the Ramsar Convention. The rich, complex estuarine habitats of Chichester and Langstone Harbour near the A27 are a RAMSAR designated wetland. Similarly Pevensey Levels on the A259 is also a designated Ramsarsite.
2.7.21 Site of Special Scientific Interest (SSSI) are the country's very best wildlife and/or geological sites according to Natural England. There are several SSSIsin this area, which are locates as follows: A21 (11 SSSIs), A23 (6), A27 west of the A23 (8), A27 east of the A23 (9) and A259 (3).
2.7.22 National Nature Reserves (NNR) are important sites in England for wildlife and/or geology. There is one NNR on the A27 East of the A23. There are also three close to the A259. Similarly there are four local nature reserves on the A27 west of the A23 and 1 east of the A23. There is one in the buffer of the M23 and of the A21.
Flooding 2.7.23 We have a responsibility to reduce flooding. Flooding of the Agency
network impacts upon network performance and the safety of road users. Flooding off the network has an impact on third parties living adjacent to the network.
2.7.24 Based on recorded flooding incidents, we have identified those parts of the network that are at risk of repeated flooding.
2.7.25 The environmental engagement maps highlight that there is a large risk of flooding on the A27 around Chichester and Arundel. Also on other smaller sections around Angmering, Worthing and Portslade.
2.7.26 Locally, there is a history of flooding on the A27 Portfield Roundabout to Tangmere, Chichester. There is a weather station at Temple Bar which monitors and climate conditions. This area is monitored by Balfour Beatty Mot Macdonald (BBMM), Incident Support Unit Crews and CCTV.
2.7.27 On the A23 around Twineham, Pyecombe, Pease Pottage and Handcross there are a number of flood risk areas.
2.7.28 Moving to the East of the A23 on the A27 there is a flooding risk around Falmer and Lewes. There is high risk of flooding around Alfriston and Arlington is due to the Cuckmere River.
2.7.29 On the A21 around Hastings and near Tunbridge Wells are flood risk areas.

South Coast Central route-based strategy evidence report
34
2.7.30 On the A259 there is also an area of local flood risk near Hastings around Guestling and Winchelsea. There is also a small section of the road that is at flood risk around Brookland.
2.7.31 The Environment Agency mapping also highlights there are a number of areas that are at risk of river and coastal flooding in this route. The areas at very high risk are; parts of Chichester, Bognor Regis, Littlehampton, Arundel, Shoreham-by-Sea, Newhaven, Eastbourne, Tonbridge and a large area around Dungeness/New Romney. High risk areas are Hailsham and parts of Horley. Flooding can also be a particular problem along the A27 around Pevensey
Landscape 2.7.32 Roads and other transport routes have been an integral part of the
English landscape for centuries. However, due to large increases in traffic, combined with modern highway requirements, they can be in conflict with their surroundings. We are committed, wherever possible, to minimise the effect of our road network on the landscape.
2.7.33 There are two Area of Outstanding Natural Beauty (AONB) and one National Park in the route corridor:
The South Downs National Park
The High Weald AONB
Chichester Harbour AONB 2.7.34 The South Downs was designated a National Park in 2009. This
National Park covers an area of over 1,600km2 and is home to more than 110,400 people (South Downs National Park Authority) and many business activities. The A27 borders or passes through the South Downs National Park predominantly in the central and eastern sections for approximately 74km mainly with the National Park to the north. Similarly parts of the A23 near Brighton also enter the National Park.
2.7.35 The High Weald AONB is an area of 1,460km2 and was designated in December 1980. Natural England describe the area “Sandstones and clays of the exposed centre of the dome, the High Weald give rise to a hilly, broken and remote country of ridges and valleys. In contrast, open areas of the AONB include Ashdown Forest (a SAC) and, to the east, the river valleys of the Rother, Brede and Tillingham. The AONB meets the coast at Hastings.” The High Weald is a large area which incorporates the northern parts of the A23 and A21. Improvement to the A23/M23 and the A21 would help to deter use of the A22 through the Ashdown Forest which is particularly sensitive to nitrogen emissions.
2.7.36 The Chichester Harbour AONB is one of the few remaining undeveloped coastal areas in Southern England. It is 74km2 area which was designated in July 1963. Natural England describe that area as “Backed by the Sussex Downs and is a series of tidal inlets and creeks which interrupt areas of fertile farmland. Fringed by a narrow margin of wind-sculptured oaks and hawthorn, the fields in turn give way to salt-marsh, intertidal mudflats, grazing land, poplar shelter belts, orchards and
South Coast Central route-based strategy evidence report
35
historic harbourside settlements. The harbour lowlands contain high quality arable farmland with some beef and dairy farming.”
2.7.37 Additionally there is distinctive landscape around Beachy Head which is designated as (Sussex) Heritage Coast for its geology, vegetation and wildfowl. It stretches for 6 miles around the point at Beachy Head from Eastbourne to Seaford.
Noise 2.7.38 Traffic noise arising from the Highways Agency’s network has been
recognised as a major source of noise pollution. 2.7.39 We take practical steps to minimise noise and disturbance arising from
the road network. This includes providing appropriate highway designs and making more use of noise reducing technologies.
2.7.40 In 2012, Defra completed the first round of noise mapping and action planning which identified the top one per cent of noisiest locations adjacent to major roads. These were based on the conditions in 2006. The locations in this top one per cent are known as Important Areas, and a Noise Action Plan has been prepared to manage noise in these areas.
2.7.41 Using the mapping and the Planning and Environment Report South Coast Corridor Multi-Modal Study (December 2001) several noise Important Areas have been identified. Firstly there is a small noise Important Area on the A27 near Boxgrove and Tangmere.
2.7.42 Increased traffic due to expansion at Gatwick could cause increased noise pollution.
2.7.43 Shoreham Airport located near the A2025 and A27 is a general aviation airport and is marked on the map as being an Important Area for noise.
2.7.44 There is also noise pollution associated with the A27 around Lancing; in particular this is a problem for houses situated in close proximity to the carriageway. The South Downs Society has also mentioned noise problems from the A27 Lewes Bypass section.
2.7.45 On the A259 there are noise impacts associated with the congested traffic.
Water pollution risk 2.7.46 We have a duty not to pollute watercourses and ground water. We have
identified those highway discharge locations across our network where there is an existing potential water pollution risk.
2.7.47 The following risk areas have been identified from the environmental map prepared for the engagement events which used data from magic.gov.uk.
2.7.48 There is a water pollution risk on the A27 at the A29 junction. Further east on the A27, there are at least 5 water pollution risks sites near Portslade on the Shoreham Bypass.
South Coast Central route-based strategy evidence report
36
2.7.49 Also there are a number of water pollution risk sites on the A27 near Fontwell and near Portslade. On the A23 near Brighton and at Pease Pottage there are also a number of sites.
2.7.50 Also there are at least six water pollution risks on the A21 near Hastings and some sites on the A259 near Guestling Hastings.
2.7.51 Lastly there are at least 10 sites on the A21 near Sevenoaks. 2.7.52 Some of the flooding areas also correspond to water pollution areas.
Severe Weather 2.7.53 The Agency aims to minimise where possible the impacts of severe
weather, that is strong winds and snow, on network performance and the safety of road users.
2.7.54 The M23 junction 9A to A23 Gatwick north roundabout has history of congestion and winter weather related issues.
2.7.55 The A23 at Handcross Hill is susceptible to icing, snow and drifting which can cause lorries to lose traction. This route has experienced problems in 2009/10, 2010/11 and 2012/13 where it has been snowbound. Since the commencement of the road widening project this route has become even more vulnerable due to the removal of trees making it more exposed to cross flowing easterly winds as was the case on the 11/12th March 2013.
2.7.56 The A27 Shoreham Flyover is susceptible to ice forming. To reduce risk, the police report conditions and the weather station near site monitors wind speed.
2.7.57 The A27 Brighton by-pass at Hollingbury Hill is susceptible to icing and snow, which can easily cause HGV’s to lose traction. There is a history of accidents during cold periods as altitude is a key factor. Heavy rain can be falling at the bottom hill while heavy snow is falling above 140m above sea level near the top of the hill as happened on the 22nd January 2013.
South Coast Central route-based strategy evidence report
37
3 Future considerations 3.1 Overview
3.1.1 There is already a lot known about the planned changes to and around the route. Local authorities and the development community are already pushing forward the delivery of their housing and economic growth aspirations, as set out in their local plans. The Highways Agency has a large programme of schemes it has to deliver, plus an even larger programme of pipeline measures that could come forward after the general election. Local authorities, together with port and airport operators, are progressing measures to improve the operation and performance of their transport networks and facilities.
3.1.2 All of these issues have the potential to directly influence the ongoing performance and operation of the route. Figure 3 summarises the anticipated key future issues and the following sections summarise those issues in more detail.

A272A272 A272A272
A264A264
A264A264
A284A284 A24A24
A27A27
A23A23
A27A27
A3A3
A3A3 M23M23
A23
A23
CrawleyCrawleyCrawley
LondonGatwickLondonGatwick
BrightonBrightonBrightonChichesterChichesterChichester
HorshamHorshamHorsham
5
11
9
2450
949
Chichester
15280
12399
Arun District
700
316
Worthing
1906
9022
Brighton and Hove
4098
2891
Mid Sussex
1475
393
Crawley
1650
800
Horsham
2315
4340
Adur District
A27 ChichesterMajor Scheme improvement
Southwick TunnelClosure for maintenance
New homes (to 2021)
New jobs
Contains regional centre
Contains Priority Areas forRegeneration
Planned Improvements
City Deal
Enterprise Zone
HA media services, Dorking S130505 South Coast Central
South Coast Central – Route-based strategy – Map 1 of 2
Figure 3Key future considerations for the route
Illustrative
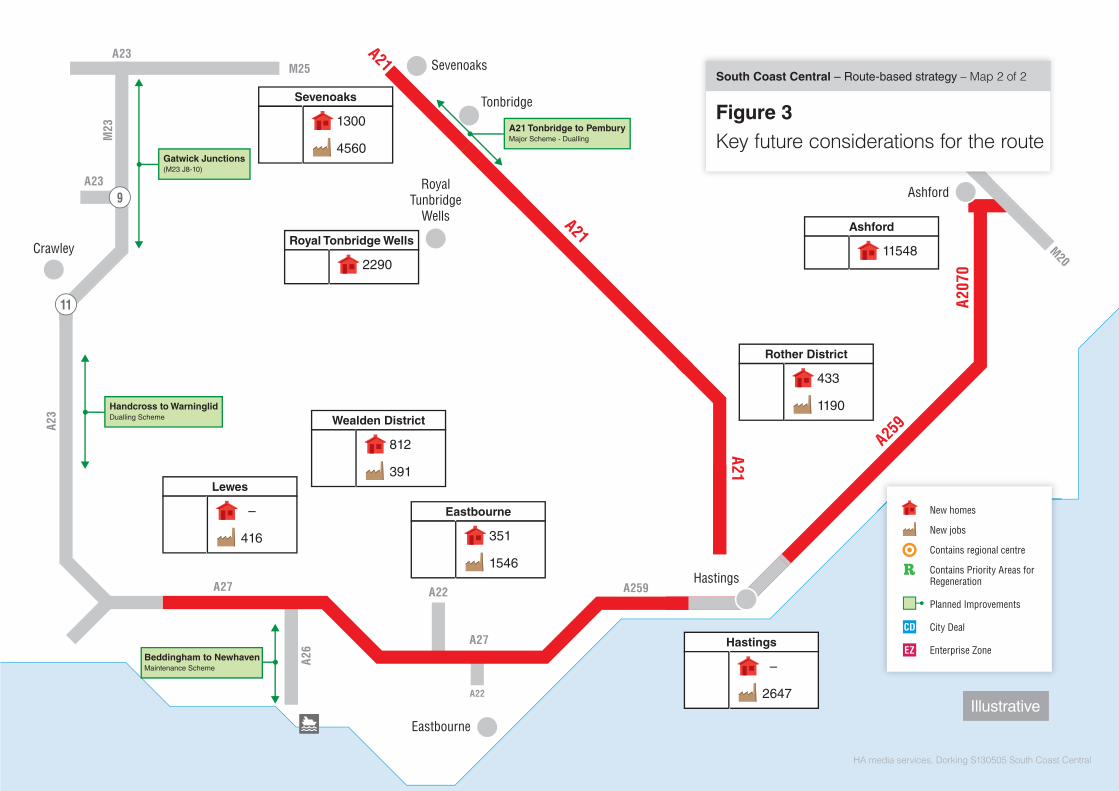
Illustrative
A23
A23
A23A23
A23A23
M23
M23
CrawleyCrawleyCrawley
11
A259
A259
A207
0A2
070
A27A27
A26
A26
A27A27
A22A22
A22A22
A259A259
A21A21
A21A21
A21A21
M20M20
M20
M25M25
EastbourneEastbourneEastbourne
TonbridgeTonbridgeTonbridge
SevenoaksSevenoaksSevenoaks
RoyalTunbridge
Wells
RoyalTunbridge
Wells
RoyalTunbridge
Wells
HastingsHastingsHastings
AshfordAshfordAshford9
–
416
Lewes
1300
4560
Sevenoaks
433
1190
Rother District
351
1546
Eastbourne
812
391
Wealden District
–
2647
Hastings
11548
Ashford
2290
Royal Tonbridge Wells
Handcross to WarninglidDualling Scheme
A21 Tonbridge to PemburyMajor Scheme - Dualling
Beddingham to NewhavenMaintenance Scheme
Gatwick Junctions(M23 J8-10)
New homes
New jobs
Contains regional centre
Contains Priority Areas forRegeneration
Planned Improvements
City Deal
Enterprise Zone
HA media services, Dorking S130505 South Coast Central
2M20
South Coast Central – Route-based strategy – Map 2 of 2
Figure 3Key future considerations for the route
South Coast Central route-based strategy evidence report
40
3.2 Economic development and surrounding environment
3.2.1 A key aspect of managing the route effectively will be ensuring that it is capable of supporting future local housing and economic growth aspirations. This will involve preparing the route through effective management and public investment to be in the best possible position to cater for the planned demands placed upon it, whilst ensuring that the developments themselves effectively mitigate their local impacts. Also some local authority stakeholders see current traffic conditions on the SRN and poor accessibility as having negative impact on their local economy.
3.2.2 Figure 3 summarises the known (at the time of RBS Draft Evidence report) key housing and economic growth aspirations that would impact on the route, with data below providing more context about some of those key developments the nature, scale and timing of the proposals. In addition to this the visitor economy is very significant for this area. The Coast to Capital LEP which contains Gatwick Airport, coastal resorts and a major part of the South Downs National Park estimates that tourism and leisure sector accounts for 5,500 businesses and employs 37,000 people.
3.2.3 Table 3.1 groups the developments (>100 jobs and/or >500 residential units) within a 5 mile radius of the strategic road network into local authority area. Consequently the developments in the local authorities of West Sussex; and East Sussex and Kent are in the Coast to Capital and South East LEP area respectively.
3.2.4 It should be noted that the developments provided are not an exhaustive list, but do highlight where the likely pressures on the network will occur as a result of future planned local development. The status of these developments is far from certain as the situation with planning policy development varies in each authority, and not all proposals are necessarily adopted in the relevant Local Plan. The actual timescales for many of the larger developments are also unclear. The data sets will need to be reviewed and evaluated as a part of analytical work undertaken in support of an RBS phase 2 exercise.
3.2.5 It should also be borne in mind that the cumulative impact of smaller scale development in areas adjacent to the route will likely have an impact, as will the potential cumulative impacts from development planned through the LEP’s aspirations.
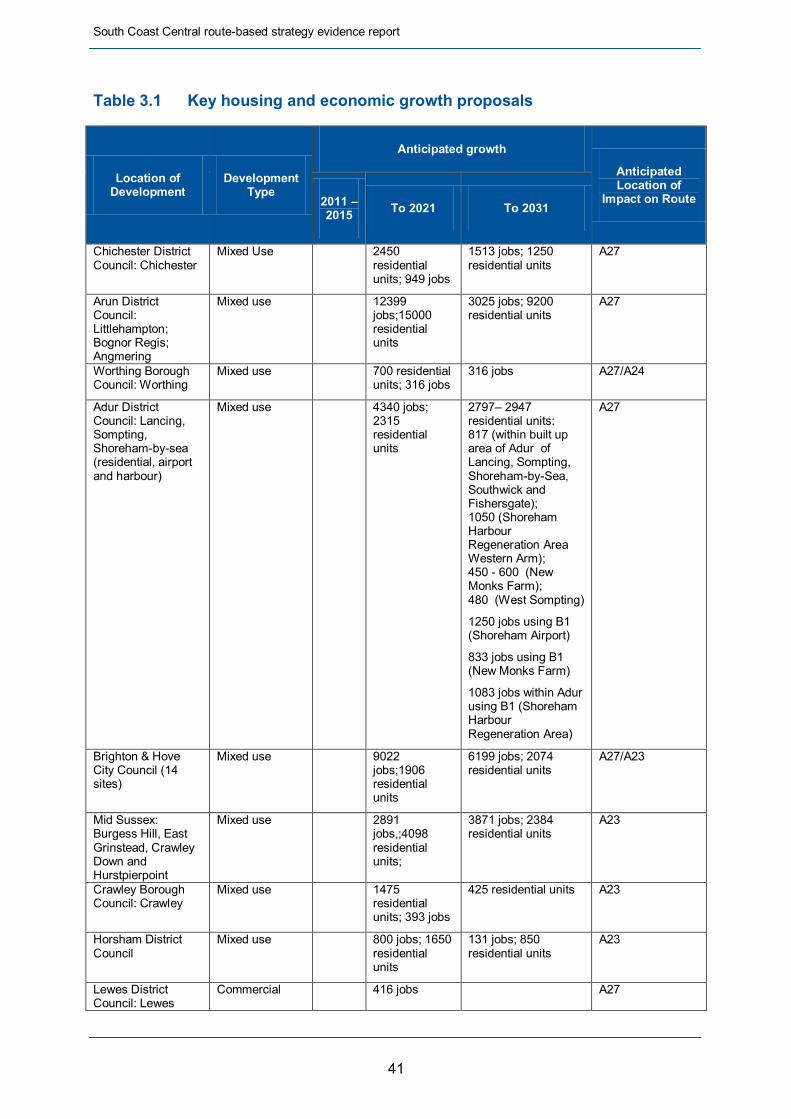
South Coast Central route-based strategy evidence report
41
Table 3.1 Key housing and economic growth proposals
Location of Development
Development Type
Anticipated growth
Anticipated Location of
Impact on Route 2011 – 2015 To 2021 To 2031
Chichester District Council: Chichester
Mixed Use 2450 residential units; 949 jobs
1513 jobs; 1250 residential units
A27
Arun District Council: Littlehampton; Bognor Regis; Angmering
Mixed use 12399 jobs;15000 residential units
3025 jobs; 9200 residential units
A27
Worthing Borough Council: Worthing
Mixed use 700 residential units; 316 jobs
316 jobs A27/A24
Adur District Council: Lancing, Sompting, Shoreham-by-sea (residential, airport and harbour)
Mixed use 4340 jobs; 2315 residential units
2797– 2947 residential units: 817 (within built up area of Adur of Lancing, Sompting, Shoreham-by-Sea, Southwick and Fishersgate); 1050 (Shoreham Harbour Regeneration Area Western Arm); 450 - 600 (New Monks Farm); 480 (West Sompting)
1250 jobs using B1 (Shoreham Airport)
833 jobs using B1 (New Monks Farm)
1083 jobs within Adur using B1 (Shoreham Harbour Regeneration Area)
A27
Brighton & Hove City Council (14 sites)
Mixed use 9022 jobs;1906 residential units
6199 jobs; 2074 residential units
A27/A23
Mid Sussex: Burgess Hill, East Grinstead, Crawley Down and Hurstpierpoint
Mixed use 2891 jobs,;4098 residential units;
3871 jobs; 2384 residential units
A23
Crawley Borough Council: Crawley
Mixed use 1475 residential units; 393 jobs
425 residential units A23
Horsham District Council
Mixed use 800 jobs; 1650 residential units
131 jobs; 850 residential units
A23
Lewes District Council: Lewes
Commercial 416 jobs A27
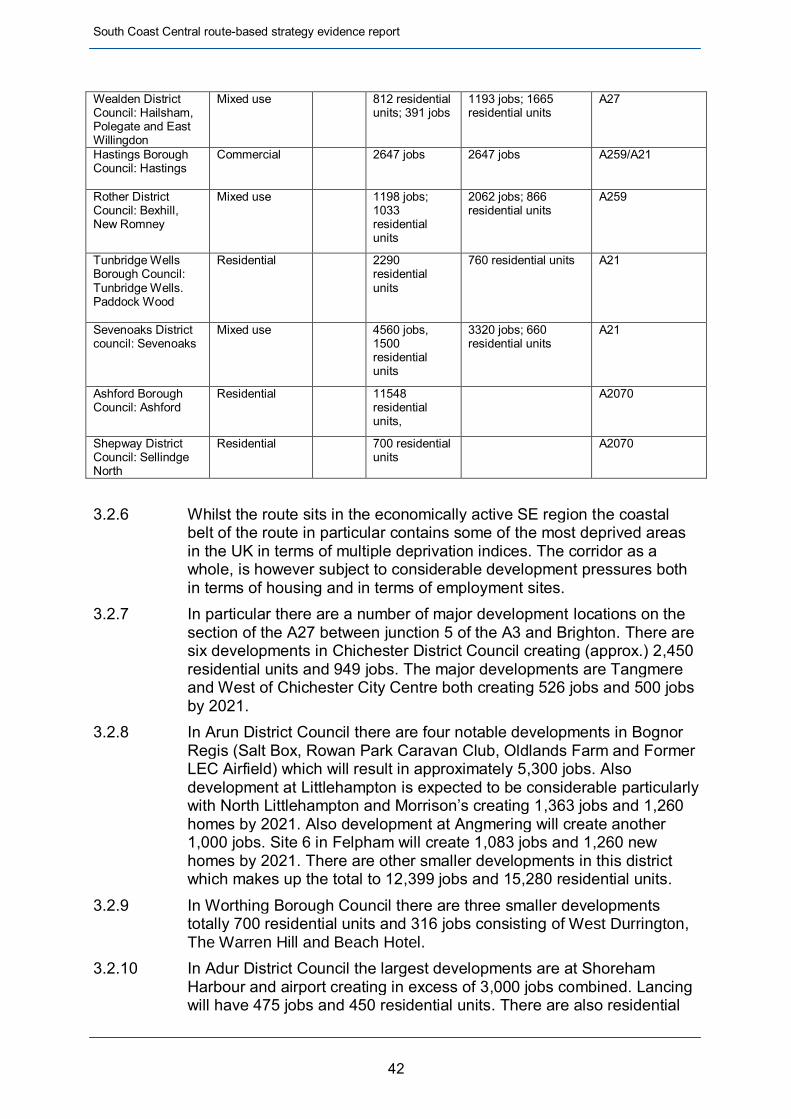
South Coast Central route-based strategy evidence report
42
Wealden District Council: Hailsham, Polegate and East Willingdon
Mixed use 812 residential units; 391 jobs
1193 jobs; 1665 residential units
A27
Hastings Borough Council: Hastings
Commercial 2647 jobs 2647 jobs A259/A21
Rother District Council: Bexhill, New Romney
Mixed use 1198 jobs; 1033 residential units
2062 jobs; 866 residential units
A259
Tunbridge Wells Borough Council: Tunbridge Wells. Paddock Wood
Residential 2290 residential units
760 residential units A21
Sevenoaks District council: Sevenoaks
Mixed use 4560 jobs, 1500 residential units
3320 jobs; 660 residential units
A21
Ashford Borough Council: Ashford
Residential 11548 residential units,
A2070
Shepway District Council: Sellindge North
Residential 700 residential units
A2070
3.2.6 Whilst the route sits in the economically active SE region the coastal
belt of the route in particular contains some of the most deprived areas in the UK in terms of multiple deprivation indices. The corridor as a whole, is however subject to considerable development pressures both in terms of housing and in terms of employment sites.
3.2.7 In particular there are a number of major development locations on the section of the A27 between junction 5 of the A3 and Brighton. There are six developments in Chichester District Council creating (approx.) 2,450 residential units and 949 jobs. The major developments are Tangmere and West of Chichester City Centre both creating 526 jobs and 500 jobs by 2021.
3.2.8 In Arun District Council there are four notable developments in Bognor Regis (Salt Box, Rowan Park Caravan Club, Oldlands Farm and Former LEC Airfield) which will result in approximately 5,300 jobs. Also development at Littlehampton is expected to be considerable particularly with North Littlehampton and Morrison’s creating 1,363 jobs and 1,260 homes by 2021. Also development at Angmering will create another 1,000 jobs. Site 6 in Felpham will create 1,083 jobs and 1,260 new homes by 2021. There are other smaller developments in this district which makes up the total to 12,399 jobs and 15,280 residential units.
3.2.9 In Worthing Borough Council there are three smaller developments totally 700 residential units and 316 jobs consisting of West Durrington, The Warren Hill and Beach Hotel.
3.2.10 In Adur District Council the largest developments are at Shoreham Harbour and airport creating in excess of 3,000 jobs combined. Lancing will have 475 jobs and 450 residential units. There are also residential

South Coast Central route-based strategy evidence report
43
and mixed use developments at Shoreham-by-sea (excluding the harbour) and Sompting respectively.
3.2.11 In Brighton and Hove City Council there are 14 smaller development sites consisting of 9,022 jobs and 1,906 residential units.
3.2.12 In Mid Sussex there are two large mixed developments in Burgess Hill accumulating to 2,685 jobs and 3,385 residential units by 2021. There are also smaller developments in East Grinstead, Crawley Down and Hurstpierpoint.
3.2.13 In Horsham Borough Council there are plans for 1,650 residential units and 800 jobs at Kilnwood Vale, West of Bewbush.
3.2.14 In Crawley Borough Council there are 10 sites identified for development although much of the growth with regard to residential units and jobs in unknown. Currently The Atrium and St Modwens are creating 393 jobs and North East Sector, Pound Hill North is creating 1,475 new homes. The expansion at Gatwick Airport is covered under Wider Transport Networks in Section 3.4.
3.2.15 There is development in Lewes District Council at North Street Corner which will create 416 jobs.
3.2.16 In Wealden District, there are two smaller sites in Hailsham creating 433 residential units and 186 jobs in Hailsham planned for 2021. There are also smaller developments at South Polegate and East Willingdon; Dittons Road and Stone Cross. Wealden District Council and Eastbourne Borough Council are working with the South East LEP to establish a LEP Enterprise Zone (LEP EZ) along the A22 corridor contributing 480 jobs to the Core Strategy. The connection to the A27 at the Copthall Roundabout at Polegate would be vital to the operation of this LEP EZ.
3.2.17 Eastbourne Borough Council has development at Eastbourne’s Sovereign Harbour which will create 1,250 jobs and the town centre will create 351 new homes. There are also developments at Birch Road and Hammonds Drive Industrial Estates in Eastbourne.
3.2.18 In Rother District Council, there are three sites in Bexhill totalling 1,198 jobs and 433 residential units. In addition there are 600 residential units planned by 2021 for NW of New Romney site, Cockreed Lane which could impact the A259/A2070.
3.2.19 Hastings Borough Council has six smaller developments which will create approximately 2,647 jobs.
3.2.20 In Tunbridge Wells Borough Council there are two sites in Tunbridge Wells at Knights Way and Knights Park which amount to 1,800 new homes. There is also a smaller development site at Paddock Wood, land at Church Farm and Land at Mascalls Court Road which is 490 residential units by 2021.
3.2.21 In Sevenoaks District Council, there are seven sites in Sevenoaks which amount to 4,560 jobs and 1,500 new homes.
South Coast Central route-based strategy evidence report
44
3.2.22 In Ashford Borough Council, there are 13 residential developments in Ashford which amount to 11,548 units.
3.2.23 In Shepway District Council there is also a smaller development of 700 residential units at land at Moorstock Lane, Sellindge North which could impact the A2070.
3.2.24 Much of the route sits in Coast to Capital LEP area (ie all of the sections of the A27 and A23 in West Sussex), however significant sections of the A27 and A259 and the A2070 and A21, are in East Sussex/ Kent which are in the SELEP area.
3.2.25 The two LEPS co-ordinate well together on strategic planning issues and both have been effective in accessing central government funding for a variety of economic initiatives. Whilst there are no Enterprise Zones in this route, the Government have delegated Coast to Capital £23m of Growing Places Funding whilst the SELEP has received £32m. This will be used as catalytic funding to bring forward infrastructure and other projects.
3.2.26 Both LEPs are also progressing the development of their Strategic Economic Plans which are anticipated as drawing together the EU Structural Investment Funds strategy. The skills strategy in this will be focused on meeting business skills needs and generating sustainable employment, and it will combine research and intelligence, with input from businesses and other skills stakeholders. A draft strategy will be submitted to government, alongside the Strategic Economic Plan, in December 2013.
3.2.27 Brighton & Hove has also secured agreement to progress its City Deal Expression of Interest. In 2012, seven UK cities were awarded City Deals by the Coalition Government so the city is in control of creating economic growth in their area in return for the government giving them responsibility and powers.
3.3 Network improvements and operational changes
3.3.1 The Agency is already delivering a large capital programme of enhancement schemes nationally. This includes Major Schemes greater than £10m in value, plus smaller enhancement schemes including the current Pinch Point Programme. The table below summarises the current committed enhancement schemes proposed along the route, which have also been represented on Figure 3. Stage 2 of the RBS report will address the need for any further schemes to enter the programme.

South Coast Central route-based strategy evidence report
45
Table 3.2 Committed SRN enhancement schemes
Location Scheme Type Completion Year Anticipated Benefits
A27 Ford Round-about Improve-ment, Arundel
Pinch Point Scheme.
2015 Increased junction capacity
A21 Tonbridge to Pembury Dualling
Agency’ Major Schemes
TBC Upgrade the A21 between Tonbridge and Pembury to dual 2-lane carriageway standard with grade separated junctions at the Fairthorne and Longfield Road junctions at the south end of the scheme. Benefits Relieve congestion Improve safety for all road users Improve journey time reliability
A27 Chichester Improvement
Agency’ Major Schemes
TBC Upgrading 6 junctions on the existing 3.5kim bypass. Benefits Reduce congestion
Improve road safety Respect the environment Improve journey time reliability Widen travel choice Improve access to and from Chichester, the Manhood
Peninsula and the Bognor Regis Take into account transport pressures resulting from
future development. Encourage regeneration of the south coast including
Bognor Regis and the Manhood Peninsula. Congestion on the A27 has been identified as an obstacle to business growth.
A26 Beddingham to Newhavan Resurfacing Scheme
Maintenance Scheme
11 October 2013
Resurfacing along various sections of the A26 between Beddingham roundabout and Newhaven. Whilst doing this the Agency’ will take the opportunity to remove ten dead elm trees between Itford Farm and Durham Farm. Benefits This work will create a smoother, quieter journey and improve safety for road users.
A23 Handcross to Warninglid
Major Improvement Scheme
Between October and December 2014
Working to widen the A23 between Handcross and Warninglid. Benefits The Handcross to Warninglid scheme is intended to improve traffic flow by widening the existing road and improve safety by bringing the road up to modern standards.
A284 Approach to A27 Crossbush Interchange Emergency Lane Closure
Emergency Scheme
TBC Following a land slip, a lane closure is in place for the safety of the travelling public.

South Coast Central route-based strategy evidence report
46
3.3.2 The 2013 Spending Review and subsequent report from HM Treasury Investing in Britain’s Future referenced a series of potential new pipeline schemes for the strategic road network. Table 3.3 below provides a summary of the pipeline improvement schemes that would impact this route, subject to value for money and deliverability.
Table 3.3 Declared pipeline schemes
Location Scheme Description
Gatwick junctions (M23 J8-10 Managed Motorways. Junction with M25 to Gatwick Airport)
Pipeline of Agency road schemes which the Government is committed to funding as part of this Spending Round, subject to value for money and deliverability. Managed motorways.
A27 Chichester Bypass Upgrading 6 junctions on the existing 3.5km bypass
Duelling of A21 Tonbridge to Pembury
Upgrade the A21 between Tonbridge and Pembury to dual 2-lane carriageway standard with grade separated junctions at the Fairthorne and Longfield Road junctions at the south end of the scheme.
3.3.3 The HM Treasury report Investing in Britain’s Future also promoted
undertaking a number of feasibility studies that the government will undertake to inform potential future investment in highway improvements. The study relating to this route is: “A27 Corridor between Portsmouth and Pevensey”.
3.3.4 This section of the corridor is a notorious and long-standing hot spot and does not need to await conclusion of these evidence reports. This study in effect expedites elements of the stage 2 phase of the RBS through the early investigation of specific interventions on this section of the route. At stage 2, any results available from the feasibility study work will be considered in the context of the emerging strategy recommendations for the entire route, including maintenance, operations and any other enhancements deemed needed along the route, together with the timing of those needs.
3.4 Wider transport networks
3.4.1 The June 2013 report from HM Treasury Investing in Britain’s Future also listed the local transport schemes either completed, under construction or due to start before May 2015. Table 3.4 below lists the schemes from that report that will influence the ongoing operation of this route, plus any other funded local network commitments that will be delivered before 2021.
Table 3.4 Committed local transport network enhancement schemes
Project Scheme Type Completion Year Anticipated Impacts on the Route
Bexhill-Hastings Link Road
Major Improvement
2015-16
Access to land for housing 1200-2000 new homes 50,000sq m business park Jobs and regeneration >£1Bn Reducing traffic on parallel routes
South Coast Central route-based strategy evidence report
47
3.4.2 The route sits within the catchments of both the Coast to Capital, South East, and also impacts (just) on the Solent LEP area.
3.4.3 Both bodies have recently been working on a programme of scheme prioritisation for improvements to the Local road network. Relevant schemes that may end up being progressed as a result of the LEPs local major transport funding applications include, For the Coast to capital LEP
A24 Capel to Surrey boundary corridor improvements
A24 junction improvements at Horsham
The A284 Lyminster Bypass – to provide improved north – south access to Littlehampton
A259 Corridor improvements in Eastern Arun For the SELEP
A22 / A27 junction improvement package for junctions to the north of Eastbourne / South Wealden areate – start date 2016 / 2017 – intended to enable housing and employment space delivery
A21 Baldslow Link (2016 / 2018) – to support the Bexhill- Hastings link road and improve strategic road network access
3.4.4 In terms of wider transport the bus services which operate along the south coast corridor generally are considered to be adequate if basic in terms of service provision. Local services, some long distance, extend along the corridor via the A259 and operate alongside the A27, albeit that these often offer a relatively low level of service. Where provided specialist local services and park and ride and community buses appear to operate successfully, although they generally provide limited weekend and evening services.
3.4.5 The rail system as configured is also seen to operate reasonably efficiently with frequent services, and a good density of stations, on a route which parallels much of the A27 corridor.
3.4.6 Some peak hour congestion exists on the corridor but outside of the peak hour there is generally sufficient capacity available, and good links exist for north-south services to London from Southampton, Portsmouth Brighton and Ashford. It is, however, generally recognised that if rail is to operate as a viable alternative solution to the coastal road network there will need to be a step change in service provision around ‘whole journey’ issues such as:
The quality of main station access for all modes (walking, cycling and bus) and the lack of parking provision
The extent to which seamless transfer between other modes and the train can easily be accommodated
3.4.7 It is also generally accepted that the rail system is operating close to its potential capacity in terms of available train paths. This is particularly true in peak hours. Problems are further exacerbated by the high

South Coast Central route-based strategy evidence report
48
number of level crossings, particularly in the section between Havant and Worthing which limit the potential for increasing line speeds and capacity.
3.4.8 A number of stations also have poor operational capability which limits their accessibility to semi fast services eg Portsmouth, Bognor and Littlehampton because of their physical layout, whilst track layout creates various areas of discontinuity such as for access to Barnham and station layout at Brighton and Eastbourne terminus stations.
3.4.9 Overall the severe congestion which exists on the road and generally inadequate alternatives to the private car means that there is significant pressure on the A27 corridor generally and little scope for improved interchange between modes or for easily changing travel behaviour . In particular this is exacerbated by the need for high levels of local access and the intractable problems which exist along certain sections of the corridor.
3.4.10 The most significant other major transport activity impacting on the route is that of aviation. Gatwick Airport sits 28 miles to the south of London and has excellent public transport links into central London and good strategic road network links to the north via A23/M23 and M25, and to the south coast via the A23.
3.4.11 In 2011 the airport catered for 33.6m passengers and offered flights to over 200 destinations in 90 countries. The airport is estimated to provide 21,000 on airport jobs and a further 13,000 jobs through related activities. The airport has a target of seeking 40% public transport mode share for passengers and staff when it reaches its 40 million passengers per annum target. As a part of the Gatwick’s response to the current SE Airports commission consultation it has identified the need for investment in a new runway. The submission outlines the intention for a runway to the south of the existing runway which could be operational by 2025. The increased capacity is argued as providing the required additional capacity for London and the SE up until the 2040s.
3.4.12 The runway investment will require major rail and road based surface access investment to the north of Gatwick but have little direct impact in capacity enhancement terms on the route.
South Coast Central route-based strategy evidence report
49
4 Key challenges and opportunities 4.1 Introduction
4.1.1 It is not possible to show all the challenges and opportunities identified in this evidence report. This chapter shows a selection based on those where our internal and external stakeholders viewed these as a priority and these are supported by evidence. A full list of all the identified challenges and opportunities are provided in the Technical Annex.
4.1.2 Figure 4 summarises some of the key issues and challenges that the route will experience during the 5 years from 2015, with the following sections and Table 4.1 explaining these issues and challenges in more detail. The Figure illustrates some of the key themes:
Sections of the A27 and A21 and A26 are noted seen-by stakeholders as not “fit for purpose” – the east-west connectivity is not functioning, and the Hastings/Eastbourne region is cut off from the rest of the SRN.
The SRN in this route is not consistent – it varies from 3-lane motorway (M23) to single carriageway sections (A259) where two HGVs are unable to pass in opposite directions. This results in travel speed reductions, which combined with a few critical junctions results in unreliable journey times.
The otherwise reasonable standard dual carriageway route of the A27 throughout West Sussex is severely compromised by the single carriageway bottlenecks at Arundel and Worthing/Lancing and the series of congested at-grade junctions on the Chichester by-pass.
The asset design life of most of the road network in the RBS will be reached by 2020.
Non-Motorised User (NMU) issues have been identified by a number of stakeholders. Concerns centre on the expectation of being able to cross the A27 and A21 and on community severance.

A272A272 A272A272
A264A264
A264A264
A284A284 A24A24
A27A27
A23A23
A27A27
A3A3
A3A3 M23M23
A23
A23
CrawleyCrawleyCrawley
LondonGatwickLondonGatwick
BrightonBrightonBrightonChichesterChichesterChichester
HorshamHorshamHorsham
5
11
9
A259 acts as alternativeroute to the A27 throughLittlehampton
NMU crossings required NMU crossings required
NMU crossings required
Travel speed reduction on A27 Chichester Bypass leading to unreliable journey times
Travel speed reduction at Worthing and Arundel leading to unreliable journey times A23/A27 represents a
future bottleneck
Congestion relief on the A23 is required in order to free up capacity for freight to/from Newhaven and Shoreham ports (A LEP priority)
Asset design life reached by 2020
Asset design life reached by 2020
Asset design life reached by 2020
Operation
Safety
Asset condition
Capacity
Social and environment
Figure 4Key opportunities andchallenges for the route
HA media services, Dorking S130505 South Coast Central
South Coast Central – Route-based strategy – Map 1 of 2
Illustrative

Illustrative
A23
A23
A23A23
A23A23
M23
M23
CrawleyCrawleyCrawley
11
A259
A259
A207
0A2
070
A27A27
A26
A26
A27A27
A22A22
A22A22
A259A259
A21A21
A21A21
A21A21
M20M20
M20
M25M25
EastbourneEastbourneEastbourne
TonbridgeTonbridgeTonbridge
SevenoaksSevenoaksSevenoaks
RoyalTunbridge
Wells
RoyalTunbridge
Wells
RoyalTunbridge
Wells
HastingsHastingsHastings
AshfordAshfordAshford
Illustrative
Operation
Safety
Asset condition
Capacity
Social and environment
9
Travel speed reduction north on A21 north of Tunbridge Road leading to unreliable journey times
Travel speed reduction at Rye leading to unreliable journey times
Upgrade of the link between Newhaven and the A23 is critical for port regeneration
Improvement ot A27/A26 bottleneck required
A21 not fit for purpose as strategic link between Hastings/south coast and M25.
A259 not fit for purpose for east-west connectivity
Inconsistent road qualitynorth of Hastings
A21 between A229 and Hastings = one of the highest risk roads in the UK
Asset design life reached by 2020 (Lewes and Polegate)
NMU crossings required
NMU crossings required
Community severance by A27 (Selmeston)
Community severance by A27 (Wilmington)
NMU crossings required at M20 J10a and along A2070
HA media services, Dorking S130505 South Coast CentralIllustrative
2M20
Figure 4Key opportunities andchallenges for the route
South Coast Central – Route-based strategy – Map 2 of 2

South Coast Central route-based strategy evidence report
52
Timescales 4.1.3 To understand the timescales of when the key challenges identified
become critical and when opportunities on the route could be realised, the following definitions have been made in Table 4.1:
Short Term: current
Medium Term: before March 2021
Long Term: not before 2021
4.1.4 These timescale categories provide a guide for informing when a future intervention may be required to meet the anticipated operational performance needs, or when interventions may be needed to help facilitate local housing and economic growth aspirations.
4.1.5 The local authorities in the areas adjacent to the route have development plans with horizons to 2026 and 2031. However, for the purposes of standardising the Route Strategies across the various regions, the Agency has defined the key planning horizon as being 2021.
Local Stakeholder Priorities 4.1.6 Input from stakeholder and road user groups linked to the route has
been used to inform the development of this evidence report. This included getting their views on what they deemed to be the priorities within their area and identifying their “top priorities” locally. The number one priority from the West Sussex Transport Plan 2011-2026 (February 2011) is “Improvements to the A27 truck road and complementary public transport improvements to the current bottlenecks at Chichester, Arundel and Worthing to increase capacity, improve reliability and safety and increase the competitiveness of local business and attract investment.” The main priority for East Sussex County Council is “Improving economic competitiveness and growth and to improve safety, health and security This has been collated according to the route to which those views related.”
4.1.7 Table 4.1 presents a summary of whether the challenges and opportunities identified were a priority for our stakeholders in their particular area. This exercise does not seek to prioritise the challenges and opportunities along the length of the route by trying to compare one issue against another, but reports the feedback from local discussions.
4.1.8 This picture of stakeholder priorities is subjective and has been informed by discussions, the top priorities locally at the stakeholder events, and in conversations with stakeholders who couldn’t attend the events.
4.1.9 We recognise that the picture we build through this categorisation will be influenced by the representatives and organisations we have engaged with, and that consequently we may not have achieved a statistically balanced view and certain priorities may not have been identified as a “top priority”. We will be conscious of the limitations of the reporting of stakeholder priorities as we move into the second stage of RBS.
South Coast Central route-based strategy evidence report
53
4.1.10 We also recognise that we will have received only limited evidence data and therefore will likely need to work with stakeholders to better understand the detail of specific proposals, and the timescales likely to be associated with transport schemes being championed by Local authorities or the LEPs.
4.1.11 A number of local authorities are also involved in Local Sustainable Transport Fund initiatives and that there is value in the Agency working with these partners to see where we can be active in encouraging demand reduction initiatives.
4.1.12 At some events stakeholders and particularly local highway authorities, suggested that a closer partnership could be developed with the Agency on programme planning and operational planning for the route being studies. There was also a desire to better understand the interaction between the route and the announced A27 Feasibility Study.
4.1.13 Key areas for such activity might include:
Joint planning in progressing local and SRN major schemes via the LEPs
Shared initiatives on Information Technology Systems (ITS) and signage strategies
Sub-regional education and training campaigns 4.1.14 Clearly such an approach may prove to be resource intensive but
present an opportunity for joint working and cost sharing in progressing specific initiatives. A challenge for the second stage of the study may be to find to find a cost effective way of achieving this.
Information from HAIL and the Highways Agency Managing Agent 4.1.15 As a part of the ongoing management of the network the managing
agent for the area (BBMM) and Highways Agency Information Line (HAIL) receive a considerable volume of communication / complaints from the customers / users of the network.
4.1.16 In general terms the South Coast Central route is one of the most active areas nationally for such communication having received, in the last 12 months until the end of November 2013, in excess of 3,200 representations. Over 2,000 of these submissions are concerned with A27 issues with particular clusters of high activity focused on the known problem areas of Chichester, Arundel, Worthing and Polegate. Additionally, A259 issues resulted in approximately 400 such letters / emails with particular clusters of activity around Bexhill, Winchelsea and Rye.
4.1.17 A21 issues received nearly 600 separate items of communication particularly focussed around Flimwell and Robertsbridge and the Pembury and Tonbridge bypasses. A21 road issues are no doubt compounded by the recognition of it being historically designated as one of the most dangerous busy road routes nationally (European Road Assessment Programme (EuroRAP) risk rating 2006-12). At the other
South Coast Central route-based strategy evidence report
54
extreme the A23 attracts relatively little by way of communication activity with only 185 recorded representations.
4.1.18 The information in Table 4.1 and included in the sections below was derived from the Stakeholder Event Reports, and from the Agency Road Users’ Satisfaction Survey (ARUSS) report for Area 4 (July 2013).
4.2 Operational challenges and opportunities
4.2.1 There are three themes that have emerged as the main operational challenges. The first is the slow speed of recovery from incidents, and the second is the impact of capacity constraints at key junctions. The third is concerned with the planning of development and supporting infrastructure along the A27.
4.2.2 The Agency Customer Feedback Report (1st Quarter 2013-14) notes that customers are telling the Agency that they like the fact that the Agency works closely with stakeholders and residents to minimise disruption during works, and that motorways are being clear of litter and debris. However, customers dislike the unreliability caused by unexpected delays on the network, and litter and debris left on verges.
4.2.3 The unreliability of travel along the corridor resulting from a long incident clearing times and level crossings on the A27 – also severely undermines accessibility and negatively impacts on the opportunities for jobs and business. It has been noted, however, that Network Rail has cited the two level crossing on the A259 (Star and Guldeford) east of Rye as two level crossings they would like to remove in conjunction with a road realignment scheme.
4.2.4 There is a need to provide support and greater engagement in relation to operational issues around the co-ordination of roadworks, event management and incident information.
4.2.5 The management of incidents is considered good but the recovery times are poor. This is of particular importance around Gatwick airport as anybody travelling there has a specific deadline to keep. Incidents may take a limited amount of time to resolved (e.g. 2 hours), but the resulting impact upon the rest of the network – in particular diversion routes – continues for much longer.
4.2.6 There is a need for better monitoring and communications with regards to diversions, with better info to drivers and management of incidents. The Agency, as well as the emergency services, has signed up for Collision, Lead, Evaluate, Act, Reopen (CLEAR). This initiative will provide data which will be used to improve incident management and traffic congestion.
4.2.7 The following opportunities were identified with regards to incident management:
Incident management using smart satnavs, VMS, CCTV, queue detection, Automatic Number Plate Recognition (ANPR), to collect and convey dynamic information.
South Coast Central route-based strategy evidence report
55
Incident management: better coordination between the Agency, satnav companies and local network management centres.
4.2.8 The A27 to the west of Brighton suffers from peak hour speed reductions around the Chichester bypass, and in the vicinity of Arundel and through Worthing. The single carriageway section through Worthing represents a significant bottleneck to in particular freight traffic. The A23 / M23 to the north of Brighton operates without major speed reductions with the road, but the junction of the A27 and A23 is nearing capacity and will be a future bottleneck.
4.2.9 To the east of Brighton there are significant sections of route which have lower speeds due to single carriageway and alignment. Peak hour speeds are lower than an average of 30mph occur on the A27 in the Polegate area and to the west of Hastings, it reduces to an average of less than 20mph. On the A21 speeds are lower to the north of Hastings and speeds drop to an average peak hour speed for less than 30mph on the section of road skirting to the north of Tunbridge Road.
4.2.10 To the east of Hastings on the A259 experiences minor localised speed reductions in built up areas such as at Rye, whilst the A2070 through to Ashford generally does not suffer from speed loss.
4.2.11 Stakeholders noted that it is very difficult for local authorities to commit to development and or CIL approaches (ie to deliver Local Plans) with so much uncertainty in funding of adequate infrastructure. It is also difficult to capture developer funding in this environment. Stakeholders emphasised that the Agency has to ensure its strategic planning reflected the built up nature of the A27 corridor and that the majority of planned development lies along the Route.
4.2.12 Further challenges identified include lorry parking, which is a problem throughout the route based on records of parking issues recorded by local authorities.
4.3 Asset condition challenges and opportunities
4.3.1 Evidence presented at the stakeholder workshops shows that much of the pavement is reaching end of life status and will need to be replaced during the period to 2021. Although the surfacing is reaching or exceeding its design life, it will not necessarily require treatment at this point. Many assets on the route are coming into need for essential works rather than low cost, minor repairs, and several structures – in particular on the A27 – should be considered for improvements.
4.3.2 The most pressing challenges are those associated with the lack of maintenance on the whole network. There are concerns as to how 80% of network (as indicated by the Agency data) will be replaced and its associated operational impacts. The speed of maintenance (e.g. the repair to strategic road signage) needs to be improved, and the Agency’s priorities for winter maintenance need to be made clear.
4.3.3 There is concern that capacity improvement works will throw additional traffic onto local roads, which the Agency can't influence. There is hence a need to map the planned growth effectively and to project the forecast

South Coast Central route-based strategy evidence report
56
network capacity requirements. There is a need for good communication and coordination between the Agency and TfL as both organisations are planning a large amount of maintenance works.
4.3.4 The Area Road User Satisfaction Survey (ARUSS) report noted that of the trunk roads included in Area 4, the A27 was mentioned most frequently by respondents as an area with issues of poor / bad patches of road surfacing, where the road surface was noisy, where they felt unsafe to some extent or more, and where they had seen some patches/large amounts of uncontrolled vegetation growth.
4.3.5 With the need for maintenance clearly set out above, which when delivered this is likely to result in significant periods of roadworks on this route. This will negatively impact on travel speeds and journey time reliability in the route, undermine accessibility and negatively impact on the opportunities for jobs and business investment in the route and for accessing employment opportunities elsewhere. The impact of this is further exacerbated by the lack of access to alternative diversionary routes.
4.4 Capacity challenges and opportunities
4.4.1 The route normally experiences capacity issues every day during peak periods. Evidence presented to the stakeholders was confirmed as correct from feedback received at and after the events. The traffic figures on roads in this route are lower than in much of the rest of the Highways Agency SRN. Consequently the road network suffers from limited investment, as the investment decision-criteria are influenced by the traffic demand affected by interventions.
4.4.2 This route is important for accessing the rest of the SRN and the markets which exist throughout the rest of the country, and for linking the ports and airports in the area to these markets. The conflict between this and local traffic is further exacerbated by the lack of capacity on the local road network. In combination this reduces the journey time reliability on the SRN.
4.4.3 Trying to accommodate growth was also highlighted as a capacity challenge for growth areas on or near the route. Stakeholders felt that without additional capacity being provided it will become increasingly difficult to deliver employment growth as many activities rely on the strategic road network to move goods in and out efficiently. Without good access, development sites will not be attractive to developers.
4.4.4 The main capacity challenges identified by the stakeholders are:
Sections of the A21, A259 and A27 are seen by stakeholders as not “fit for purpose” as a part of the strategic road network. Under congested conditions, or due to incidents, traffic reroutes onto local roads (e.g. between Littlehampton and Chichester the A259 is acting as an alternative strategic route due to congestion on the A27). This raises the concern that the SRN is not fulfilling its function for the majority of the time.

South Coast Central route-based strategy evidence report
57
The SRN tends to perform a local traffic function, which undermines its capacity and ability to provide for more strategic traffic movements. However the main congestion difficulties are caused by a conflict between through traffic and trips with at least one local trip end, exacerbated by the inadequate capacity of the existing junctions. The majority of all traffic has at least one distant trip end. In terms of fitness for purpose the following issues are cited o Journey time reliability is important for business in terms of
the movement of people and goods o Catering for loger distance traffic o Accommodating future growth identified in the Local Plans
and Strategic Economic Plans o Resilience to incidents
The discontinuous standard of the road (in places reducing from dual to single carriageway), considerably reduces capacity and results in poor journey time reliability for users. This challenge is exacerbated by bottlenecks at key locations in the network.
There are constraints to infrastructure development resulting from the close proximity to sensitive environmental designations (e.g. the South Downs National Park). However, the South Downs Board recognises that improvements to the route where appropriate would also bring more visitors to the Park.
The lack of certainty and clear information regarding the planned improvements to the A27 and other sections of the SRN.
Concerns at evidence showing that journey times would not be improved if the link between Polegate and Beddingham was dualled (traffic already queued at Falmer and Kingston which isn't caused by single carriageway at Beddingham).
Concern that the failure in delivery of Chichester Bypass improvements to date severely constrains opportunities for development and investment around Chichester and Bognor Regis and constrains access to and from the Manhood Peninsula.
4.4.5 The key opportunity identified is that the A27 corridor, in particular, offers the scope for improved accessibility both to the strategic road network and wider employment opportunities (via the Gatwick Diamond). The relief of congestion on the A23 would allow more freight to divert to the LEP priority ports of Newhaven and Shoreham. Also improving congestion would improve the prospects of the poorly performing coastal areas by increasing attractiveness to inward investment.
4.4.6 Generally the rail network in the area is good standard, and the opportunity is there to harness the Brighton mainline as a key component of transport in the RBS. However the West Coastway and Arun Valley suffer by comparison with many people using road corridor
South Coast Central route-based strategy evidence report
58
alternatives. Therefore supporting the rail line and improving rail capacity would provide some relief of parallel road routes.
4.5 Safety challenges and opportunities
4.5.1 Evidence collated for the stakeholder events showed that there are locations on the route and junctions which have accident rates above the national average for the type of road in question and a number of locations are near the top of the national ranking of all sites on the SRN for casualties.
4.5.2 Evidence shows the A27 and the A21 to be the worst performing roads in terms of KSIscollisions, and in terms of slight casualty collisions. The A23 also performs poorly in terms of slight casualties. The A21 between A229 and Hastings has been identified as one of the highest risk roads in the UK in terms of road safety.
4.5.3 Stakeholders identified the main safety challenges as being the discontinuous standard of the road (in places reducing from dual to poor quality single carriageway) which results in safety issues. There is a lack of alternative routes for NMUs (e.g. equestrian crossings along the A2070), resulting in potential conflicts with vehicles, and severance impacts through urban areas, particularly by heavy goods vehicles travelling through small villages. The environmental nature of the RBS limits the ability to invest in improved lighting and signing and segregated paths for pedestrians and cyclists.
4.5.4 Stakeholders identified the opportunities to improve safety as being improved communication to travellers, a review of NMU hotspots, driver / cyclist training, and a more strategic approach to safety –understanding why collisions happen rather than focussing on operational issues; applying alternative technologies (e.g. average speed cameras) with these better advertised on the network.
4.6 Social and environmental challenges and opportunities
4.6.1 The route encompasses roads which have a vastly differing function and operational requirements. In some instances it is a single carriageway route operating through very rural areas, such as with the A259 to the east of Hastings, where at the other extreme, on the A23 it is dual carriageway 3-lane road which effectively provides users a motorway standard experience.
4.6.2 The route also includes a range of high level designations and sensitive environmental sites which, relative to its operational functions, will often mean the route is severely constrained in terms of the scope for providing additional capacity or for developing schemes which address localised congestion safety and reliability issues. On the A27 in particular the close proximity of the road to the South Downs National Park will often be a limitation in terms of future upgrades to the network, with similar issues also existing on the A21. In addition the poorly performing A27 leads to rat-running on less appropriate alternative routes through the National Park.

South Coast Central route-based strategy evidence report
59
4.6.3 The attractive nature of the environment is however one of the route’s major benefits, making it a desirable place for people to live and access the attractive environment, and for businesses to invest. This dual role, however, inevitably exacerbates the severance impacts of the roads and encourages an over-reliance on the route to perform a local access function, reducing the accessibility to non-motorised users. It is, however, possible that continuing improvements to technology could help to facilitate increased working away from the office and this might reduce the need to drive during peak periods or at all on certain days.
4.6.4 The highest priority challenge that the stakeholders identified is the need to recognise the essential role of transport in regeneration. Housing delivery is particularly constrained in this route - many developments associated with the growth of these towns are often dependant on agreements being granted around supporting infrastructure delivery, often in the form of roads investment. If infrastructure fails to materialise then development is stifled. Frustration was expressed that the Agency’s decision-making and investment decisions seems to be marred in process, with too many systems which seem to hold things up.
4.6.5 The stakeholders identified a number of further challenges:
The lack of alternative routes for NMUs.
The need for more NMU crossings along the whole length of the SRN in this route, and a reduction in residential community severance (e.g. at Wilmington and Selmeston). There are also limited access points to the National Park from the Manhood Peninsula and from the Manhood Peninsula onto the A27. The A27 represents a barrier to Public Rights of Way. Equestrian crossings are needed, including along the A2070 and at M20 junction10a.
The need for segregated paths for pedestrians and cyclists - cycle routes should be provided off-line rather than on-line as a facility on the carriageway or adjacent to busy roads is not desired. However routes in more pleasant locations away from the carriageway would be the responsibility of the County. There are also missing links and gaps in the National Cycle Network.
Limitations to investment in improved lighting and signing.
Concerns around noise and air quality. There is a single air quality management area (AQMA) at Grove Lodge roundabout in Worthing at present, but stakeholders expressed a desire for noise, air quality and lighting to be reviewed.
4.6.6 The stakeholders identified the following opportunities:
Improved communication to travellers as a priority.
Travel Demand Management
ITS (Intelligent Transport Systems), and IT technology in general, with a need for it to be co-ordinated around local, national and
South Coast Central route-based strategy evidence report
60
European systems. There are currently too many specifications. There needs to be a common standard between Local Authorities and Agency.
4.6.7 From the Agency Customer Feedback Report, customers are telling the Agency that they like that the Agency works closely with stakeholders and residents to minimise disruption during works, uses local exhibitions to explain proposals, responds to complaints and questions, and manages roadside verges in an environmentally sensitive manner. Customers are concerned that trees are removed during improvement works.
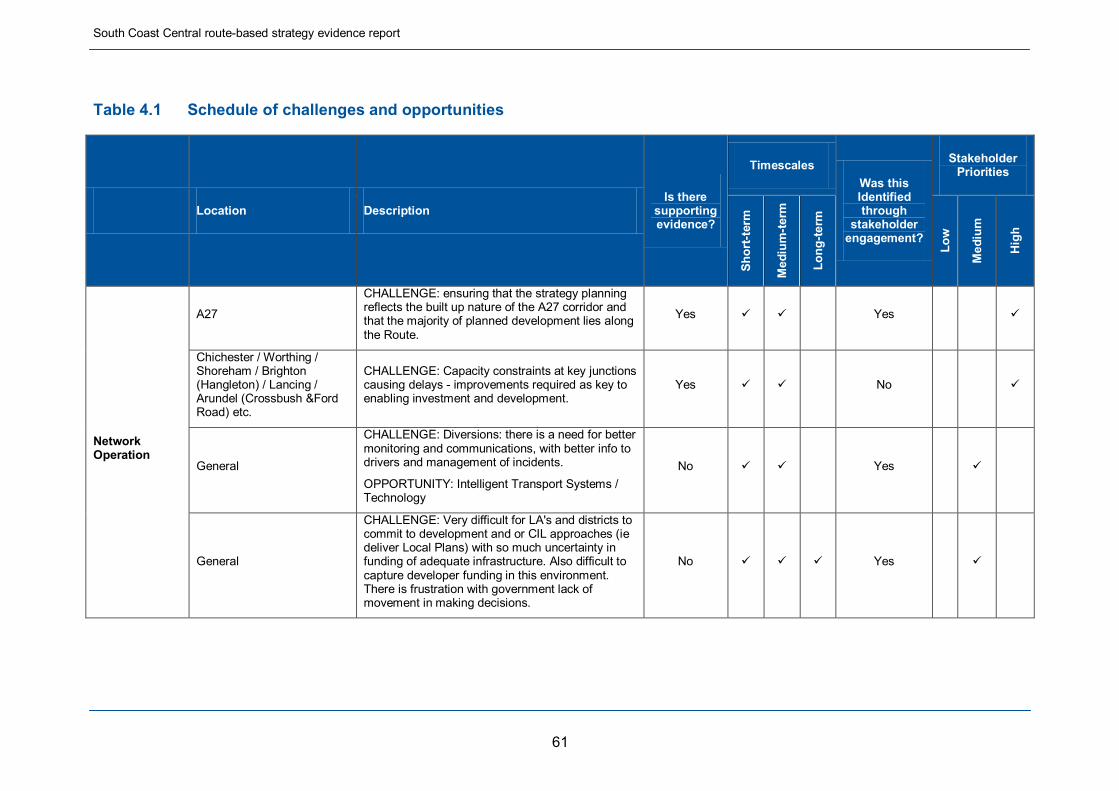
South Coast Central route-based strategy evidence report
61
Table 4.1 Schedule of challenges and opportunities
Location Description Is there
supporting evidence?
Timescales Was this Identified through
stakeholder engagement?
Stakeholder Priorities
Shor
t-ter
m
Med
ium
-term
Long
-term
Low
Med
ium
Hig
h
Network Operation
A27
CHALLENGE: ensuring that the strategy planning reflects the built up nature of the A27 corridor and that the majority of planned development lies along the Route.
Yes Yes
Chichester / Worthing / Shoreham / Brighton (Hangleton) / Lancing / Arundel (Crossbush &Ford Road) etc.
CHALLENGE: Capacity constraints at key junctions causing delays - improvements required as key to enabling investment and development.
Yes No
General
CHALLENGE: Diversions: there is a need for better monitoring and communications, with better info to drivers and management of incidents.
OPPORTUNITY: Intelligent Transport Systems / Technology
No Yes
General
CHALLENGE: Very difficult for LA's and districts to commit to development and or CIL approaches (ie deliver Local Plans) with so much uncertainty in funding of adequate infrastructure. Also difficult to capture developer funding in this environment. There is frustration with government lack of movement in making decisions.
No Yes

South Coast Central route-based strategy evidence report
62
Location Description Is there
supporting evidence?
Timescales Was this Identified through
stakeholder engagement?
Stakeholder Priorities
Shor
t-ter
m
Med
ium
-term
Long
-term
Low
Med
ium
Hig
h
General
(This is of particular importance around Gatwick as anybody travelling there has a specific deadline to keep.)
CHALLENGE: the management of an incident is good, but the recovery times are bad.
Incident clear-up times need to be improved, for both police-led incidents and non-police-led incidents.
OPPORTUNITY: Communication and technology applied for incident management.
Yes Yes
Asset Condition
General CHALLENGE: the speed of repair to the asset (e.g. strategic road signage) needs to be improved. No Yes
General CHALLENGE: General landscape maintenance and litter pickup is poor, and causes a safety issue. Partial Yes
General Capacity improvement works throw additional traffic onto local roads, which have limited capacity and over which the Agency do not have authority.
No Yes
A21 / A27
The ARUSS identified the A21 and A27 as having sections where with bad patches of road surfacing, noisy surfacing, debris on the road, overgrown vegetation/grass and uncollected litter (multiple locations identified).
Partial No
Capacity
A27 / A23
CHALLENGE: Freight - the development of Newhaven and Shoreham is a priority for the LEP.
A key to this is the upgrading of a section of road linking Newhaven to the A23.
Yes Yes
General CHALLENGE: Ensure that all planned growth is considered in planning mitigation and infrastructure.
No Yes

South Coast Central route-based strategy evidence report
63
Location Description Is there
supporting evidence?
Timescales Was this Identified through
stakeholder engagement?
Stakeholder Priorities
Shor
t-ter
m
Med
ium
-term
Long
-term
Low
Med
ium
Hig
h
A27 notably at Arundel and Worthing / Lancing.
CHALLENGE: the discontinuous standard of the road (in places reducing from dual to single carriageway), considerably reduces capacity and results in poor journey time and journey time reliability for users.
Yes Yes
Chichester / Worthing / Arundel (Crossbush & Ford road) / Shoreham / Brighton (Hangleton) etc.
CHALLENGE: Capacity constraints at key junctions causing delays - improvements required as key to enabling investment and development.
Yes Yes
Brighton/Burgess Hill - A2300/A272
Newhaven A26/A27
Bognor/Chichester A27/A259
CHALLENGE: Support locations for job growth: a multi-modal understanding is required (especially road/rail), with the provision of strategic and local road network to support. Locations include:
Yes Yes
Brighton mainline
OPPORTUNITY: The rail network in the route is great, and the Brighton mainline is key to this. Supporting the rail line and improving rail capacity would therefore relieve the roads.
No Yes
A21 / A27
CHALLENGE: The ARUSS report identified the A21 (Vauxhaull Rbt/Knights Park/Pembury single lane sections) and A27 (multiple sections) where drivers were delayed by congestion.
Partial No

South Coast Central route-based strategy evidence report
64
Location Description Is there
supporting evidence?
Timescales Was this Identified through
stakeholder engagement?
Stakeholder Priorities
Shor
t-ter
m
Med
ium
-term
Long
-term
Low
Med
ium
Hig
h
Safety
General
OPPORTUNITY: safety needs a more strategic approach.
- need to understand why accidents / incidents happen rather than focus on operational issues.
- Consider different solutions e.g. average speed cameras.
Partial Yes
General OPPORTUNITY: review of NMU hotspots re safety. Yes Yes
General CHALLENGE: NMU Crossings represent a safety concern. No Yes
General
CHALLENGE: the ARUSS report identified the A21 and A27 as having sections where drivers felt unsafe (multiple locations identified). The A21 is one of the highest risk roads in the UK.
Partial No
Social and environment
General OPPORTUNITY: Needs to also be a focus on Travel Demand Management and the benefits this can have for the Agency network.
No Yes
General CHALLENGE: Noise/Air Quality/Lighting to be reviewed and improved. No Yes
General CHALLENGE: The role of transport in regeneration is essential to recognise. Housing delivery is particularly constrained in this route.
No Yes

South Coast Central route-based strategy evidence report
65
Location Description Is there
supporting evidence?
Timescales Was this Identified through
stakeholder engagement?
Stakeholder Priorities
Shor
t-ter
m
Med
ium
-term
Long
-term
Low
Med
ium
Hig
h
A27 (west)
CHALLENGE: Severance effects of the A27 are pronounced and impact on NMUs is considerable.
There are also limited access points from the National Park and other areas e.g. the Manhood peninsula onto the A27.
It is a barrier to Public Rights of Way.
Partial Yes
Other
General OPPORTUNITY: Journey planning and innovation regarding the use of P&R sites for overnight lorry parking.
No Yes
A27
CHALLENGE: Difficult and unrealistic to expect co-ordination between WSCC and ESCC on agreed A27 corridor upgrades. There is an underlying concern that the Agency is predominantly focussed on just the through route road function rather than local objectives.
No Yes
A27
CHALLENGE: Concerns raised that not all the existing development/built area along the A27 was being considered whilst planned development was being concentrated on this corridor.
Partial Yes

South Coast Central route-based strategy evidence report
66
4.7 Conclusion
4.7.1 The evidence compiled about the route has shown that whilst the RBS sits in the economically active SE region, the coastal belt of the RBS in particular contains some of the most deprived areas in the UK in terms of multiple deprivation indices. The route as a whole is also subject to considerable development pressures both in terms of housing and in terms of future employment sites. Many stakeholders have argued for a route that is “fit for purpose” for the local economy, provides the capacity for planned new development and provides essential links to the rest of the country.
4.7.2 The A27/A259 route is strategically important in linking a number of towns, such as Chichester, Worthing, Arundel, Eastbourne and Hastings along the south coast, and ultimately in providing the businesses and residents of these towns access to the wider strategic road network.
4.7.3 The focal points for economic growth are on the section of the A27 between junction 5 of the A3 and Brighton, between Brighton and M23 junction 9, the section of the A27, A26 and A259 between Brighton and Hastings, between Hastings and Sevenoaks on the A21 and on the A259 and A2070 between Hastings and Ashford. The expansion of Gatwick Airport to include another runway would also have a significant impact upon this route. The Gatwick Diamond area located between London and Brighton and centred on Gatwick Airport, is defined by a vision for significant economic development.
4.7.4 It is unlikely that the committed and pipeline schemes will have tackled the anticipated capacity problems that can be expected for the route before 2021. The growth areas will place further pressure on the network increasing the levels of local traffic demand seeking to access the network. Further challenges include the sensitive designations in many parts of the RBS, and the desire to make provision for NMUs and to deal with the severance and safety issues which exist on a number of sections of this route
4.7.5 The pipeline schemes identified represent only a limited number of schemes, and these only address a few key existing issues on the network, and do not provide for other bottlenecks on the network or for the future growth in housing and jobs. Areas which are expected to have current and further challenges, but no schemes include for example Worthing, Adur, Lewes District and Wealden.Stakeholder feedback has identified the prioritised need for incidents to be cleared up quicker, for better communication to drivers and for the application of uniform standards of technology for communication. The evidence suggests a need for regular and belated maintenance activities over the next 5 years. Resurfacing and structural renewals will be a challenge along the route, with much of the surfacing needing to be replacing in the next five years. The key maintenance challenges in this RBS pertain to the poor asset condition of the A21 and A27.
4.7.6 The A23 and A2070 east of Hastings are performing reasonably well, and the planned work on the A23 between Handcross and Warninglid
South Coast Central route-based strategy evidence report
67
will add further capacity and safety improvement. However, this will not help to accommodate some of the substantial developments planned in the districts along the A27. Along the A27 (Worthing/Lancing, Shoreham, Brighton), Lewes to Polegate), A259 (East of Hastings), and A21(south of Tonbridge) wider capacity and/or safety issues, and environmental constraints are still major challenges to overcome.
4.7.7 The evidence collation leads us to conclude that the most challenging locations will be:
Chichester – The bypass of the city and its roundabouts experience significant conflict between the combined volumes of both long distance and local local traffic movements(particularly for north-south traffic). Many of these junctions are closely spaced and at capacity. The safety record of the bypass is poor.
Worthing and Arundel – the A27 heading west from east of Brighton is predominantly “dual two” carriageway, but with single carriageway sections at Worthing and Arundel. The resultant reduction in capacity creates significant congestion and safety issues in both towns particularly for peak hour traffic. This is exacerbated by the lack of alternative diversionary routes.
The A23/A27 junction - is problematic with delays due to junction layout for almost all movements.
Southwick Hill tunnel – the approaches to Southwick Hill tunnel present collision and safety problems.
A21 between A229 and Hastings – this part of the SRN in the route has previously been ranked as one of the worst roads in Britain based on safety and accident statistics for 2006 - 2010.
A27 between Lewes and Polegate has lower speeds and a poor safety record
The A259 east of Hastings has lower speeds and a poor accident record but the A21 Link Road (under construction) may help to reduce these
A27/A259 west of Hastings there are two locatios ranked 35th and 41st in the top 250 casuaty locations along this section. Also the whole A27 between Hastings and Chichester is within the top 20% of total casualties per billion vehicle miles.
4.7.8 The stakeholders that attended our events told us that the areas of greatest concern to stakeholders were the recovery time from incidents, the discontinuous standard of the road (in places reducing from dual to single carriageway), capacity constraints at key junctions (in particular Worthing, Chichester Arundel, and Polegate), the need to support locations for strategic job growth and a road safety review of NMU hotspots.
4.7.9 Stakeholders highlighted that the rail network in the area is good in part, with the Brighton mainline of good standard and; the Arun Valley/West
South Coast Central route-based strategy evidence report
68
Coastway are poor.They suggested that supporting the rail line and improving rail capacity would also relieve the road network.
4.7.10 On the other hand, there are a number of improvements that could be made to the route that we think should be priorities, but were not necessarily highlighted by stakeholders. These include the repair and replacement of the road surfacing. Another issue which was not prioritised is that despite being the main east-west corridor (linking the Kent ports to the Solent), the A27 / A259 and A2970 route is not adequate for HGV/freight traffic.
4.7.11 The role of the route is also the subject of differing opinions as evidenced by the stakeholder feedback: the lack of east-west connectivity was identified as an issue whilst there was also a desire for the SRN to serve local traffic and better manage conflicts between the combined volumes of both local and long distance traffic at key locations, providing access to planned development. At the same time, there is an expectation for non-motorised users to be able to easily and safely cross the A27 and A21.
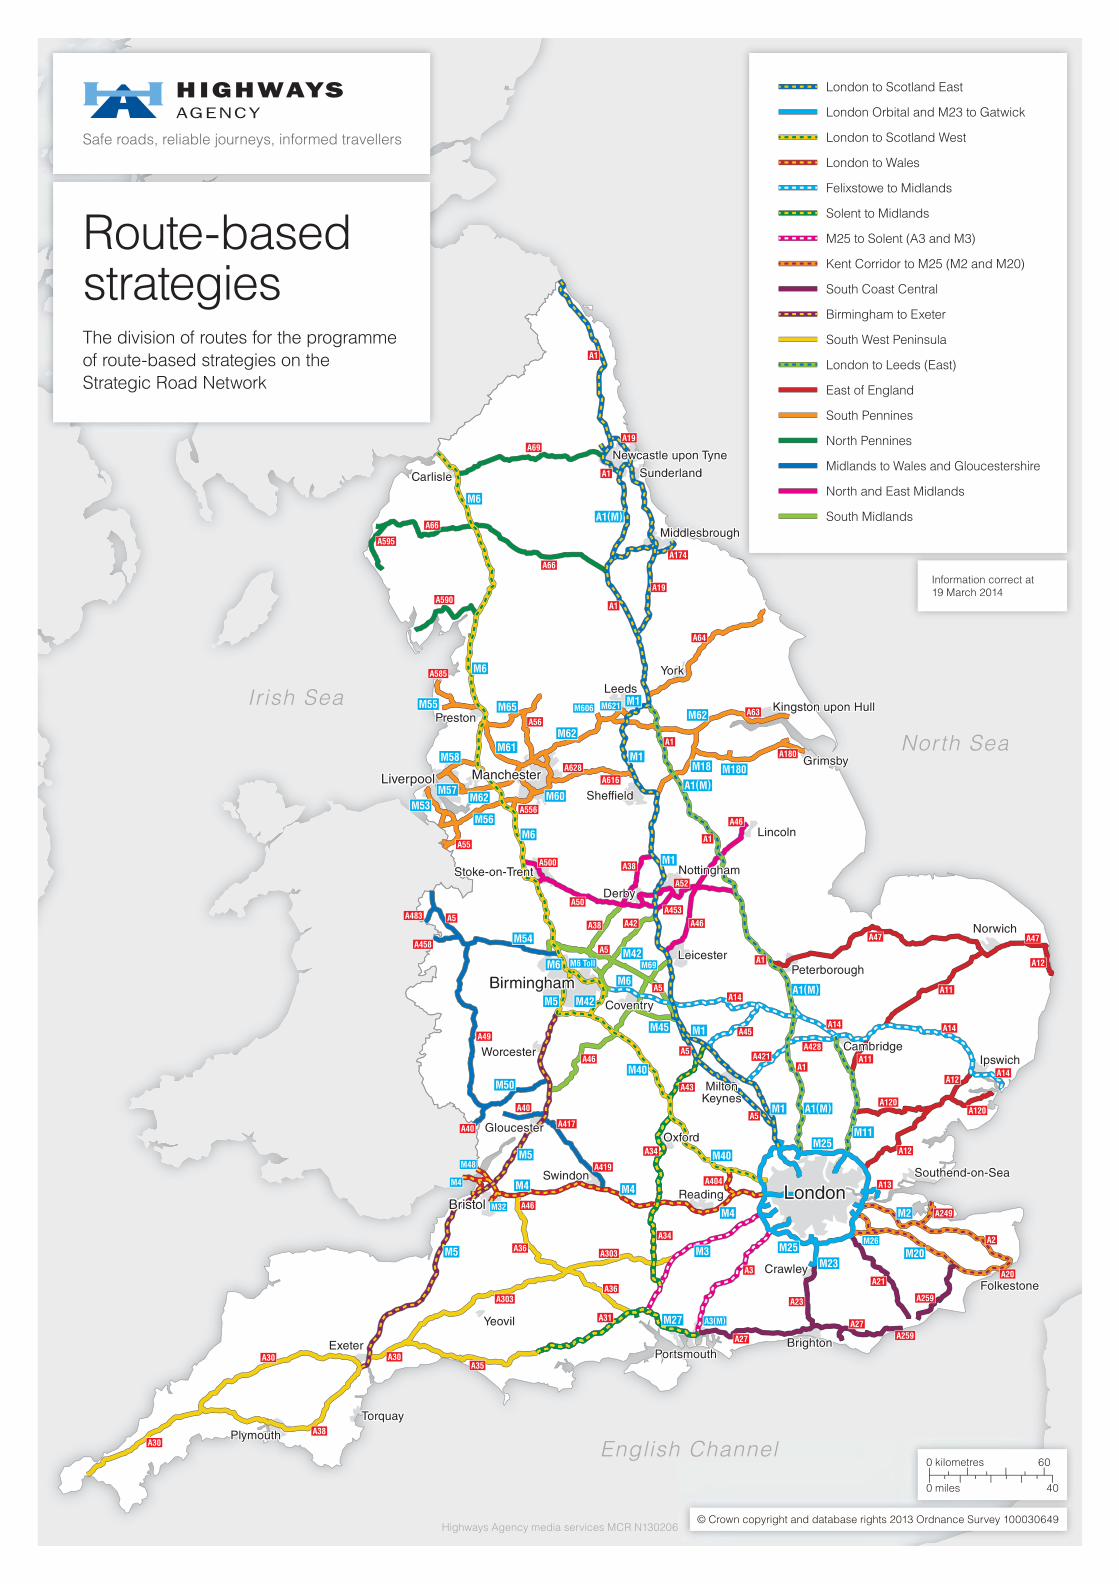
Irish Sea
North Sea
English Channel
Irish Sea
North Sea
Englishh Channel
© Crown copyright and database rights 2013 Ordnance Survey 100030649
0 kilometres 60
0 miles 40
Highways Agency media services MCR N130206
London to Scotland East
London Orbital and M23 to Gatwick
London to Scotland West
London to Wales
Felixstowe to Midlands
Solent to Midlands
M25 to Solent (A3 and M3)
Kent Corridor to M25 (M2 and M20)
South Coast Central
Birmingham to Exeter
South West Peninsula
London to Leeds (East)
East of England
South Pennines
North Pennines
Midlands to Wales and Gloucestershire
North and East Midlands
South Midlands
Information correct at19 March 2014
Route-basedstrategiesThe division of routes for the programmeof route-based strategies on theStrategic Road Network
M60
M62
M62
M62
M18
M61
M65
M58
M57
M55
M56M53
M54
M50
M48
M32
M42
M42M69
M11M25
M25
M27
M20M23
M26
M40
M40
M45
M606 M621
M6
M6
M6
M6M6
M5
M5
M5
M1
M1
M1
M1
M2
M3
M4
M4M4M4
M1
A585
A556
A500
A483
A458
A453
M6 Toll
A628A616
A180
A590
A174
A595
A66
A66
A64
A63A56
A55
A49
A40
A40
A46
A46
A47 A47
A12
A11
A11
A12
A12
A13
A21
A23A36
A31
A35A30A30
A30A38
A36
A46
A27
A27
A20
A14A14A45
A43
A34
A34
A14
A14
A46
A50
A52
A38
A38
A42
A69A19
A19
A1
A1
A1
A1
A1
A1
A1
A2
A5
A5
A5
A5
A5
A3
A421
A120A120
A249
A404
A303
A303
A419
A417
A259
A259
A428
A1(M)
A1(M)
A1(M)
A1(M)
A3(M)
M180
LondonLondon
BirminghamBirminghamBirmingham
ManchesterManchesterManchesterLiverpoolLiverpool
BristolBristol
PrestonPrestonPreston
CarlisleCarlisleCarlisle
Newcastle upon TyneNewcastle upon TyneNewcastle upon Tyne
SunderlandSunderlandSunderland
MiddlesbroughMiddlesbroughMiddlesbrough
SheffieldSheffieldSheffield
Stoke-on-TrentStoke-on-TrentStoke-on-Trent
LeicesterLeicesterLeicester
DerbyDerbyDerby
NottinghamNottinghamNottingham
PeterboroughPeterboroughPeterborough
Southend-on-SeaSouthend-on-SeaSouthend-on-Sea
FolkestoneFolkestoneFolkestone
BrightonBrightonBrightonPortsmouthPortsmouthPortsmouth
YeovilYeovilYeovil
TorquayTorquayTorquay
PlymouthPlymouthPlymouth
ExeterExeterExeter
CrawleyCrawleyCrawley
CambridgeCambridgeCambridge
MiltonKeynesMilton
KeynesMilton
Keynes
CoventryCoventryCoventry
GloucesterGloucesterGloucester
WorcesterWorcesterWorcester
OxfordOxfordOxford
SwindonSwindonSwindon
ReadingReadingReading
LincolnLincolnLincoln
NorwichNorwichNorwich
IpswichIpswichIpswich
LeedsLeedsLeeds
YorkYorkYork
Kingston upon HullKingston upon HullKingston upon Hull
GrimsbyGrimsbyGrimsby

South Coast Central route-based strategy evidence report
71
Appendix B Glossary
Abbreviation Description
AADT
AONB
AQMA
ARUSS
CCTV
CIL
DBFO
DfT
ERT
ESCC
EU
Geotechnical Assets
HA
HAIL
HGV
HRA
ITS
KSI
LEP
LNR
London Orbital
M&E
MIDAS
MM
NMU
NNR
NTOC
NVRS
OS
Ramsar
RBS
Route
SAC
Section
Annual Average Daily Traffic
Area of Outstanding Natural Beauty
Air Quality Management Area
Area Road Users Satisfaction Survey
Closed Circuit Television
Community Infrastructure Levy
Design, Build, Finance and Operate
Department for Transport
Emergency Response Teams
East Sussex County Council
European Union
Geotechnical assets include cuttings and embankments, and incorporate a diverse range of natural geological strata and manmade materials
Highways Agency (“the Agency”)
Highways Agency Information Line
Heavy Goods Vehicle
Hot Rolled Asphalt
Intelligent Information Systems
Killed or Seriously Injured
Local Enterprise Partnership
Local Nature Reserve
This means the M25 and the A282 Dartford crossings
Mechanical and Electrical
Motorway Incident and Detection System
Managed Motorways
Non-Motorised User
National Nature Reserve
National Traffic Operation Centre
National Vehicle Recovery Service
Ordnance Survey
Ramsar sites are wetlands of international importance, designated under the Ramsar Convention
Route Based Strategy
This means the South Coast Central RBS, including the area as shown in Figure 1.
Special Area of Conservation
This means a part of the route

South Coast Central route-based strategy evidence report
72
SELEP
SPA
SRN
SSSI
STO
TEN-T
TLRN
TMD
TOS
TSCS
UK
VMS
WSCC
South East Local Enterprise Partnership
Special Area of Protection
Strategic Road Network (all roads under Agency management)
Site of Special Scientific Interest
Strategic Traffic Operations
Trans-European Transport Network
Transport for London Road Network
Traffic Management Directorate
Traffic Officer Service
Thin Surface Course System
United Kingdom
Variable Message Signs
West Sussex County Council
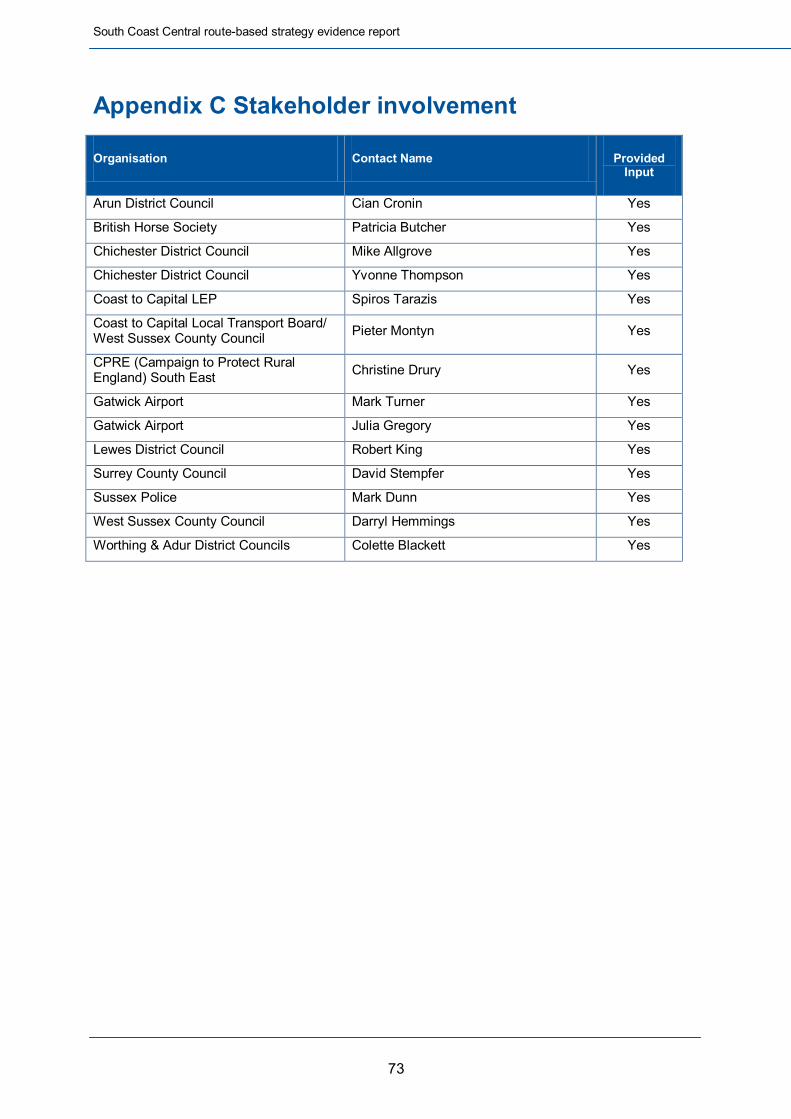
South Coast Central route-based strategy evidence report
73
Appendix C Stakeholder involvement
Organisation Contact Name Provided Input
Arun District Council Cian Cronin Yes
British Horse Society Patricia Butcher Yes
Chichester District Council Mike Allgrove Yes
Chichester District Council Yvonne Thompson Yes
Coast to Capital LEP Spiros Tarazis Yes
Coast to Capital Local Transport Board/ West Sussex County Council Pieter Montyn Yes
CPRE (Campaign to Protect Rural England) South East Christine Drury Yes
Gatwick Airport Mark Turner Yes
Gatwick Airport Julia Gregory Yes
Lewes District Council Robert King Yes
Surrey County Council David Stempfer Yes
Sussex Police Mark Dunn Yes
West Sussex County Council Darryl Hemmings Yes
Worthing & Adur District Councils Colette Blackett Yes

© Crown copyright 2014. You may re-use this information (not including logos) free of charge in any format ormedium, under the terms of the Open Government Licence. To view this licence:visit http://www.nationalarchives.gov.uk/doc/open-government-licence/
write to the Information Policy Team, The National Archives, Kew, London TW9 4DU,or email [email protected].
This document is also available on our website at www.highways.gov.uk
If you have any enquiries about this document [email protected] or call 0300 123 5000*.Please quote the Highways Agency publications code PR172/13* Calls to 03 num bers cost no more than a national rate call to an 01 or 02 num ber and must count towards any inclu sive min utes in the same way as 01 and 02 calls. These rules apply to calls from any type of line includ ing mobile, BT, other fi xed line or payphone. Calls may be recorded or monitored.
Highways Agency media services Dorking Job number S130643
If you need help using this or any other Highways Agency information, please call 0300 123 5000* and we will assist you.