south florida regional transportation authority (sfrta...
TRANSCRIPT

SOUTH FLORIDA REGIONAL TRANSPORTATION AUTHORITY (SFRTA) WAVE MODERN STREETCAR – PHASE 1C
BROWARD COUNTY, FLORIDA
GEOTECHNICAL REPORT FOR PRELIMINARY ENGINEERING
PREPARED FOR: HDR ENGINEERING, INC.
PREPARED BY: GEOSOL, INC.
FEBRUARY 5, 2015


TABLE OF CONTENTS
ITEM PAGE 1.0 INTRODUCTION AND PROJECT INFORMATION ................................................................................ 1
1.1 GENERAL ....................................................................................................................................................... 1 1.2 PROJECT APPROACH ...................................................................................................................................... 1
2.0 SCOPE OF SERVICES ................................................................................................................................... 2
3.0 FIELD EXPLORATION ................................................................................................................................. 3
3.1 GENERAL ....................................................................................................................................................... 3 3.2 FIELD TEST LOCATIONS ................................................................................................................................ 3 3.3 SITE CONDITIONS .......................................................................................................................................... 3 3.4 STANDARD PENETRATION TEST (SPT) BORINGS .......................................................................................... 4 3.5 WATER LEVEL MEASUREMENTS ................................................................................................................... 4 3.6 IN-SITU SOIL RESISTIVITY TESTING .............................................................................................................. 4
4.0 LABORATORY TESTING ............................................................................................................................ 5
4.1 GENERAL ....................................................................................................................................................... 5 4.2 GRAIN-SIZE ANALYSIS .................................................................................................................................. 5 4.3 MOISTURE CONTENT ..................................................................................................................................... 6 4.4 ORGANIC CONTENT ....................................................................................................................................... 6 4.5 ENVIRONMENTAL CLASSIFICATION .............................................................................................................. 6
5.0 GENERALIZED SUBSURFACE CONDITIONS ........................................................................................ 7
5.1 BROWARD COUNTY REGIONAL GEOLOGY .................................................................................................... 7 5.2 BROWARD COUNTY SOIL SURVEY ................................................................................................................ 7
6.0 SITE SUBSURFACE AND GROUNDWATER CONDITIONS ................................................................. 8
6.1 GENERAL ....................................................................................................................................................... 8 6.2 GROUNDWATER CONDITIONS ....................................................................................................................... 9 6.3 ESTIMATED SEASONAL HIGH WATER LEVEL ............................................................................................... 9
7.0 ENGINEERING EVALUATIONS AND RECOMMENDATIONS FOR THE PROPOSED STREETCAR TRACK BED DESIGN ............................................................................................................... 10
7.1 GENERAL ..................................................................................................................................................... 10 7.2 SITE PREPARATION ...................................................................................................................................... 10 7.3 FILL MATERIAL ........................................................................................................................................... 11
8.0 CONSTRUCTION CONSIDERATIONS .................................................................................................... 11
8.1 GENERAL CONSTRUCTION RECOMMENDATIONS ........................................................................................ 11 8.2 GROUNDWATER CONTROL .......................................................................................................................... 11
9.0 FHWA REPORT CHECKLIST ................................................................................................................... 11
10.0 REPORT LIMITATIONS ........................................................................................................................... 12

TABLE OF CONTENTS (CONTINUED) APPENDICIES
Appendix “A” Sheet 1 – Site Vicinity Map Sheet 2 – USDA Soils Survey Map
Table 1 – Summary of Field Test Locations Sheet 3 – Test Location Plan Sheet 4 – Soil Profiles Sheet 5 – Roadway Soils Survey Sheet
Appendix “B” Table 2 – Summary of Laboratory Test Results (Soil Samples) Table 3 – Summary of Environmental Classification Test Results Moisture Content Test Results Percent Passing the No. 200 Sieve Test Results Grain-Size Analysis Results and Curves Organic Content Test Results Environmental Classification Test Results Appendix “C” Table 4 – Summary of In-Situ Soil Resistivity Testing Results In-Situ Soil Resistivity Test Schematics Typical Site Photograph Appendix “D” FHWA Checklist

Geotechnical Report for Preliminary Engineering 1 SFRTA Wave Modern Streetcar – Phase 1C Broward County, Florida GEOSOL Project No. 214197
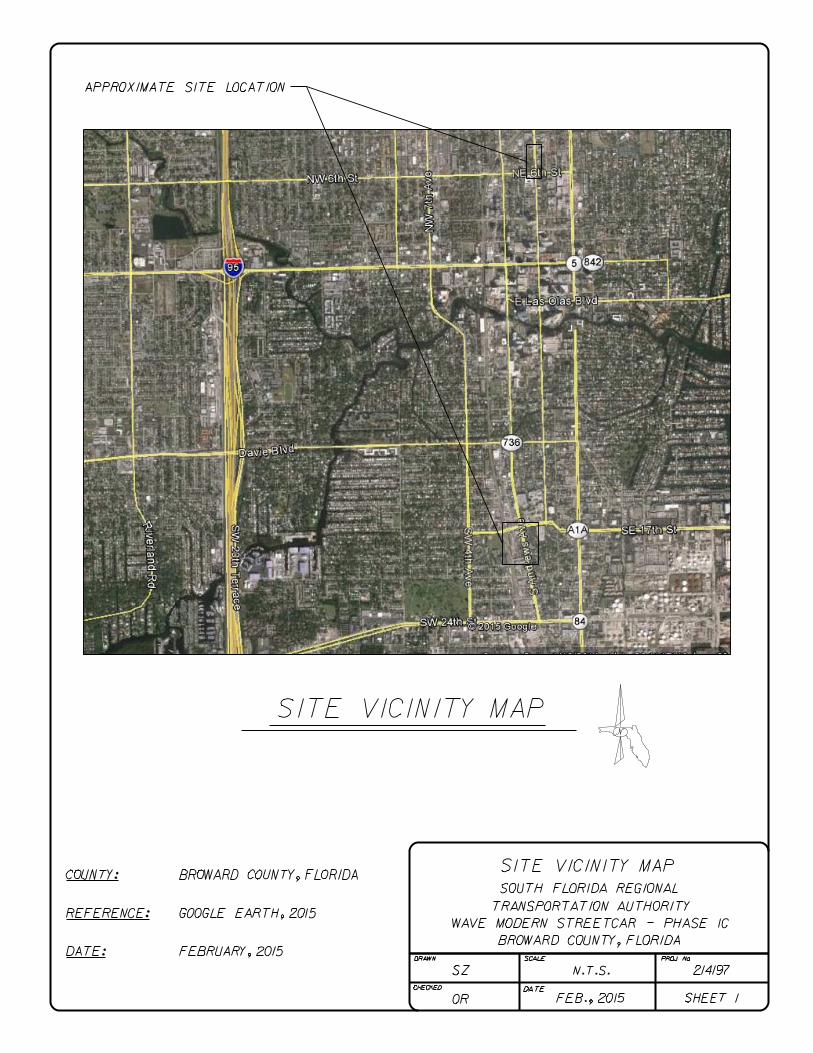
1.0 INTRODUCTION AND PROJECT INFORMATION 1.1 General This project will involve the design and construction of a 2.7-mile long modern electric streetcar, known as the Wave, which will operate in part via overhead electrical wires in some areas and by battery power in others, in the City of Fort Lauderdale, in Broward County, Florida. The streetcar system will be designed to move people in and around downtown and serve as a circular/distributor system, with connections to regional bus and rail systems in the City of Fort Lauderdale, in Broward County, Florida. As we understand it, Phase 1C of this project will include the design and construction of approximately 1,425-foot long track running. One portion of Phase 1C is to the south of Phase 1B and covers S. Andrews Avenue from SE 17th Street to SE 18th Street, and along SW 18th Street from S. Andrews Avenue to SW 1st Avenue. The other portion of Phase 1C is to the north of Phase 1B and covers NE 3rd Avenue from NE 6th Street to NE 7th Street in the city of Fort Lauderdale, in Broward County, Florida. As requested on September 5, 2014, the geotechnical services for this phase of the project were limited to the performance of a geotechnical investigation, as well as an in-situ soil resistivity testing program for Phase 1C of the project along the previously described 1,425-foot track that is part of the proposed streetcar track alignment based on the information that you provided to us on September 2, 2014. GEOSOL previously prepared and submitted a Geotechnical Report for Preliminary Engineering and a Data Report for In-Situ Soil Resistivity Testing Results dated November 20, 2013 for the 1.4-mile long loop that is part of Phase 1A of this project. Also, GEOSOL previously prepared and submitted a Geotechnical Report for Preliminary Engineering dated June 10, 2014 and a Supplemental Geotechnical Report for Preliminary Engineering dated January 16, 2015 for the 6,870-foot long track running along South Andrews Avenue between SE 7th Street and SE 17th Street, along NE 4th Street between North Andrews Avenue and NE 3rd Avenue, and along NE 3rd Avenue between NE 4th Street and NE 6th Street that is part of Phase 1B of this project. 1.2 Project Approach The purpose of this study was to evaluate the underground conditions (i.e. subsoil, rock and groundwater conditions) along the 1,425-foot long track running along S. Andrews Avenue from SE 17th Street to SE 18th Street, along SW 18th Street from S. Andrews Avenue to SW 1st Avenue, and along NE 3rd Avenue from NE 6th Street to NE 7th Street that is part of Phase 1C of the proposed streetcar project. This report presents the results of our field exploration, laboratory testing, in-situ soil resistivity testing and engineering evaluations for the above-referenced segment of Phase 1C of the proposed streetcar track construction.

Geotechnical Report for Preliminary Engineering 2 SFRTA Wave Modern Streetcar – Phase 1C Broward County, Florida GEOSOL Project No. 214197
2.0 SCOPE OF SERVICES
The scope consisted of providing the following services: 1. Reviewing of geotechnical data available from past projects near the site. 2. Discussing the field exploration program with HDR. 3. Obtaining underground utility clearance confirmation at the test locations. 4. Drilling nine (9) Standard Penetration Test (SPT) borings along the project alignment to
depths of 20 feet below existing grades along the alignment of the proposed streetcar tracks.
5. Measuring groundwater levels at the test boring locations. 6. Backfilling the boreholes made as a result of the SPT borings using cement grout mix to the
ground surface. 7. Inspecting soil/rock samples for visual classification and performing a limited number of
laboratory classification tests on selected representative samples.
8. Performing in-situ Soil Resistivity Testing along the project alignment at four (4) locations to depths of 2.5, 5, 7.5, and 10 feet below existing grades at each test location.
9. Evaluating the results of the SPT boring and in-situ soil resistivity testing. 10. Developing site preparation requirements for the proposed streetcar tracks. 11. Preparing a geotechnical engineering report summarizing the field testing data, subsurface
and groundwater conditions, as well as our geotechnical evaluations and recommendations for the site preparation and foundation design.
Geotechnical Report for Preliminary Engineering 3 SFRTA Wave Modern Streetcar – Phase 1C Broward County, Florida GEOSOL Project No. 214197
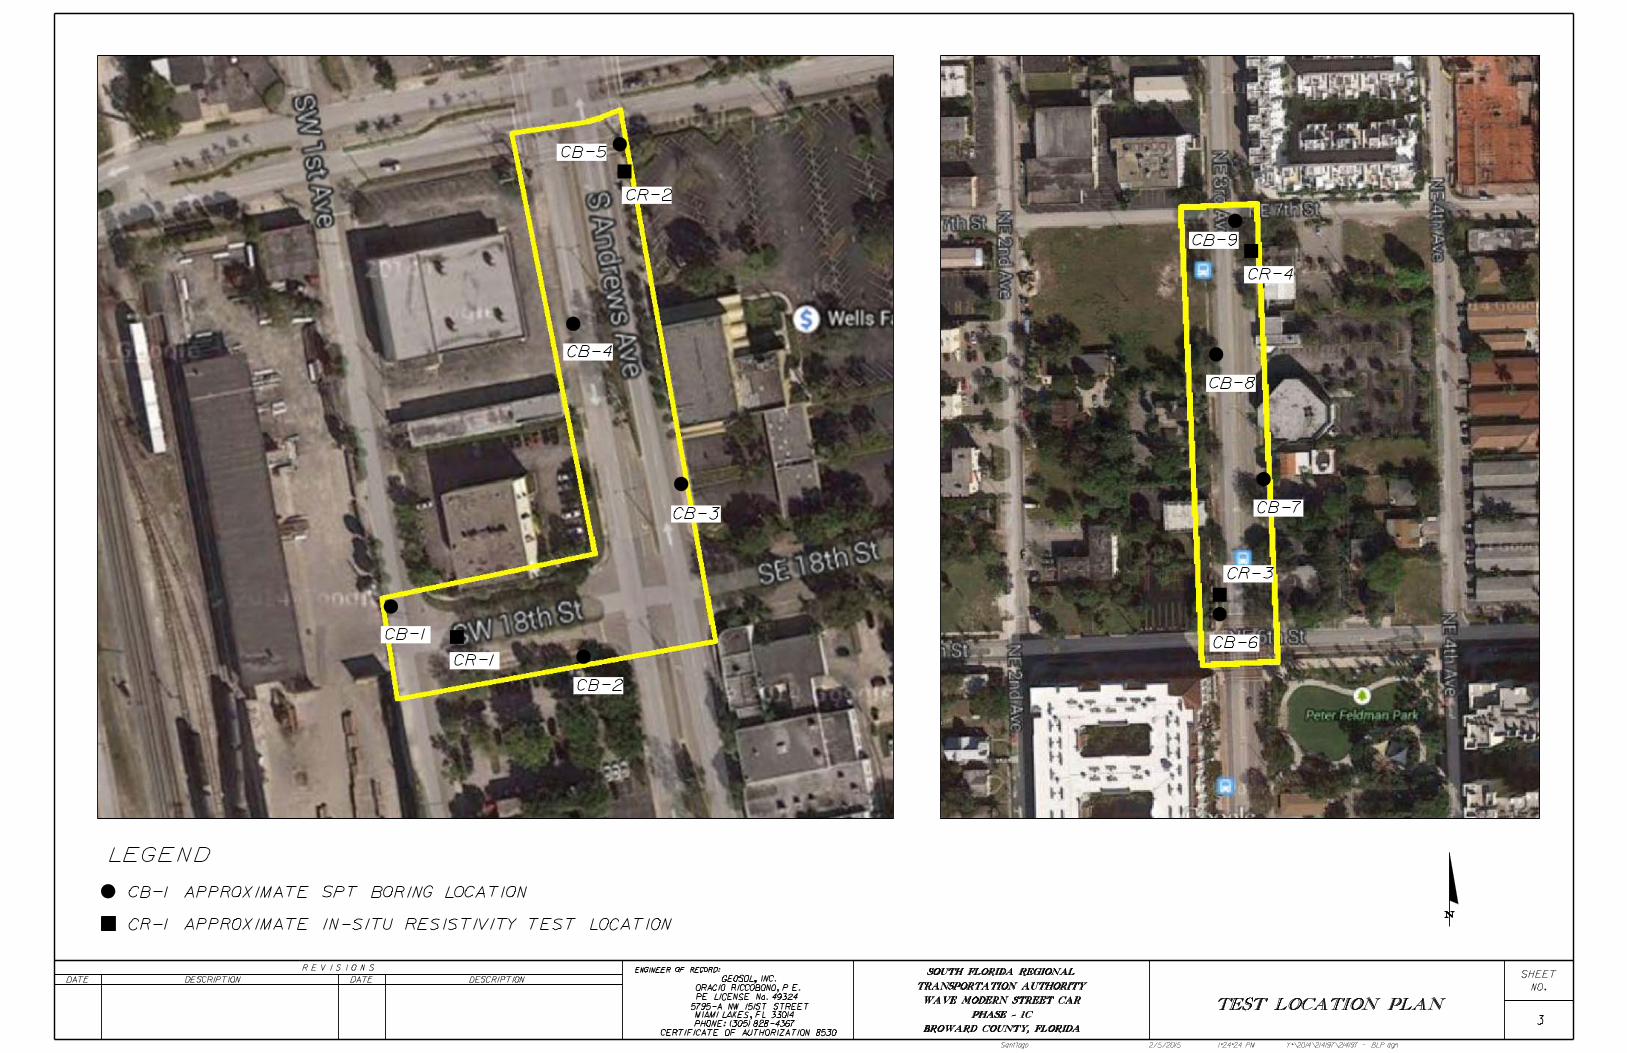
3.0 FIELD EXPLORATION 3.1 General A field exploration program was performed which consisted of performing Standard Penetration Test (SPT) borings and in-situ soil resistivity testing for the proposed 1,425-foot long track running along S. Andrews Avenue from SE 17th Street to SE 18th Street, along SW 18th Street from S. Andrews Avenue to SW 1st Avenue, and along NE 3rd Avenue from NE 6th Street to NE 7th Street that is part of Phase 1C of the proposed streetcar project. Specifically, a total of nine (9) SPT borings (CB-1 through CB-9) were performed to depths of 20 feet below existing grades along the potential alignment of the above-referenced segment of Phase 1C of the proposed streetcar track construction. The SPT borings were generally spaced at approximately 200-foot intervals along the above-referenced segment of Phase 1C streetcar track alignment. Additionally, in-situ resistivity testing was performed at four (4) locations (CR-1 through CR-4) to depths of 2.5, 5, 7.5, and 10 feet below existing grades at each test location. The Test Location Plan is presented on Sheet 3 in Appendix “A”. The Soil Profile sheet is shown on Sheet 4 in Appendix "A". These sheets present the boring location information, subsurface conditions and groundwater levels encountered at the time of drilling. 3.2 Field Test Locations The test borings performed for this study were marked in the field by representatives of GEOSOL utilizing standard taping procedures and existing landmarks. For the test locations, latitude and longitude coordinates were obtained with the use of a hand-held Global Positioning System (GPS) device. These coordinates were converted to northing and easting utilizing the software “Corpson” developed by the United States Army Corps of Engineers and should be considered approximate. The ground surface elevations for each test location have not been provided to us at this point. The borings were performed as close as possible to the proposed streetcar track alignment considering constraints such as utilities and equipment accessibility The approximate test boring locations are presented in Table 1 and in the Test Location Plans presented in Appendix “A”. 3.3 Site Conditions
The site conditions were observed by representatives of GEOSOL during performance of our field exploration. The proposed streetcar track alignment that are part of Phase 1C of the project will proceed along S. Andrews Avenue from SE 17th Street to SE 18th Street, along SW 18th Street from S. Andrews Avenue to SW 1st Avenue, and along NE 3rd Avenue from NE 6th Street to NE 7th Street in the city of Fort Lauderdale, in Broward County, Florida. The area mainly consists of commercial buildings. We have appended Site Vicinity and USDA maps, which identify the location of the study area. These maps are presented in Sheets 1 and 2, respectively, of Appendix "A".

Geotechnical Report for Preliminary Engineering 4 SFRTA Wave Modern Streetcar – Phase 1C Broward County, Florida GEOSOL Project No. 214197
3.4 Standard Penetration Test (SPT) Borings The SPT borings were performed utilizing a truck-mounted drill rig (Foremost-Mobile model B-53) equipped with a recently calibrated automatic hammer. The SPT boring procedure was conducted in general conformance with ASTM D-1586. After seating the sampler six (6) inches, the number of successive blows required to drive the sampler twelve (12) inches into the soil constitutes the test result commonly referred to as the "N"-value. The “N”-value has been empirically correlated with various soil properties and is considered to be indicative of the relative density of cohensionless soils and the consistency of cohesive soils. The N-value information for each SPT boring is presented in the Soil Profile sheets in Appendix “A”. The recovered split spoon samples were visually classified in the field with representative portions of the samples placed in jars and transported to our office for review by a geotechnical engineer and confirmation of the field classification. Upon completion of the SPT borings, the boreholes were backfilled with cement grout, the surface restored, and the site cleaned as required. 3.5 Water Level Measurements Water level depths were obtained during the performance of the test boring and exfiltration testing operations. They are noted on the Soil Profile sheets and Test Boring Records presented in Appendix “A”. In relatively pervious soils/rocks, such as sandy (granular) soils and porous limestone, the indicated depths are usually reliable groundwater levels. Seasonal variations, tidal conditions, temperature variations, land uses, and recent rainfall conditions may influence the depth of groundwater levels. 3.6 In-Situ Soil Resistivity Testing In-situ soil resistivity testing for the proposed streetcar track area was performed to assess the electrical resistivity of the near surface soil. As requested, the in-situ resistivity testing was performed at four (4) locations (CR-1 through CR-4) to depths of 2.5, 5, 7.5, and 10 feet below existing grades at each test location. The in-situ resistivity testing procedure was conducted using a Miller-400A meter per the 4-point Wenner method, and in general conformance with ASTM G57-06. The 4-point Wenner method uses four (4) electrodes attached to a meter that are driven into the earth the same distance and are evenly spaced in a straight line. The meter impresses a voltage between the outer two (2) electrodes, causing current to flow. The meter displays the earth’s average resistance to a depth equal to the electrode spacing based on the magnitude of the current flowing between the outer two (2) electrodes and the voltage drop between the inner two (2) electrodes. The earth’s average resistivity to a depth equal to the electrode spacing can be obtained by applying the following formula:

Geotechnical Report for Preliminary Engineering 5 SFRTA Wave Modern Streetcar – Phase 1C Broward County, Florida GEOSOL Project No. 214197
ρ = 2 π S R o Where
ρ is the earth’s average resistivity at depth equal to S (ohm.cm) S is the electrode spacing (cm) R is the resistance value measured using the 4-point Wenner method (ohm)
The results of the resistivity tests are summarized in Table 4 of Appendix “C”. Also, the schematics of the 4-point Wenner method arrangement and typical site photograph are presented in Appendix “C” of this report.
4.0 LABORATORY TESTING 4.1 General Representative samples collected from the test boring locations were visually reviewed in the laboratory by a geotechnical engineer to confirm the field classifications. The samples from the roadway borings were classified using the American Association of State Highway and Transportation Officials (AASHTO) Soil Classification System in general accordance with the American Society of Testing and Materials (ASTM) test designation D-3282, titled "Classification of Soils and Soils-Aggregate Mixtures for Highway Construction Purposes". The soil classification was based on visual observations with the aid of laboratory testing results, which consist of grain-size analysis, percent passing the No. 200 sieve, organic content, and natural moisture content testing. The tests were performed on selected samples believed to be representative of the materials encountered. A summary of the laboratory test results are provided in Table 2 in Appendix “B” of this report. In addition, corrosion testing was performed on water samples obtained from the field testing in order to determine the FDOT Environmental Classification. A summary of the corrosion testing is presented in Table 3 of Appendix “B”. 4.2 Grain-Size Analysis The grain-size analyses were conducted in general accordance with the FDOT Test Designation FM1-T88 (ASTM Test Designation D-422, titled “Particle-Size Analysis of Soils”). The grain-size analysis test measures the percentage passing the No. 200 Sieve. In this manner, the grain-size distribution of a soil is measured. The percentage by weight passing the No. 200 sieve is the amount of silt and clay sized particles. A summary of these test results are presented on Table 2 in Appendix “B”. The grain-size analysis curves are presented in Appendix “B” of this report.

Geotechnical Report for Preliminary Engineering 6 SFRTA Wave Modern Streetcar – Phase 1C Broward County, Florida GEOSOL Project No. 214197
4.3 Moisture Content Laboratory moisture content test consists of the determination of the percentage of moisture contents in selected samples in general accordance with FDOT Test Designation FM1-T265 {ASTM Test Designation D-2216, titled “Laboratory Determination of Water (Moisture) Content of Soil, Rock, and Soil-Aggregate Mixtures”}. Briefly, the moisture content is determined by weighing a sample of the selected material and then drying it in a warm oven. Care is taken to use a gentle heat so as not to destroy any organics. The sample is removed from the oven and reweighed. The difference of the two weights is the amount of moisture removed from the sample. The weight of the moisture divided by the weight of the dry soil sample is the percentage by weight of moisture in the sample. The moisture content test results are presented in Table 2 of Appendix “B”. 4.4 Organic Content Organic content test consists of the determination of the percentage of organic content in selected samples in general accordance with FDOT Test Designation FM1-T267 (ASTM Test Designation D-2974, titled "Moisture, Ash, and Organic Matter of Peat and Other Organic Soils"). Briefly, the organic content is determined by weighing a sample of the selected material and then burning off the organic material in a hot oven. The sample is removed from the oven and re-weighed. The difference of the two weights is the amount of organic material removed from the sample. The weight of the organic material divided by the weight of the dry soil sample is the percentage by weight of organic material in the sample. The organic content test results are given in Table 2 of Appendix "B". 4.5 Environmental Classification GEOSOL performed environmental corrosion testing on water samples collected from the SPT borings performed for this project. Environmental corrosion tests include parameters such as pH, resistivity, sulfate content and chloride content. The environmental corrosion tests were conducted in general accordance with the FDOT Test Designations FM5-550, 5-551, 5-552, and 5-553. Based on the laboratory test results and the FDOT's "Structures Design Guidelines”, Section 1.3, the environment along the proposed streetcar track alignment has been classified as moderately aggressive for the steel and concrete substructures, and slightly aggressive for the superstructures. We have included the test results in Table 3 of Appendix “B”.

Geotechnical Report for Preliminary Engineering 7 SFRTA Wave Modern Streetcar – Phase 1C Broward County, Florida GEOSOL Project No. 214197
5.0 GENERALIZED SUBSURFACE CONDITIONS 5.1 Broward County Regional Geology The project is located on the Southern flank of the Florida Plateau, a stable, carbonate platform on which thick deposits of Jurassic, Cretaceous, Tertiary limestones, dolomites and evaporites have accumulated. In the project areas, the upper 200 feet of this platform is composed predominantly of limestone and quartz sand. These sediments were deposited during several glacial and interglacial stages during the Pleistocene Epoch. Three major geological formations are encountered along the project alignment in the upper 200 feet. These formations are in descending order: (1) the Fort Thompson Formation, (2) the Tamiami Formation and (3) the Hawthorn Formation. A generalized site hydrogelogic section begins at land surface with a few feet of organic soils (muck) and lime mud of freshwater limestone. Some of these materials have been replaced with roadway embankment or levee fill. Below the organic soils or fill materials to a depth of 30 to 80 feet are interbedded materials of the upper part of the Fort Thompson Formation consisting of hard, dense, light brown and gray limestone, sand and shell with lime mud matrix; and some limestone with poorly to moderately developed solution-cavity zones. These upper beds generally retard vertical movement of water, but thin zones with cavities may be very highly permeable. Although the Fort Thompson Limestone Formation can be very porous and have a sponge-like, open interconnected network of vugs and small voids, large cavities do not exist and there is no potential for sinkhole activity. Below the upper Fort Thompson Formation to about 200 feet is the Tamiami Formation, which consists of gray shelly relatively soft limestone and sandstone with beds of sand-shell materials. The rock formations encountered in the west Broward County area are typically much softer than the "bedrock" formations encountered in other areas of the country. The strength of the limestone as well as its deformation characteristics depends upon the degree of cementation of the formation and its alteration by solutioning and weathering subsequent to deposition. One of the most important characteristics of the limestone encountered in the project area is the degree of erosion. Past surface solutioning of the limestone has resulted in formation called "pinnacle rock". In some cases nearly vertical cylindrical-shaped solution cavities are filled with surficial fine sands extending below the groundwater level. 5.2 Broward County Soil Survey The Soil Survey of Broward County Area, Florida, published by the United States Department of Agriculture (USDA), was reviewed for general near-surface soil information within the general project vicinity. This information indicates that there are three (3) primary mapping units within the project vicinity, as follows:

Geotechnical Report for Preliminary Engineering 8 SFRTA Wave Modern Streetcar – Phase 1C Broward County, Florida GEOSOL Project No. 214197
Dade-Urban land complex (11)
Immokalee, limestone substratum-Urban land complex (16)
Urban Land (40)
A reproduction of the USDA Soils Survey map for the project area is illustrated in Sheet 2 of Appendix "A" of this report.
6.0 SITE SUBSURFACE AND GROUNDWATER CONDITIONS 6.1 General The subsurface conditions disclosed by the borings are generally consistent with the previously described regional geology. The stratification is based on visual examination of the recovered soil/rock samples, laboratory testing and interpretation of the field boring logs by a Geotechnical Engineer. The boring stratification lines represent the approximate boundaries between soil types of significantly different engineering properties; however, the actual transition may be gradual. In some cases, small variations in properties not considered pertinent to our engineering evaluation may have been abbreviated for clarity. The borings present the subsurface conditions at the particular boring location and slight variations do occur among the borings. The Soil Profile sheets presented in Appendix "A” provide the conditions at the particular test locations. Presented in Appendix "A" is the site vicinity map, USDA soil survey map, boring location information, Soil Profiles, and Soils Survey Sheet along with the soil legend and other pertinent information such as measured groundwater table levels. A detailed description of the subsurface materials encountered at the project site is presented below. Specifically, we have identified seven (7) strata in the subsoils (beside the existing topsoil and roadway pavement) along the limits of the project. They are identified on the following page and described on the Roadway Soil Profiles in Appendix "A". Stratum Soil Description AASHTO Group 0 Asphalt Pavement N/A 00 Dark Brown Organic Silty Fine SAND with Grass (TOPSOIL) A-8 1 Light Brown Slightly Silty Fine to Medium SAND with A-1-b
Some Limerock Fragments (FILL) 2 Light Brown to Dark Brown, Occasionally Organic Stained, A-3 Fine to Medium SAND (FILL)

Geotechnical Report for Preliminary Engineering 9 SFRTA Wave Modern Streetcar – Phase 1C Broward County, Florida GEOSOL Project No. 214197
3 Light Brown to Brown Silty Fine to Medium SAND with A-2-4 Trace to Some Limerock Fragments (FILL) (NOT ENCOUNTERED DURING PHASE 1C)
4 Dark Brown Organic Slightly Silty to Silty Fine to Medium A-8 SAND with Little Roots, Wood, and Limestone Fragments (NOT ENCOUNTERED DURING PHASE 1C)
5 Light Brown to Brown Sandy LIMESTONE N/A 6 Brown Silty Fine to Coarse SAND A-2-4 with Some Limestone Fragments
7 Light Brown to Brown Slightly Silty A-3 Fine to Medium SAND with Some Limestone Fragments
Specific details concerning the subsurface materials and conditions encountered at each test location may be obtained from the Soil Profile sheet presented in Appendix "A". 6.2 Groundwater Conditions The groundwater table was measured at each boring location immediately following completion of drilling operations between January 15 and 16, 2015. The borings were performed during the dry season. The depths to the "static" groundwater table after a short stabilization period were measured to range from about 4.3 to 5.9 feet below the existing grades. The Soil Profile sheets presented in Appendix “A” show the groundwater table information at each boring location. In relatively pervious soil and rocks, such as granular soils and porous limestone, the indicated depths are usually reliable groundwater levels. Fluctuation in the observed groundwater levels should be expected due to rainfall variation, construction activity and other factors. We recommend that the Designer considers the possibility of such fluctuation. 6.3 Estimated Seasonal High Water Level The estimated seasonal high water table each year is the level in the August-September period at the end of the rainy season during a year of average (normal) rainfall. The water table elevations associated with a flood would be much higher than the seasonal high water table elevations. The normal high water levels would more approximate the seasonal high water table elevations. The seasonal high water table is affected by a number of factors. The drainage characteristic of the soils, the land surface elevation, relief points such as lakes, canals, swamp areas, etc., and distance to relief points are some of the more important factors influencing the seasonal high water table elevation.
Geotechnical Report for Preliminary Engineering 10 SFRTA Wave Modern Streetcar – Phase 1C Broward County, Florida GEOSOL Project No. 214197
It is to be noted that the test borings for this project were performed during the end of the dry season. Therefore, based on our interpretation of the site conditions using the results of our test boring data, we estimate that the normal seasonal high water table is about 6 to 12 inches above the water levels shown at the boring locations.
7.0 ENGINEERING EVALUATIONS AND RECOMMENDATIONS FOR THE PROPOSED STREETCAR TRACK BED DESIGN
7.1 General Results of the soil survey indicate that the project alignment is generally suitable for the proposed streetcar track construction when viewed from a geotechnical engineering perspective. The following section provides our site preparation recommendations for the proposed streetcar track construction. 7.2 Site Preparation Site preparation for the proposed streetcar track construction will most likely include stripping of asphalt pavement, compaction of subgrade materials, filling operations and track construction. It should be noted that at this point stations have not been established along the alignment of the proposed streetcar track alignment. The following are our discussions regarding the utilization and the site preparation requirements of the subsurface soils. The material from Stratum 0 is the existing asphalt pavement layer.
The material from Stratum 00 is topsoil (A-8) and considered to be unsuitable (muck). It shall
be removed during clearing and grubbing in accordance with Section 110 of the FDOT Standard Specifications.
The materials from Strata Numbers 1, 2, and 7 (A-1-b and A-3 soils) are considered to be select
and should be utilized in accordance with FDOT Standard Index 505. The materials from Strata Numbers 3 and 6 (A-2-4 soils) are considered to be select and should
be utilized in accordance with FDOT Standard Index 505. Certain types of A-2-4 material are likely to retain excess moisture and may be difficult to dry and compact. They should be used in the embankment above the water level existing at time of construction. They may be used in the subgrade portion of the track bed when approved by the Geotechnical Engineer of Record. Stratum Number 3 was not encountered during phase 1C of this project.

Geotechnical Report for Preliminary Engineering 11 SFRTA Wave Modern Streetcar – Phase 1C Broward County, Florida GEOSOL Project No. 214197
The material from Stratum Number 4 (A-8 soils) is considered to be organic (muck). Stratum Number 4 was not encountered during phase 1C of this project.
The material from Stratum Number 5 is the natural limestone formation. These materials may be difficult to dewater, excavate and/or penetrate and may require special equipment to do so.
7.3 Fill Material The fill should consist of select material, meeting the requirements of Standard Index 505 and shall be constructed in general accordance of Section 120.8 of the FDOT Standard Specifications for Road and Bridge Construction.
8.0 CONSTRUCTION CONSIDERATIONS 8.1 General Construction Recommendations Site preparation shall be in accordance with Sections 110 and 120 of the FDOT Standard Specifications for Road and Bridge Construction and FDOT Standard Indices 500 and 505. 8.2 Groundwater Control The groundwater can normally be controlled in shallow excavations with a sump pump. During subgrade soil preparation the soils below design grade could become disturbed by construction activities. If this becomes the case, The Contractor may be directed by The Owner's representative to remove the disturbed or pumping soils to a depth of 12 to 18 inches below design grades and backfill the area with select fill in accordance with FDOT Index 505 and the latest FDOT Standard Specifications for Roads and Bridge Construction.
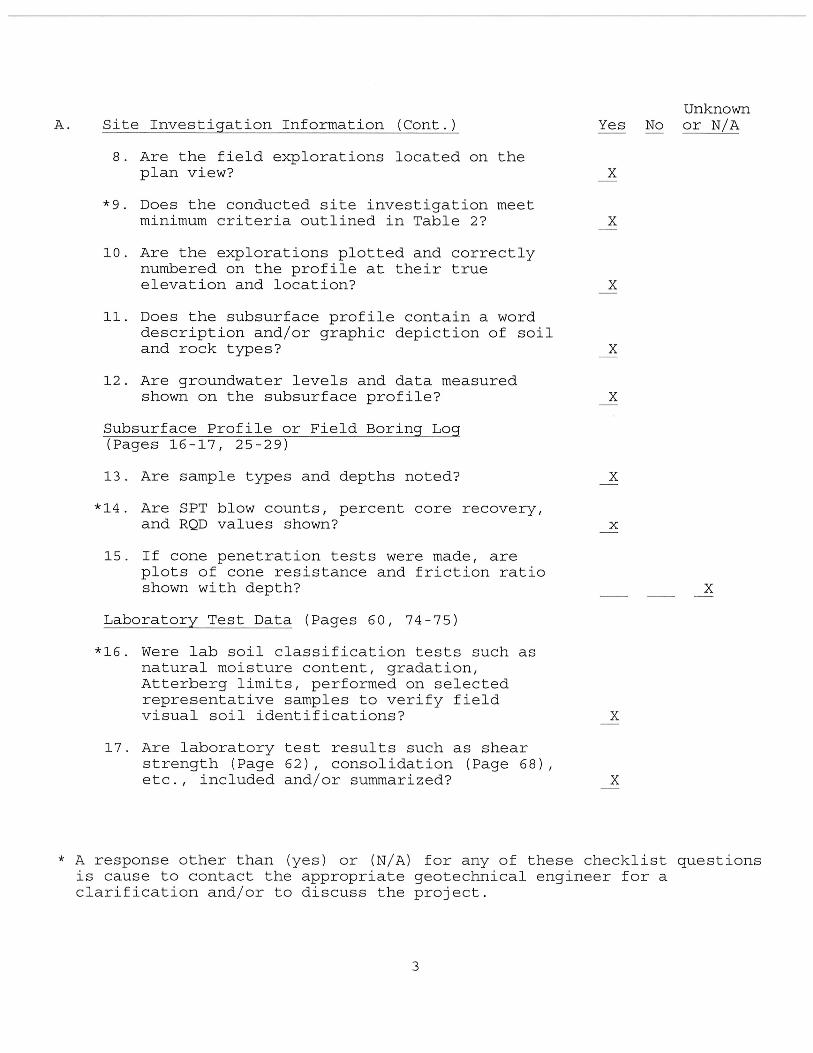
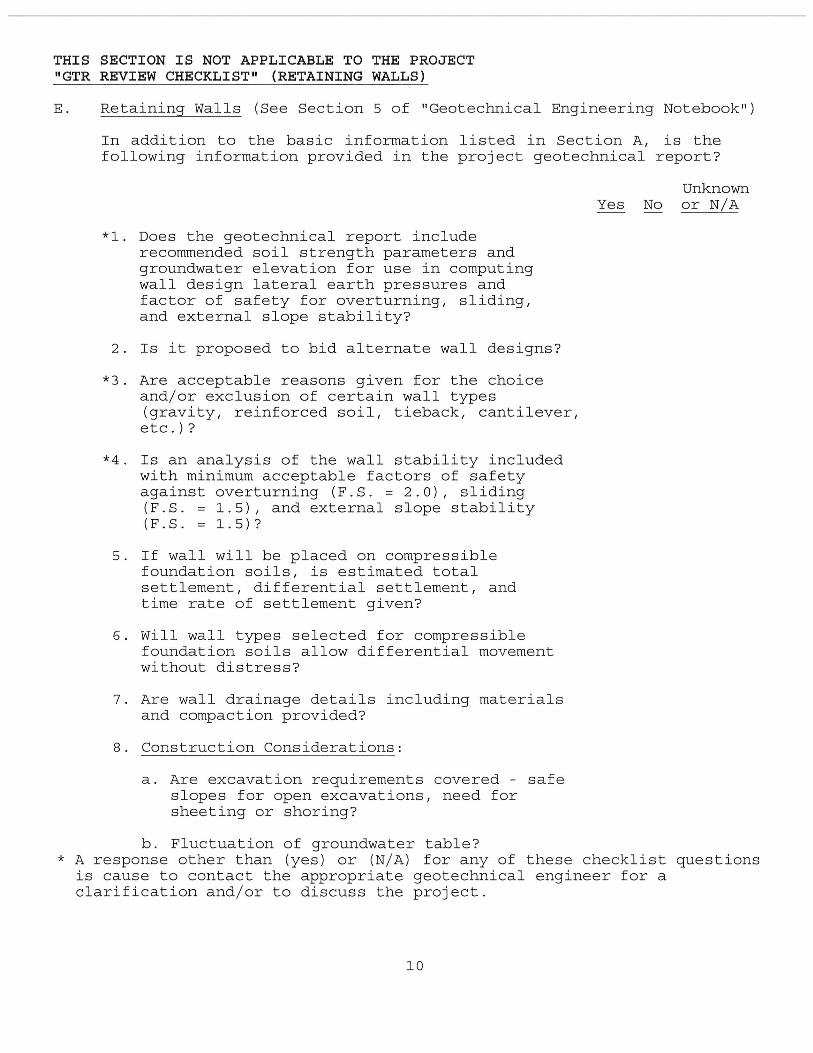
9.0 FHWA REPORT CHECKLIST As referenced in the FDOT Structures Design Guidelines, conformance to the FHWA Report “Checklist and Guidelines for Review of Geotechnical Reports and Preliminary Plans and Specifications” prepared by the Geotechnical and Materials Branch, FHWA, Washington, D.C., dated October 1985, is required when preparing geotechnical reports. The FHWA checklist for this report is enclosed in Appendix “D”.

Geotechnical Report for Preliminary Engineering 12 SFRTA Wave Modern Streetcar – Phase 1C Broward County, Florida GEOSOL Project No. 214197
10.0 REPORT LIMITATIONS Our professional services have been performed, our findings obtained, and our recommendations prepared in accordance with generally accepted geotechnical engineering principles and practices. This company is not responsible for the conclusions, opinions or recommendations made by others based on these data. No other warranties are expressed or implied. The scope of the investigation was intended to evaluate subsurface conditions within the influence of the proposed streetcar track construction. The analyses and recommendations submitted in this report are based upon the data obtained from the test borings performed by GEOSOL at the locations indicated. If any subsoil variations become evident during the course of this project, a re-evaluation of the recommendations contained in this report will be necessary after we have had an opportunity to observe the characteristics of the conditions encountered. The applicability of this report should also be reviewed in the event significant changes occur in the design, nature or location of the proposed project. The scope of our services does not include any environmental assessment or investigation for the presence or absence of hazardous or toxic materials in the soil, groundwater, or surface water within or beyond the site studied. Any statements in this report regarding odors, staining of soils, or other unusual conditions observed are strictly for the information of our client.

APPENDIX “A”
Sheet 1 – Site Vicinity Map Sheet 2 – USDA Soils Survey Map
Table 1 – Summary of Field Test Locations Sheet 3 – Test Location Plan
Sheet 4 – Soil Profiles Sheet 5 – Roadway Soils Survey Sheet


SFRTA THE WAVE MODERN STREETCAR - PHASE 1CBROWARD COUNTY, FLORIDAGEOSOL PROJECT No. 214197
BORING / TESTNo.
CB-1 642701 937534 N/ACR-1 642680 937602 N/ACB-2 642659 937732 N/ACB-3 642828 937817 N/ACB-4 642977 937718 N/ACR-2 643128 937772 N/ACB-5 643144 937773 N/ACB-6 653866 938037 N/ACR-3 653889 938034 N/ACB-7 654053 938098 N/ACB-8 654252 938022 N/ACR-4 654401 938082 N/ACB-9 654436 938061 N/A
Notes:1) CB: SPT Boring Location2) CR: In-Situ Resistivity Test Location
NORTHING EASTING
TABLE 1 - SUMMARY OF TEST LOCATIONS
GROUND SURFACE ELEVATION (FEET)
APPROXIMATE TEST LOCATION (FEET)
214197 Table 1 - Summary of Test Locations.xls 1 of 1


APPENDIX “B”
Table 2 – Summary of Laboratory Test Results (Soil Samples) Table 3 – Summary of Environmental Classification Test Results
Moisture Content Test Results Percent Passing the No. 200 Sieve Test Results
Grain-Size Analysis Results and Curves Organic Content Test Results
Environmental Classification Test Results

NaturalBORING SAMPLE STRATUM AASHTO Organic MoistureNUMBER NUMBER NUMBER GROUP Content Content
1" 3/4" 3/8" #4 #10 #40 #60 #100 #200 (%) (%)
CB-5 1 00 A-8 0.0 - 0.2 - - - - - - - - - 12 68CB-1 1 1 A-1-b 0.2 - 2.0 100 90 87 75 65 48 20 10 9 - 11CB-8 1 2 A-3 0.2 - 2.0 100 100 100 100 98 84 18 5 4 - 7CB-7 7 6 A-2-4 18.0 - 20.0 82 77 67 60 57 50 42 19 12 - 15CB-9 5 6 A-2-4 8.0 - 10.0 92 86 71 64 60 52 29 17 12 - 17CB-2 7 6 A-2-4 18.0 - 20.0 92 92 78 66 61 52 41 16 12 - 14CB-6 2 7 A-3 2.0 - 4.0 100 100 100 100 100 88 7 1 1 - 13CB-6 4 7 A-3 6.0 - 8.0 - - - - - - - - 2 1 22CB-8 4 7 A-3 6.0 - 8.0 - - - - - - - - 2 2 26CB-9 4 7 A-3 6.0 - 8.0 - - - - - - - - 3 2 28CB-4 2 7 A-3 2.0 - 4.0 100 100 99 99 98 79 6 1 1 - 12
(FEET)
TABLE 2 - SUMMARY OF LABORATORY TEST RESULTS SFRTA WAVE MODERN STREETCAR – PHASE 1C
GEOSOL Project No.: 214197BROWARD COUNTY, FLORIDA
(Percent Passing)Sieve Analysis Sample
Depth

Steel Concrete
CB-1 WATER 5 7.9 2,420 500 500 MA MA
NOTES: (1) The following FDOT laboratory test methods were utilized.
FM5-550: pH FM5-552: Chlorides
FM5-551: Resistivity FM5-553: Sulfates
(2) SA: SLIGHTLY AGGRESSIVE
(3) MA: MODERATELY AGGRESSIVE
(4) EA: EXTREMELY AGGRESSIVE
FDOT Criteria for Substructure Environmental Classification (FDOT Structures Design Guidelines 2014)
Chloride (ppm)Sample Type
GEOSOL Project No.: 214197
TABLE 3 - SUMMARY OF ENVIRONMENTAL CLASSIFICATION TEST RESULTSSFRTA WAVE MODERN STREETCAR – PHASE 1C
BROWARD COUNTY, FLORIDA
Sulfate (ppm)pH Depth (ft)
FDOT ENVIRONMENTAL CLASSIFICATIONSample
LocationResistivity (ohm-cm)
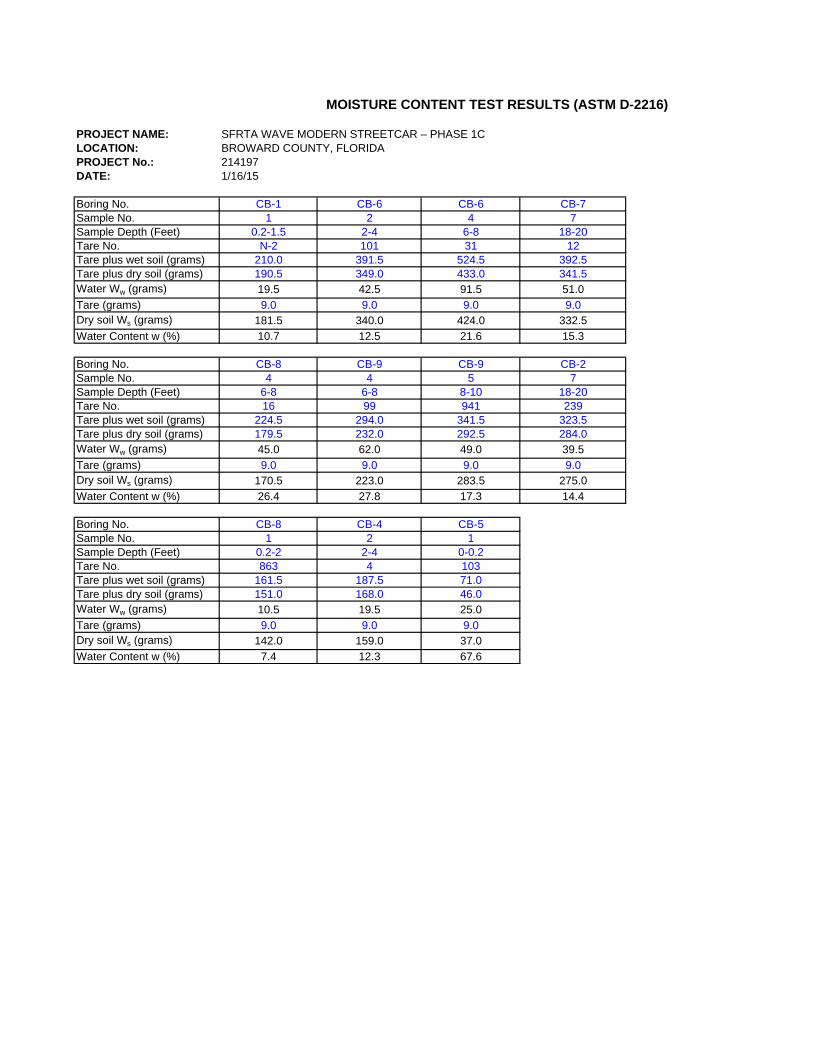
PROJECT NAME: SFRTA WAVE MODERN STREETCAR – PHASE 1CLOCATION: BROWARD COUNTY, FLORIDAPROJECT No.: 214197DATE: 1/16/15
Boring No. CB-1 CB-6 CB-6 CB-7Sample No. 1 2 4 7Sample Depth (Feet) 0.2-1.5 2-4 6-8 18-20Tare No. N-2 101 31 12Tare plus wet soil (grams) 210.0 391.5 524.5 392.5Tare plus dry soil (grams) 190.5 349.0 433.0 341.5Water Ww (grams) 19.5 42.5 91.5 51.0
Tare (grams) 9.0 9.0 9.0 9.0Dry soil Ws (grams) 181.5 340.0 424.0 332.5
Water Content w (%) 10.7 12.5 21.6 15.3
Boring No. CB-8 CB-9 CB-9 CB-2Sample No. 4 4 5 7Sample Depth (Feet) 6-8 6-8 8-10 18-20Tare No. 16 99 941 239Tare plus wet soil (grams) 224.5 294.0 341.5 323.5Tare plus dry soil (grams) 179.5 232.0 292.5 284.0Water Ww (grams) 45.0 62.0 49.0 39.5
Tare (grams) 9.0 9.0 9.0 9.0Dry soil Ws (grams) 170.5 223.0 283.5 275.0
Water Content w (%) 26.4 27.8 17.3 14.4
Boring No. CB-8 CB-4 CB-5Sample No. 1 2 1Sample Depth (Feet) 0.2-2 2-4 0-0.2Tare No. 863 4 103Tare plus wet soil (grams) 161.5 187.5 71.0Tare plus dry soil (grams) 151.0 168.0 46.0Water Ww (grams) 10.5 19.5 25.0
Tare (grams) 9.0 9.0 9.0Dry soil Ws (grams) 142.0 159.0 37.0
Water Content w (%) 7.4 12.3 67.6
MOISTURE CONTENT TEST RESULTS (ASTM D-2216)

PROJECT NAME: SFRTA WAVE MODERN STREETCAR – PHASE 1CLOCATION: BROWARD COUNTY, FLORIDAPROJECT No.: 214197DATE: 1/16/15
Boring No. CB-1 CB-6 CB-7 CB-8Sample No. 1 4 7 4Sample Depth (Feet) 0.2-2 6-8 18-20 6-8Original Dry Weight of Soil (grams) 181.5 338.0 332.5 125.0Weight of Soil After Washing (grams) 165.5 331.0 292.0 122.0Weight of Soil Passing 200 Sieve (grams) 16.0 7.0 40.5 3.0Percent of Soil Passing 200 Sieve (%) 8.8 2.1 12.2 2.4
Boring No. CB-9 CB-9 CB-2Sample No. 4 5 7Sample Depth (Feet) 6-8 8-10 18-20Original Dry Weight of Soil (grams) 173.0 283.5 275.0Weight of Soil After Washing (grams) 168.5 249.0 241.0Weight of Soil Passing 200 Sieve (grams) 4.5 34.5 34.0Percent of Soil Passing 200 Sieve (%) 2.6 12.2 12.4
Note: The percent passing the No. 200 sieve results presented above were determined using the wash method.
MATERIAL PASSING THE # 200 SIEVE TEST RESULTS (AASHTO T-11)

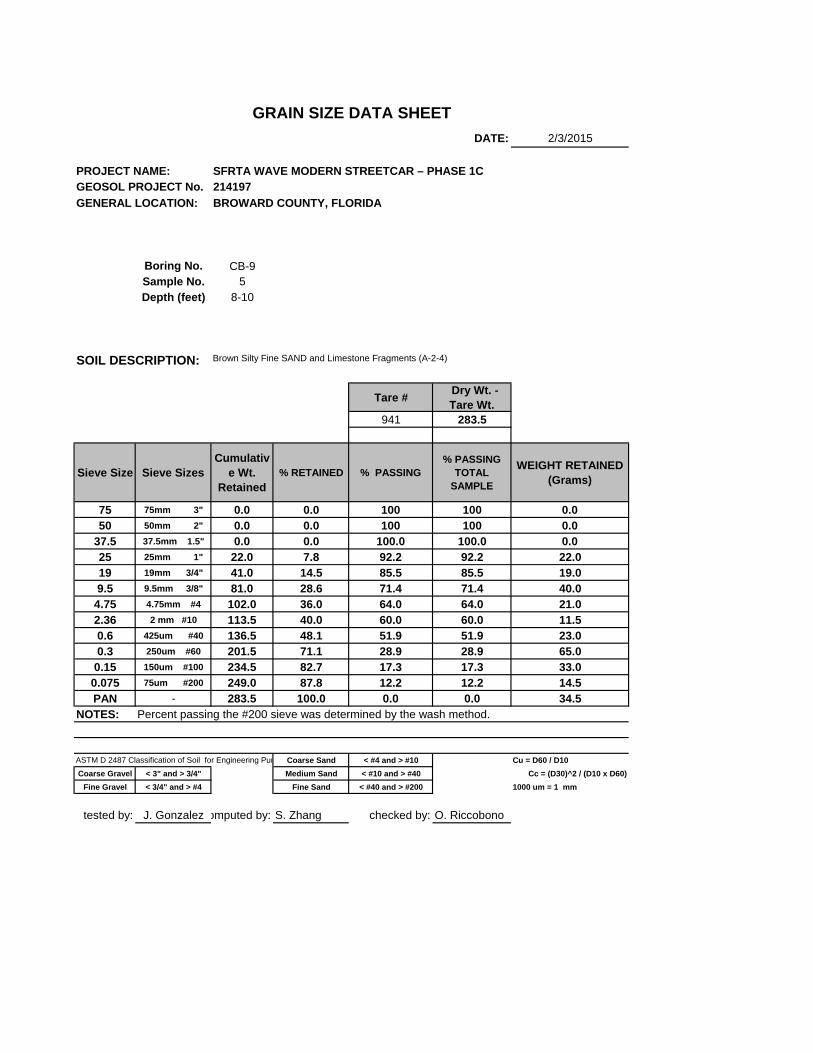
GRAIN SIZE DATA SHEET
DATE: 1/29/2015
PROJECT NAME: SFRTA WAVE MODERN STREETCAR – PHASE 1CGEOSOL PROJECT No. 214197
GENERAL LOCATION: BROWARD COUNTY, FLORIDA
Boring No. CB-1Sample No. 1Depth (feet) 0.2-1.5
SOIL DESCRIPTION:
Tare # Dry Wt. - Tare Wt.
N-2 181.5
Sieve Size Sieve SizesCumulativ
e Wt. Retained
% RETAINED % PASSING% PASSING
TOTAL SAMPLE
WEIGHT RETAINED (Grams)
75 75mm 3" 0.0 0.0 100 100 0.050 50mm 2" 0.0 0.0 100 100 0.0
37.5 37.5mm 1.5" 0.0 0.0 100.0 100.0 0.025 25mm 1" 0.0 0.0 100.0 100.0 0.019 19mm 3/4" 17.5 9.6 90.4 90.4 17.59.5 9.5mm 3/8" 23.0 12.7 87.3 87.3 5.5
4.75 4.75mm #4 45.5 25.1 74.9 74.9 22.52.36 2 mm #10 63.5 35.0 65.0 65.0 18.00.6 425um #40 94.5 52.1 47.9 47.9 31.00.3 250um #60 144.5 79.6 20.4 20.4 50.0
0.15 150um #100 163.5 90.1 9.9 9.9 19.00.075 75um #200 165.5 91.2 8.8 8.8 2.0PAN - 181.5 100.0 0.0 0.0 16.0
NOTES: Percent passing the #200 sieve was determined by the wash method.
ASTM D 2487 Classification of Soil for Engineering Pur Coarse Sand < #4 and > #10 Cu = D60 / D10
Coarse Gravel < 3" and > 3/4" Medium Sand < #10 and > #40 Cc = (D30)^2 / (D10 x D60)
Fine Gravel < 3/4" and > #4 Fine Sand < #40 and > #200 1000 um = 1 mm
tested by: J. Gonzalez omputed by: S. Zhang checked by: O. Riccobono
Brown Slightly Silty Fine to Medium SAND with Some Limerock Fragments (FILL; A-1-b)

GRAIN SIZE DATA SHEETDATE: 1/29/2015
PROJECT NAME: SFRTA WAVE MODERN STREETCAR – PHASE 1C
GEOSOL PROJECT No. 214197GENERAL LOCATION: BROWARD COUNTY, FLORIDA
ASTM D 2487 Classification of Soil for Engineering Pur Coarse Sand < #4 and > #10 Cu = D60 / D10
Coarse Gravel < 3" and > 3/4" Medium Sand < #10 and > #40 Cc = (D30)^2 / (D10 x D60)
Fine Gravel < 3/4" and > #4 Fine Sand < #40 and > #200
BORING # CB-1 SAMPLE # 1 Depth (feet) 0.2-1.5
SOIL DESCRIPTION:
Natural Moisture Conte 10.7%
Brown Slightly Silty Fine to Medium SAND with Some Limerock Fragments (FILL; A-1-b)
3" 2" 1.5" 1" 3/4" 3/8" #4 #10 #40 #60 #100 #200
0.00
10.00
20.00
30.00
40.00
50.00
60.00
70.00
80.00
90.00
100.00
0.0010.010.1110100
PE
RC
EN
T P
AS
SIN
G
GRAIN SIZE in millimeters
GRAIN SIZE DISTRIBUTION CURVE
3" 2" 1.5" 1" 3/4" 3/8" #4 #10 #40 #60 #100 #200
0.00
10.00
20.00
30.00
40.00
50.00
60.00
70.00
80.00
90.00
100.00
0.0010.010.1110100
PE
RC
EN
T P
AS
SIN
G
GRAIN SIZE in millimeters
GRAIN SIZE DISTRIBUTION CURVE

GRAIN SIZE DATA SHEET
DATE: 1/29/2015
PROJECT NAME: SFRTA WAVE MODERN STREETCAR – PHASE 1CGEOSOL PROJECT No. 214197
GENERAL LOCATION: BROWARD COUNTY, FLORIDA
Boring No. CB-6Sample No. 2Depth (feet) 2-4
SOIL DESCRIPTION:
Tare # Dry Wt. - Tare Wt.
101 340.0
Sieve Size Sieve SizesCumulativ
e Wt. Retained
% RETAINED % PASSING% PASSING
TOTAL SAMPLE
WEIGHT RETAINED (Grams)
75 75mm 3" 0.0 0.0 100 100 0.050 50mm 2" 0.0 0.0 100 100 0.0
37.5 37.5mm 1.5" 0.0 0.0 100.0 100.0 0.025 25mm 1" 0.0 0.0 100.0 100.0 0.019 19mm 3/4" 0.0 0.0 100.0 100.0 0.09.5 9.5mm 3/8" 0.0 0.0 100.0 100.0 0.0
4.75 4.75mm #4 0.0 0.0 100.0 100.0 0.02.36 2 mm #10 0.0 0.0 100.0 100.0 0.00.6 425um #40 41.0 12.1 87.9 87.9 41.00.3 250um #60 315.5 92.8 7.2 7.2 274.5
0.15 150um #100 335.0 98.5 1.5 1.5 19.50.075 75um #200 337.5 99.3 0.7 0.7 2.5PAN - 340.0 100.0 0.0 0.0 2.5
NOTES: Percent passing the #200 sieve was determined by the wash method.
ASTM D 2487 Classification of Soil for Engineering Pur Coarse Sand < #4 and > #10 Cu = D60 / D10
Coarse Gravel < 3" and > 3/4" Medium Sand < #10 and > #40 Cc = (D30)^2 / (D10 x D60)
Fine Gravel < 3/4" and > #4 Fine Sand < #40 and > #200 1000 um = 1 mm
tested by: J. Gonzalez omputed by: S. Zhang checked by: O. Riccobono
Brown Fine to Medium SAND (A-3)

GRAIN SIZE DATA SHEETDATE: 1/29/2015
PROJECT NAME: SFRTA WAVE MODERN STREETCAR – PHASE 1C
GEOSOL PROJECT No. 214197GENERAL LOCATION: BROWARD COUNTY, FLORIDA
ASTM D 2487 Classification of Soil for Engineering Pur Coarse Sand < #4 and > #10 Cu = D60 / D10
Coarse Gravel < 3" and > 3/4" Medium Sand < #10 and > #40 Cc = (D30)^2 / (D10 x D60)
Fine Gravel < 3/4" and > #4 Fine Sand < #40 and > #200
BORING # CB-6 SAMPLE # 2 Depth (feet) 2-4
SOIL DESCRIPTION:
Natural Moisture Conte 12.5%
Brown Fine to Medium SAND (A-3)
3" 2" 1.5" 1" 3/4" 3/8" #4 #10 #40 #60 #100 #200
0.00
10.00
20.00
30.00
40.00
50.00
60.00
70.00
80.00
90.00
100.00
0.0010.010.1110100
PE
RC
EN
T P
AS
SIN
G
GRAIN SIZE in millimeters
GRAIN SIZE DISTRIBUTION CURVE
3" 2" 1.5" 1" 3/4" 3/8" #4 #10 #40 #60 #100 #200
0.00
10.00
20.00
30.00
40.00
50.00
60.00
70.00
80.00
90.00
100.00
0.0010.010.1110100
PE
RC
EN
T P
AS
SIN
G
GRAIN SIZE in millimeters
GRAIN SIZE DISTRIBUTION CURVE

GRAIN SIZE DATA SHEET
DATE: 1/30/2015
PROJECT NAME: SFRTA WAVE MODERN STREETCAR – PHASE 1CGEOSOL PROJECT No. 214197
GENERAL LOCATION: BROWARD COUNTY, FLORIDA
Boring No. CB-7Sample No. 7Depth (feet) 18-20
SOIL DESCRIPTION:
Tare # Dry Wt. - Tare Wt.
12 332.5
Sieve Size Sieve SizesCumulativ
e Wt. Retained
% RETAINED % PASSING% PASSING
TOTAL SAMPLE
WEIGHT RETAINED (Grams)
75 75mm 3" 0.0 0.0 100 100 0.050 50mm 2" 0.0 0.0 100 100 0.0
37.5 37.5mm 1.5" 0.0 0.0 100.0 100.0 0.025 25mm 1" 59.5 17.9 82.1 82.1 59.519 19mm 3/4" 78.0 23.5 76.5 76.5 18.59.5 9.5mm 3/8" 110.5 33.2 66.8 66.8 32.5
4.75 4.75mm #4 134.0 40.3 59.7 59.7 23.52.36 2 mm #10 144.5 43.5 56.5 56.5 10.50.6 425um #40 166.0 49.9 50.1 50.1 21.50.3 250um #60 194.5 58.5 41.5 41.5 28.5
0.15 150um #100 270.5 81.4 18.6 18.6 76.00.075 75um #200 292.0 87.8 12.2 12.2 21.5PAN - 332.5 100.0 0.0 0.0 40.5
NOTES: Percent passing the #200 sieve was determined by the wash method.
ASTM D 2487 Classification of Soil for Engineering Pur Coarse Sand < #4 and > #10 Cu = D60 / D10
Coarse Gravel < 3" and > 3/4" Medium Sand < #10 and > #40 Cc = (D30)^2 / (D10 x D60)
Fine Gravel < 3/4" and > #4 Fine Sand < #40 and > #200 1000 um = 1 mm
tested by: J. Gonzalez omputed by: S. Zhang checked by: O. Riccobono
Brown Silty Fine SAND and Limestone Fragments (A-2-4)

GRAIN SIZE DATA SHEETDATE: 1/30/2015
PROJECT NAME: SFRTA WAVE MODERN STREETCAR – PHASE 1C
GEOSOL PROJECT No. 214197GENERAL LOCATION: BROWARD COUNTY, FLORIDA
ASTM D 2487 Classification of Soil for Engineering Pur Coarse Sand < #4 and > #10 Cu = D60 / D10
Coarse Gravel < 3" and > 3/4" Medium Sand < #10 and > #40 Cc = (D30)^2 / (D10 x D60)
Fine Gravel < 3/4" and > #4 Fine Sand < #40 and > #200
BORING # CB-7 SAMPLE # 7 Depth (feet) 18-20
SOIL DESCRIPTION:
Natural Moisture Conte 15.3%
Brown Silty Fine SAND and Limestone Fragments (A-2-4)
3" 2" 1.5" 1" 3/4" 3/8" #4 #10 #40 #60 #100 #200
0.00
10.00
20.00
30.00
40.00
50.00
60.00
70.00
80.00
90.00
100.00
0.0010.010.1110100
PE
RC
EN
T P
AS
SIN
G
GRAIN SIZE in millimeters
GRAIN SIZE DISTRIBUTION CURVE
3" 2" 1.5" 1" 3/4" 3/8" #4 #10 #40 #60 #100 #200
0.00
10.00
20.00
30.00
40.00
50.00
60.00
70.00
80.00
90.00
100.00
0.0010.010.1110100
PE
RC
EN
T P
AS
SIN
G
GRAIN SIZE in millimeters
GRAIN SIZE DISTRIBUTION CURVE

GRAIN SIZE DATA SHEET
DATE: 1/30/2015
PROJECT NAME: SFRTA WAVE MODERN STREETCAR – PHASE 1CGEOSOL PROJECT No. 214197
GENERAL LOCATION: BROWARD COUNTY, FLORIDA
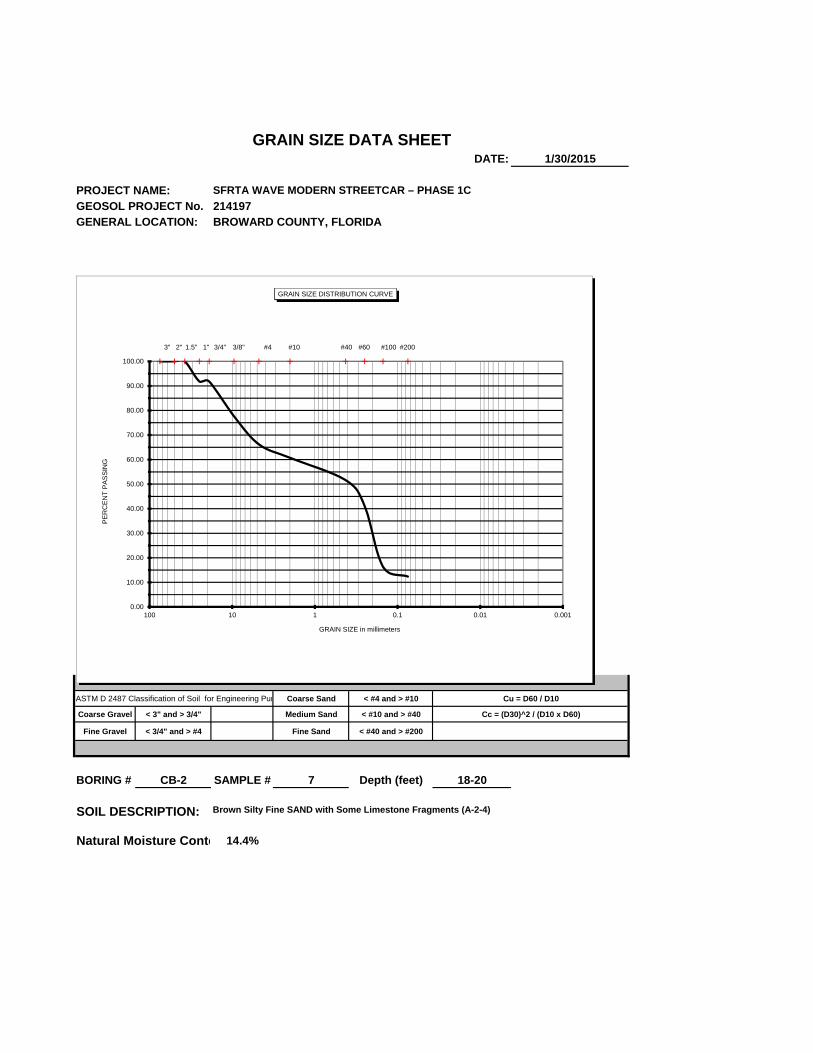
Boring No. CB-2Sample No. 7Depth (feet) 18-20
SOIL DESCRIPTION:
Tare # Dry Wt. - Tare Wt.
239 275.0
Sieve Size Sieve SizesCumulativ
e Wt. Retained
% RETAINED % PASSING% PASSING
TOTAL SAMPLE
WEIGHT RETAINED (Grams)
75 75mm 3" 0.0 0.0 100 100 0.050 50mm 2" 0.0 0.0 100 100 0.0
37.5 37.5mm 1.5" 0.0 0.0 100.0 100.0 0.025 25mm 1" 22.5 8.2 91.8 91.8 22.519 19mm 3/4" 22.5 8.2 91.8 91.8 0.09.5 9.5mm 3/8" 61.5 22.4 77.6 77.6 39.0
4.75 4.75mm #4 93.0 33.8 66.2 66.2 31.52.36 2 mm #10 108.0 39.3 60.7 60.7 15.00.6 425um #40 133.0 48.4 51.6 51.6 25.00.3 250um #60 162.0 58.9 41.1 41.1 29.0
0.15 150um #100 230.0 83.6 16.4 16.4 68.00.075 75um #200 241.0 87.6 12.4 12.4 11.0PAN - 275.0 100.0 0.0 0.0 34.0
NOTES: Percent passing the #200 sieve was determined by the wash method.
ASTM D 2487 Classification of Soil for Engineering Pur Coarse Sand < #4 and > #10 Cu = D60 / D10
Coarse Gravel < 3" and > 3/4" Medium Sand < #10 and > #40 Cc = (D30)^2 / (D10 x D60)
Fine Gravel < 3/4" and > #4 Fine Sand < #40 and > #200 1000 um = 1 mm
tested by: J. Gonzalez omputed by: S. Zhang checked by: O. Riccobono
Brown Silty Fine SAND with Some Limestone Fragments (A-2-4)
GRAIN SIZE DATA SHEETDATE: 1/30/2015
PROJECT NAME: SFRTA WAVE MODERN STREETCAR – PHASE 1C
GEOSOL PROJECT No. 214197GENERAL LOCATION: BROWARD COUNTY, FLORIDA
ASTM D 2487 Classification of Soil for Engineering Pur Coarse Sand < #4 and > #10 Cu = D60 / D10
Coarse Gravel < 3" and > 3/4" Medium Sand < #10 and > #40 Cc = (D30)^2 / (D10 x D60)
Fine Gravel < 3/4" and > #4 Fine Sand < #40 and > #200
BORING # CB-2 SAMPLE # 7 Depth (feet) 18-20
SOIL DESCRIPTION:
Natural Moisture Conte 14.4%
Brown Silty Fine SAND with Some Limestone Fragments (A-2-4)
3" 2" 1.5" 1" 3/4" 3/8" #4 #10 #40 #60 #100 #200
0.00
10.00
20.00
30.00
40.00
50.00
60.00
70.00
80.00
90.00
100.00
0.0010.010.1110100
PE
RC
EN
T P
AS
SIN
G
GRAIN SIZE in millimeters
GRAIN SIZE DISTRIBUTION CURVE
3" 2" 1.5" 1" 3/4" 3/8" #4 #10 #40 #60 #100 #200
0.00
10.00
20.00
30.00
40.00
50.00
60.00
70.00
80.00
90.00
100.00
0.0010.010.1110100
PE
RC
EN
T P
AS
SIN
G
GRAIN SIZE in millimeters
GRAIN SIZE DISTRIBUTION CURVE

GRAIN SIZE DATA SHEET
DATE: 1/29/2015
PROJECT NAME: SFRTA WAVE MODERN STREETCAR – PHASE 1CGEOSOL PROJECT No. 214197
GENERAL LOCATION: BROWARD COUNTY, FLORIDA
Boring No. CB-8Sample No. 1Depth (feet) 0.2-2
SOIL DESCRIPTION:
Tare # Dry Wt. - Tare Wt.
863 142.0
Sieve Size Sieve SizesCumulativ
e Wt. Retained
% RETAINED % PASSING% PASSING
TOTAL SAMPLE
WEIGHT RETAINED (Grams)
75 75mm 3" 0.0 0.0 100 100 0.050 50mm 2" 0.0 0.0 100 100 0.0
37.5 37.5mm 1.5" 0.0 0.0 100.0 100.0 0.025 25mm 1" 0.0 0.0 100.0 100.0 0.019 19mm 3/4" 0.0 0.0 100.0 100.0 0.09.5 9.5mm 3/8" 0.0 0.0 100.0 100.0 0.0
4.75 4.75mm #4 0.0 0.0 100.0 100.0 0.02.36 2 mm #10 2.5 1.8 98.2 98.2 2.50.6 425um #40 22.5 15.8 84.2 84.2 20.00.3 250um #60 117.0 82.4 17.6 17.6 94.5
0.15 150um #100 135.5 95.4 4.6 4.6 18.50.075 75um #200 137.0 96.5 3.5 3.5 1.5PAN - 142.0 100.0 0.0 0.0 5.0
NOTES: Percent passing the #200 sieve was determined by the wash method.
ASTM D 2487 Classification of Soil for Engineering Pur Coarse Sand < #4 and > #10 Cu = D60 / D10
Coarse Gravel < 3" and > 3/4" Medium Sand < #10 and > #40 Cc = (D30)^2 / (D10 x D60)
Fine Gravel < 3/4" and > #4 Fine Sand < #40 and > #200 1000 um = 1 mm
tested by: J. Gonzalez omputed by: S. Zhang checked by: O. Riccobono
Brown Fine to Medium SAND (FILL; A-3)

GRAIN SIZE DATA SHEETDATE: 1/29/2015
PROJECT NAME: SFRTA WAVE MODERN STREETCAR – PHASE 1C
GEOSOL PROJECT No. 214197GENERAL LOCATION: BROWARD COUNTY, FLORIDA
ASTM D 2487 Classification of Soil for Engineering Pur Coarse Sand < #4 and > #10 Cu = D60 / D10
Coarse Gravel < 3" and > 3/4" Medium Sand < #10 and > #40 Cc = (D30)^2 / (D10 x D60)
Fine Gravel < 3/4" and > #4 Fine Sand < #40 and > #200
BORING # CB-8 SAMPLE # 1 Depth (feet) 0.2-2
SOIL DESCRIPTION:
Natural Moisture Conte 7.4%
Brown Fine to Medium SAND (FILL; A-3)
3" 2" 1.5" 1" 3/4" 3/8" #4 #10 #40 #60 #100 #200
0.00
10.00
20.00
30.00
40.00
50.00
60.00
70.00
80.00
90.00
100.00
0.0010.010.1110100
PE
RC
EN
T P
AS
SIN
G
GRAIN SIZE in millimeters
GRAIN SIZE DISTRIBUTION CURVE
3" 2" 1.5" 1" 3/4" 3/8" #4 #10 #40 #60 #100 #200
0.00
10.00
20.00
30.00
40.00
50.00
60.00
70.00
80.00
90.00
100.00
0.0010.010.1110100
PE
RC
EN
T P
AS
SIN
G
GRAIN SIZE in millimeters
GRAIN SIZE DISTRIBUTION CURVE

GRAIN SIZE DATA SHEET
DATE: 1/29/2015
PROJECT NAME: SFRTA WAVE MODERN STREETCAR – PHASE 1CGEOSOL PROJECT No. 214197
GENERAL LOCATION: BROWARD COUNTY, FLORIDA
Boring No. CB-4Sample No. 2Depth (feet) 2-4
SOIL DESCRIPTION:
Tare # Dry Wt. - Tare Wt.
4 159.0
Sieve Size Sieve SizesCumulativ
e Wt. Retained
% RETAINED % PASSING% PASSING
TOTAL SAMPLE
WEIGHT RETAINED (Grams)
75 75mm 3" 0.0 0.0 100 100 0.050 50mm 2" 0.0 0.0 100 100 0.0
37.5 37.5mm 1.5" 0.0 0.0 100.0 100.0 0.025 25mm 1" 0.0 0.0 100.0 100.0 0.019 19mm 3/4" 0.0 0.0 100.0 100.0 0.09.5 9.5mm 3/8" 1.5 0.9 99.1 99.1 1.5
4.75 4.75mm #4 2.0 1.3 98.7 98.7 0.52.36 2 mm #10 4.0 2.5 97.5 97.5 2.00.6 425um #40 33.0 20.8 79.2 79.2 29.00.3 250um #60 150.0 94.3 5.7 5.7 117.0
0.15 150um #100 157.0 98.7 1.3 1.3 7.00.075 75um #200 157.0 98.7 1.3 1.3 0.0PAN - 159.0 100.0 0.0 0.0 2.0
NOTES: Percent passing the #200 sieve was determined by the wash method.
ASTM D 2487 Classification of Soil for Engineering Pur Coarse Sand < #4 and > #10 Cu = D60 / D10
Coarse Gravel < 3" and > 3/4" Medium Sand < #10 and > #40 Cc = (D30)^2 / (D10 x D60)
Fine Gravel < 3/4" and > #4 Fine Sand < #40 and > #200 1000 um = 1 mm
tested by: J. Gonzalez omputed by: S. Zhang checked by: O. Riccobono
Brown Fine to Medium SAND (A-3)

GRAIN SIZE DATA SHEETDATE: 1/29/2015
PROJECT NAME: SFRTA WAVE MODERN STREETCAR – PHASE 1C
GEOSOL PROJECT No. 214197GENERAL LOCATION: BROWARD COUNTY, FLORIDA
ASTM D 2487 Classification of Soil for Engineering Pur Coarse Sand < #4 and > #10 Cu = D60 / D10
Coarse Gravel < 3" and > 3/4" Medium Sand < #10 and > #40 Cc = (D30)^2 / (D10 x D60)
Fine Gravel < 3/4" and > #4 Fine Sand < #40 and > #200
BORING # CB-4 SAMPLE # 2 Depth (feet) 2-4
SOIL DESCRIPTION:
Natural Moisture Conte 12.3%
Brown Fine to Medium SAND (A-3)
3" 2" 1.5" 1" 3/4" 3/8" #4 #10 #40 #60 #100 #200
0.00
10.00
20.00
30.00
40.00
50.00
60.00
70.00
80.00
90.00
100.00
0.0010.010.1110100
PE
RC
EN
T P
AS
SIN
G
GRAIN SIZE in millimeters
GRAIN SIZE DISTRIBUTION CURVE
3" 2" 1.5" 1" 3/4" 3/8" #4 #10 #40 #60 #100 #200
0.00
10.00
20.00
30.00
40.00
50.00
60.00
70.00
80.00
90.00
100.00
0.0010.010.1110100
PE
RC
EN
T P
AS
SIN
G
GRAIN SIZE in millimeters
GRAIN SIZE DISTRIBUTION CURVE
GRAIN SIZE DATA SHEET
DATE: 2/3/2015
PROJECT NAME: SFRTA WAVE MODERN STREETCAR – PHASE 1CGEOSOL PROJECT No. 214197
GENERAL LOCATION: BROWARD COUNTY, FLORIDA
Boring No. CB-9Sample No. 5Depth (feet) 8-10
SOIL DESCRIPTION:
Tare # Dry Wt. - Tare Wt.
941 283.5
Sieve Size Sieve SizesCumulativ
e Wt. Retained
% RETAINED % PASSING% PASSING
TOTAL SAMPLE
WEIGHT RETAINED (Grams)
75 75mm 3" 0.0 0.0 100 100 0.050 50mm 2" 0.0 0.0 100 100 0.0
37.5 37.5mm 1.5" 0.0 0.0 100.0 100.0 0.025 25mm 1" 22.0 7.8 92.2 92.2 22.019 19mm 3/4" 41.0 14.5 85.5 85.5 19.09.5 9.5mm 3/8" 81.0 28.6 71.4 71.4 40.0
4.75 4.75mm #4 102.0 36.0 64.0 64.0 21.02.36 2 mm #10 113.5 40.0 60.0 60.0 11.50.6 425um #40 136.5 48.1 51.9 51.9 23.00.3 250um #60 201.5 71.1 28.9 28.9 65.0
0.15 150um #100 234.5 82.7 17.3 17.3 33.00.075 75um #200 249.0 87.8 12.2 12.2 14.5PAN - 283.5 100.0 0.0 0.0 34.5
NOTES: Percent passing the #200 sieve was determined by the wash method.
ASTM D 2487 Classification of Soil for Engineering Pur Coarse Sand < #4 and > #10 Cu = D60 / D10
Coarse Gravel < 3" and > 3/4" Medium Sand < #10 and > #40 Cc = (D30)^2 / (D10 x D60)
Fine Gravel < 3/4" and > #4 Fine Sand < #40 and > #200 1000 um = 1 mm
tested by: J. Gonzalez omputed by: S. Zhang checked by: O. Riccobono
Brown Silty Fine SAND and Limestone Fragments (A-2-4)

GRAIN SIZE DATA SHEETDATE: 2/3/2015
PROJECT NAME: SFRTA WAVE MODERN STREETCAR – PHASE 1C
GEOSOL PROJECT No. 214197GENERAL LOCATION: BROWARD COUNTY, FLORIDA
ASTM D 2487 Classification of Soil for Engineering Pur Coarse Sand < #4 and > #10 Cu = D60 / D10
Coarse Gravel < 3" and > 3/4" Medium Sand < #10 and > #40 Cc = (D30)^2 / (D10 x D60)
Fine Gravel < 3/4" and > #4 Fine Sand < #40 and > #200
BORING # CB-9 SAMPLE # 5 Depth (feet) 8-10
SOIL DESCRIPTION:
Natural Moisture Conte 17.3%
Brown Silty Fine SAND and Limestone Fragments (A-2-4)
3" 2" 1.5" 1" 3/4" 3/8" #4 #10 #40 #60 #100 #200
0.00
10.00
20.00
30.00
40.00
50.00
60.00
70.00
80.00
90.00
100.00
0.0010.010.1110100
PE
RC
EN
T P
AS
SIN
G
GRAIN SIZE in millimeters
GRAIN SIZE DISTRIBUTION CURVE
3" 2" 1.5" 1" 3/4" 3/8" #4 #10 #40 #60 #100 #200
0.00
10.00
20.00
30.00
40.00
50.00
60.00
70.00
80.00
90.00
100.00
0.0010.010.1110100
PE
RC
EN
T P
AS
SIN
G
GRAIN SIZE in millimeters
GRAIN SIZE DISTRIBUTION CURVE

PROJECT NAME: SFRTA WAVE MODERN STREETCAR – PHASE 1CLOCATION: BROWARD COUNTY, FLORIDAPROJECT No.: 214197DATE: 1/16/15
Boring No. CB-6 CB-8 CB-9 CB-5Sample No. 4 4 4 1Sample Depth (Feet) 6-8 6-8 6-8 0-0.2Crucible No. BN SN BO BOWeight of Crucible and Oven-Dried Sample (grams) 149.5 73.0 107.0 102.5Weight of Crucible and Sample after Ignition (grams) 148.5 72.0 106.0 98.0Weight of Crucible (grams) 64.5 28.0 57.5 66.0Weight of Oven-Dried Soil (grams) 85.0 45.0 49.5 36.5Weight Loss due to Ignition (grams) 1.0 1.0 1.0 4.5Percent Organics (%) 1.2 2.2 2.0 12.3
ORGANIC CONTENT TEST RESULTS (ASTM D-2974)

#=AR#
ANALYTICAL RESULTS
Pace Project No.:Project:
35171970Wave Street Car for Phase 1C
Sample: CB-1 Lab ID: 35171970001 Collected: 01/16/15 17:00 Received: 01/20/15 17:00 Matrix: SolidResults reported on a "dry-weight" basis
Parameters Results Units DF Prepared Analyzed CAS No. QualMDLPQL
Analytical Method: ASTM D2974-87Percent Moisture
Percent Moisture 94.1 % 01/26/15 08:530.10 0.10 1
Analytical Method: EPA 120.1 ResistivityResistivity
Resistivity 2420 ohms-cm 01/21/15 16:201
Analytical Method: EPA 90459045 pH Soil
pH at 25 Degrees C 7.9 Std. Units 01/21/15 09:25 Q0.10 0.10 1
Analytical Method: EPA 90569056 IC Anions
Chloride 2070 U mg/kg 01/24/15 15:33 16887-00-6 D34150 2070 5Sulfate 2070 U mg/kg 01/24/15 15:33 14808-79-84150 2070 5
REPORT OF LABORATORY ANALYSISThis report shall not be reproduced, except in full,
without the written consent of Pace Analytical Services, Inc..Date: 01/27/2015 02:59 PM
Pace Analytical Services, Inc.3610 Park Central Blvd N
Pompano Beach, FL 33064954-582-4300
Page 5 of 13
500U 500U
500 500

APPENDIX “C”
Table 4 – Summary of In-Situ Soil Resistivity Testing Results In-Situ Soil Resistivity Test Schematics
Typical Site Photograph

SFRTA THE WAVE MODERN STREETCAR - PHASE 1CBROWARD COUNTY, FLORIDAGEOSOL PROJECT No. 214197
No. (ohm) (ft) (cm) (ohm.cm)240.0 2.5 76.0 114,576.0115.0 5.0 151.9 109,802.075.0 7.5 227.9 107,415.051.0 10.0 303.8 97,389.680.0 2.5 76.0 38,192.045.0 5.0 151.9 42,966.022.0 7.5 227.9 31,508.413.0 10.0 303.8 24,824.899.0 2.5 76.0 47,262.633.0 5.0 151.9 31,508.416.0 7.5 227.9 22,915.28.3 10.0 303.8 15,849.7
250.0 2.5 76.0 119,350.0110.0 5.0 151.9 105,028.044.0 7.5 227.9 63,016.824.0 10.0 303.8 45,830.4
Notes: The resistivity values were calculated per the 4-point Wenner method, and in general conformance with ASTM G57-06, as:· ρ = 2 π S R, where: ρ is the earth’s average resistivity at depth equal to S (ohm.cm) S is the electrode spacing (cm) R is the resistance value measured using the 4-point Wenner method (ohm)
CR-4
TABLE 4 - SUMMARY OF IN-SITU SOIL RESISTIVITY TESTING RESULTS
CR-3
RESISTANCE (R) RESISTIVITY (ρ)SPACING (S) SPACING (S)
CR-1
TEST
CR-2
214197 Table 4 - Resistivity Test Results.xls 1 of 1


APPENDIX “D”
FHWA Checklist