southern pine beetle - south carolina · 1 spb is one of the most destructive insects to southern...
TRANSCRIPT
1
SOUTHERN PINE BEETLEPHEROMONE TRAPPING REPORT, 2017

1
SPB is one of the most destructive insects to southern yellow pine. In order to monitor their population and potential damage, the SC Forestry Commission has been conducting annual spring pheromone trapping since 1986. For 2017, a total 32 SC counties (11 in the coastal plain and 21 in the piedmont) were trapped for SPB using revised protocol devised by Billings, et al, 2017. This methodology uses the number of SPB and clerid (SPB’s main predator) caught per trap per day and the percent SPB catch.
Based on our results, we predict no counties within the coastal plain to experience SPB Activity, and only Oconee and Pickens to experience significant SPB activity within the piedmont, although their activity is considered Static and Moderate. The statewide and regional SPB averages are still considered declining-low. Most bark beetle activity statewide is still likely to be from Ips and Black turpentine Beetle (BTB). Outside of Pickens and Oconee counties, the clerid population has begun to increase within the piedmont, but its population is still low within the coastal plain. In addition to the pheromone trapping, past and predicted weather plays a role in predicting SPB activity as well. SPB activity is enhanced during mild winters and reduced during summer temperatures above 100 degrees Fahrenheit. Pines are also more at risk to SPB attack when under drought stress. Not including the northwestern piedmont, last summer experienced several days with temperatures above 100F, and this past winter was mild for the whole state. The northwestern part of the piedmont is currently in severe drought status, and average rainfall and above average temperatures are forecasted statewide for the 2017 summer. An Increased clerid population and average rainfall in the piedmont should reduce Ips and BTB activity when compared to what was seen in 2016 and also reduce the possibility, along with high summer temperatures, of SPB dispersal from Pickens and Oconee counties. A decreased clerid population within the coastal plain may allow Ips and BTB activity to increase if it receives below average
rainfall and above average temperatures. The population of SPB is still historically low, but the population is beginning to stabilize and possibly rise. Even though SPB numbers are still historically low, we encourage landowners to actively manage their pine stands since managed stands are less likely to suffer loss to SPB and other bark beetles during outbreaks.
EXECUTIVE SUMMARY
Pheromone traps were placed in 32 counties in South Carolina in 2017.
Photo by Erich G. Vallery (USDA Forest Service - SRS-4552, Bugwood.org)

2
Introduction and MethodologyA total of 32 SC counties (11 in the coastal plain and 21 in the piedmont) were trapped for SPB in 2017 using revised protocol devised by Billings, et al, 2017. The previous protocol called for two attractants per trap: Frontalin and alpha pinene (Sirex lure), and the revised protocol called for an additional third attractant, endo-brevicomin, to be placed 10-12’ away. In prior studies, the addition of the third attractant has been found on average to be 6.54X more attractive to SPB and .97X less attractive to clerid (SPB’s main insect predator) when compared to using Frontalin and Sirex alone. The increased attractiveness to SPB caused the SPB Prediction Chart to be revised as well. In addition to the revised protocol, Edgefield, McCormick and Pickens counties participated in a study comparing three different attractant combinations. One was the combination used in the revised protocol, which was included in our analysis. Everything else within the protocol stayed the same. The protocol includes monitoring three (3) pheromone traps in each county for a 28-day period during
early spring. Insects captured in each trap are returned to the laboratory for analysis. The total number of trap days and SPB and clerid beetles caught are summed for each trap. The average number of SPB caught per trap per day and percent SPB are used for a population prediction trend for each county and region and for the whole state. In the past, such surveys have had a success rate of over 80% in predicting the degree of SPB infestation during the following summer. Last year we predicted little to no losses in all trapped counties. For SPB this held true, but with a persistent drought, low clerid population, and high temperatures, many counties along the Georgia border, especially McCormick, suffered an outbreak of Ips beetles.
ResultsBased on these trapping results and the SPB Prediction Chart on Page 5, we predict no counties within the coastal plain will experience significant SPB activity and only Oconee and Pickens counties within the piedmont to experience significant SPB activity, but their predictions are still
SPBPHEROMONE TRAPPING REPORT
Photo by USDA Forest Service - Region 8 - Southern (USDA Forest Service, Bugwood.org)
SCFC’s 2017 SPB Pheromone Trap Locations and Prediction Status in Relation to SC’s SPB Risk Map
SPB is a major pest of Southern Yellow Pine (SYP). The last outbreak of 2000-02 caused over $350 million worth of SYP loss in SC. In order to predict the annual severity of SYP loss to SPB, each spring 3 SPB pheromone traps are placed within counties having historical loss to SPB. The total number of Trap Days and SPB and Clerids (their main insect predator) caught are summed for each trap and county. Percent SPB caught and average number of SPB caught per Trap Day are used for the prediction status of trap locations and counties.
Data Credits: Trap Locations, SC Forestry Commission; and SC SPBRisk Map, USFS’ Forest Health Technology Enterprise Team (FHTET).
Severe Outbreak Increasing or High Static or Moderate Declining or Low
Trap Locations and Prediction Status SPB Hazard Rating
Little or none Low Moderate Moderate/High
High Very High Urban Water
3
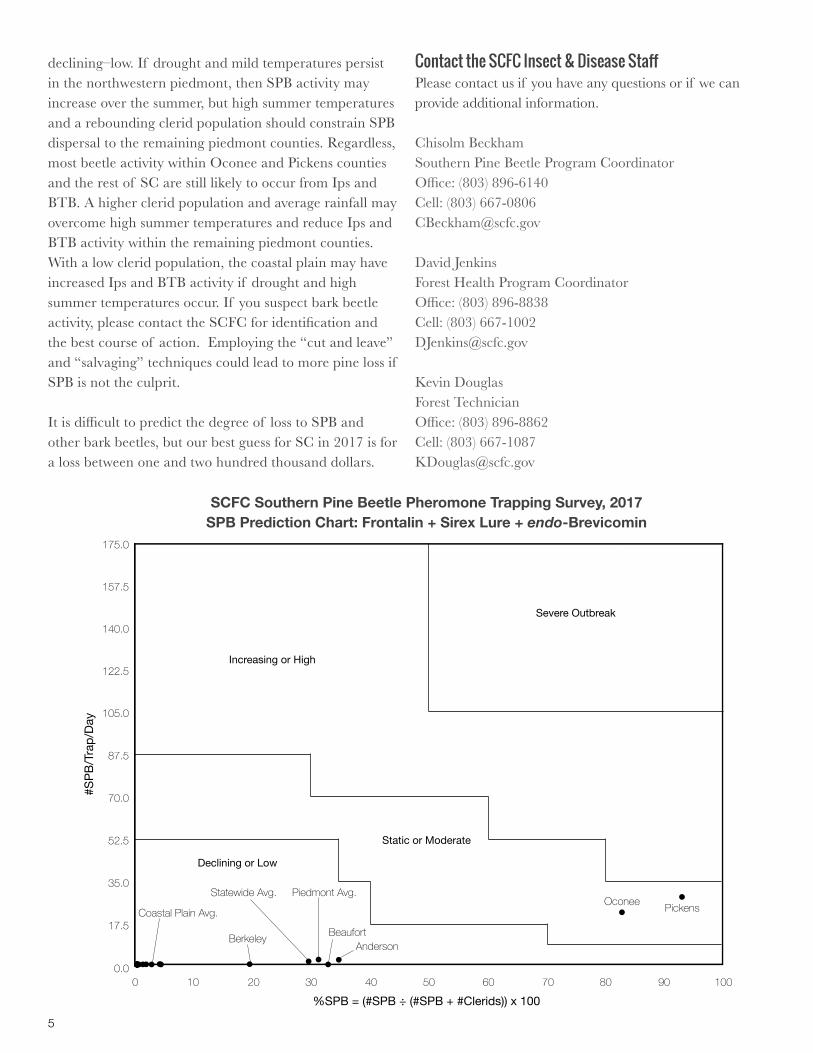
considered Static and Moderate. The statewide and regional average predictions are still considered declining–low. The statewide SPB caught per trap per day was 1.14 and only made up 30% of the total catch. This is a significant increase when compared to last year’s 0.14 and 12%. However, when comparing to last year’s, the addition of endo-brevicomin increases attractiveness on average by 6.54X, making this year’s catch probably closer to 0.17 (1.14/6.54) and 6% (2,779/6.54)/((2779/6.54)+6,506). The decrease in this year’s SPB percent catch is due to clerids increasing by 215%. Pickens and Oconee counties are an outlier as they represent 93.5% of the SPB and 5.7% of the clerid caught. The remaining piedmont counties caught 5.9% of the SPB and 86.0% of the clerid. The coastal plain only caught 0.5% of the SPB and 8.3% of the Clerid. These trapping data results are for entire counties, and there is always the possibility of sporadic and localized beetle activity in counties with overall predictions of low population levels. For specific results per county, please refer to the 2017 Pheromone Trapping Results on Page 6.
Review of 2016 During the 2016 summer, we had several days in which the temperature exceeded 100 degrees Fahrenheit and a persistent drought within the western half of the state, and this past winter’s temperatures were mild. Extended temperatures above 100 degrees Fahrenheit constrain SPB development and mild winter temperatures enhance it. SPB being able to rebound in the northwestern piedmont is possibly due to tree stress from persistent drought, slightly milder summer temperatures, last year’s low clerid population (lowest on record), and mild winter temperatures. The higher summer temperatures within the southwestern piedmont possibly constrained SPB development while allowing Ips populations to thrive. Within McCormick county and portions of surrounding counties, including counties within Georgia, we experienced an Ips alvulsus (small Ips) outbreak during the end of the 2016 summer. Most of these spots were within young, un-thinned loblolly pine plantations and situated within them either at the bottom or top of the slope, where drought stress is most severe.
SC’s 2017 Bark Beetle PredictionPredicting SC Bark Beetle activity for the summer of 2017 will be largely based on current and predicted weather, current drought status per region, and SC’s 2017 pheromone trapping data. For the 2017 summer
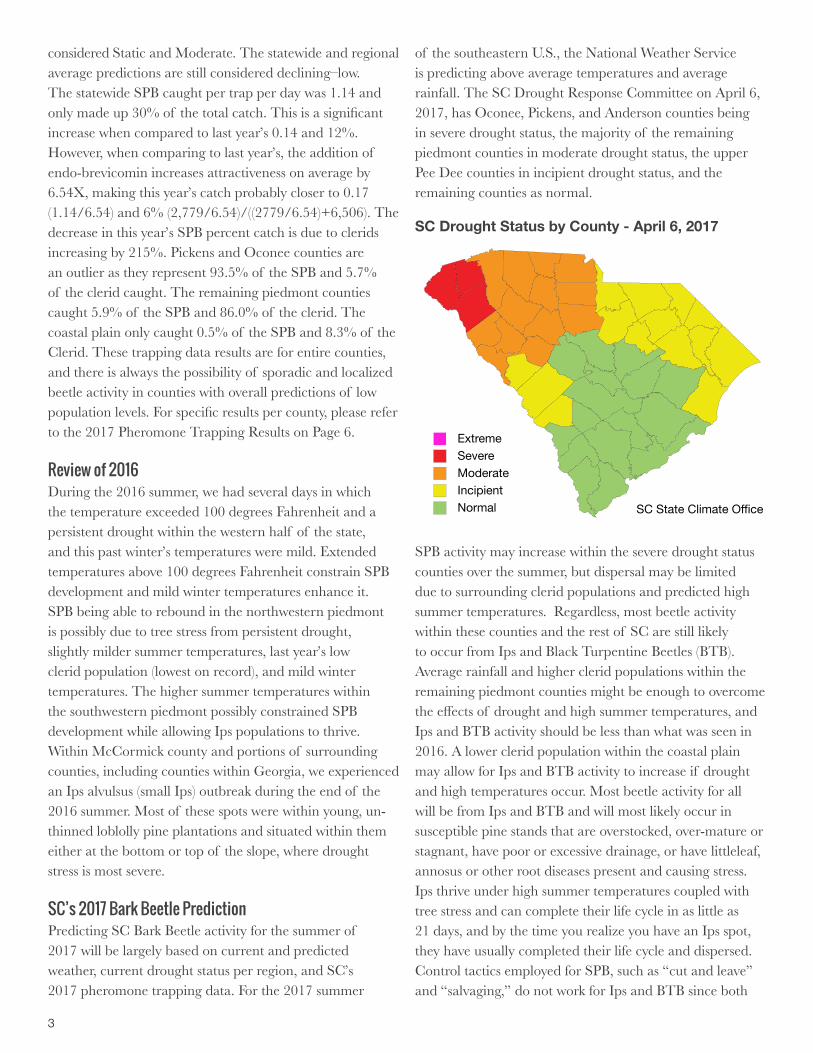
of the southeastern U.S., the National Weather Service is predicting above average temperatures and average rainfall. The SC Drought Response Committee on April 6, 2017, has Oconee, Pickens, and Anderson counties being in severe drought status, the majority of the remaining piedmont counties in moderate drought status, the upper Pee Dee counties in incipient drought status, and the remaining counties as normal.
SPB activity may increase within the severe drought status counties over the summer, but dispersal may be limited due to surrounding clerid populations and predicted high summer temperatures. Regardless, most beetle activity within these counties and the rest of SC are still likely to occur from Ips and Black Turpentine Beetles (BTB). Average rainfall and higher clerid populations within the remaining piedmont counties might be enough to overcome the effects of drought and high summer temperatures, and Ips and BTB activity should be less than what was seen in 2016. A lower clerid population within the coastal plain may allow for Ips and BTB activity to increase if drought and high temperatures occur. Most beetle activity for all will be from Ips and BTB and will most likely occur in susceptible pine stands that are overstocked, over-mature or stagnant, have poor or excessive drainage, or have littleleaf, annosus or other root diseases present and causing stress. Ips thrive under high summer temperatures coupled with tree stress and can complete their life cycle in as little as 21 days, and by the time you realize you have an Ips spot, they have usually completed their life cycle and dispersed. Control tactics employed for SPB, such as “cut and leave” and “salvaging,” do not work for Ips and BTB since both
SC Drought Status by County - April 6, 2017
Extreme Severe Moderate Incipient Normal SC State Climate Office

4
readily breed in cut pine tops, boles and stumps. During a summer thinning, we recommend all pine tops to be chipped and removed from site or at least kept at the logging deck. For more information on either beetle, please follow this link: http://www.state.sc.us/forest/idbeetles.pdf
SC’s SPB Population TrendThe long-term SC and southeast regional SPB population decline since the 2000-02 outbreak has puzzled both forest entomologists and forest health specialists. The prevailing theory is that there is a lack of available resources (older pine stands) distributed across the landscape. This theory is further supported by the recent Mountain Pine Beetle outbreaks in Colorado and Wyoming and the SPB outbreaks in southern New Jersey and Long Island, New York. Mild winter temperatures has played a role in all, but the major contributing factor has been large contiguous acreages of over-dense, over-mature host trees. Older host trees are more susceptible to environmental stress and provide greater surface area for bark beetle development. We feel the SPB population decline in SC is likely to level out and begin to increase as the “wall of wood” (SC pine stands originating from 1985-95) matures. Our long-term SPB pheromone trapping chart reveals that the population decline is beginning to level out, and the time it begins to increase may come sooner because of the 2008 housing
crises, as many scheduled final harvests were postponed. This same chart also indicates that the clerid population appears to have been in decline since 1986. This decline possibly indicates that both SPB and clerid populations peaked during the 1970’s and that we are currently in between cycles of outbreaks. This makes sense since we know a large amount of host stands originated in the southeast post the 1930’s Depression and World War II, and a lot of these stands were located on highly eroded soils, especially within the piedmont, and contained significant amounts of shortleaf pine, a known risk factor for SPB. A simple query of the number of trees ≥ 5” DBH from the USFS’ Forest Inventory Analysis program for SC between 1968 and 2015 indicates an 82% decline in shortleaf and a 481% increase in loblolly. This year’s SPB population increase is the first consecutive annual increase since 1999-2000, indicating we could be beginning a new cycle that reflects what we saw in the last. The increased loblolly volume and age and declining wood markets may overcome the loss of shortleaf, possibly making the next cycle the same or worse.
Recommendations for Landowners and ForestersEven though current SPB populations are low, we still encourage foresters and forest landowners to manage for regulated forests by evenly distributing their pine acreage among age classes; thin on a timely basis; and consider harvesting at risk stands sooner. When regenerating pine stands, it is important to plant the correct species and density for the site; control natural pine regeneration or have a plan in place to address it; and consider available wood markets or lack thereof. The SPB Cost Share Program currently has funds available for regenerating pine stands at lower densities and precommercial thinning young, over-dense pine stands. This program is more ideal for areas and acreages outside of healthy pulpwood markets which, consequently, is where we have suffered the most pine loss to SPB. If interested in applying, please contact your county’s SCFC Project Forester.
SummaryWe predict no counties within the coastal plain will experience any SPB activity and only Oconee and Pickens counties within the piedmont to experience significant SPB activity, but their predictions are still considered Static and Moderate. The statewide and regional average SPB predictions are still considered
908070605040302010
0
9080706050403020100
1980 1985 1990 1995 2000 2005 2010 2015 2020
SCFC’s Southern Pine Beetle Trapping Results1986-2017
#Tra
pped
/Tra
p/Da
y
%SP
B
YearSPB/Trap/Day Clerid/Trap/Day
SPB Outbreaks %SPB
**
* In 2017, endo-Brevicomin was added to the previous used attractants of Frontalin and Sirex. A study found this new attractant combination on average was 6.54X more attractive to SPB and .97X less attractive to Clerid. To better compare 2017 to previous years, the number of SPB Trapped/Trap/Day was divided by 6.54, but the number of Clerid was left the same.
5
declining–low. If drought and mild temperatures persist in the northwestern piedmont, then SPB activity may increase over the summer, but high summer temperatures and a rebounding clerid population should constrain SPB dispersal to the remaining piedmont counties. Regardless, most beetle activity within Oconee and Pickens counties and the rest of SC are still likely to occur from Ips and BTB. A higher clerid population and average rainfall may overcome high summer temperatures and reduce Ips and BTB activity within the remaining piedmont counties. With a low clerid population, the coastal plain may have increased Ips and BTB activity if drought and high summer temperatures occur. If you suspect bark beetle activity, please contact the SCFC for identification and the best course of action. Employing the “cut and leave” and “salvaging” techniques could lead to more pine loss if SPB is not the culprit.
It is difficult to predict the degree of loss to SPB and other bark beetles, but our best guess for SC in 2017 is for a loss between one and two hundred thousand dollars.
Contact the SCFC Insect & Disease StaffPlease contact us if you have any questions or if we can provide additional information.
Chisolm BeckhamSouthern Pine Beetle Program CoordinatorOffice: (803) 896-6140Cell: (803) [email protected]
David JenkinsForest Health Program CoordinatorOffice: (803) 896-8838Cell: (803) [email protected]
Kevin DouglasForest TechnicianOffice: (803) 896-8862Cell: (803) [email protected]
SCFC Southern Pine Beetle Pheromone Trapping Survey, 2017SPB Prediction Chart: Frontalin + Sirex Lure + endo-Brevicomin
175.0
87.5
140.0
52.5
70.0
35.0
0.0
17.5
157.5
122.5
105.0
0 10 20 30 40 50 60 70 80 90 100
%SPB = (#SPB ÷ (#SPB + #Clerids)) x 100
#SPB
/Tra
p/Da
y
PickensOconee
Severe Outbreak
Increasing or High
Static or Moderate
Declining or Low
AndersonBeaufort
Piedmont Avg.Statewide Avg.
Berkeley
Coastal Plain Avg.
6
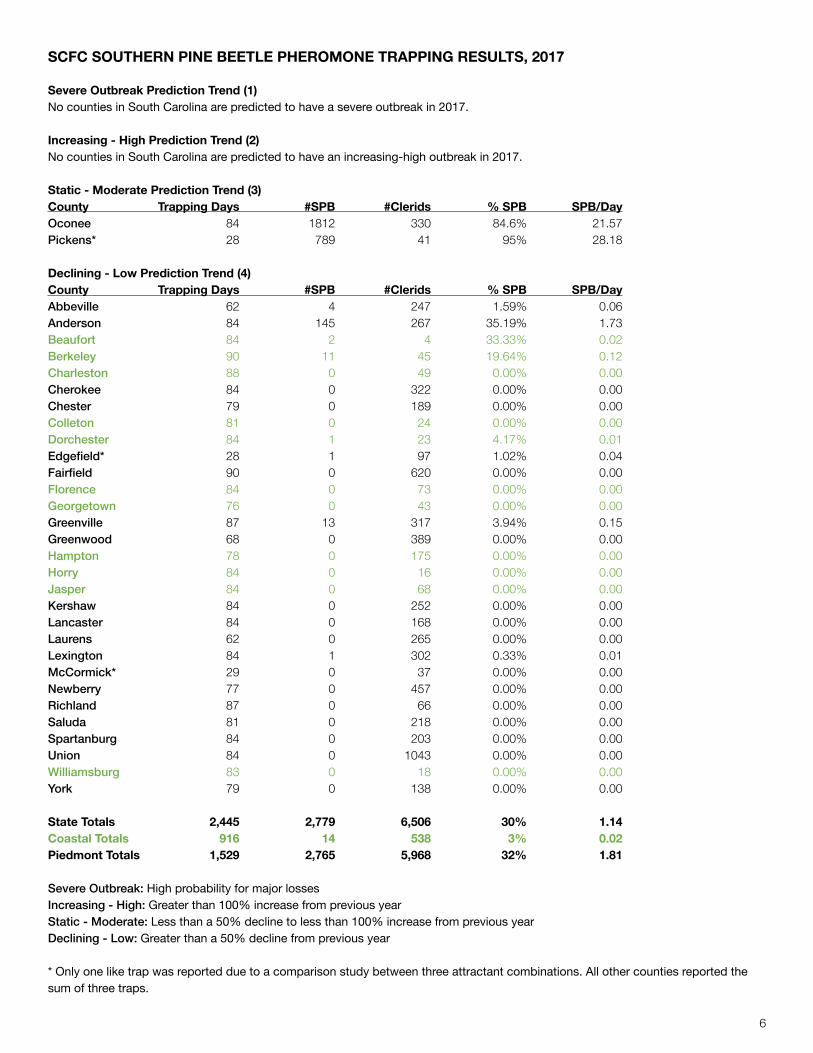
SCFC SOUTHERN PINE BEETLE PHEROMONE TRAPPING RESULTS, 2017
Severe Outbreak Prediction Trend (1)No counties in South Carolina are predicted to have a severe outbreak in 2017. Increasing - High Prediction Trend (2) No counties in South Carolina are predicted to have an increasing-high outbreak in 2017. Static - Moderate Prediction Trend (3) County Trapping Days #SPB #Clerids % SPB SPB/DayOconee 84 1812 330 84.6% 21.57Pickens* 28 789 41 95% 28.18
Declining - Low Prediction Trend (4) County Trapping Days #SPB #Clerids % SPB SPB/DayAbbeville 62 4 247 1.59% 0.06Anderson 84 145 267 35.19% 1.73Beaufort 84 2 4 33.33% 0.02Berkeley 90 11 45 19.64% 0.12Charleston 88 0 49 0.00% 0.00Cherokee 84 0 322 0.00% 0.00Chester 79 0 189 0.00% 0.00Colleton 81 0 24 0.00% 0.00Dorchester 84 1 23 4.17% 0.01Edgefield* 28 1 97 1.02% 0.04Fairfield 90 0 620 0.00% 0.00Florence 84 0 73 0.00% 0.00Georgetown 76 0 43 0.00% 0.00Greenville 87 13 317 3.94% 0.15Greenwood 68 0 389 0.00% 0.00Hampton 78 0 175 0.00% 0.00Horry 84 0 16 0.00% 0.00Jasper 84 0 68 0.00% 0.00Kershaw 84 0 252 0.00% 0.00Lancaster 84 0 168 0.00% 0.00Laurens 62 0 265 0.00% 0.00Lexington 84 1 302 0.33% 0.01McCormick* 29 0 37 0.00% 0.00Newberry 77 0 457 0.00% 0.00Richland 87 0 66 0.00% 0.00Saluda 81 0 218 0.00% 0.00Spartanburg 84 0 203 0.00% 0.00Union 84 0 1043 0.00% 0.00Williamsburg 83 0 18 0.00% 0.00York 79 0 138 0.00% 0.00
State Totals 2,445 2,779 6,506 30% 1.14Coastal Totals 916 14 538 3% 0.02Piedmont Totals 1,529 2,765 5,968 32% 1.81
Severe Outbreak: High probability for major losses Increasing - High: Greater than 100% increase from previous year Static - Moderate: Less than a 50% decline to less than 100% increase from previous year Declining - Low: Greater than a 50% decline from previous year * Only one like trap was reported due to a comparison study between three attractant combinations. All other counties reported the sum of three traps.

7
Cover photo by Erich G. Vallery (USDA Forest Service - SRS-4552, Bugwood.org)