southwest california housing update
TRANSCRIPT

The Voice for Real Estate
Economic Development Workforce Committee


2015
Lake Elsinore Demographic Shift
2016
6%2%
7% 3%
2017

Lake Elsinore Demographic Shift


Lake Elsinore Population Data

Lake Elsinore Population Data

Lake Elsinore Unemployment Data

Lake Elsinore Business Data

SW Market @ A Glance
Southwest
California Reporting
Period
Current
Period
Last
Period
Year
Ago
Change
from
Last
Period
Change
from
Year
Ago
Existing Home Sales
(SFR Detached)September
2017 902 1,103 982 18% 8%
Median Home Price $353,155 $353,983 $334,639 --- 5%
Unsold Inventory
Index (SFR Units) 1,842 1,848 2,348 --- 22%
Unsold Inventory
Index (Months) 2.2 1.6 2.4 17% 8%
Median Time on
Market (Days) 18 18 46 --- 61%
Source: CRMLS
Regional Housing Date

California, August 2017 Sales: 427,630 Units, +2.7% YTD, +1.3% YTY
State Housing Sales DataSales Continue to Grow but at a Slower Pace
-
100,000
200,000
300,000
400,000
500,000
600,000
700,000
*Sales are seasonally adjusted and annualized
SERIES: Sales of Existing Single Family Homes
SOURCE: CALIFORNIA ASSOCIATION OF REALTORS®
Aug-17:
427,630Aug-16:
422,190

0
50
100
150
200
250
300Jan-1
5
Feb-1
5
Ma
r-15
Apr-
15
Ma
y-1
5
Jun-1
5
Jul-15
Aug
-15
Sep-1
5
Oc
t-15
No
v-1
5
Dec
-15
Jan-1
6
Feb-1
6
Ma
r-16
Apr-
16
Ma
y-1
6
Jun-1
6
Jul-16
Aug
-16
Sep-1
6
Oc
t-16
No
v-1
6
Dec
-16
Jan-1
7
Feb-1
7
Mar-
17
Apr-
17
May-1
7
Jun-1
7
Jul-17
Aug
-17
Sep-1
7
Temecula Murrieta Wildomar Lake Elsinore
Regional SFR Sales

0
200
400
600
800
1,000
1,200
1,400
1,600
1,800
2,000
2003 2004 2005 2006 2007 2008 2009 2010 2011 2012 2013 2014 2015 2016 2017
Lake Elsinore 962 1,038 1,287 999 494 1,405 1,805 1,405 1,270 1,165 1,072 1,022 1,091 1,184 1,254
Axis
Tit
leLake Elsinore Sales History

California, August 2017: $565,330, +2.9% MTM, +7.2% YTY
Califoria State Median Price DataMedian Price Continues to Grow YTY
$-
$100,000
$200,000
$300,000
$400,000
$500,000
$600,000
$700,000P: May-07
$594,530
T: Feb-09
$245,230
-59% from
peak
Aug-17: $565,330
Aug-16: $527,490
SERIES: Median Price of Existing Single Family Homes
SOURCE: CALIFORNIA ASSOCIATION OF REALTORS®

$250,000
$300,000
$350,000
$400,000
$450,000
$500,000
Temecula Murrieta Wildomar Lake Elsinore
Regional Median Price Data

$0
$50,000
$100,000
$150,000
$200,000
$250,000
$300,000
$350,000
$400,000
$450,000
2003 2004 2005 2006 2007 2008 2009 2010 2011 2012 2013 2014 2015 2016 2017
Lake Elsinore $230,115 $323,681 $391,725 $433,996 $377,597 $230,459 $174,666 $187,347 $180,856 $187,696 $247,758 $281,742 $300,432 $321,976 $351,547
47%
60%
50%
Lake Elsinore Median Price History
19%

Lake Elsinore Median Price
September 2017:
2016 2017 %
Temecula $437,500 $470,000 7%
Murrieta $385,000 $418,000 8%
Menifee $315,000 $345,000 9%
Lake Elsinore $330,000 $359,900 8%
Wildomar $370,000 $402,500 8%
Canyon Lake $428,000 $425,000 1%
Hemet $230,000 $257,000 10%
San Jacinto $251,250 $255,000 2%
Perris $265,000 $300,000 12%

0
500
1000
1500
2000
2500
3000
1/12 4/12 7/12 10/12 1/13 4/13 7/13 10/13 1/14 4/14 7/14 10/14 1/15 4/15 7/15 10/15 1/16 4/16 7/16 10/16 1/17 4/17 7/17
Inventory Sales
September Market Activity By Sales Type
Standard Sale Bank Owned Short Sale
Active% of MKT Sold % of MKT Active
% of MKT Sold
% of MKT Active
% of MKT Sold
% of MKT
Temecula 310 87% 147 95% 2 1% 1 1% 10 3% 2 1%
Murrieta 335 90% 149 92% 5 1% 0 0% 13 3% 5 3%
Wildomar 71 89% 31 97% 1 1% 0 0% 4 5% 1 3%
Lake Elsinore 177 93% 94 93% 1 1% 1 1% 8 4% 1 1%
Menifee 251 97% 146 95% 1 0% 3 2% 5 2% 2 1%
Canyon Lake 81 93% 22 96% 0 0% 1 4% 1 1% 0 0%
Hemet 248 89% 153 92% 5 2% 5 3% 8 3% 2 1%
San Jacinto 90 97% 44 92% 1 1% 1 2% 2 2% 2 4%
Perris 116 93% 56 92% 0 0% 1 2% 7 6% 2 3%
Regional Average1679 91% 842 93% 16 1% 13 1% 58 3% 17 2%
Market Activity

Your 'Average' House, September 2017By City
City Median Sold $ Average Sold $ * Average SqFt Bed Bath YrBlt
Temecula $470,000 $514,810 2,418 4 3 1998
Murrieta $418,000 $437,086 2,438 4 3 1999
Wildomar $402,500 $413,189 2,341 4 3 1996
Lake Elsinore $359,900 $345,935 2,069 4 3 1996
Menifee $345,000 $340,831 2,024 3 3 1995
Canyon Lake $425,000 $461,685 2,335 3 3 1986
Hemet $257,000 $263,391 1,756 3 2 1985
San Jacinto $255,000 $250,968 1,786 3 2 1995
Perris $300,000 $301,367 1,976 4 3 1991* Excluding homes over $1,000,000
18825 Oakview Wy, Lake Elsinore

What Lies Ahead?

9.4%
8.6%
7.5%
7.5%
6.5%
5.8%
5.6%
5.4%
5.4%
5.4%
5.1%
4.7%
4.6%
4.4%
4.2%
3.8%
3.5%
0.0% 2.0% 4.0% 6.0% 8.0% 10.0%
Kern
Fresno
Stanislaus
San Joaquin
Riverside
San Bernardino
Monterey
Santa Cruz
Sacramento
Los Angeles
Mono
San Diego
Inyo
Alameda
Orange County
Santa Clara
San Francisco
Unemployment rate by County
SERIES: Unemployment Rate
SOURCE: CA Employment Development Division
Aug 2017: California 5.1%
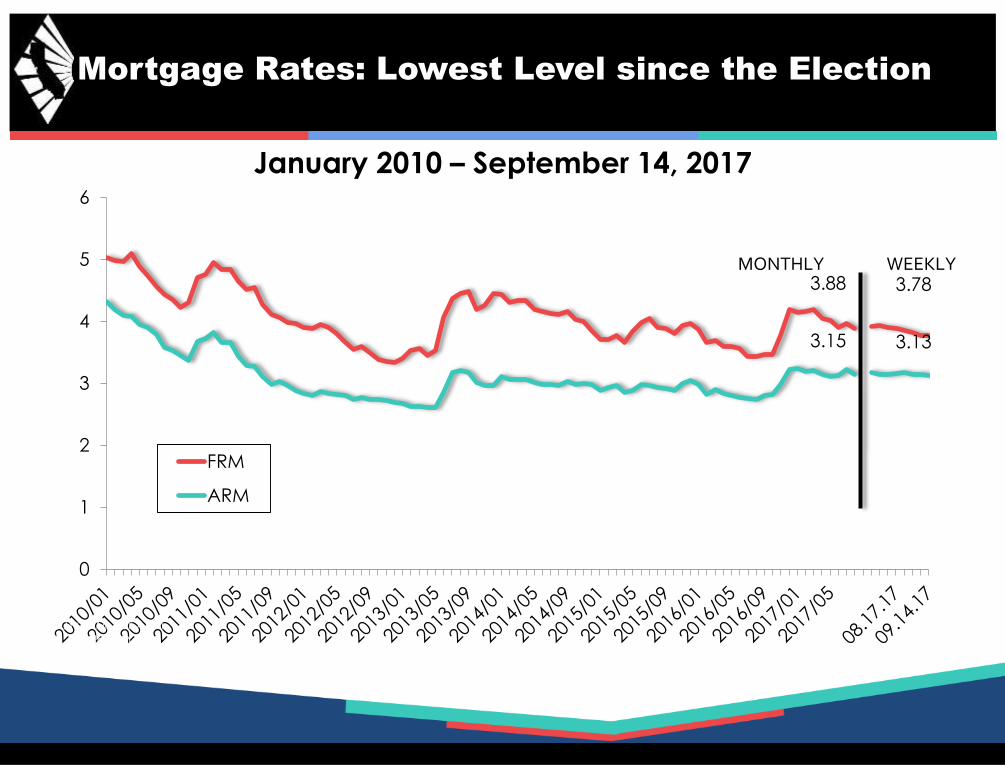
January 2010 – September 14, 2017
Mortgage Rates: Lowest Level since the Election
0
1
2
3
4
5
6
FRM
ARM
3.78
3.13
3.88
3.15
MONTHLY WEEKLY
SERIES: 30Yr FRM, 5Yr ARM
SOURCE: Freddie Mac

Aug 2016: 3.4 Months; Aug 2017: 2.9 Months
Supply Remains an Issue
Note: “Unsold Inventory Index” represents the number of months it would take to sell the remaining inventory for the month in question. The remaining inventory for the month is defined as the number of properties that were “Active”, “Pending”, and “Contingent” (when available) and divide the sum by the number of “Sold” properties for the month in question.
SERIES: Unsold Inventory Index of Existing Single Family Homes
SOURCE: CALIFORNIA ASSOCIATION OF REALTORS®
0.0
2.0
4.0
6.0
8.0
10.0
12.0
14.0
16.0
18.0
Jan
-05
Se
p-0
5M
ay-0
6Ja
n-0
7Se
p-0
7M
ay-0
8Ja
n-0
9Se
p-0
9M
ay-1
0Ja
n-1
1Se
p-1
1M
ay-1
2Ja
n-1
3Se
p-1
3M
ay-1
4Ja
n-1
5Se
p-1
5M
ay-1
6Ja
n-1
7
7% 5% 5%
-20%
-40%
-8%
-50%
-40%
-30%
-20%
-10%
0%
10%
San
Francisco
Bay Area
Southern
California
Central
ValleyY
ea
r-to
-Ye
ar %
Ch
g
Sales Active Listings

“Missing” 72,000 New Units Annually
SERIES: California New Housing Permits
SOURCE: Construction Industry Research Board
0
50000
100000
150000
200000
250000
300000
350000
Single Family Multi-Family CA HCD Projected
Housing Needs:
180,000/yr.
2016: 98,881 (47,889 sf, 50,992 mf)
2017f: 107,756 (53,708 sf, 54,048 mf )
0.9% 0.8%1.9%
5.7%
10.7%
21.3%
24.0%
31.8%
24.4%
9.0%11.0%
12.4%14.2%
12.0%
8.9%7.3%
0%
5%
10%
15%
20%
25%
30%
35%
1978 &
Earlier
1979 to
1984
1985 to
1989
1990 to
1994
1995 to
1999
2000 to
2005
2005 to
2009
2010 to
2013
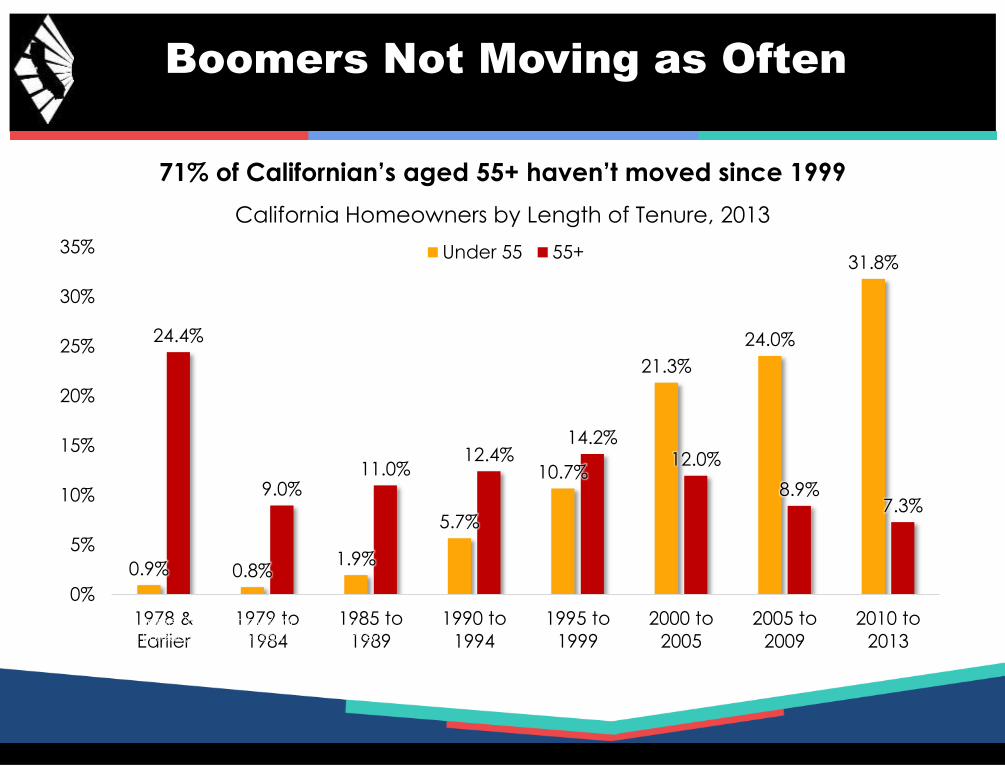
California Homeowners by Length of Tenure, 2013
Under 55 55+
Boomers Not Moving as Often
SERIES: Distribution of Home Ownership by Year Moved In
SOURCE: U.S. Census Bureau, 2013 American Housing Survey
71% of Californian’s aged 55+ haven’t moved since 1999

55%
29%
0%
10%
20%
30%
40%
50%
60%
70%
39%
21%
Housing affordability taking it on the chin
2017-Q2: % able to purchase median-priced home
SERIES: Housing Affordability Index of Traditional Buyers
SOURCE: CALIFORNIA ASSOCIATION OF REALTORS®
12%

Affordability Is also an Issue for Renters
SERIES: California asking rent and household incomeSOURCE: California Department of Housing and Community Development, Census Bureau Decennial Census, American Community Survey
173.0
135.9
100
110
120
130
140
150
160
170
180
200
0
200
1
200
2
200
3
200
4
200
5
200
6
200
7
200
8
200
9
201
0
201
1
201
2
201
3
201
4
201
5
201
6
Rent vs. Household Income
Asking Rent
Household
Income
Indexed: 2000=100
$1,032
$1,337
$1,977
$800
$1,000
$1,200
$1,400
$1,600
$1,800
$2,000
$2,200 California Average Asking Rent

Homeownership Dropped, Big Gap in CA
63.5
53.2
50
52
54
56
58
60
62
64
66
68
70
Pe
rce
nt
Homeownership Rate, 2005-2016
U.S. CaliforniaSERIES: Homeownership Rate (%)SOURCE: U.S. Census Bureau, Housing Vacancy Survey (HVS)

53.8%
0%
10%
20%
30%
40%
50%
60%
70%
80%
Ne
w Y
ork
Ne
va
da
Ha
wa
ii
Texa
s
Wa
shin
gto
n
Ne
w J
ers
ey
Co
lora
do
Co
nn
ec
tic
ut
Flo
rid
a
Illin
ois
Oh
io
Ten
ne
sse
e
Mis
sou
ri
Ka
nsa
s
Ne
w M
exic
o
Wis
co
nsi
n
Ne
bra
ska
So
uth
Ca
rolin
a
Ala
ba
ma
Iow
a
Ida
ho
Uta
h
Ne
w H
am
psh
ire
Ma
ine
De
law
are
Homeownership Rate
California Ranked the 2nd Lowest Amongst All States
SERIES: Homeownership RatesSOURCE: U.S. Census Bureau

Supply = Solution, but California Not Building Enough Because…
SOURCE: CA Legislative Analyst Office

Building in California is Expensive
SERIES: Homeownership RateSOURCE: CA Legislative Analyst Office
• 2 to 4 times higher on California
(CA) Coasts
• High land costs usually mean more
units being built on each plot of
land, but not the case in CA’s
coastal metros
• During the 2000’s housing density of
a typical neighborhood in CA’s
coastal metro rose only 4%,
considerably less than the 11%
average increase in the comparison
group
• The new housing unit in the
comparison group was also 40%
more dense than that built in CA.
Land Costs Building Costs
• $50k to $75 higher in California
(CA)
• Include labor, building material and
government fees, all higher in CA
than other states
• Development fees are higher in
California than the rest of the
country. A 2012 national survey
found that the average
development fee levied by
California local governments
(excluding water-related fees) was
$22,000 per single family home, as
compared to the $6,000 per single-
family home in the rest of the
country.

4.4%4.6%
5.3%
3.6%3.4%
3.2%2.9%
2.7%
4.8%
7.6%
6.9%
5.6%5.8%
7.0%
7.4%7.2%
0.0%
1.0%
2.0%
3.0%
4.0%
5.0%
6.0%
7.0%
8.0%
2017.01 2017.02 2017.03 2017.04 2017.05 2017.06 2017.07 2017.08
Year-to-Date Sales Growth vs. Annual Price Growth
Sales Median Price
Sales decelerate, prices accelerate

Let’s talk politics!

Federal Political Fiscal Climate
• Economic stimulus package/tax reform
• $550 billion over 10 years
• Tax reductions/increase in standard deduction/eliminate property tax deduction
• Higher budget deficits will lead to rising interest rates
• Dismantling Dodd-Frank
• Banks will loosen up lending standards
• Buyers could have more mortgage options
• Heighten risks of having another financial bubble
• Reform of GSE’s
• Privatization or not?
• An increase in interest rates is expected if GSE’s were privatized

Federal Wildcards
• Trade Policy• Boarder adjustment tax/Tariff
• Consumer pay higher prices on imported goods
• Higher inflation will lead to higher interest rates
• Other wildcards• Healthcare reform
• Immigration Policy/H1B Visa program
• Policy by Tweet

FED holds off again – see you in December?
Efficacy of Monetary Policy?
Next FED Chair?
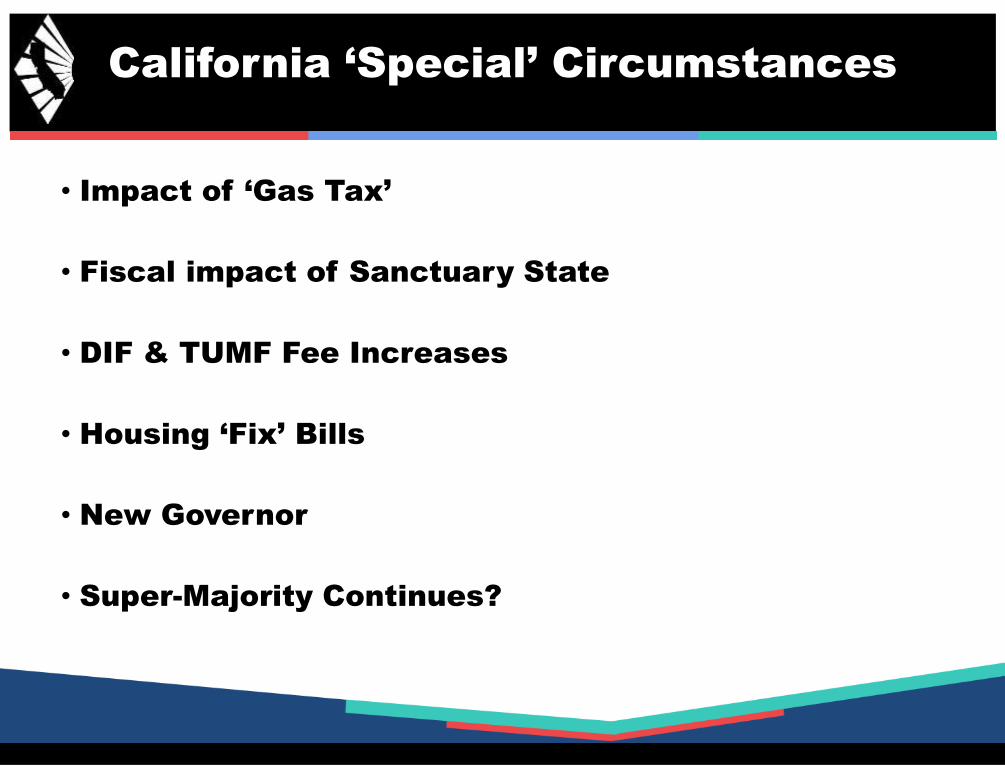
• Impact of ‘Gas Tax’
• Fiscal impact of Sanctuary State
• DIF & TUMF Fee Increases
• Housing ‘Fix’ Bills
• New Governor
• Super-Majority Continues?
California ‘Special’ Circumstances

U.S. Economic Outlook
2012 2013 2014 2015 2016 2017p 2018f
US GDP 2.2% 1.7% 2.4% 2.6% 1.6% 2.1% 2.3%
Nonfarm Job
Growth1.7% 1.7% 1.9% 2.1% 1.8% 1.4% 1.2%
Unemployment 8.1% 7.4% 6.2% 5.3% 4.9% 4.5% 4.3%
CPI 2.1% 1.5% 1.6% 0.1% 1.4% 2.0% 2.4%
Real Disposable
Income, % 3.2% -1.4% 2.7% 3.4% 2.7% 2.1% 3.5%
30-Yr FRM 3.7% 4.0% 4.2% 3.9% 3.6% 4.2% 4.7%SERIES: U.S. Economic Outlook
SOURCE: CALIFORNIA ASSOCIATION OF REALTORS®

2012 2013 2014 2015 2016 2017p 2018f
SFH Resales (000s) 439.8 414.9 382.7 409.4 416.3 419.6 421.4
% Change 4.1% -5.9% -7.8% 7.0% 1.7% 0.8% 0.4%
Median Price
($000s)$319.3 $407.2 $446.9 $476.3 $502.3 $537.5 $556.0
% Change 11.6% 27.5% 9.8% 6.6% 5.4% 7.0% 3.4%
Housing
Affordability Index51% 36% 30% 31% 31% 29% 26%
30-Yr FRM 3.7% 4.0% 4.2% 3.9% 3.6% 4.2% 4.7%
California Housing Market Outlook


