space, evolution function houses chaco canyon 1st symposium 9… · s pace syntax first...
TRANSCRIPT
S P A C E S Y N T A X F I R S T I N T E R N A T I O N A L S Y M P O S I U M • L O N D O N � � � �
����
P R O C E E D I N G S V O L U M E I I • A R C H A E O L O G Y
SPACE, EVOLUTION AND FUNCTION IN THE HOUSES OF CHACO CANYON
Dr. Wendy BustardUniversity of New Mexico, Albuquerque, United States
0 AbstractFrom A.D. 860 to 1130, ancestral Puebloan peoples constructed more than a dozenmulti-storey structures along a 14-km stretch of Chaco Canyon in the arid mountaindesert of the Four Corners area in the American Southwest. These so-called 'greathouses' ranged in size from 54 to 800 rooms. For the past 145 years, archaeologists havesought an understanding of the social organization that produced such monumentalstructures. Despite intensive study, the function of great houses in Chacoan society isunknown. Using space syntax access analyses, this research examines within- and among-great house spatial organization and evaluates social organisational models.
Space syntax is used to analyse 11 discrete roomblocks from three excavated great houses.Access graphs are constructed and used to generate syntactic data. Using a three-phasetemporal framework previously developed for the great house period, changes overtime in patterning, spatial phenotypes, and functional genotypes are identified. Theresults of this research are used to evaluate the spatial implications of the currently-proposed Chaco great house models. Syntactical analyses suggest that it is unlikely thatany one of these models fits all the great houses. The syntactical evidence is best ex-plained by a mixed-use model for great houses rather than a single function model.
1 Introduction: an archaeological problemThe prehistoric cultural landscape of Chaco Canyon is made up of both monumentalgreat houses, which first captured the public imagination, and a multitude of more mod-est structures, the small houses. Located in the semi–arid, mountain desert of the AmericanSouthwest, Chaco Canyon was the centre of a remarkable culture that flourished 1000years ago. Archaeologists call this culture Anasazi, or ancestral Puebloan. The ChacoCanyon architectural record has been extensively studied, yet the relationship betweengreat and small houses remains a fundamental problem of Southwest archaeology (Toll,1985). The precise role of the great houses in the ancestral Puebloan cultural system isunknown. For more than 100 years, archaeologists have sought an understanding of thesocial organisation that built such impressive structures (Lekson, 1986). Using the samedata, archaeologists have produced contradictory models for great houses.
The massive investment of labour and materials in the construction of great housesmakes understanding these structures critical to understanding the Chaco Canyonsocial system and the regional system in which it was set. First, however, we need tounderstand the social and functional role of the small houses (Bustard, 1995). It hasbeen assumed that small houses were residences, but the spatial organisation of thesestructures has not been systematically investigated, and inferences about domesticsocial organisation remain largely dependent on ethnographic analogy. While thesmall houses have received little analytic attention, debates over the functional sig-
23Keywords: access, archaeology, Chaco
Canyon, function, prehistoric
Dr Wendy Bustard
NPS/Chaco Museum Collection
c/o Department of Anthropology
University of New Mexico
Albuquerque, New Mexico 87131
United States
tel: (1) 505 277-2730
e-mail: [email protected]
S P A C E S Y N T A X F I R S T I N T E R N A T I O N A L S Y M P O S I U M • L O N D O N � � � �
����
nificance of great houses have preoccupied researchers for the past three decades,with no resolution in sight. The failure to consider both form and function in ar-chaeological spatial analysis, compounded by an overreliance on ethnographic anal-ogy for assumptions and explanations, has limited our understanding of prehistoricspatial, and by inference social, organisation in the American Southwest. A new ana-lytical approach, independent of ethnographic analogy, is needed to break the ex-planatory logjam. Space syntax provides the analytic tools for such an approach.
Using space syntax, inferences of social organisation can be developed two ways:first, by graphing spatial relations to identify patterns in use, and second, by quanti-fying spatial relations to determine differences in the way in which activities are de-ployed across space. As architect David Saile (1977, page 159) has observed, ". . .architecture deals with 'place.' Place implies spatial organization, that is, the order-ing of qualities which distinguish certain places from others or from nebulousundifferentiated space. . . ." The measures of integration and control (Hillier andHanson, 1984) provide a numerical language to describe these ordering of qualitiesor spatial relations, an important step beyond graphical description. Differences inintegration and control values from one space to another are a result of social rela-tions played out in social space (Hillier et al, 1984). The robustness of differences inthese variables can be tested using standard statistical analyses.
1.1 The data set
This study will focus on three great houses and 20 small houses in Chaco Canyonthat have been extensively excavated. The size and complex construction history ofthe great houses requires breaking each down into its component roomblocks foranalysis (see Lekson, 1986 for construction sequences). Table 1 lists all small housesand great house roomblocks used in this analysis, by culture phase.
D r We n d y B u s t a r d • S p a c e , E v o l u t i o n a n d F u n c t i o n i n t h e H o u s e s o f C h a c o C a n y o n
Table 1 Bonito Phase Small Houses Great House Roomblocks
Early Pueblo Bonito IAA.D. 850–1000 Pueblo Bonito IBDClassicA.D. 1000–108 29SJ 627 Pueblo Bonito IIIA
East Ruin Pueblo Bonito VIARuin 3 Pueblo Bonito VIB1Smith Ranch Ruin Pueblo Bonito VIB2Turkey House Pueblo del Arroyo IA
LateA.D. 1080–1170 Bc 26 Pueblo del Arroyo IIA
Bc 50 Pueblo del Arroyo IIIABc 51 Kin Kletso IABc 52 Kin Kletso IBBc 53 •Bc 54 •Bc 57 •Bc 58 •Bc 59 •Bc 126 •Bc 192 •Bc 236 •Bc 362 •Rabbit Ruin •Ruin 13 •
Table1. Small houses and great house
roomblocks by Bonito Phase.
S P A C E S Y N T A X F I R S T I N T E R N A T I O N A L S Y M P O S I U M • L O N D O N � � � �
����
P R O C E E D I N G S V O L U M E I I • A R C H A E O L O G Y
The spatial analyses will proceed with (1) the construction of access graphs andsyntactic data; (2) exploratory data analyses of the data; (3) the examination of spatialphenotypes; and (4) the identification of an underlying spatial–functional genotype,with a discussion of change in the genotype over time. In the final section of thispaper, I will compare small and great house data sets and evaluate the spatial impli-cations of many currently–proposed Chaco explanatory models. These models at-tribute varying functional significance to the great houses, but have not been as-sessed against the small house record.
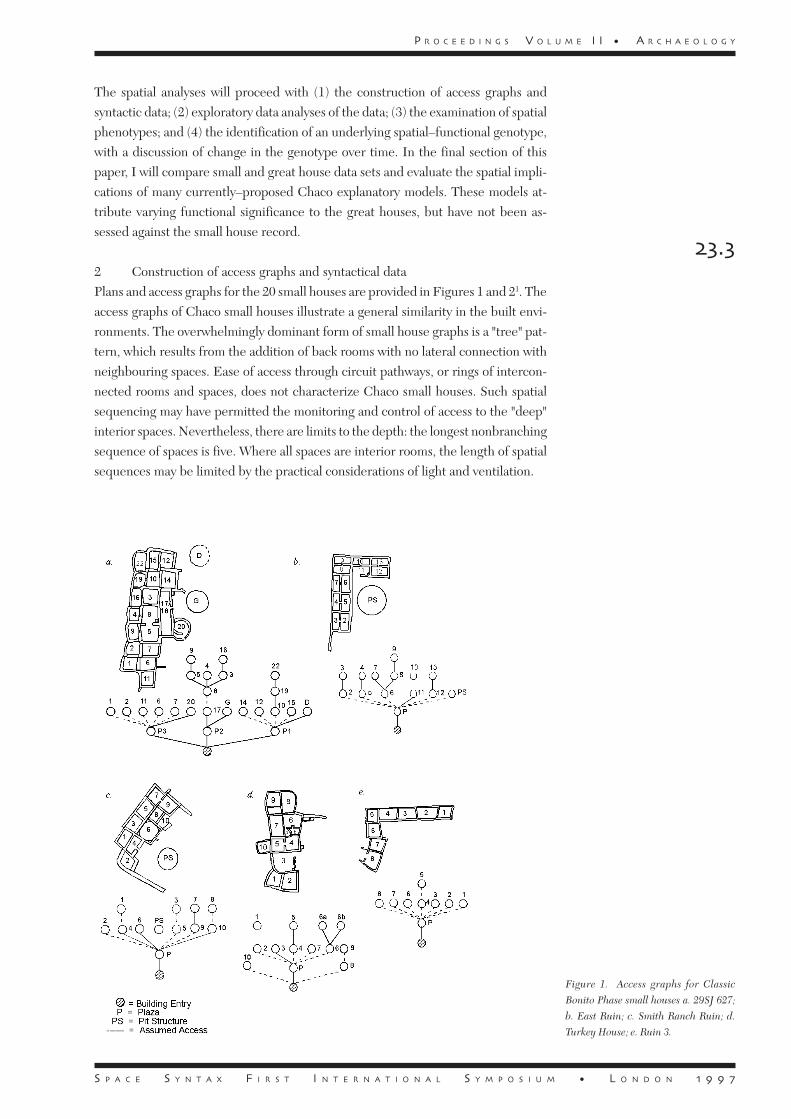
2 Construction of access graphs and syntactical dataPlans and access graphs for the 20 small houses are provided in Figures 1 and 21. Theaccess graphs of Chaco small houses illustrate a general similarity in the built envi-ronments. The overwhelmingly dominant form of small house graphs is a "tree" pat-tern, which results from the addition of back rooms with no lateral connection withneighbouring spaces. Ease of access through circuit pathways, or rings of intercon-nected rooms and spaces, does not characterize Chaco small houses. Such spatialsequencing may have permitted the monitoring and control of access to the "deep"interior spaces. Nevertheless, there are limits to the depth: the longest nonbranchingsequence of spaces is five. Where all spaces are interior rooms, the length of spatialsequences may be limited by the practical considerations of light and ventilation.
Figure 1. Access graphs for Classic
Bonito Phase small houses a. 29SJ 627;
b. East Ruin; c. Smith Ranch Ruin; d.
Turkey House; e. Ruin 3.
S P A C E S Y N T A X F I R S T I N T E R N A T I O N A L S Y M P O S I U M • L O N D O N � � � �
����
D r We n d y B u s t a r d • S p a c e , E v o l u t i o n a n d F u n c t i o n i n t h e H o u s e s o f C h a c o C a n y o n
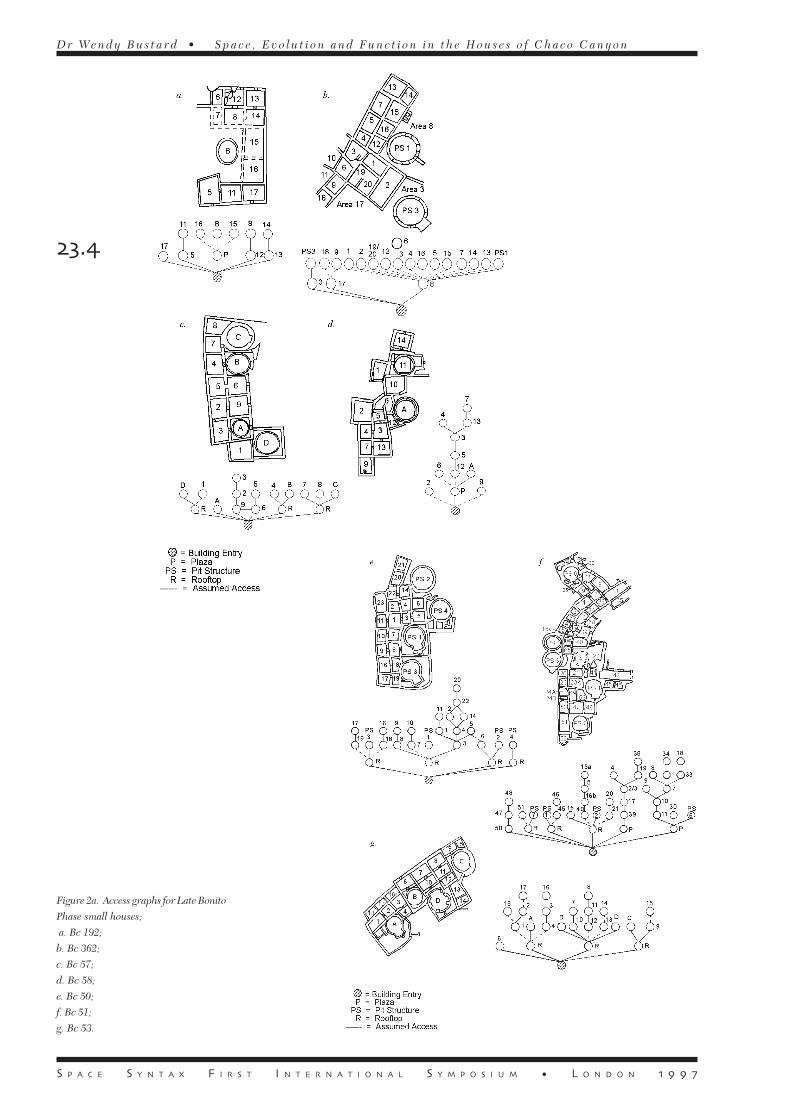
Figure 2a. Access graphs for Late Bonito
Phase small houses;
a. Bc 192;
b. Bc 362;
c. Bc 57;
d. Bc 58;
e. Bc 50;
f. Bc 51;
g. Bc 53.

S P A C E S Y N T A X F I R S T I N T E R N A T I O N A L S Y M P O S I U M • L O N D O N � � � �
����
P R O C E E D I N G S V O L U M E I I • A R C H A E O L O G Y
Figure 2b. Access graphs for Late Bonito
Phase small houses;
h. Bc 59;
i. Ruin 13;
j. Rabbit Ruin;
k. Bc 26;
l. Bc 126;
m. Bc 236;
n. Bc 54;
o. Bc 52
S P A C E S Y N T A X F I R S T I N T E R N A T I O N A L S Y M P O S I U M • L O N D O N � � � �
���
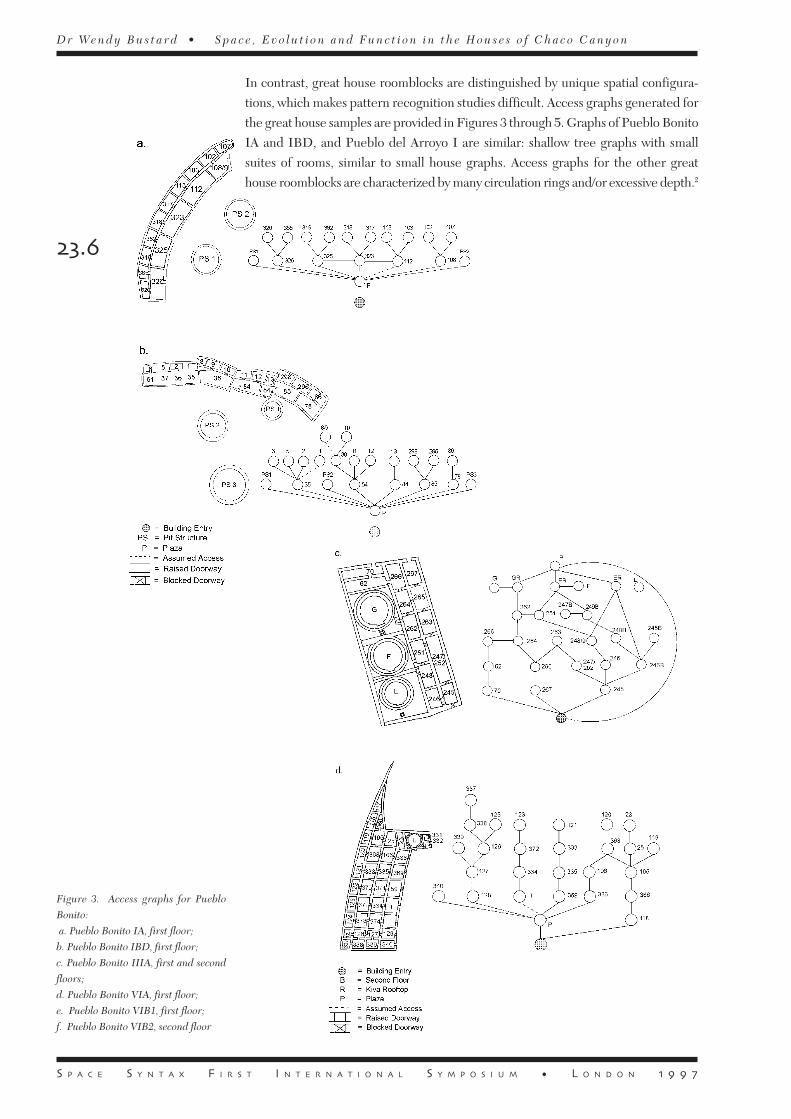
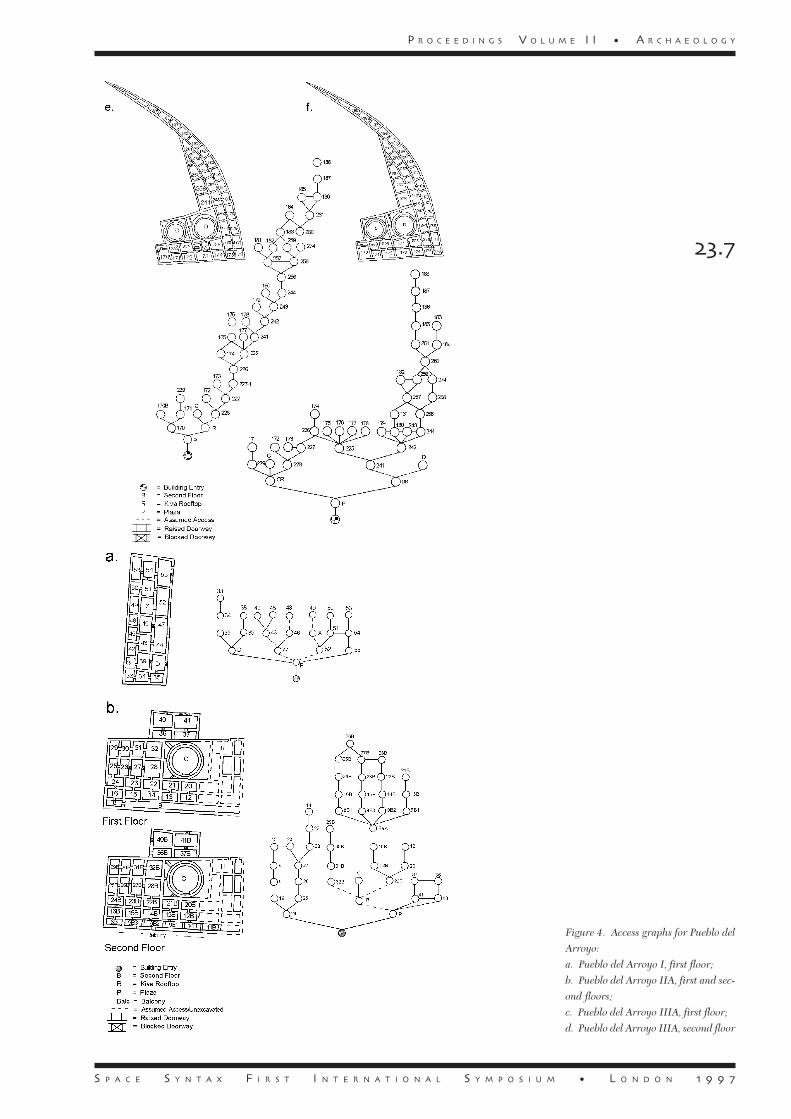
In contrast, great house roomblocks are distinguished by unique spatial configura-tions, which makes pattern recognition studies difficult. Access graphs generated forthe great house samples are provided in Figures 3 through 5. Graphs of Pueblo BonitoIA and IBD, and Pueblo del Arroyo I are similar: shallow tree graphs with smallsuites of rooms, similar to small house graphs. Access graphs for the other greathouse roomblocks are characterized by many circulation rings and/or excessive depth.2
Figure 3. Access graphs for Pueblo
Bonito:
a. Pueblo Bonito IA, first floor;
b. Pueblo Bonito IBD, first floor;
c. Pueblo Bonito IIIA, first and second
floors;
d. Pueblo Bonito VIA, first floor;
e. Pueblo Bonito VIB1, first floor;
f. Pueblo Bonito VIB2, second floor
D r We n d y B u s t a r d • S p a c e , E v o l u t i o n a n d F u n c t i o n i n t h e H o u s e s o f C h a c o C a n y o n
S P A C E S Y N T A X F I R S T I N T E R N A T I O N A L S Y M P O S I U M • L O N D O N � � � �
����
Figure 4 . Access graphs for Pueblo del
Arroyo:
a. Pueblo del Arroyo I, first floor;
b. Pueblo del Arroyo IIA, first and sec-
ond floors;
c. Pueblo del Arroyo IIIA, first floor;
d. Pueblo del Arroyo IIIA, second floor
P R O C E E D I N G S V O L U M E I I • A R C H A E O L O G Y
S P A C E S Y N T A X F I R S T I N T E R N A T I O N A L S Y M P O S I U M • L O N D O N � � � �
���
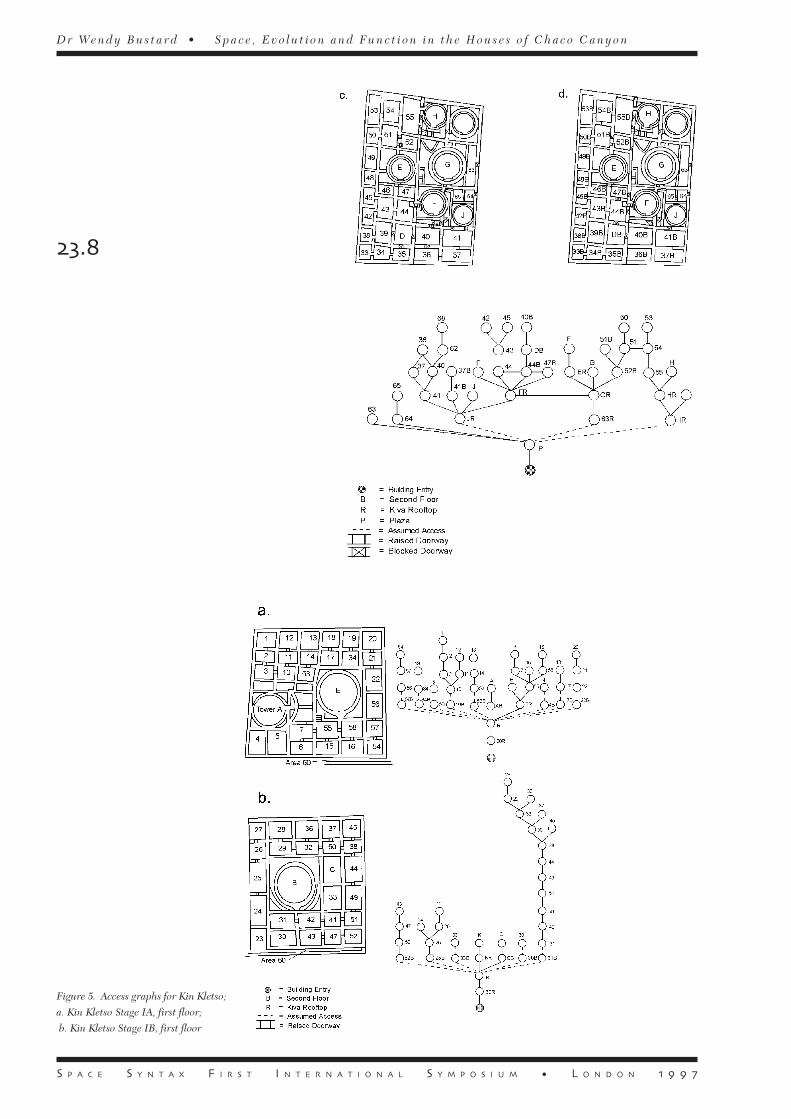
Figure 5. Access graphs for Kin Kletso;
a. Kin Kletso Stage IA, first floor;
b. Kin Kletso Stage IB, first floor
D r We n d y B u s t a r d • S p a c e , E v o l u t i o n a n d F u n c t i o n i n t h e H o u s e s o f C h a c o C a n y o n

S P A C E S Y N T A X F I R S T I N T E R N A T I O N A L S Y M P O S I U M • L O N D O N � � � �
����
Table 2Small House Mean SI
Bc 362 0.7535Ruin 3 0.7818Smith Ranch Ruin 0.8967Bc 236 0.9813Bc 52 1.0088East Ruin 1.0253Ruin 13 1.0276Bc 57 1.0289Bc 59 1.0754Turkey House 1.0846Bc 192 1.0956Bc 50 1.2244Bc 53 1.2424Rabbit Ruin 1.2425Bc 26 1.286829SJ 627 1.3177Bc 126 1.4386Bc 51 1.4277Bc 58 1.5955Bc 54 1.6263Sample Mean 1.159
Great House Mean SI
Pueblo Bonito IA 0.831Pueblo Bonito IBD 0.883Pueblo Bonito IIIA 0.923Pueblo del Arroyo IIIA 1.117Kin Kletso IA 1.138Pueblo del Arroyo IA 1.266Pueblo Bonito VIA 1.514Pueblo Bonito VIB2 1.664Pueblo del Arroyo IIA 1.948Kin Kletso IB 1.996Pueblo Bonito VIB1 2.246Sample Mean 1.411
Syntactic measures of Standardized Integration (SI)3 and Control were calculated forboth samples using the procedures described in Hillier and Hanson (1984). Table 2lists the mean SI values for individual small houses and great house roomblocks inascending order. The distribution of values in Table 2 supports the general conclu-sion that small house space is segregated in terms of access (Hillier and Hanson,1984). Although the mean SI values do not sort temporally, the range in values from.75 to 1.63 suggests variation in the degree of segregation. Change over time is aresearch topic of great interest to archaeologists, and thus knowing if there are tem-poral and/or functional differences in small house spatial organisation that wouldaccount for the wide range in mean SI values would be useful
Mean SI values for great houses also support an interpretation of spatial segregation.Of interest is a noticeable increase in mean SI between Pueblo Bonito IIIA andPueblo del Arroyo IIIA. Pueblo Bonito IIIA is the earliest Classic Bonito Phaseroomblock in this sample. In terms of integration, this roomblock appears transi-tional between Early and Classic Bonito Phase construction. Its access graph, withan abundance of circulation rings (Figure 3c), sets it apart from the other roomblocksas well. The SI means for great house roomblocks climb quickly upwards, culminat-ing in an extremely high mean of 2.246 for the first floor of the Pueblo Bonito VIBroomblock. The large range, from .831 to 2.246, suggests substantial differences inthe degree of spatial segregation in this sample. If spatial integration values are notrandomly distributed across time periods and/or activity areas, that is, if patternsexist in the data, then it may be possible to specify the nature of spatial organisationthrough time. Exploratory data analysis is one means of discovering patterns in data.
3 Exploratory data analysisExploratory data analysis (EDA) is a useful way to assess data sets before conductingstatistical tests. EDA is based on the simple premise that looking at the data first isadvisable, specifically shape, spread, location, and skewness (Hartwig and Dearing,1979). The first step is to decide whether the distributions are normal or not, sincetests of significance are dependent on assumptions regarding the normality of thedata. The second step is to identify trends in the data and test for statistical signifi-cance. Box–and– whisker plots (boxplots) are useful in assessing the shape of distri-butions, detecting departures from normality, and in identifying trends in the data.The nature of these samples offers an opportunity to explore multiple dimensions ofthe data sets; this analysis will focus on a temporal comparison of small and greathouses by Bonito Phase.
3.1 Bonito Phase variation in small houses
The small house data set includes houses from the Classic and Late Bonito Phases.The question being asked is, do differences exist in SI and Control values betweenClassic and Late Bonito Phase small houses that may signal differences in spatialorganisation over time? Side–by–side boxplots of SI values by phase show overlap-ping distributions with similar locations but slightly different midspreads and ranges(Figure 6). The assumptions for parametric statistical tests of differences in meansare independent random samples, normal distributions for each group, and equalstandard deviations. Despite a few mild outliers, the standard deviations are simi-lar and the two distributions do not appear to grossly violate the assumptions of
Table 2. Mean SI values
P R O C E E D I N G S V O L U M E I I • A R C H A E O L O G Y

S P A C E S Y N T A X F I R S T I N T E R N A T I O N A L S Y M P O S I U M • L O N D O N � � � �
�����
Figure 6. Side–by–side boxplots of SI
and Control distributions by phase for
small houses (Classic Bonito n = 85; Late
Bonito n = 290).
Figure 7. Side–by–side boxplots of SI
and Control distributions by phase
for great house roomblocks (Early
Bonito n = 45, Classic Bonito n = 158;
Late Bonito n = 170).
normality. A Student's t–test of differences in means was significant (p=.0168).The side– by–side boxplots and the significantly different SI distributions suggestthat space within small houses during the Late Bonito Phase was deeper and moresegregated.
The Control distributions were highly skewed for both phases, suggesting nonnormaldistributions. A natural logarithmic transformation of the Control values normalisedthe data, producing overlapping distributions with similar locations but differentmidspreads and ranges, and no outliers. A Student's t–test was not significant for the–logged Control variable.
3.2 Bonito Phase variation in great house roomblocks
The great house data set encompasses Early, Classic, and Late Bonito Phase con-struction. Side–by–side boxplots of SI distributions by phase show similar midspreadsand locations for the Classic and Late Bonito Phases, and a distinctly different,nonoverlapping distribution for the Early Bonito Phase (Figure 7). Outliers in theClassic and Late Bonito Phase boxplots and unequal standard deviations suggest thedistributions are nonnormal. Data transformations did not improve matters, and so anonparametric test was deemed appropriate. A Kruskal–Wallis test of SI by phasewas highly significant (p=.0001). Individual Wilcoxon Rank Sum tests of pairs ofphases confirmed that the significant differences lie between the Early Bonito Phaseand the other two phases. SI values for Classic and Late Bonito Phases were notsignificantly different.
Boxplots of logged Control distributions also show similar midspreads and locationsfor Classic and Late Phases, but an elongated, overlapping midspread for the EarlyBonito Phase. The logged Control distributions do not strongly violate the normalityassumptions for an analysis of variance. The result was highly significant (p=.003).Multiple comparisons (Bonferroni's t–tests, _ = .016) confirmed that, like the SIdistributions, Early Bonito Phase Control values are significantly different from bothClassic and Late Bonito values, but the latter are not significantly different from eachother. The boxplots and statistical tests suggest temporal differences distinguishingthe Early from the Classic and Late Bonito Phases in terms of integration and controlof space.
To summarize the results of the exploratory data analyses, statistically significantdifferences in SI values for both small and great houses across Bonito phases wereidentified. Control distributions were not statistically different for small houses, butwere for great houses. The observed differences in SI distributions over time requirecloser examination of patterning in spatial placement and function.
4 Spatial phenotypes: differentiation and patterningIn this section I will quantitatively examine patterning and differentiation in the ar-rangement of space within each great and small house. In syntactical terms, accessrelations in individual buildings are phenotypical expressions of an inequality geno-type (discussed below) (Hillier et al, 1987). Spatial differentiation at the phenotypicallevel was tested using the base difference factor statistic, as described in Hillier et al(1987). The strength or weakness of integration differences among spaces can be
D r We n d y B u s t a r d • S p a c e , E v o l u t i o n a n d F u n c t i o n i n t h e H o u s e s o f C h a c o C a n y o n
S P A C E S Y N T A X F I R S T I N T E R N A T I O N A L S Y M P O S I U M • L O N D O N � � � �
�����
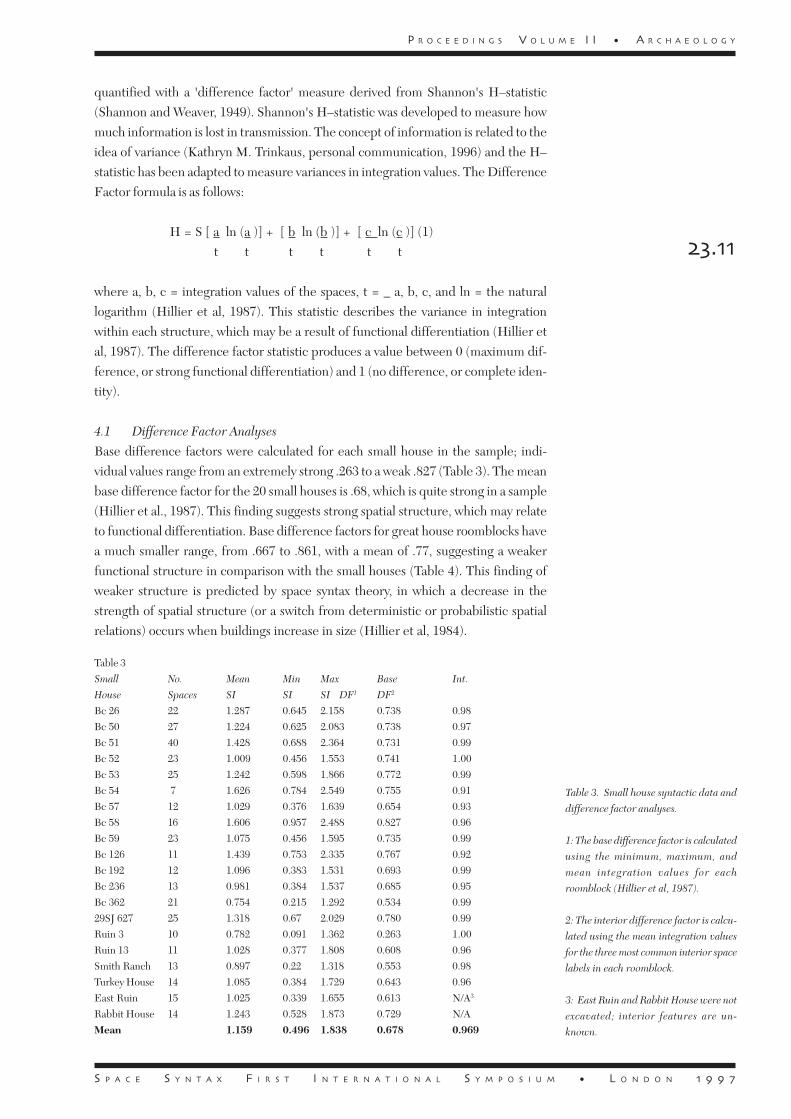
quantified with a 'difference factor' measure derived from Shannon's H–statistic(Shannon and Weaver, 1949). Shannon's H–statistic was developed to measure howmuch information is lost in transmission. The concept of information is related to theidea of variance (Kathryn M. Trinkaus, personal communication, 1996) and the H–statistic has been adapted to measure variances in integration values. The DifferenceFactor formula is as follows:
H = S [ a ln (a )] + [ b ln (b )] + [ c ln (c )] (1) t t t t t t
where a, b, c = integration values of the spaces, t = _ a, b, c, and ln = the naturallogarithm (Hillier et al, 1987). This statistic describes the variance in integrationwithin each structure, which may be a result of functional differentiation (Hillier etal, 1987). The difference factor statistic produces a value between 0 (maximum dif-ference, or strong functional differentiation) and 1 (no difference, or complete iden-tity).
4.1 Difference Factor Analyses
Base difference factors were calculated for each small house in the sample; indi-vidual values range from an extremely strong .263 to a weak .827 (Table 3). The meanbase difference factor for the 20 small houses is .68, which is quite strong in a sample(Hillier et al., 1987). This finding suggests strong spatial structure, which may relateto functional differentiation. Base difference factors for great house roomblocks havea much smaller range, from .667 to .861, with a mean of .77, suggesting a weakerfunctional structure in comparison with the small houses (Table 4). This finding ofweaker structure is predicted by space syntax theory, in which a decrease in thestrength of spatial structure (or a switch from deterministic or probabilistic spatialrelations) occurs when buildings increase in size (Hillier et al, 1984).
Table 3Small No. Mean Min Max Base Int.
House Spaces SI SI SI DF1 DF2
Bc 26 22 1.287 0.645 2.158 0.738 0.98Bc 50 27 1.224 0.625 2.083 0.738 0.97Bc 51 40 1.428 0.688 2.364 0.731 0.99Bc 52 23 1.009 0.456 1.553 0.741 1.00Bc 53 25 1.242 0.598 1.866 0.772 0.99Bc 54 7 1.626 0.784 2.549 0.755 0.91Bc 57 12 1.029 0.376 1.639 0.654 0.93Bc 58 16 1.606 0.957 2.488 0.827 0.96Bc 59 23 1.075 0.456 1.595 0.735 0.99Bc 126 11 1.439 0.753 2.335 0.767 0.92Bc 192 12 1.096 0.383 1.531 0.693 0.99Bc 236 13 0.981 0.384 1.537 0.685 0.95Bc 362 21 0.754 0.215 1.292 0.534 0.9929SJ 627 25 1.318 0.67 2.029 0.780 0.99Ruin 3 10 0.782 0.091 1.362 0.263 1.00Ruin 13 11 1.028 0.377 1.808 0.608 0.96Smith Ranch 13 0.897 0.22 1.318 0.553 0.98Turkey House 14 1.085 0.384 1.729 0.643 0.96East Ruin 15 1.025 0.339 1.655 0.613 N/A3
Rabbit House 14 1.243 0.528 1.873 0.729 N/AMean 1.159 0.496 1.838 0.678 0.969
Table 3. Small house syntactic data and
difference factor analyses.
1: The base difference factor is calculated
using the minimum, maximum, and
mean integration values for each
roomblock (Hillier et al, 1987).
2: The interior difference factor is calcu-
lated using the mean integration values
for the three most common interior space
labels in each roomblock.
3: East Ruin and Rabbit House were not
excavated; interior features are un-
known.
P R O C E E D I N G S V O L U M E I I • A R C H A E O L O G Y
S P A C E S Y N T A X F I R S T I N T E R N A T I O N A L S Y M P O S I U M • L O N D O N � � � �
�����
Table 4Room No. Mean Min Max Base Int.
Block Spaces SI SI SI DF DF
Bonito IA 19 0.831 0.283 1.132 0.694 0.92Bonito IBD 23 0.883 0.311 1.326 0.667 0.97Bonito IIIA 26 0.923 0.561 1.344 0.855 0.99Bonito VIA 28 1.514 0.788 2.303 0.793 0.96Bonito VIB1 41 2.246 1.511 3.481 0.861 0.99Bonito VIB2 40 1.664 1.05 3.175 0.751 N/A1
Arroyo IA 22 1.266 0.579 2.003 0.734 0.98Arroyo IIA 46 1.948 1.227 3.182 0.823 0.99Arroyo IIIA 41 1.117 0.62 1.791 0.792 0.99Kletso IA 42 1.138 0.47 1.887 0.678 0.99Kletso IB 35 1.996 1.203 3.458 0.778 1.00Mean 1.411 0.782 2.280 0.766 0.979
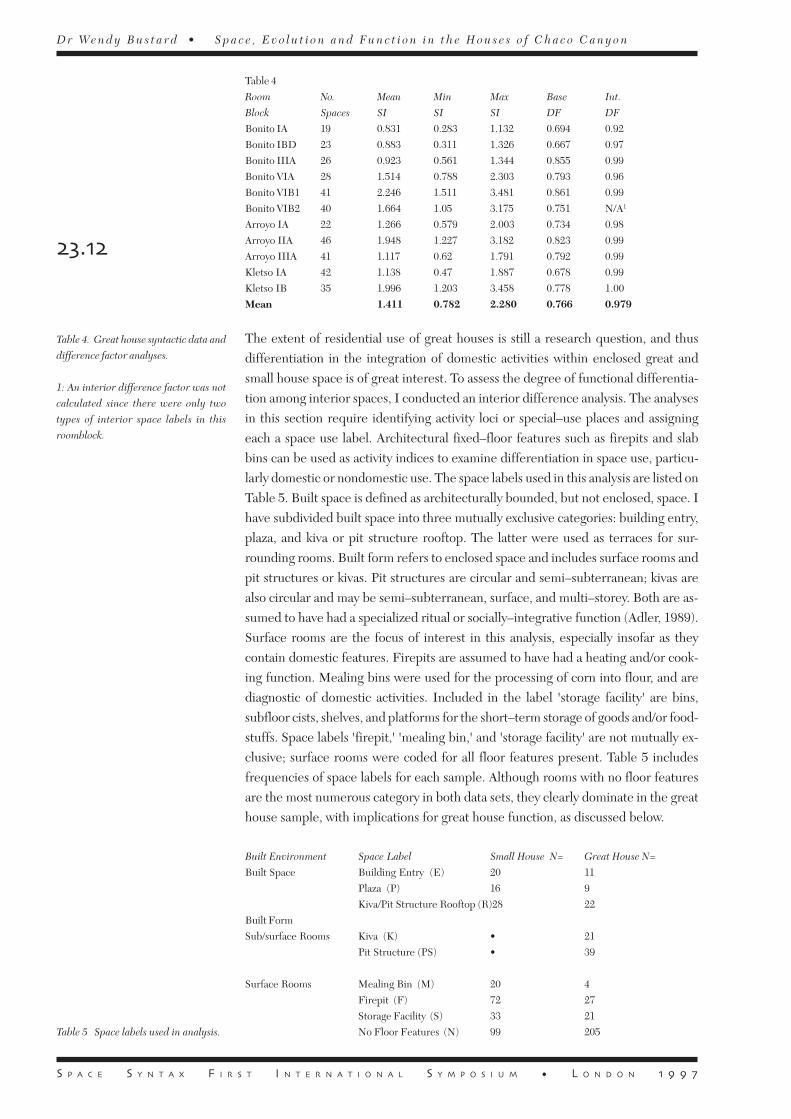
The extent of residential use of great houses is still a research question, and thusdifferentiation in the integration of domestic activities within enclosed great andsmall house space is of great interest. To assess the degree of functional differentia-tion among interior spaces, I conducted an interior difference analysis. The analysesin this section require identifying activity loci or special–use places and assigningeach a space use label. Architectural fixed–floor features such as firepits and slabbins can be used as activity indices to examine differentiation in space use, particu-larly domestic or nondomestic use. The space labels used in this analysis are listed onTable 5. Built space is defined as architecturally bounded, but not enclosed, space. Ihave subdivided built space into three mutually exclusive categories: building entry,plaza, and kiva or pit structure rooftop. The latter were used as terraces for sur-rounding rooms. Built form refers to enclosed space and includes surface rooms andpit structures or kivas. Pit structures are circular and semi–subterranean; kivas arealso circular and may be semi–subterranean, surface, and multi–storey. Both are as-sumed to have had a specialized ritual or socially–integrative function (Adler, 1989).Surface rooms are the focus of interest in this analysis, especially insofar as theycontain domestic features. Firepits are assumed to have had a heating and/or cook-ing function. Mealing bins were used for the processing of corn into flour, and arediagnostic of domestic activities. Included in the label 'storage facility' are bins,subfloor cists, shelves, and platforms for the short–term storage of goods and/or food-stuffs. Space labels 'firepit,' 'mealing bin,' and 'storage facility' are not mutually ex-clusive; surface rooms were coded for all floor features present. Table 5 includesfrequencies of space labels for each sample. Although rooms with no floor featuresare the most numerous category in both data sets, they clearly dominate in the greathouse sample, with implications for great house function, as discussed below.
Table 4. Great house syntactic data and
difference factor analyses.
1: An interior difference factor was not
calculated since there were only two
types of interior space labels in this
roomblock.
Built Environment Space Label Small House N= Great House N=
Built Space Building Entry (E) 20 11Plaza (P) 16 9Kiva/Pit Structure Rooftop (R)28 22
Built FormSub/surface Rooms Kiva (K) • 21
Pit Structure (PS) • 39
Surface Rooms Mealing Bin (M) 20 4Firepit (F) 72 27Storage Facility (S) 33 21No Floor Features (N) 99 205Table 5 Space labels used in analysis.
D r We n d y B u s t a r d • S p a c e , E v o l u t i o n a n d F u n c t i o n i n t h e H o u s e s o f C h a c o C a n y o n

S P A C E S Y N T A X F I R S T I N T E R N A T I O N A L S Y M P O S I U M • L O N D O N � � � �
�����
Using the mean SI values for the three most common interior space labels ineach great and small house, I calculated an interior difference factor. Thisanalysis resulted in mean interior difference factors of .97 and .98 for smalland great houses, respectively (Tables 3 and 4, East Ruin and Rabbit Houseare excluded because they have not been excavated and hence room featuresare unknown). These extremely weak values suggest little locationally–depend-ent functional differentiation among interior rooms. This finding of virtuallyno interior functional differentiation contrasts sharply with the strong meanbase difference factor for small houses of .68 and requires explanation. Fur-ther analysis is required to sort out the contradiction between these two sta-tistics. This will be accomplished by analysing SI values for each space label inthe small house sample. These analyses will identify the underlying structure,or genotype, for each sample and help to reconcile the difference factor re-sults. Statistical differences in spatial integration between built space and builtform, and between spatial functions, account for the overall robust spatial struc-ture suggested by the base difference factor.
Table 6. Spatial pattern for each small
house.
1: E=Building Entry,
F=Firepit,
K=Kiva,
M=Mealing Bin,
N=No Floor Features,
P=Plaza,
R=Rooftop,
S=Storage Facility
2: > = is more integrated than
Table 6Roomblock SI Order1
Bc 26 E >2 R > M > PS > S > F > N.65 .82 1.05 1.27 1.31 1.38 1.43
Bc 50 E > R > N > M > PS > F > S.67 .89 1.04 1.16 1.29 1.35 1.56
Bc 51 E > P > R > M > PS > F > S > N.67 .86 .99 1.31 1.33 1.41 1.5 1.68
Bc 52 E > P > F > PS > N.56 .58 .97 1.02 1.12
Bc 53 E > R > PS > N > S > F.6 .77 1.17 1.36 1.41 1.43
Bc 54 E > F > S > R > N > PS.98 1.08 1.37 1.57 2.06 2.55
Bc 57 E > M > R > PS > N > F > S.38 .68 .73 1.15 1.17 1.22 1.23
Bc 58 R > E > F > PS = M > S > N.96 1.34 1.56 1.6 1.6 1.98 2.23
Bc 59 E > R > M > S > PS > N > F.46 .75 .99 1.12 1.19 1.22 1.29
Bc 126 E > R > PS > N.83 .90 1.58 1.67
Bc 192 E > P > F > PS > N.38 .64 1.05 1.28 1.36
Bc 236 P > E > R > M > F > PS.38 .44 .93 .99 1.07 1.54
Bc 362 E > P > S > N > F > M > PS.43 .61 .65 .73 .81 .86 .98
SJ627 E > P > PS > F > M > S > N.67 .83 1.23 1.27 1.29 1.48 1.53
Ruin 3 P > E = F = M > N.09 .82 .82 .82 .89
Ruin 13 P > R > F > E > S > PS = N.38 .75 .96 1.06 1.09 1.43 1.43
Smith Ranch P > M > E = PS > F > N.22 .71 .82 .82 .95 .98
Turkey House P > E > M > F > N.38 .67 .77 1.15 1.2
P R O C E E D I N G S V O L U M E I I • A R C H A E O L O G Y

S P A C E S Y N T A X F I R S T I N T E R N A T I O N A L S Y M P O S I U M • L O N D O N � � � �
�����
4.2 Spatial phenotypes
Mean SI values for space labels can also be used to examine spatial patterning inaccess relations among houses. To discern patterns in spatial organization based onthe relative location of functions, a useful first step is to describe each small housethrough an ordering of SI values by label (Hillier et al, 1987). Table 6 lists the order ofSI means by space label (the spatial phenotype) for each small house; by convention,the most integrating space is placed first. General conclusions can be drawn fromthe data in this table, for instance, that building entries, plazas, and pit structurerooftops tend to be the most integrating spaces; however, no two small houses havethe same spatial pattern.
Table 7 lists the SI mean order for each great house roomblock. The spatial pheno-types for Pueblo Bonito IA and IBD are identical. Generally, plazas (or rooftop areas)are the most integrating spaces and no–floor–feature rooms the least. An exceptionis Pueblo Bonito VIB1, the first floor roomblock. Here, the order is almost com-pletely reversed: no–floor–feature rooms are the most integrating, and the exterior isthe least. Prior statistical analysis has established that this roomblock was signifi-cantly different from all other Pueblo Bonito roomblocks (Bustard, 1996a).
Table 7Roomblock SI Order1
Bonito IA P >2 F > K = E > S > N.28 .48 .76 .76 .81 .89
Bonito IBD P > F > K = E > S > N.31 .74 .75 .75 .78 1.02
Bonito IIIA P > E > R > N > S > K.56 .60 0.73 0.90 1.03 1.14
Bonito VIA P > E > F > S > N.79 1.0 1.06 1.38 1.7
Bonito VIB1 N > R = S > P > K > E2.16 2.3 2.3 2.55 2.63 2.88
Bonito VIB2 P = R > N > E = F1.39 1.39 1.68 1.73 1.73
Arroyo IA P > M > E > F > N.58 .89 1.02 1.09 1.17
Arroyo IIA P > R > E > K > M > S > F > N1.30 1.34 1.44 1.54 1.59 1.71 1.75 2.05
Arroyo IIIA P > R > S > F > E > M > K > N.68 .81 .93 .99 .101 1.09 1.15 1.2
Kletso IA R > K > E > N > F.68 1.06 1.11 1.33 1.42
Kletso IB R > K = E > S > F > N.14 1.89 1.89 2.03 2.04 2.33
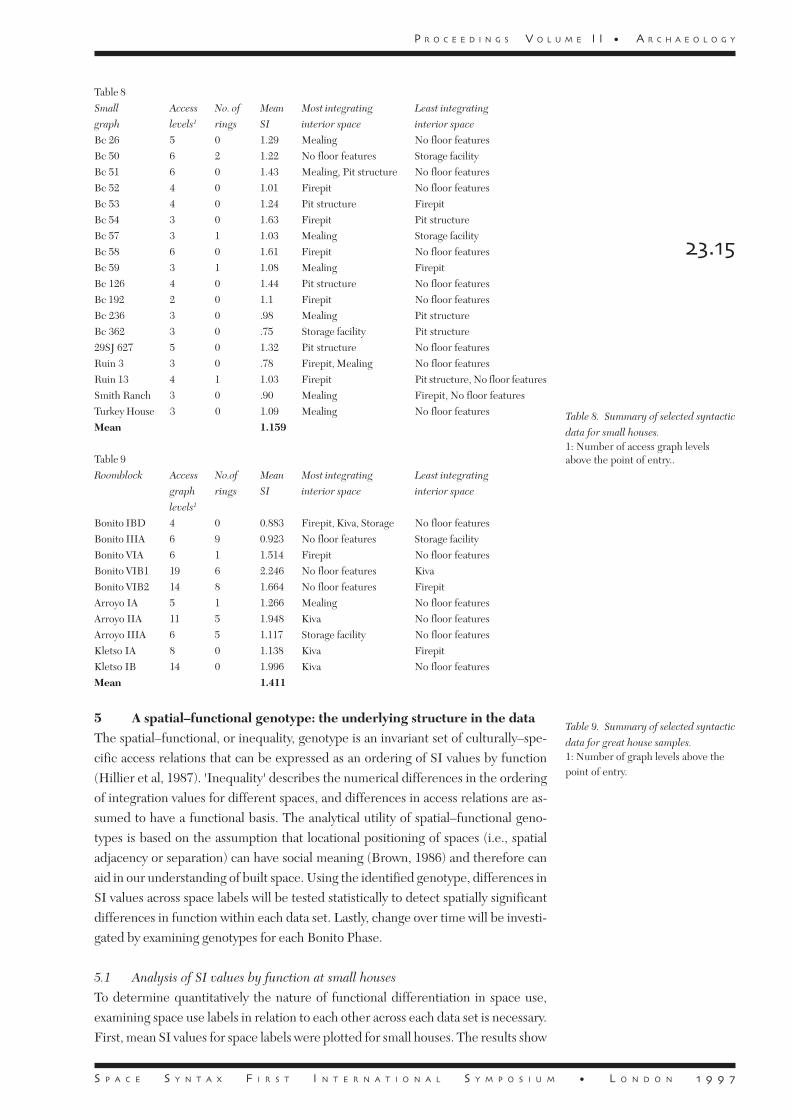
Tables 8 and 9 summarise selected syntactic data. Despite the lack of strong func-tional differentiation reflected in the weak interior difference factors, general pat-terns can be gleaned. For instance, mealing spaces are frequently the most integrat-ing interior spaces in small houses whereas kivas are the most common integratinginterior spaces in great houses. For both small and great houses, rooms with no floorfeatures are frequently the least integrating spaces. These qualitative observations
Table 7 Spatial pattern for each great
house roomblock
1: E=Building Entry,
F=Firepit,
K=Kiva,
M=Mealing Bin,
N=No Floor Features,
P=Plaza, R=Rooftop,
S=Storage Facility
2: > = is more integrated than
D r We n d y B u s t a r d • S p a c e , E v o l u t i o n a n d F u n c t i o n i n t h e H o u s e s o f C h a c o C a n y o n
S P A C E S Y N T A X F I R S T I N T E R N A T I O N A L S Y M P O S I U M • L O N D O N � � � �
�����
Table 8Small Access No. of Mean Most integrating Least integrating
graph levels1 rings SI interior space interior space
Bc 26 5 0 1.29 Mealing No floor featuresBc 50 6 2 1.22 No floor features Storage facilityBc 51 6 0 1.43 Mealing, Pit structure No floor featuresBc 52 4 0 1.01 Firepit No floor featuresBc 53 4 0 1.24 Pit structure FirepitBc 54 3 0 1.63 Firepit Pit structureBc 57 3 1 1.03 Mealing Storage facilityBc 58 6 0 1.61 Firepit No floor featuresBc 59 3 1 1.08 Mealing FirepitBc 126 4 0 1.44 Pit structure No floor featuresBc 192 2 0 1.1 Firepit No floor featuresBc 236 3 0 .98 Mealing Pit structureBc 362 3 0 .75 Storage facility Pit structure29SJ 627 5 0 1.32 Pit structure No floor featuresRuin 3 3 0 .78 Firepit, Mealing No floor featuresRuin 13 4 1 1.03 Firepit Pit structure, No floor featuresSmith Ranch 3 0 .90 Mealing Firepit, No floor featuresTurkey House 3 0 1.09 Mealing No floor featuresMean 1.159
Table 9Roomblock Access No.of Mean Most integrating Least integrating
graph rings SI interior space interior space
levels1
Bonito IBD 4 0 0.883 Firepit, Kiva, Storage No floor featuresBonito IIIA 6 9 0.923 No floor features Storage facilityBonito VIA 6 1 1.514 Firepit No floor featuresBonito VIB1 19 6 2.246 No floor features KivaBonito VIB2 14 8 1.664 No floor features FirepitArroyo IA 5 1 1.266 Mealing No floor featuresArroyo IIA 11 5 1.948 Kiva No floor featuresArroyo IIIA 6 5 1.117 Storage facility No floor featuresKletso IA 8 0 1.138 Kiva FirepitKletso IB 14 0 1.996 Kiva No floor featuresMean 1.411
Table 9. Summary of selected syntactic
data for great house samples.1: Number of graph levels above thepoint of entry.
Table 8. Summary of selected syntactic
data for small houses.1: Number of access graph levelsabove the point of entry..
5 A spatial–functional genotype: the underlying structure in the dataThe spatial–functional, or inequality, genotype is an invariant set of culturally–spe-cific access relations that can be expressed as an ordering of SI values by function(Hillier et al, 1987). 'Inequality' describes the numerical differences in the orderingof integration values for different spaces, and differences in access relations are as-sumed to have a functional basis. The analytical utility of spatial–functional geno-types is based on the assumption that locational positioning of spaces (i.e., spatialadjacency or separation) can have social meaning (Brown, 1986) and therefore canaid in our understanding of built space. Using the identified genotype, differences inSI values across space labels will be tested statistically to detect spatially significantdifferences in function within each data set. Lastly, change over time will be investi-gated by examining genotypes for each Bonito Phase.
5.1 Analysis of SI values by function at small houses
To determine quantitatively the nature of functional differentiation in space use,examining space use labels in relation to each other across each data set is necessary.First, mean SI values for space labels were plotted for small houses. The results show
P R O C E E D I N G S V O L U M E I I • A R C H A E O L O G Y

S P A C E S Y N T A X F I R S T I N T E R N A T I O N A L S Y M P O S I U M • L O N D O N � � � �
����
a consistent ordering of SI means from plazas to storage facility rooms (Figure 8).This ordering describes the underlying genotype for all small houses in this sample:
PLAZA > ROOFTOP > MEALING > FIREPIT > PIT STRUCTURE > NO FEA-TURES > STORAGE
This genotype is interpreted as plazas being the most accessible and integrating spaces,followed by rooftop areas, mealing bin rooms, and so on, with storage facility roomsthe least integrating, least accessible spaces. Intuitively, this pattern makes sensesince plazas and rooftops are public, shared spaces, while interior rooms may bemore private.
Side–by–side boxplots (Figure 9, the horizontal line is for assessing patterning) of SIvalues by space label grouped according to the two categories of the built environ-ment: enclosed and unenclosed space. The interquartile range distributions belowthe line represent building entries, plazas and pit structure rooftops. Distributionsabove the line represent interior spaces: pit structures and rooms with firepits, stor-age facilities, or no floor features. The anomaly is mealing bin rooms: this distribu-tion overlaps both groups. While the SI means for the space labels are different, theboxplots suggest they may not be significantly different. An analysis of variance amongall space label SI values yielded a highly significant p–value of .0001.
A multiple comparison analysis (Bonferroni's t–tests, _ = .01) pinpointed the amongst–group statistical difference, identifying three distinct groups: plazas, mealing rooms,and storage facility rooms. A particularly interesting outcome of the multiple com-parison analysis is that SI values for mealing bin rooms differ significantly from stor-age facility rooms and plazas. Mealing bin rooms may have been transition spacesfrom open, possibly public, areas to the enclosed, possibly private, rooms. Hillier andHanson (1982) note that as complexes grow, transition spaces play an increasinglyimportant role in segregating space. In this sample, mealing space effectively segre-gates, or separates, plaza space from short–term storage space. Pit structures, on theother hand, are functionally equivalent to rooms with firepits, storage facilities andno floor features in terms of depth and spatial integration. Based on this syntacticanalysis, the underlying functional structure for Chaco small houses in this samplecan be simplified as follows:
PLAZA > MEALING ROOM > STORAGE FACILITY ROOM
As suggested by Table 8, this analysis confirms that mealing rooms were, quantita-tively and qualitatively, the most integrating interior spaces in small houses. How-ever, storage facility rooms, not rooms with no floor features, are quantitatively themost segregated small house spaces.
5.2 Analysis of SI values by function at great houses
An examination of space labels in relation to each other provides a clearer under-standing of great house spatial organisation. Figure 10 shows a consistent ordering ofSI means from plazas to no–floor–feature rooms. This ordering describes the geno-type for the great house sample, and can be written as follows:
Figure 8. Ordering of mean SI values
by space label for all small houses
(P=Plaza, R=Rooftop, M=Mealing,
F=Firepit, PS=Pit Structure, N=No
Floor Features, S=Storage Facility)
Figure 10. Ordering of mean SI values by
space label for all great house roomblocks
(P=Plaza, R=Rooftop, M=Mealing,
K=Kiva, F=Firepit, S=Storage Facility,
N=No Floor Features).
Figure 9. Side–by–side boxplots of SI
distributions for small houses
(E=Building Entry, F=Firepit,
M=Mealing, N=No Floor Features,
P=Plaza, PS=Pit Structure, R=Rooftop,
S=Storage Facility)
D r We n d y B u s t a r d • S p a c e , E v o l u t i o n a n d F u n c t i o n i n t h e H o u s e s o f C h a c o C a n y o n
S P A C E S Y N T A X F I R S T I N T E R N A T I O N A L S Y M P O S I U M • L O N D O N � � � �
�����
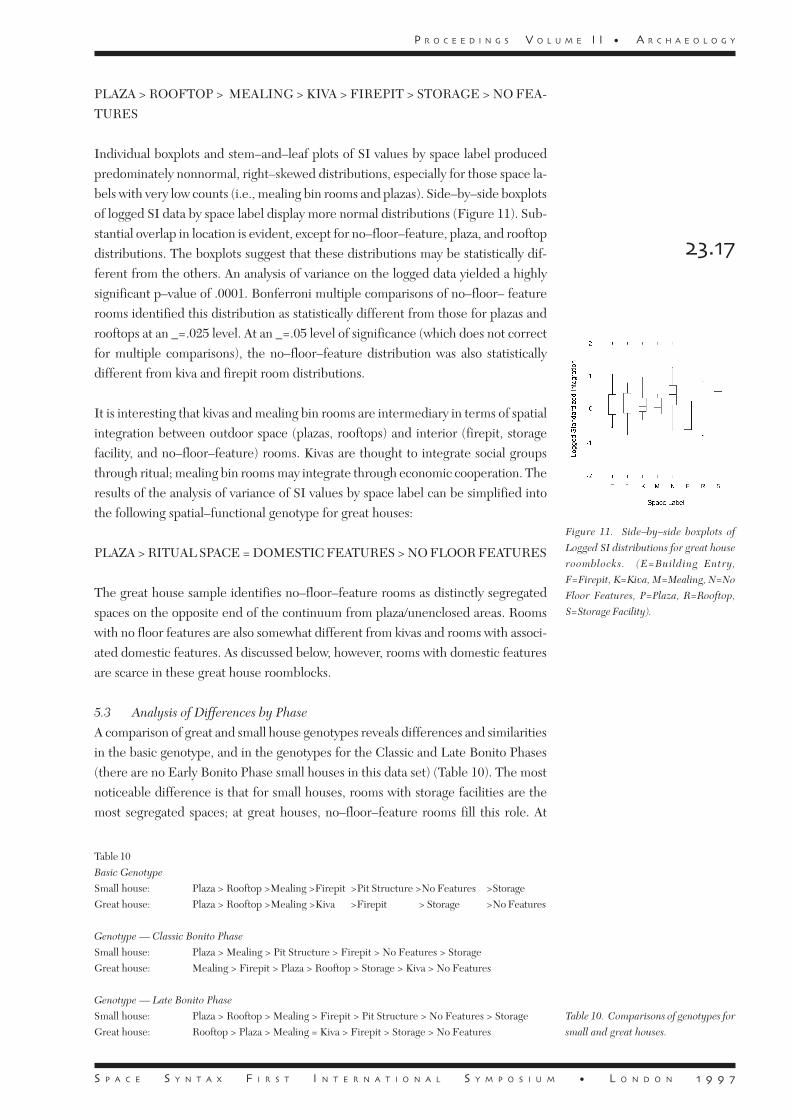
PLAZA > ROOFTOP > MEALING > KIVA > FIREPIT > STORAGE > NO FEA-TURES
Individual boxplots and stem–and–leaf plots of SI values by space label producedpredominately nonnormal, right–skewed distributions, especially for those space la-bels with very low counts (i.e., mealing bin rooms and plazas). Side–by–side boxplotsof logged SI data by space label display more normal distributions (Figure 11). Sub-stantial overlap in location is evident, except for no–floor–feature, plaza, and rooftopdistributions. The boxplots suggest that these distributions may be statistically dif-ferent from the others. An analysis of variance on the logged data yielded a highlysignificant p–value of .0001. Bonferroni multiple comparisons of no–floor– featurerooms identified this distribution as statistically different from those for plazas androoftops at an _=.025 level. At an _=.05 level of significance (which does not correctfor multiple comparisons), the no–floor–feature distribution was also statisticallydifferent from kiva and firepit room distributions.
It is interesting that kivas and mealing bin rooms are intermediary in terms of spatialintegration between outdoor space (plazas, rooftops) and interior (firepit, storagefacility, and no–floor–feature) rooms. Kivas are thought to integrate social groupsthrough ritual; mealing bin rooms may integrate through economic cooperation. Theresults of the analysis of variance of SI values by space label can be simplified intothe following spatial–functional genotype for great houses:
PLAZA > RITUAL SPACE = DOMESTIC FEATURES > NO FLOOR FEATURES
The great house sample identifies no–floor–feature rooms as distinctly segregatedspaces on the opposite end of the continuum from plaza/unenclosed areas. Roomswith no floor features are also somewhat different from kivas and rooms with associ-ated domestic features. As discussed below, however, rooms with domestic featuresare scarce in these great house roomblocks.
5.3 Analysis of Differences by Phase
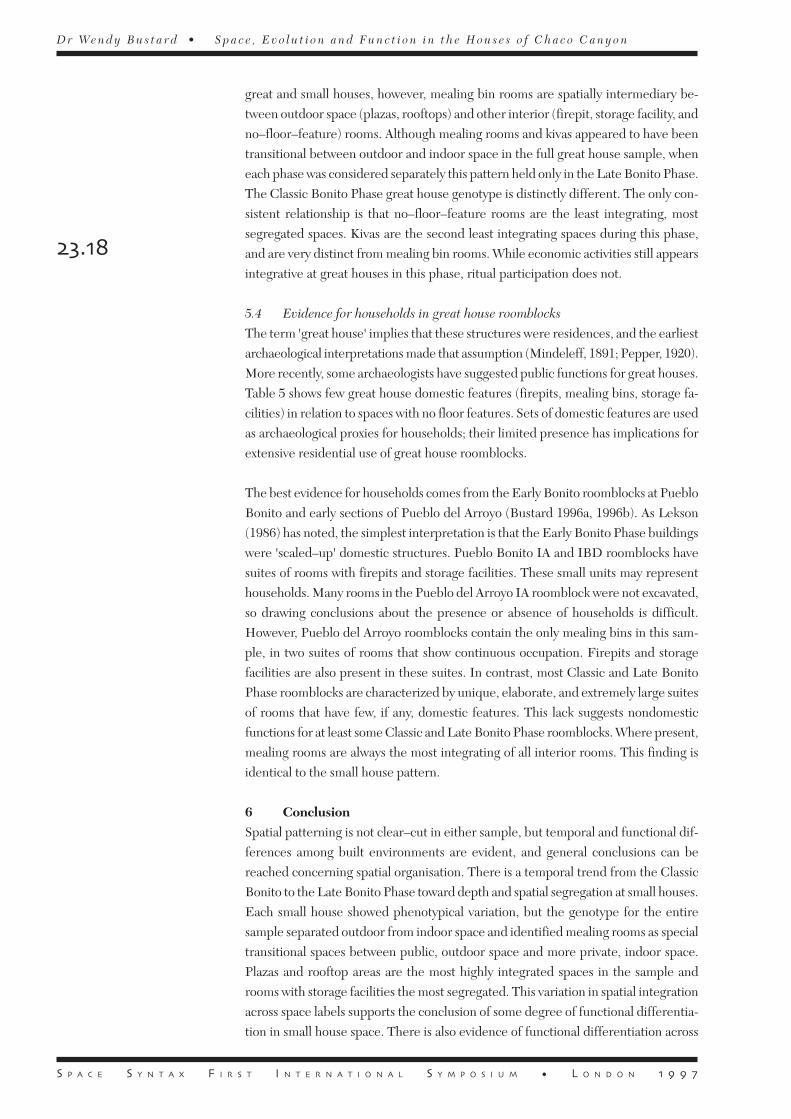
A comparison of great and small house genotypes reveals differences and similaritiesin the basic genotype, and in the genotypes for the Classic and Late Bonito Phases(there are no Early Bonito Phase small houses in this data set) (Table 10). The mostnoticeable difference is that for small houses, rooms with storage facilities are themost segregated spaces; at great houses, no–floor–feature rooms fill this role. At
Figure 11. Side–by–side boxplots of
Logged SI distributions for great house
roomblocks. (E=Building Entry,
F=Firepit, K=Kiva, M=Mealing, N=No
Floor Features, P=Plaza, R=Rooftop,
S=Storage Facility).
Table 10Basic Genotype
Small house: Plaza > Rooftop >Mealing >Firepit >Pit Structure >No Features >StorageGreat house: Plaza > Rooftop >Mealing >Kiva >Firepit > Storage >No Features
Genotype –– Classic Bonito Phase
Small house: Plaza > Mealing > Pit Structure > Firepit > No Features > StorageGreat house: Mealing > Firepit > Plaza > Rooftop > Storage > Kiva > No Features
Genotype –– Late Bonito Phase
Small house: Plaza > Rooftop > Mealing > Firepit > Pit Structure > No Features > StorageGreat house: Rooftop > Plaza > Mealing = Kiva > Firepit > Storage > No Features
Table 10. Comparisons of genotypes for
small and great houses.
P R O C E E D I N G S V O L U M E I I • A R C H A E O L O G Y
S P A C E S Y N T A X F I R S T I N T E R N A T I O N A L S Y M P O S I U M • L O N D O N � � � �
����
great and small houses, however, mealing bin rooms are spatially intermediary be-tween outdoor space (plazas, rooftops) and other interior (firepit, storage facility, andno–floor–feature) rooms. Although mealing rooms and kivas appeared to have beentransitional between outdoor and indoor space in the full great house sample, wheneach phase was considered separately this pattern held only in the Late Bonito Phase.The Classic Bonito Phase great house genotype is distinctly different. The only con-sistent relationship is that no–floor–feature rooms are the least integrating, mostsegregated spaces. Kivas are the second least integrating spaces during this phase,and are very distinct from mealing bin rooms. While economic activities still appearsintegrative at great houses in this phase, ritual participation does not.
5.4 Evidence for households in great house roomblocks
The term 'great house' implies that these structures were residences, and the earliestarchaeological interpretations made that assumption (Mindeleff, 1891; Pepper, 1920).More recently, some archaeologists have suggested public functions for great houses.Table 5 shows few great house domestic features (firepits, mealing bins, storage fa-cilities) in relation to spaces with no floor features. Sets of domestic features are usedas archaeological proxies for households; their limited presence has implications forextensive residential use of great house roomblocks.
The best evidence for households comes from the Early Bonito roomblocks at PuebloBonito and early sections of Pueblo del Arroyo (Bustard 1996a, 1996b). As Lekson(1986) has noted, the simplest interpretation is that the Early Bonito Phase buildingswere 'scaled–up' domestic structures. Pueblo Bonito IA and IBD roomblocks havesuites of rooms with firepits and storage facilities. These small units may representhouseholds. Many rooms in the Pueblo del Arroyo IA roomblock were not excavated,so drawing conclusions about the presence or absence of households is difficult.However, Pueblo del Arroyo roomblocks contain the only mealing bins in this sam-ple, in two suites of rooms that show continuous occupation. Firepits and storagefacilities are also present in these suites. In contrast, most Classic and Late BonitoPhase roomblocks are characterized by unique, elaborate, and extremely large suitesof rooms that have few, if any, domestic features. This lack suggests nondomesticfunctions for at least some Classic and Late Bonito Phase roomblocks. Where present,mealing rooms are always the most integrating of all interior rooms. This finding isidentical to the small house pattern.
6 ConclusionSpatial patterning is not clear–cut in either sample, but temporal and functional dif-ferences among built environments are evident, and general conclusions can bereached concerning spatial organisation. There is a temporal trend from the ClassicBonito to the Late Bonito Phase toward depth and spatial segregation at small houses.Each small house showed phenotypical variation, but the genotype for the entiresample separated outdoor from indoor space and identified mealing rooms as specialtransitional spaces between public, outdoor space and more private, indoor space.Plazas and rooftop areas are the most highly integrated spaces in the sample androoms with storage facilities the most segregated. This variation in spatial integrationacross space labels supports the conclusion of some degree of functional differentia-tion in small house space. There is also evidence of functional differentiation across
D r We n d y B u s t a r d • S p a c e , E v o l u t i o n a n d F u n c t i o n i n t h e H o u s e s o f C h a c o C a n y o n
S P A C E S Y N T A X F I R S T I N T E R N A T I O N A L S Y M P O S I U M • L O N D O N � � � �
�����
small houses. A preponderance of mealing facilities at Bc 362 and firepits at Bc 236hints that all Late Bonito Phase small houses were not functionally equivalent. Tan-talizingly, mealing rooms appear to be associated with more than one dwelling unit(Bustard, 1996b). These threads of evidence lead me to the hypothesis that coopera-tion in food processing occurred at a social level above the individual household. Ifso, mealing rooms may have served as a means of economic integration in much thesame way that kivas are argued to have served as a mean of social integration ––through the daily, face–to–face meeting of members of the community (Adler, 1989).
Great house roomblocks show clear temporal differences: Early Bonito Phase spacesare more integrated than either Classic or Late Bonito Phase spaces, regardless offunction. A marked increase in spatial connectivity, evidenced by the large numberof rings of rooms, characterises the transition between Early and Classic Bonito Phaseroomblocks. Great house roomblocks displayed considerable variation in phenotypes,but the genotype identified the same spatial relations as small houses: plazas androoftops are the most integrating spaces in both house types. In contrast to smallhouses, great house space is strongly invested in rooms with no floor features, andthese rooms are more spatially segregated than other spaces. Lastly, there is littlefunctional differentiation within great houses and limited evidence for households.
A lack of households in great houses confounds early interpretations. Explanationsfor the these distinctive structures were slow in coming, but within the last two dec-ades various models have been put forth. Stein and Lekson (1992, page 91, emphasisin original) observe that, "[a]ny explanation of Chaco must essentially ask What's theBig Idea?" underlying the great houses. Recent functional 'big idea' models devel-oped for Chaco include great houses as: (1) elite residences (Schelberg, 1992; Sebas-tian, 1988); (2) storage facilities (Lekson, 1986); (3) redistribution/periodic centres(Judge, 1984; Windes, 1987); (4) ritual centres (Judge, 1991; Stein and Lekson, 1992;Toll, 1985); and (5) residences of different cultures (Vivian, 1990).
The spatial implications of these models vary, and the results of this syntactical analysiscan be used to evaluate them. For model 1, elite residences should contain many similarroom types as nonelite residences, but the number, scale, and organisation should bedifferent. The same room types are present at both great and small houses and the number,scale, and organisation of rooms are different between great and small houses. However,these variables also vary within each category by great house. Furthermore, the roomblockswith the clearest evidence of domestic use (Pueblo Bonito IA, IBD and Pueblo del ArroyoIA) are organisationally very similar to small houses (Bustard 1996a).
Models 2, 3, and 4 require specialized rooms not found in residences, and theserooms should contain little evidence of domestic features. Although little evidenceof domestic features exists from A.D. 1000 on, the first roomblock of Pueblo delArroyo is an exception. The predominance of highly segregated rooms with no floorfeatures does contrast with small house rooms, which contain many more domesticfloor features. However, the organisation of no–floor–feature rooms differs from greathouse to great house (Bustard, 1996b). For model 5, redundant units with domesticfeatures are expected. The distribution of domestic features shows a nearly completelack of redundant great house households after the Early Bonito Phase.
P R O C E E D I N G S V O L U M E I I • A R C H A E O L O G Y

S P A C E S Y N T A X F I R S T I N T E R N A T I O N A L S Y M P O S I U M • L O N D O N � � � �
�����
From the evidence, it seems unlikely that any one of these models fits all great houses.The syntactical evidence is best explained by a mixed–use model for great housesrather than a single function model. Great houses may not be exclusively storage orritual or administrative centres, nor either residences or public architecture. Thesmall houses do appear domestic in nature and organisation. However there is alsoevidence that not all small houses are equal: functional specialisation may be present.Examining the social, spatial, and functional relationships of kivas and mealing binrooms at both great and small houses seems a promising avenue for future inquiry toglean evidence from the data on this point. The spatial complexity of Chaco Canyonis indisputable. Our models of social organisation must also be complex.
Notes1. Blocked doors are frequently reported for great and small house rooms. In cases where it seemed likelythat doors were used only for construction access and blocked immediately afterwards (for instance, wheremasonry in the doorway matched that of the wall), these doors were excluded on the access graphs (Bustard,1996b).
Although blocked doors are often interpreted as marking changes in social organisation (i.e., rooms fallinto disuse within the domestic cycle of a household), other factors may be at work as well (Creamer,1993). Recent studies of site abandonment have distinguished among seasonal, episodic, and permanentmodes of abandonment (Brooks, 1993) as well as the effects of the anticipated length of absence (Schlangerand Wilshusen, 1993). As Cooper (1995) notes, Puebloans commonly used masonry to block doors duringseasonal absences, prior to the use of milled lumber for doors. In cases where all exterior doors are blocked,temporary (either seasonal or episodic) abandonment seems a likely explanation. Conversely, when a struc-ture is permanently abandoned there is no need to protect room contents by sealing doors. Whatever thereason for subsequent blocking, in the construction of the access graphs I have assumed all doorwayswere originally open and provided access.
2. The elongated access graphs for the first and second floors of Pueblo Bonito Stage VIB (VIB1 andVIB2, respectively) are to some extent the result of treating this stage as a separate unit. Doors in the westwalls of rooms 187, 188, 244, 256, and 258 linked Stage VIB to early construction units, lessening thephysical depth. However, a lateral access pattern dominates this stage and creates the unusual depth.Similarly, the long branch of Kin Kletso Stage IB is a conservative treatment of this unit. In the absence ofdoors leading to the rooftop of kiva B, I chose room 31 as point of entry. Multiple entries from the rooftoparea would produce a series of circulation rings and an access graph similar to that for Pueblo Bonito StageIIIA. See Cooper (1995) for alternative access graphs.
3. Standardized Integration values are RRA values, that is, integration values divided by the D–value forthe number of spaces in each roomblock (see Hillier and Hanson, 1984, Table 3).
ReferencesAdler M, 1989, “Ritual Facilities and Social Integration in Nonranked Societies”, in The Architecture of
Social Integration of Prehistoric Pueblos Eds W D Lipe and M Hegmon (Crow Canyon ArchaeologicalCenter, Cortez, Colorado) pp 35 - 52Brooks R, 1993, “Household Abandonment Among Sedentary Plains Societies: Behavioral Sequences andConsequences in the Interpretation of the Archaeological Record”, in Abandonment of Settlements and
Regions: Ethnoarchaeological and Archaeological Approaches, Eds C M Cameron, S A Tomka (Cam-bridge University Press, Cambridge) pp 178 - 187Brown F, 1986, “Continuity and Change in the Urban House: Developments in Domestic Space Organisa-tion in Seventeenth Century London”, Comparative Studies in Society and History 28, 558 - 590Bustard W, 1995, “Genotypes of Space: A Spatial Analysis of Domestic Structures in Chaco Canyon”,paper presented at the 60th Annual Meeting of the Society for American Archaeology, MinneapolisBustard W, 1996a, “Pueblo Bonito: When a House is not a Home”, paper presented in the Pueblo Bonito'sArchaeological Centennial Symposium at the 61st Annual Meeting of the Society for American Archaeol-
ogy, New OrleansBustard W, 1996b Space as Place: Small and Great House Spatial Organization in Chaco Canyon, New Mexico,
D r We n d y B u s t a r d • S p a c e , E v o l u t i o n a n d F u n c t i o n i n t h e H o u s e s o f C h a c o C a n y o n

S P A C E S Y N T A X F I R S T I N T E R N A T I O N A L S Y M P O S I U M • L O N D O N � � � �
�����
A.D. 1000-1150, Ph D dissertation, Department of Anthropology, University of New Mexico, AlbuquerqueCooper L, 1995 Space Syntax Analysis of Chacoan Great Houses, Ph D dissertation, Department ofAnthropology, University of Arizona, TucsonCreamer W, 1993 The Architecture of Arroyo Hondo Pueblo, New Mexico (School of American ResearchPress, Santa Fe)Hartwig F, Dearing B, 1979 Exploratory Data Analysis (Sage Publications, Beverly Hills)Hillier B, Hanson J, 1982 “Discovering Housing Genotypes”, Working paper, Unit for Architectural Stud-ies, Bartlett School of Architecture and Planning, University College LondonHillier B, Hanson J, 1984 The Social Logic of Space (Cambridge University Press, Cambridge)Hillier B, Hanson J, Peponis J, 1984, “What Do We Mean By Building Function?” in Designing for Build-
ing Utilisation, Eds J Powell, I Cooper, S Lera (Spon, London) pp 61 - 72Hillier B, Hanson J, Graham H, 1987, “Ideas are in Things: An Application of the Space Syntax Method toDiscovering House Genotypes” Environment and Planning B: Planning and Design 14 363 - 385Judge W J, 1984, “New Light on Chaco Canyon”, in New Light on Chaco Canyon Ed D Noble (School ofAmerican Research Press, Santa Fe) pp 1 - 12Judge W J, 1991, “Chaco: Current View of Prehistory and the Regional System”, in Chaco and Hohokam:
Prehistoric Regional Systems in the American Southwest Eds P Crown, W J Judge (School of AmericanResearch Press, Santa Fe) pp 11 - 30Lekson S, 1986 Great Pueblo Architecture of Chaco Canyon, New Mexico (University of New MexicoPress, Albuquerque)Mindeleff V, 1891, “A Study of Pueblo Architecture: Tusayan and Cibola”, in Eighth Annual Report of theBureau of Ethnology (Smithsonian Institution, Washington, D.C,) pp 3 - 228Pepper G, 1920 Pueblo Bonito (Anthropological Papers Vol. XXVII American Museum of Natural History,New York)Saile D, 1977, “'Architecture' in Prehispanic Pueblo Archaeology; Examples From Chaco Canyon, NewMexico” World Archaeology 9 157 - 173Schelberg J, 1992 “Hierarchical Organization as a Short-Term Buffering Strategy in Chaco Canyon”, inAnasazi Regional Organization and the Chaco System Ed D Doyel (Maxwell Museum of Anthropology,Anthropological Papers No. 5, University of New Mexico, Albuquerque) pp 59 - 71Schlanger S, Wilshusen R, 1993, “Local Abandonments and Regional Conditions in the North AmericanSouthwest”, in Abandonment of Settlements and Regions: Ethnoarchaeological and Archaeological Ap-
proaches Eds C Cameron, S Tomka (Cambridge University Press, Cambridge) pp 85 - 98Sebastian L, 1988 Leadership, Power, and Productive Potential: A Political Model of the Chaco System,Ph.D dissertation, Department of Anthropology, University of New Mexico, AlbuquerqueShannon C, Weaver W, 1949 The Mathematical Theory of Communication (University of Illinois Press,Urbana)Stein J, Lekson S, 1992, “Anasazi Ritual Landscapes”, in Anasazi Regional Organization and the Chaco
System Ed D Doyel (Maxwell Museum of Anthropology, Anthropological Papers No. 5, University ofNew Mexico, Albuquerque) pp 87 - 100Toll H W, 1985 Pottery, Production, Public Architecture and the Chaco Anasazi System, Ph D dissertation,Department of Anthropology, University of Colorado, Boulder.Vivian R G, 1990 The Chacoan Prehistory of the San Juan Basin (Academic Press, New York)Windes T, 1987 Investigations at the Pueblo Alto Complex, Chaco Canyon, New Mexico 1975-1979 3 vol(Publications in Archeology 18F, Chaco Canyon Studies, National Park Service, Santa Fe)
P R O C E E D I N G S V O L U M E I I • A R C H A E O L O G Y

S P A C E S Y N T A X F I R S T I N T E R N A T I O N A L S Y M P O S I U M • L O N D O N � � � �
�����