spain exporter guide annual 2012 - usda gain publications/exporter guide... · spain tel.:...
TRANSCRIPT

THIS REPORT CONTAINS ASSESSMENTS OF COMMODITY AND TRADE ISSUES MADE BY
USDA STAFF AND NOT NECESSARILY STATEMENTS OF OFFICIAL U.S. GOVERNMENT
POLICY
Date:
GAIN Report Number:
Post:
Madrid
Approved By:
Prepared By:
Report Highlights:
Spain’s economy remains characterized by soaring unemployment rate and virtually zero GDP growth.
In fiscal year (FY) 2012, Spain imported $1.1 billion of agricultural, fish and forest products from the
United States, 32 percent down compared to the previous year, although trade did rebound in the last
quarter of calendar year 2012. Despite the apparent negative prospects, the dynamic Spanish market
still offers opportunities for certain consumer-oriented food items, as well as long-term prospects for
other products. This report provides guidance to U.S. companies interested in exporting high-value
consumer-ready food products to Spain and includes an overview of the country's economic situation,
market structure, and export requirements.
Arantxa Medina
Marketing and Management Specialist
Robert Hanson
Agricultural Counselor
2012
EXPORTER GUIDE ANNUAL
Spain
SP1243
2/04/2013
Required Report - public distribution

INDEX
SECTION I MARKET OVERVIEW SECTION II EXPORTER BUSINESS TIPS SECTION III MARKET SECTOR STRUCTURE AND TRENDS SECTION IV BEST HIGH-VALUE PRODUCT PROSPECTS SECTION V. KEY CONTACTS AND FURTHER INFORMATION
APPENDIX – STATISTICS
A. KEY TRADE AND DEMOGRAPHIC INFORMATION B. CONSUMER FOOD AND EDIBLE FISHERY PRODUCT IMPORTS C. TOP 15 SUPPLIERS OF CONSUMER FOODS AND EDIBLE FISHERY PRODUCTS

SECTION I. MARKET OVERVIEW
ECONOMIC TRENDS
AGRICULTURAL PRODUCTS IMPORTS ($
Million) (1)
2008 2009 2010 2011 2012* 2013** Total Agricultural, Fish and Forestry Products 40,500 33,005 34,218 39,917 36,700 36,500 Total U.S. Agricultural, Fish and Forestry Products 1,882 952 1,318 1,525 1,100 1,400 Total Food Products 37,101 31,887 32,559 38,017 35,400 35,000 Total U.S. Food Products 1,730 911 1,322 1,535 1,000 1,300 Total Fish and Seafood Products 7,041 5,837 6,412 7,174 7,000 6,500 Total U.S. Fish and Seafood Products 127 104 114 122 113 110 (1) Global Trade Atlas (www.gtis.com) (*) Estimate (**) Forecast
Unemployment in Spain is the highest in the European Union, reaching 25.02 percent in late 2012 and
topping 26 percent by the end of the year. The Spanish economy’s excessive reliance on the
construction sector along with the global economic crisis severely hit the country, causing
unemployment to rise from 8.3 percent in 2007 to 20.1 percent by the end of 2010. This situation has
negatively affected retail food sales, consumer confidence and overall retail sales performance.
Discount retailers and other lower-price outlets are making the most of the recession as a growing
number of consumers become increasingly price-sensitive. Changes in Spain’s domestic market
regulations, including more liberal Sunday shopping laws, are expected to give a boost to slow retail
sales.
Spain has a diversified distribution structure for food products, ranging from traditional distribution
methods -- whereby wholesalers sell to small shops that cater directly to the public -- to large
multinational supermarkets and retail stores. Department stores, hypermarkets, shopping centers and
very specialized outlets are introducing the customer fidelity concept, which usually involves issuing
client cards, cumulative discounts and special offers for frequent customers. Innovative sales
techniques are becoming increasingly popular. Vending machines have spread throughout Spain over
the past decade. Direct marketing by mail order, telephone, TV or e-commerce is growing
considerably.
The European Union (EU) establishes the rules and regulations governing acceptable sanitary,
phytosanitary, general trade, and labeling practices in Spain. As a result, U.S. exporters already
exporting to other EU countries most likely already know and can meet most of the requirements for
exporting to Spain. The key for a U.S. exporter wishing to enter this market is to find an agent or
distributor, or to establish a subsidiary. An experienced representative in Spain will likely be familiar

with all the different consumption patterns and preferences in each of the country’s 17 autonomous
regions.
The Office of Agricultural Affairs in Madrid is dedicated to helping U.S. food and agricultural product
exporters access the Spanish market. Please contact us at:
Foreign Agricultural Service
Office of Agricultural Affairs
U.S. Embassy Madrid
Serrano, 75 – Box 2000
APO AE 09642
28006 Madrid
Spain
Tel.: +34-91-587 2555
Fax: +34-91-587 2556
Email: [email protected]; Web: http://madrid.usembassy.gov/about-us/fas.html
ADVANTAGES AND CHALLENGES FACING U.S. PRODUCTS IN SPAIN
Advantages Challenges Spain’s food industry relies on imported
ingredients, many from the U.S. Spain’s financial situation, two main effects on retail:
sinking domestic demand, lack of credit for
companies. Tourism is a strong and ever-growing sector that
provides retail, food and drink sales. Lack of consumer awareness of U.S. brands and
varieties of U.S. products. Good image and reputation of U.S. products. Competition from neighboring EU countries, where
tastes and traditional products may be well known. Good network of agents and importers to help get
product into the market. U.S. exports face higher transportation costs and
difficulties in shipping mixed or smaller container
loads. Consumers are increasingly health conscious,
demanding products not sufficiently present in the
market.
EU labeling, traceability, and packaging laws.
Distribution structure is modern and many
companies cover both Spain and Portugal. High import tariffs impose a price disadvantage on
non-EU based companies.
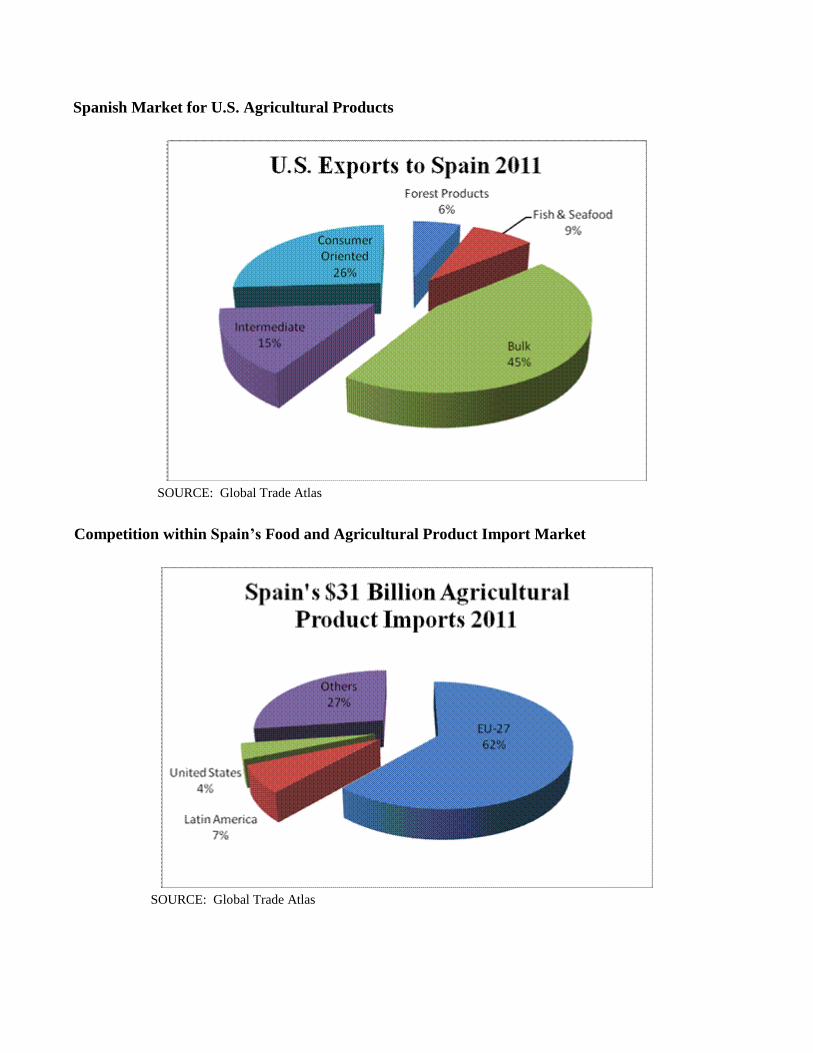
Spanish Market for U.S. Agricultural Products
SOURCE: Global Trade Atlas
Competition within Spain’s Food and Agricultural Product Import Market
SOURCE: Global Trade Atlas

SECTION II. BUSINESS TIPS FOR EXPORTERS
Local Business Customs
Success in introducing your product to the Spanish market depends on acquiring local representation
and personal contact. The advantages of local representation include market knowledge, up-to-date
information and guidance on business practices and trade law, sales contacts, and market development
expertise.
Spain has a number of sales channels ranging from traditional distribution methods – whereby
wholesalers sell to small retail shops that sell to the public -- to large multinational supermarkets and
retail stores. However, personal relationships are still very important, especially within smaller
organizations. There is no substitute for face-to-face meetings with Spanish business representatives in
order to break into this market.
The decision-making process within a Spanish company may be different from that in the United
States. An initial "yes" usually means that the company will study the situation, and not necessarily
that they will buy the product. Once a deal is struck, the Spanish company will likely expect the U.S.
firm to translate into Spanish all commercial brochures, technical specifications and other relevant
marketing materials. Decision makers at Spanish firms may speak English, but paperwork should be in
Spanish.
The Spanish market is composed of a number of regional markets serviced by two major hubs, Madrid
and Barcelona. The vast majority of agents, distributors, foreign subsidiaries and government-
controlled entities that make up the economic power block of the country operate in these two hubs.
Dealers, branch offices, and government offices found outside these two hubs will almost invariably
obtain their supplies from their Madrid and Barcelona contacts rather than engage in direct importation.
Market Entry Strategies
Market entry strategies for US products intending to enter the Spanish market should include:
1. Market research in order to assess product opportunities
2. Advanced calculations of the cost of introducing the product in the Spanish market, in
order to prove its competitiveness in the local market.
3. Identify an experienced distributor or independent reliable agent to advise on import
duties, sanitary regulations and labeling requirements.
4. Explore purchasing arrangements of the larger retail channels.
General Consumer Tastes and Preferences

According to Euromonitor, the recession is expected to shift some consumer habits. The economic
downturn had a significant impact on Spanish consumers, with most consumers trading down on their
shopping habits.
Consumer confidence continued to fall in 2012. According to the Consumer Confidence Index (CCI)
published in October 2012 by the Centre for Sociological Research (CIS), consumer confidence is at its
lowest historical levels. The CCI is monthly assessment of recent developments and expectations of
Spanish consumers related to family finances and employment used to anticipate their consumption
decisions. The negative economic expectations, high unemployment, shrinking family incomes, the
continued increases in prices are important factor affecting this index and affecting consumer spending.
In order to change this tendency, some leading retail chains offer an increasing number of new and
innovative services intending to soften the impact of recession. As consumers are more price-sensitive,
store brands are becoming more popular, offering better value than branded products.
Food Standards and Regulations
For more information on food standards and regulations, please consult the Food and Agricultural
Import Regulations and Standards Report (FAIRS) and the FAIRS Export Certificate Report for the EU
and Spain at http://www.fas.usda.gov/scriptsw/AttacheRep/default.asp
Also, please check the U.S. Mission to the European Union web page at http://www.usda-eu.org for
helpful information on exporting U.S. food and agricultural products into the EU.
General Import and Inspection Procedures
Spain follows the Harmonized Nomenclature and Classification System (HS) and applies import duties
according to a maximum and minimum rate schedule. The minimum tariff rate is applied to goods
originating in countries entitled to the benefits of most-favored nation treatment -- that is, members of
the World Trade Organization (WTO), including the United States, and countries with which the EU
has signed trade agreements. In some instances, Free Trade Agreements negotiated between the EU
and other countries provide for tariff-free access to the European market – leaving U.S. exporters at a
disadvantage.
The local importer has primary responsibility with the Spanish Government for imported food products
once they enter Spanish territory. Therefore, the Spanish agent/importer should guide the U.S. exporter
through the entire process of marketing a U.S. food or agricultural product in Spain.
The following documents are required for ocean or air cargo shipments of food products into Spain:
Bill of Lading and/or Airway Bill
Commercial Invoice

Phytosanitary Certificate and/or Health Certificate, when applicable
Import Certificate
Most food products require an Import Certificate issued by the competent authority. The Import
Certificate is obtained by the Spanish importer and/or the agent involved in the transaction and is
intended for tariff classification purposes.
Please keep in mind that if the product you are exporting into Spain does not comply with EU
harmonized regulations, Spanish customs or health authorities may not allow entry of the product.
For more information on import and inspection procedures in Spain, please see Food Standards and
Regulations within this report.
SECTION III. MARKET SECTOR STRUCTURE AND TRENDS
Food Retail Sector

The Spanish retail food market is highly diversified. Hypermarkets/supermarkets, convenience stores,
major discount stores and specialized stores coexist with traditional corner grocery stores and open-air
markets. Yet, the total number of retail outlets decreased over the past decade and the consolidation of
the retail food industry continues.
In Spain, hyper and supermarkets account for more than 70 percent of total food sales.
There is increasing competition in the scope and range of product offerings, including ready-to-
eat and/or ready-to-cook foods, take away meals, and home delivery - and the prices and
services retailers offer consumers.
An increasing supply of imported products has intensified competition among suppliers and
retailers.
EU Member States are the major suppliers of consumer-ready products to other EU countries.
Market Structure:
For more information on the Spanish Retail Food Sector, please consult the retail sector reports for
Spain at http://www.fas.usda.gov/scriptsw/AttacheRep/default.asp
HRI Sector
The HRI sector expanded significantly during the mid 80’s and 90’s and into 2008, as a result of the
profound social and economic changes unleashed upon Spain’s accession to the EU in 1986. In 2007,
U.S. Exporter
U.S.
Representative
for Europe
Importer; Broker;
Distributor; Agent;
Wholesaler
Retail Food
Sector

HRI expansion was hard hit by the economic, real estate and financial crises. As Spain is expected to
be one of the last EU countries to recover from the current recession, the HRI downturn is expected to
continue throughout well into 2013. A figure to illustrate this fact: in the last 5 years, 12,000 bars and
restaurants closed down due to the economic crisis.
Spain is one of the top tourism destinations in the world, with increasing numbers of tourists every year,
boosting demand for meals in the HRI sector. Tourism, particularly foreign tourism, is one of the few
sectors bringing optimism to the Spanish economy. From January to October 2012, Spain received 52.1
million international tourists, up 3.1 percent over the same period of 2011, according to the survey
conducted by the Ministry of Industry, Energy and Tourism. The main origins were the United
Kingdom, Germany and France. Outside the EU, Russian tourists increased by 41 percent when
compared to the same period in the previous year. This is good news for the HRI sector, since foreign
demand compensates for the decline in national demand, due to the economic downturn and uncertainty
and the high unemployment. National tourism demand has decreased by 25 percent in the first half of
the year.
Due to Spain’s high unemployment rate, it is expected that less people will be dining outside of their
homes, and those who go out, will look for cheaper establishments. Thus, fast food chains have
benefited from the financial crisis, taking up consumers looking for cheaper food prices but reluctant to
stop eating out.
Market Structure:
For more information on the Spanish HRI Sector, please consult the HRI sector reports for Spain at
http://www.fas.usda.gov/scriptsw/AttacheRep/default.asp
U.S. Exporter
U.S. Representative for
Europe
Importer; Broker; Agent;
Distributor; Wholesaler
HRI Sector
Cash-and-Carry;
Hypermarkets; Supermarkets

Food Processing Sector
Spain boasts a highly sophisticated food processing sector. Although the situation of the Spanish
economy is affecting demand and investment, the food processing industry has managed to offset this
by achieving excellent performance in exports. Food industry sources point out that throughout 2012,
household consumption of food and beverages will continue to show signs of weakness due to the loss
of purchasing power and falling disposable income. Also, the VAT increase beginning in September 1,
2012 will contribute to consolidate the ongoing decline of food expenditure.
Statistics on Spain’s food processing sector indicate that gross production in 2011 increased by 3
percent compared to 2010 to € 83.77 billion. As a reference, sector data for 2011 are as follows:
The Spanish food processing sector generated 16 percent of Spain’s total industrial sales,
accounting for about 7.6 percent of the national gross domestic product.
The sector is comprised primarily of small companies--about 96 percent of the 30,000 food
processors are small and medium-size companies, employing a total of 446,300 workers, which
accounts for 17 percent of all industrial employment.
Market Structure:
For more information on the Spanish food processing sector, please consult the food processing sector
report for Spain at http://www.fas.usda.gov/scriptsw/AttacheRep/default.asp
SECTION IV. BEST HIGH-VALUE PRODUCT PROSPECTS
U.S. Exporter
U.S.
Representative
for Europe
Importer; Broker;
Distributor; Agent;
Wholesaler
Food Processing
Sector

HS
Code Product
Category 2011
Market Size
(Volume)*
2011 Spanish
Imports ($
Million)*
5 Year
Average Import Growth
(%
Volume)
Key Constraints Attraction for U.S. Exporters
0303
Frozen Fish
178 TMT
$850 1.4% Heavy competition from other EU Member
States and domestic
suppliers. Spanish economic
situation.
Good reputation and
reliability of U.S.
producers. High per capita consumption
of fish.
0304 Fish Fillets and
Other Fish Meat
(Minced, Fresh,
Chilled or
Frozen)
849 TMT $839 2.6% Heavy competition from other EU Member
States and domestic
suppliers. Spanish economic
situation.
Good reputation and
reliability of U.S.
producers. High per capita consumption
of fish.
080212 Almonds
73TMT $283 4.7% Aflatoxin requirements. Spanish economic
situation.
Domestic consumption of
tree nuts is increasing due to
their utilization in the
confectionary industry.
080231 080232
Walnuts 34 TMT $144 3% Competition from other
EU countries, mainly
France.
US walnuts, both shelled
and in-shell, are making
inroads in Spain due to
increased awareness of the
health benefits of tree nuts.
080250
Pistachios
7 TMT $68 -8%
Competition from Iran
and EU importers, such
as Germany, who re-
export this product to
Spain.
Domestic consumption of
tree nuts continues to
increase. U.S. pistachios
have a higher quality image
than Iranian, the major
competitor. Despite the total negative
growth figure, imports from
the US have increased in the
last 5 years (average growth
for the US was 6 percent).
120100 Soybeans 3,175 TMT $1,762 9% Price sensitivity and
volatility. Competition from
Brazil.
Spain is a net importer of
grains and oilseeds for feed
consumption.
Source: Global Trade Atlas (GTA)

SECTION V. KEY CONTACTS AND ADDITIONAL INFORMATION
If you have any questions or comments regarding this report or need assistance in exporting to Spain,
please contact the Office of Agricultural Affairs in Madrid:
Local Address:
Foreign Agricultural Service
Office of Agricultural Affairs
U.S. Embassy Madrid
Serrano, 75 – Box 2000
28006 Madrid
Spain
U.S. Mailing Address:
Office of Agricultural Affairs
U.S. Embassy Madrid
Unit 8500, Box 2000
APO, AE 09642
Tel.: +34-91-587 2555
Fax: +34-91-587 2556
Website: http://madrid.usembassy.gov/about-us/fas.html
Email: [email protected]
Please consult our home page for more information on exporting U.S. food products to Spain. Importer
lists are also available from our office to exporters of U.S. food products. A list of trade associations
and useful government agencies is provided below:

Spanish Trade Associations
FIAB - Federación de Industrias de Alimentación y Bebidas
(Spanish Federation of Food and Beverage Industries)
Website: www.fiab.es
Email: [email protected]
FEHR – Federación Española de Hostelería
(Spanish Federation for HRI Sector)
Website: www.fehr.es
Email: [email protected]
ASEDAS – Asociación Española de Distribuidores, Autoservicios y Supermercados
(Spanish Association for Distributors and Supermarkets)
Website: www.asedas.org
Email: [email protected]
ANGED – Asociación Nacional de Grandes y Medianas Empresas de Distribución
(National Association of Midsize and Large Distributors)
Website: www.anged.es
Email: [email protected]
Spanish Government Agencies
Ministerio de Sanidad, Servicios Sociales e Igualdad
(Ministry of Health, Social Services and Equality)
(Responsible for: Imported Foodstuffs, Contaminants and Compound Residues, Health
Certification, Port Inspection and EU Alerts)
Website: http://www.msc.es/profesionales/saludPublica/sanidadExterior/home.htm
Email: [email protected]
Agencia Española de Seguridad Alimentaria y Nutrición (AESAN)
(Spanish Food Safety and Nutrition Agency)
Website: www.aesan.msssi.gob.es
Email: http://www.aesan.msssi.gob.es/SIAC-WEB/contacto.do?reqCode=newSearch
Ministerio de Agricultura, Alimentación y Medio Ambiente
(Ministry of Agriculture, Food, and Environment)
Website: www.magrama.gob.es
Email: [email protected]

APPENDIX I. STATISTICS
A. Spain’s Key Trade and Demographic Information Agricultural Imports From All Countries ($Mil) / U.S. Market Share (%) 2012
1 *
$29,000/3.1%
Consumer Oriented Agricultural Imports From All Countries($Mil)/U.S. Market Share
(%) 2012 1 *
$13,900/3.2%
Edible Fishery Imports From All Countries ($Mil) / U.S. Market Share (%)
1 -* $6,100/1.9%
Total Population (Millions) / Annual Growth Rate (%) - 2011 47.2/0.4% Number of Major Metropolitan Areas (over 800,000 population)
7 Per Capita Gross Domestic Product 2011 $34,300 Unemployment Rate (%) – October 2012 25.02% Per Capita Food Expenditures - 2011 $2,027 Labor force (million) - 2011 23.1 Exchange Rate (US$1 = 1 Euro) – Nov 2012 €0.78
(1) Source: Global Trade Atlas (GTA)
*Estimate

B. Spain’s Food Imports (US$ Millions)
Commodity
Total Imports
Worldwide Imports from
the U.S. U.S Market Share
(%) 2010 2011 2012* 2010 2011 2012* 2010 2011 2012*
CONSUMER-
ORIENTED 13,815 15,168 13,900 327 411 440 2.4 2.7 3.2 Snack Foods
(Excluding Nuts) 955 980 920 0.8 0.7 1.3
0.1 0.1 0.1 Breakfast Cereals and
Pancake Mix 209 221 200 0 0 0
0.0 0.0 0.0 Red Meats
Fresh/Chilled/Frozen 1,054 1,161 1,020 0.6 1.4 0.6
0.1 0.1 0.1 Red Meats
Prepared/Preserved 363 428 394 0.1 0 0
0.0 0.0 0.0 Poultry Meat 350 385 345 0 0 0 0.0 0.0 0.0 Dairy Products
(Excluding Cheese) 1,392 1,493 1,350 0.1 3.0 6.0
0.0 0.2 0.4 Cheese 1,103 1,205 1,050 0.2 0.6 0.7 0.0 0.0 0.1 Eggs & Products 75 88 100 0.2 1.3 1.6 0.3 1.5 1.6 Fresh Fruit 1,247 1,280 1,150 0.9 1.5 0.6 0.1 0.1 0.1 Fresh Vegetables 684 698 488 0.7 1.1 1.2 0.1 0.2 0.2 Processed Fruit and
Vegetables 1,215 1,398 1,340 8.6 6.9 5.5
0.7 0.5 0.4 Fruit and Vegetable
Juices 280 314 267 0.3 0.3 0.9
0.1 0.1 0.3 Tree Nuts 554 660 660 296 371 393 53.4 56.2 59.5 Wine and Beer 401 553 600 1.0 0.7 1.4 0.2 0.1 0.2 Nursery Products & Cut
Flowers 222 239 215 4.2 7.5 7.0
1.9 3.1 3.3 Pet Foods (Dog and Cat
Food) 236 247 230 1.1 1.4 1.6
0.5 0.6 0.7 Other Consumer-
Oriented Products 3,472 3,819 3,500 12 14 15 0.3 0.4 0.4 FISH & SEAFOOD
PRODUCTS 6,412 7,174 6,100 114 122 113 1.8 1.7 1.9 Salmon 280 269 200 12 6 0.1 4.3 2.2 0.1 Crustaceans 1,620 1,778 1,350 48 53 39 3.0 3.0 2.9 Groundfish and Flatfish 545 570 570 0.6 0.5 0.6 0.1 0.1 0.1 Molluscs 1,329 1,590 1,350 9 17 22 0.7 1.1 1.6 Other Fishery Products 2,639 2,965 2,670 44 45 46 1.7 1.5 1.7 AGRICULTURAL
PRODUCTS TOTAL 25,996 31,033 29,000 1,108 1,318 900 4.3 4.2 3.1 AGRICULTURAL
FISH & FORESTRY 34,218 39,917 36,300 1,318 1,525 1,000 3.9 3.8 2.8

TOTAL
Source: GTA
* Estimates
C. Spain’s Top 15 Food Import Suppliers
SPANISH IMPORTS OF
CONSUMER-ORIENTED AGRIC. PRODUCTS (US$ 1,000)
SPANISH IMPORTS OF FISH AND SEAFOOD
PRODUCTS (US$ 1,000)
2010 2011 2012* 2010 2011 2012*
France 3,236,872 3,621,247 3,310,000 Morocco 490,923 600,024 500,000
Germany 1,865,119 2,026,913 1,850,000 Argentina 500,331 483,653 390,000 Netherland
s 1,501,397 1,648,855 1,450,000 China 398,756 448,269 360,000
Italy 905,020 1,117,955 1,150,000 Ecuador 326,573 388,255 400,000
Portugal 1,069,843 889,401 860,000 France 328,432 372,087 370,000
Belgium 717,815 776,539 650,000 Portugal 324,760 367,973 320,000
Ireland 630,226 717,081 650,000 Netherland
s 339,060 362,073 290,000
UK 416,209 460,452 439,000 UK 304,551 315,216 255,000 United
States 327,168 411,158 410,000 Namibia 206,045 252,848 255,000
Denmark 345,225 370,396 310,000 Denmark 265,413 232,535 160,000
Peru 240,568 306,491 280,000 Chile 187,801 225,427 175,000
Brazil 217,063 254,165 270,000 Italy 210,648 197,910 130,000
Morocco 228,240 239,410 216,000 India 191,111 194,127 215,000
China 202,379 220,854 185,000 Sweden 151,332 191,556 150,000
Poland 195,090 206,349 220,000 Vietnam 162,100 171,454 135,000
Other 1,717,419 1,901,008 1,750,000 Other 2,024,30
5 2,370,30
9 1,995,00
0
World 13,815,65
3 15,168,27
4 14,000,00
0 World 6,412,14
1 7,173,71
6 6,100,00
0
Source: GTA
* Estimates
