spe 38573 microseismic and deformation imaging of
TRANSCRIPT
Copyright 1997, Society of Petroleum Engineers, Inc.
This paper was prepared for presentation at the 1997 SPE Annual Technical Conference andExhibition held in San Antonio, Texas, 5–8 October 1997.
This paper was selected for presentation by an SPE Program Committee following review ofinformation contained in an abstract submitted by the author(s). Contents of the paper, aspresented, have not been reviewed by the Society of Petroleum Engineers and are subject tocorrection by the author(s). The material, as presented, does not necessarily reflect anyposition of the Society of Petroleum Engineers, its officers, or members. Papers presented atSPE meetings are subject to publication review by Editorial Committees of the Society ofPetroleum Engineers. Electronic reproduction, distribution, or storage of any part of this paperfor commercial purposes without the written consent of the Society of Petroleum Engineers isprohibited. Permission to reproduce in print is restricted to an abstract of not more than 300words; illustrations may not be copied. The abstract must contain conspicuousacknowledgment of where and by whom the paper was presented. Write Librarian, SPE, P.O.Box 833836, Richardson, TX 75083-3836, U.S.A., fax 01-972-952-9435.
AbstractSix hydraulic-fracture injections into a fluvial sandstone at adepth of 4300 ft were monitored with multi-level tri-axialseismic receivers in two wells and an inclinometer array in onewell, resulting in maps of the growth and final geometry ofeach fracture injection. These diagnostic images show theprogression of height and length growth with fluid volume,rate and viscosity. Complexities associated with shut downsand high treatment pressures can be observed. Validation ofthe seismic geometry was made with the inclinometers anddiagnostic procedures in an intersecting well. Fractureinformation related to deformation, such as fracture closurepressure, residual widths, and final prop distribution, wereobtained from the inclinometer data.
IntroductionContrary to expectations based on simple models, hydraulicfracturing is proving to be a complex process that is still notadequately represented by theory. The reason for this is clear,as models assume that the earth is a homogeneous isotropiccontinuum when in fact the reservoirs which are fractured arehighly discontinuous and variably anisotropic andheterogeneous. Since current models are incapable of dealingwith this complexity in anything but an ad hoc manner,1
further understanding of hydraulic fracturing is not likely toprogress very rapidly without an ability to measure, image, orobserve fracturing processes under in situ reservoir conditions.
A glimpse at the complexity of fracturing in real reservoirsis now available from several cores through hydraulicfractures,2-4 from limited mineback experiments,5-9 and from
various diagnostics.4,10-16 From these relatively fewmeasurements, complex features such as multiple fracturestrands, secondary fractures, T-shaped fractures, redirection offracture orientation due to production, inefficient growthacross bedding, complex proppant transport, and otherunexpected features have been seen. From this limitedsampling, one would conclude that the fracturing process ispoorly represented by most models. However, it should also bestressed that the results found at the end of a treatment (e.g., asin a cored or mined-back fracture) may not be a goodrepresentation of the actual process during fracturing, since allcomplexities will be seen whether or not they had anysignificant effect on the mechanics of the process. Separatingout irrelevant features is difficult using only post-fracturesnapshots of the process.
For the reasons noted above, it is clear that the optimumdiagnostic would provide a real-time continuous image of thefracture growth process. Currently, there is no envisionedtechnology for directly viewing the fracture, but some fractureparameters can be indirectly monitored using downholeseismic receivers and downhole inclinometers. The applicationof these two technologies in the C-sand interval at the M-Sitefacility is the subject of this paper.
M-SiteThe M-Site field experiments,17 located at the previousMultiwell Experiment site in the Piceance basin of Colorado,are co-funded by the Gas Research Institute (GRI) and the USDepartment of Energy. Details of the M-Site layout andinstrumentation are given in previous papers4,13-15,17-20 and areonly briefly repeated here. The reservoirs undergoing testingare fluvial Mesaverde sand-shale sequences, so thetechnologies developed in this difficult environment aretranslatable to many other reservoirs. Results of previous testsare found in several papers and reports.
A plan view of the site is shown in Figure 1 and aschematic of the well, instrument, and sandstone layout aregiven in Figure 2. The site consists of one treatment well(MWX-2), one monitor well with cemented tri-axial seismicreceivers and bi-axial inclinometers and one cased observationwell for wireline run tools (MWX-3). Also shown in the figure
SPE 38573
Microseismic and Deformation Imaging of Hydraulic Fracture Growth and Geometry inthe C Sand Interval, GRI/DOE M-Site ProjectN.R. Warpinski, SPE, Sandia Natl. Labs, and P.T. Branagan, SPE, and R.E. Peterson, SPE, Branagan & Assoc., and J.E.Fix, SPE, James E. Fix & Assoc., and J.E. Uhl and B.P. Engler, Sandia Natl. Labs, and R. Wilmer, Branagan & Assoc.
Page 1 of 12 Halliburton Energy Services, Inc.Exhibit 1013
2 N.R. WARPINSKI, P.T. BRANAGAN, R.E. PETERSON, J.E. FIX, J.E. UHL, B.P. ENGLER, R. WILMER SPE 38573
is an intersection well (IW-1C) with a deviated lateral thatpenetrates through the created hydraulic fracture(s). The open-hole section of the lateral is shown as the dashed section.
The monitor well provides the instrumentation forvalidating the seismic results. Thirty tri-axial receiver stations,with low-noise (<1µg), wide-bandwidth (2-2200 Hz)accelerometers provide high quality microseismic data fromwhich the source can be accurately located. In the same wellsix bi-axial tiltmeters with nanoradian resolution provideinformation on the mechanical deformation of the formationwhich is used to validate the seismic results, as well as providevaluable information related to rock deformation. The 7-incased observation well is used for multi-level, wireline-run, tri-axial receiver arrays of the type that will be used in acommercial fracture diagnostic service. This array uses thesame accelerometers as are grouted in the monitor well, andthe multi-level feature also provides for highly accuratemicroseismic event location. The monitor well results, withmany more levels to apply in location algorithms, are used toverify the data obtained from the wireline receiver arrays.
Additional information obtained in the treatment well, suchas bottom-hole pressure, spectral gamma logs of radioactivetracer distributions, and seismic surveys, are used for detailedfracture modeling and additional diagnostic information.Detailed stress, rock property and reservoir property data arealso available for these reservoirs and are used for fracturemodels, finite element deformation models, and analyses of themechanical response of the formation to the fracture treatment.
Additionally, crosswell seismic surveys were conducted todetermine the p-wave and s-wave structure at the site. Seismicdata were obtained with 5-ft source and receiver spacings inthe treatment and monitor well, respectively, and thepermanent 30-ft spacing of the cemented receivers in themonitor well. The seismic source was an airgun whichprovided excellent p-waves and generally good s waves. Bothp and s tomograms have been produced.
Of critical importance for validating the seismic results wasthe lateral well21 which intersected the expected fracture planeat a point 287 ft from the treatment well (MWX-2) and at anelevation approximately 1/3 of the thickness of the sandstonefrom the bottom of the sandstone.
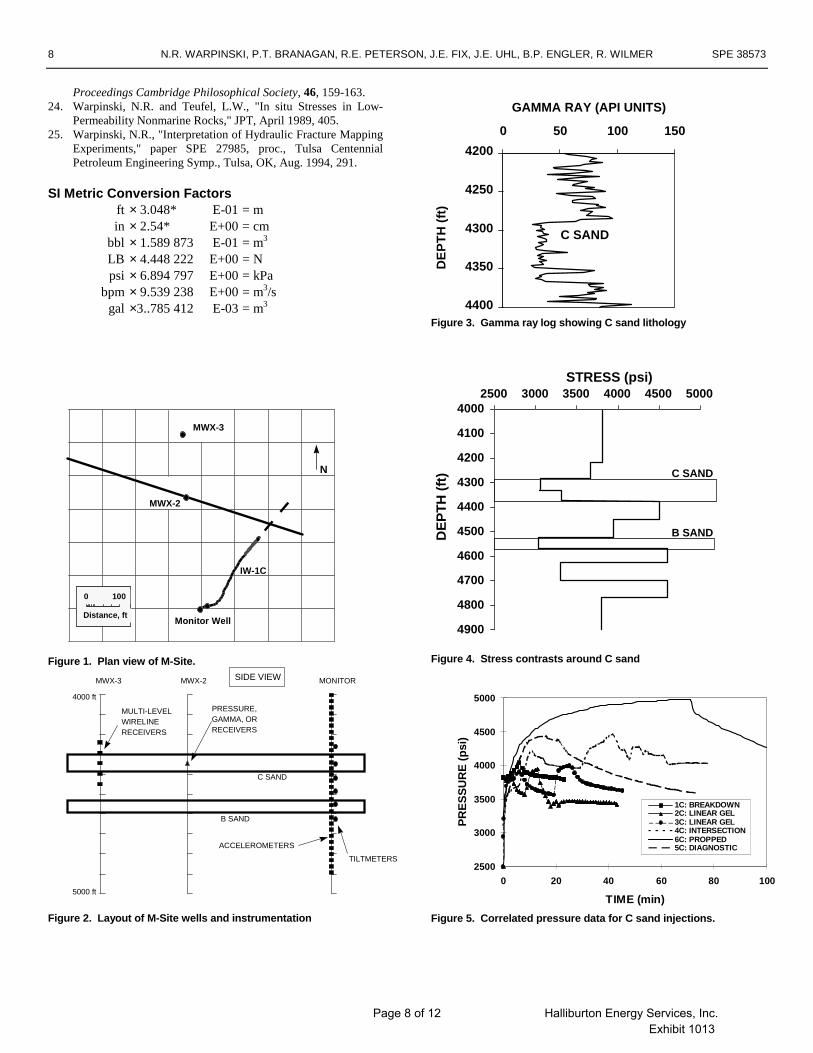
The lithology of the C sand consists of an estuarinesandstone found near the top of the Mesaverde formation.Figure 3 shows a gamma log of this sandstone taken from thetreatment well. The stress contrasts around the C sand, asdetermined primarily from microfracture stress measurements,are shown in Figure 4. Stresses in the B and C sands wereconfirmed using the inclinometers to the record the pressure atwhich opening begins. For modeling purposes, more detailedcalibrated stress logs were also developed.
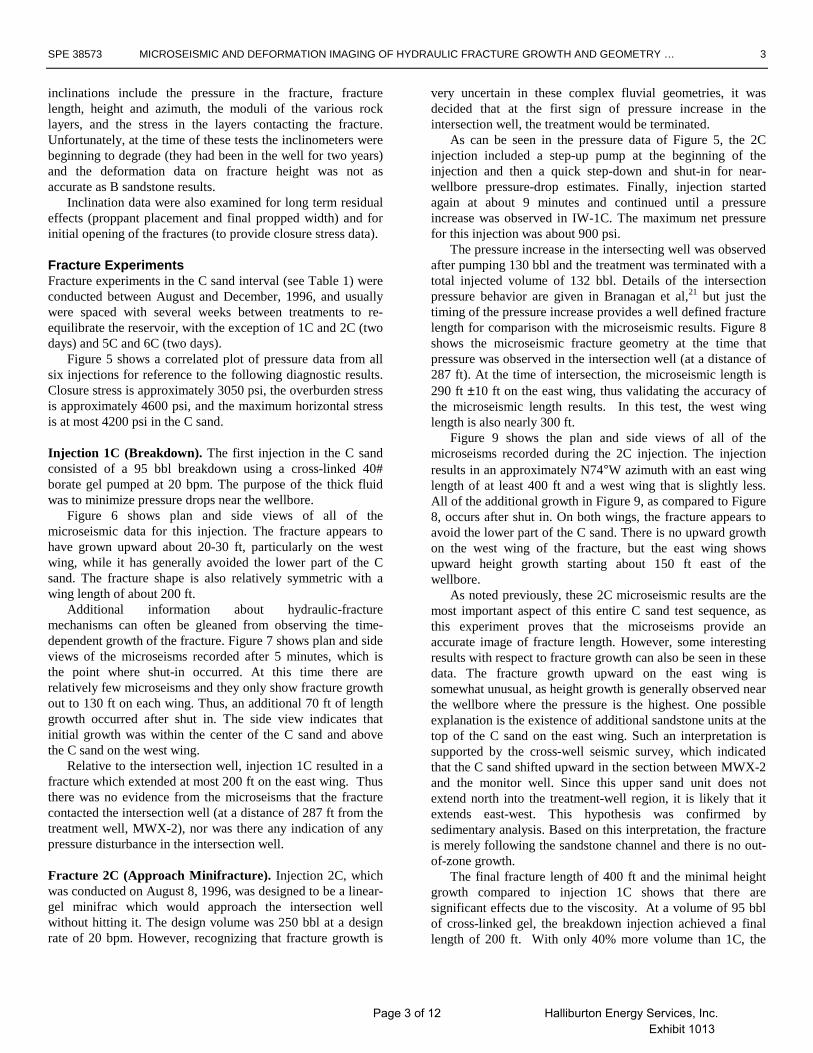
During C-sand testing, six different fracture injectionsusing two different fluids were monitored. Importantinformation on the injections is given in Table 1.
Table 1 Treatment DataFRACTURE VOLUME
(bbl)FLUID RATE
(bpm)SAND(kLB)
1C Breakdown 95 40# X-Link 202C Approach MF 132 40# Linear 203C Intersection MF-1 247 40# LInear 224C Intersection MF-2 982 40# X-Link 405C Diagnostic Test 480 40# X-Link 306C Stimulation 2118 40#X-Link 30 250
Data AnalysisInstrumentation consisted of tri-axial accelerometer arrays inboth the monitor well and MWX-3 observation well and a bi-axial inclinometer (tiltmeter) array in the monitor well. Dataanalysis consisted of location analysis of the microseismicevents, from which maps of fracture growth were generated,elastic modeling of the measured inclinations from whichfracture height estimates were derived, and correlation of theseresults with other information derived from fracture-injectionand intersection-well data.
Microseisms. The analysis of the microseismic data wasperformed in the usual manner for a large number of receiverstations.10,14,15,19 Only events that were detected on severalreceivers were analyzed and used. P-wave and s-wave arrivalswere selected and the particle motion of the initial p wave wasdetermined using a regression based on circular statistics. Thedirection to the source was found from the average particle-motion orientation, not including any obvious outliers.
The distance to and elevation of the microseismic sourcewere found from a joint regression of the distance equationsfor the two phases,
( ) ( )r z z V t ti p pi2 2 2
2
+ − = −and
( ) ( )r z z V t ti s si2 2 2 2
+ − = −where r is the horizontal distance from the monitor well to thesource, z is the elevation of the source, t is the time at whichthe microseism originated, Vp and Vs are p-wave and s-wavevelocities, zi is the elevation of the ith receiver, and tpi and tsi arethe p-wave and s-wave arrival times at the ith receiver. Usingthis approach, a best fit location of the microseism and well-defined uncertainties can be readily calculated.
Inclinometers. Inclinometer data were processed in the samemanner as described in Branagan et al.20 For short-termtreatment monitoring, inclinometers were zeroed at thebeginning of the fracture injection and changes in the tilt fieldnormal to the fracture (the most sensitive orientation) werecontinuously monitored. The resulting inclination field wasimmediately compared with several analytic models, including2-D,20 penny-shaped,20 and flat elliptic crack23 (3-D)geometries. A final analysis of the results generally includedfinite-element calculations to fully account for stress andmodulus variations.20 Important controlling parameters for the
Page 2 of 12 Halliburton Energy Services, Inc.Exhibit 1013
SPE 38573 MICROSEISMIC AND DEFORMATION IMAGING OF HYDRAULIC FRACTURE GROWTH AND GEOMETRY … 3
inclinations include the pressure in the fracture, fracturelength, height and azimuth, the moduli of the various rocklayers, and the stress in the layers contacting the fracture.Unfortunately, at the time of these tests the inclinometers werebeginning to degrade (they had been in the well for two years)and the deformation data on fracture height was not asaccurate as B sandstone results.
Inclination data were also examined for long term residualeffects (proppant placement and final propped width) and forinitial opening of the fractures (to provide closure stress data).
Fracture ExperimentsFracture experiments in the C sand interval (see Table 1) wereconducted between August and December, 1996, and usuallywere spaced with several weeks between treatments to re-equilibrate the reservoir, with the exception of 1C and 2C (twodays) and 5C and 6C (two days).
Figure 5 shows a correlated plot of pressure data from allsix injections for reference to the following diagnostic results.Closure stress is approximately 3050 psi, the overburden stressis approximately 4600 psi, and the maximum horizontal stressis at most 4200 psi in the C sand.
Injection 1C (Breakdown). The first injection in the C sandconsisted of a 95 bbl breakdown using a cross-linked 40#borate gel pumped at 20 bpm. The purpose of the thick fluidwas to minimize pressure drops near the wellbore.
Figure 6 shows plan and side views of all of themicroseismic data for this injection. The fracture appears tohave grown upward about 20-30 ft, particularly on the westwing, while it has generally avoided the lower part of the Csand. The fracture shape is also relatively symmetric with awing length of about 200 ft.
Additional information about hydraulic-fracturemechanisms can often be gleaned from observing the time-dependent growth of the fracture. Figure 7 shows plan and sideviews of the microseisms recorded after 5 minutes, which isthe point where shut-in occurred. At this time there arerelatively few microseisms and they only show fracture growthout to 130 ft on each wing. Thus, an additional 70 ft of lengthgrowth occurred after shut in. The side view indicates thatinitial growth was within the center of the C sand and abovethe C sand on the west wing.
Relative to the intersection well, injection 1C resulted in afracture which extended at most 200 ft on the east wing. Thusthere was no evidence from the microseisms that the fracturecontacted the intersection well (at a distance of 287 ft from thetreatment well, MWX-2), nor was there any indication of anypressure disturbance in the intersection well.
Fracture 2C (Approach Minifracture). Injection 2C, whichwas conducted on August 8, 1996, was designed to be a linear-gel minifrac which would approach the intersection wellwithout hitting it. The design volume was 250 bbl at a designrate of 20 bpm. However, recognizing that fracture growth is
very uncertain in these complex fluvial geometries, it wasdecided that at the first sign of pressure increase in theintersection well, the treatment would be terminated.
As can be seen in the pressure data of Figure 5, the 2Cinjection included a step-up pump at the beginning of theinjection and then a quick step-down and shut-in for near-wellbore pressure-drop estimates. Finally, injection startedagain at about 9 minutes and continued until a pressureincrease was observed in IW-1C. The maximum net pressurefor this injection was about 900 psi.
The pressure increase in the intersecting well was observedafter pumping 130 bbl and the treatment was terminated with atotal injected volume of 132 bbl. Details of the intersectionpressure behavior are given in Branagan et al,21 but just thetiming of the pressure increase provides a well defined fracturelength for comparison with the microseismic results. Figure 8shows the microseismic fracture geometry at the time thatpressure was observed in the intersection well (at a distance of287 ft). At the time of intersection, the microseismic length is290 ft ±10 ft on the east wing, thus validating the accuracy ofthe microseismic length results. In this test, the west winglength is also nearly 300 ft.
Figure 9 shows the plan and side views of all of themicroseisms recorded during the 2C injection. The injectionresults in an approximately N74°W azimuth with an east winglength of at least 400 ft and a west wing that is slightly less.All of the additional growth in Figure 9, as compared to Figure8, occurs after shut in. On both wings, the fracture appears toavoid the lower part of the C sand. There is no upward growthon the west wing of the fracture, but the east wing showsupward height growth starting about 150 ft east of thewellbore.
As noted previously, these 2C microseismic results are themost important aspect of this entire C sand test sequence, asthis experiment proves that the microseisms provide anaccurate image of fracture length. However, some interestingresults with respect to fracture growth can also be seen in thesedata. The fracture growth upward on the east wing issomewhat unusual, as height growth is generally observed nearthe wellbore where the pressure is the highest. One possibleexplanation is the existence of additional sandstone units at thetop of the C sand on the east wing. Such an interpretation issupported by the cross-well seismic survey, which indicatedthat the C sand shifted upward in the section between MWX-2and the monitor well. Since this upper sand unit does notextend north into the treatment-well region, it is likely that itextends east-west. This hypothesis was confirmed bysedimentary analysis. Based on this interpretation, the fractureis merely following the sandstone channel and there is no out-of-zone growth.
The final fracture length of 400 ft and the minimal heightgrowth compared to injection 1C shows that there aresignificant effects due to the viscosity. At a volume of 95 bblof cross-linked gel, the breakdown injection achieved a finallength of 200 ft. With only 40% more volume than 1C, the
Page 3 of 12 Halliburton Energy Services, Inc.Exhibit 1013
4 N.R. WARPINSKI, P.T. BRANAGAN, R.E. PETERSON, J.E. FIX, J.E. UHL, B.P. ENGLER, R. WILMER SPE 38573
linear-gel 2C injection achieved double the length, even whileexperiencing greater leakoff due to the lower viscosity and thelong shut-in period. However, this difference in lengthextension was achieved even though net pressures differed byonly 50-100 psi.
Injection 3C (Full Intersection Minifracture). Injection3C, which was conducted on August 21, 1996, was a repeat ofinjection 2C, except that a full 247 bbl were injected. Thepressure response in and post-fracture logging of theintersection well (see Branagan et al.21) indicated that theinterconnection after the 2C treatment was minimal. It washoped that this poor connection could be remedied with alarger linear-gel treatment that would more adequatelyintersect the IW-1C well.
The complicated pressure response during injection 3C, asshown in Figure 5, is due to step-up, step-down, and shut-inperiods. Most of the volume was injected in the latter part ofthe test at a rate of 22 bpm and a net pressure of about 950 psi.
Microseismic results of injection 3C are shown in plan andside view in Figure 10. This fracture has an injected volume ofonly 250 bbl and a fairly high leakoff because it is a linear gel,yet the fracture lengths are almost 500 ft on the east wing andmore than 400 ft on the west wing. The azimuth through allthree initial injections have been N74°W or N75°W. Thisfracture shows some slight evidence of height growth near thewellbore. The upward growth on the far east wing, which wasfirst seen in the 2C injection, is also obvious in this test.
The intersection with IW-1C (pressure increase in theintersection well) occurred relatively early in the treatment,but, as in injection 2C, it was not a very conductiveconnection. The microseisms suggest that the hydraulicfracture may have been mostly above the intersection well,since little microseismic activity occurred in the lower C sandon the east wing. This test also showed the rising fracturebehavior on the east wing, but it is obscured somewhat by theincreased height growth near the wellbore.
The inclinometers provided important long-terminformation about residual deformation after unproppedfracture treatments. Figure 11 shows the inclinations recordedon the shallowest inclinometer during and after the 1C-3Cinjections. These data have been normalized to the largestvalue (3C maximum value) and show that the deformationnever returns to zero, but instead maintains a nearly 20%residual expansion. This expansion is interpreted as beingprimarily a result of residual opening, as poro-elastic effectswould have disappeared after reservoir pressure equilibrationwas complete (typically a few days). It can also be seen thatthe magnitudes of the tidal inclinations are much smaller thanthe inclination magnitudes induced by the fracture treatmentsand, thus, do not cause any interpretation problems in thisdownhole environment.
Injection 4C (High Energy Intersection). Injection 4C,conducted on November 22, 1996, was a dual objective test.
Approximately 1000 bbl of 40-LB/mgal cross-linked gel wereinjected into the C sand at about 40 bpm in order to providethe opportunity for obtaining treatment well diagnostics and togive a final attempt at obtaining a clear intersection of IW-1C.To test the treatment well diagnostics, a four-level seismicarray was placed in the treatment well, straddled over the Csand. Unfortunately, during initial injection of water in thecasing, the turbulence of the thin fluid induced sufficientvibration to loosen a locking nut on the fiber-optic cable head,causing a break in the copper and fiber-optic lines (but thecable armor remained connected and there was not a completedisconnect of the tool string). Thus, no treatment welldiagnostics were obtained during this test and the remainingdiagnostics were based on data from the monitor-wellreceivers.
The injection consisted of the pre-injection of 132 bbl ofKCl water, which was in the casing originally, followed by theinjection of the cross-linked gel in two stages, separated by a15 minute shut-in period for leakoff and near-wellboreanalyses. As seen in Figure 5, the injection of the gel occursfor about 15 minutes, followed by a 15 minute shut down.
The microseisms recorded after the first gel injection andshut-in period are shown in Figure 12. These data indicate thatconsiderable height growth occurred on the west wing duringthis period, as well as length extension on the order of 300 ft.The additional height growth is not surprising, since the netpressure was greater than 1100 psi during the injection period.There is also an interesting secondary feature running to thenorth-northeast. Although it was speculated that this featurecould be a secondary fracture or activated fault, it was notconsidered important until after the 6C injection showed thesame feature and additional complexity as a result of it.
Gel injection resumed at about 30 minutes, but at first thegel would not move and surface pressures reached theirmaximum allowable at rates of only 1-2 bpm. Finally the fluidstarted to move and rates were eventually built to their designvalues. However, at the point where the gel began moving andfracturing clearly restarted, there was a large burst ofmicroseismic activity and a clear pressure connection wasobserved in the intersecting well. Net pressures variedconsiderably during the treatment, but an average net pressureafter fracturing resumed following the shut-in period is roughly1200 psi.
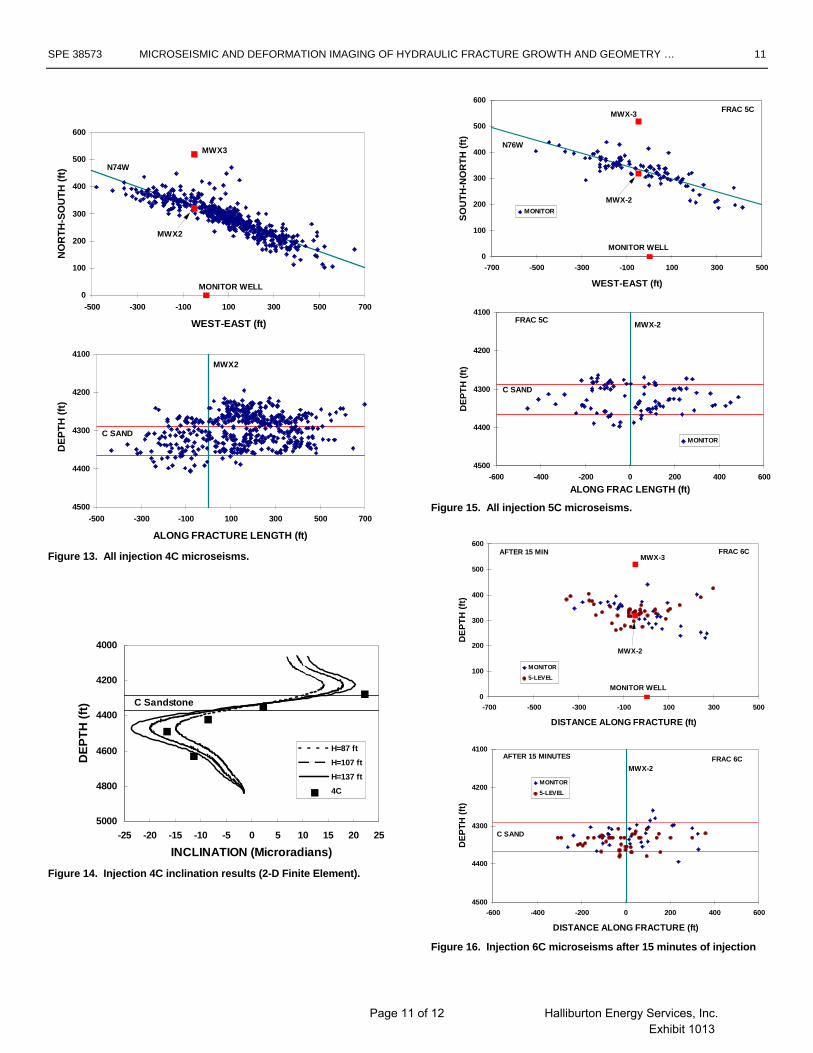
All of the microseisms from the 4C injection are shown inplan view and side in Figure 13. Fracture 4C is clearly anasymmetric fracture with considerable height growth. The eastwing length is 600-700 ft while the west wing is only about400 ft. This asymmetry occurred after the shut-in period andsuggests that fracture extension was affected by the shut-inprocess, essentially redirecting growth in the easterly directionwith little extension along the west wing. Fracture growthupward is 60-80 ft, depending on the location, while growthdownward is about 50 ft, but primarily on the west wing.
Since injection 4C exhibited significant height growth, it isa good test case for evaluation by the inclinometer array.
Page 4 of 12 Halliburton Energy Services, Inc.Exhibit 1013
SPE 38573 MICROSEISMIC AND DEFORMATION IMAGING OF HYDRAULIC FRACTURE GROWTH AND GEOMETRY … 5
Figure 14 shows the maximum 4C inclination data at each ofthe six stations during the injection, as compared to 2-D finiteelement modeling based on a 1200 psi treatment pressure. Themesh and layering used are the same as were employed for theB sandstone tests.20 Only a 2-D case was used because thefracture length on the east wing is 700 ft and previous analyseshad shown that after 600 ft of length, there was no significantdifference between the 2-D and 3-D models.
Although the data cannot be exactly matched, it is clearthat the fracture height on this wing is on the order of 130-140 ft, very comparable to the microseismic results. For thiscalculation, all of the height growth was upward. The C sandresults again show that the microseismic heights are nearly thesame as the mechanical heights, an important validation point.
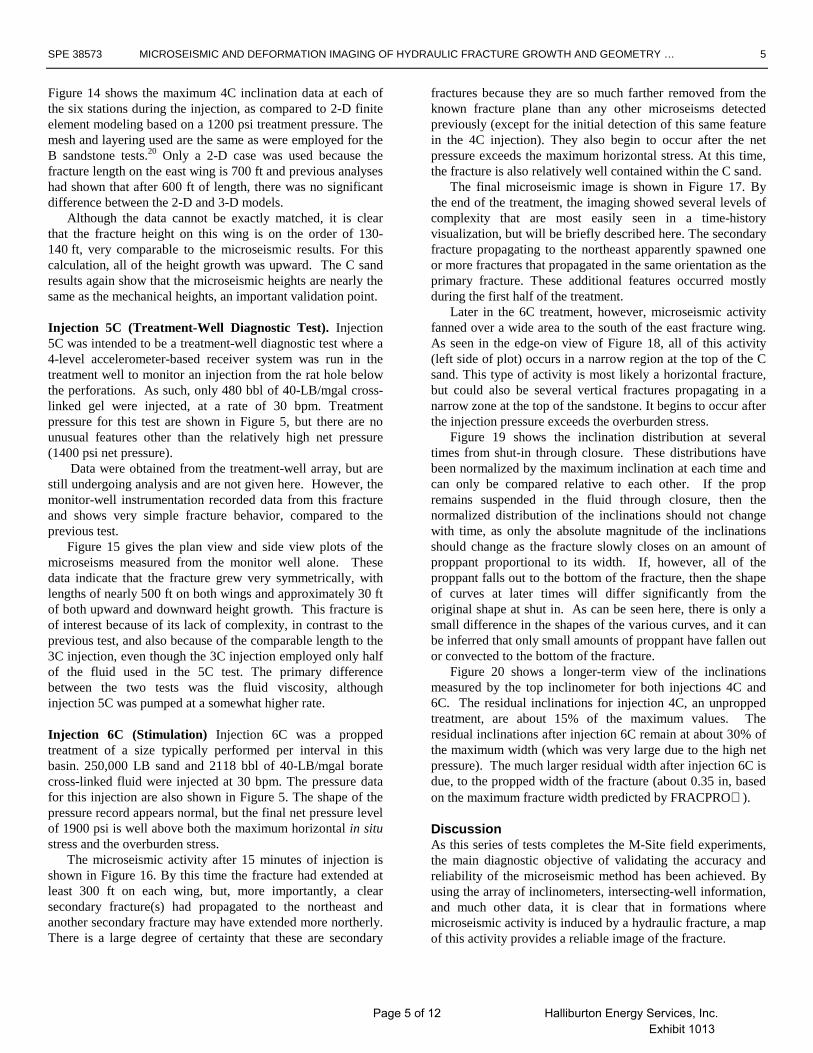
Injection 5C (Treatment-Well Diagnostic Test). Injection5C was intended to be a treatment-well diagnostic test where a4-level accelerometer-based receiver system was run in thetreatment well to monitor an injection from the rat hole belowthe perforations. As such, only 480 bbl of 40-LB/mgal cross-linked gel were injected, at a rate of 30 bpm. Treatmentpressure for this test are shown in Figure 5, but there are nounusual features other than the relatively high net pressure(1400 psi net pressure).
Data were obtained from the treatment-well array, but arestill undergoing analysis and are not given here. However, themonitor-well instrumentation recorded data from this fractureand shows very simple fracture behavior, compared to theprevious test.
Figure 15 gives the plan view and side view plots of themicroseisms measured from the monitor well alone. Thesedata indicate that the fracture grew very symmetrically, withlengths of nearly 500 ft on both wings and approximately 30 ftof both upward and downward height growth. This fracture isof interest because of its lack of complexity, in contrast to theprevious test, and also because of the comparable length to the3C injection, even though the 3C injection employed only halfof the fluid used in the 5C test. The primary differencebetween the two tests was the fluid viscosity, althoughinjection 5C was pumped at a somewhat higher rate.
Injection 6C (Stimulation) Injection 6C was a proppedtreatment of a size typically performed per interval in thisbasin. 250,000 LB sand and 2118 bbl of 40-LB/mgal boratecross-linked fluid were injected at 30 bpm. The pressure datafor this injection are also shown in Figure 5. The shape of thepressure record appears normal, but the final net pressure levelof 1900 psi is well above both the maximum horizontal in situstress and the overburden stress.
The microseismic activity after 15 minutes of injection isshown in Figure 16. By this time the fracture had extended atleast 300 ft on each wing, but, more importantly, a clearsecondary fracture(s) had propagated to the northeast andanother secondary fracture may have extended more northerly.There is a large degree of certainty that these are secondary
fractures because they are so much farther removed from theknown fracture plane than any other microseisms detectedpreviously (except for the initial detection of this same featurein the 4C injection). They also begin to occur after the netpressure exceeds the maximum horizontal stress. At this time,the fracture is also relatively well contained within the C sand.
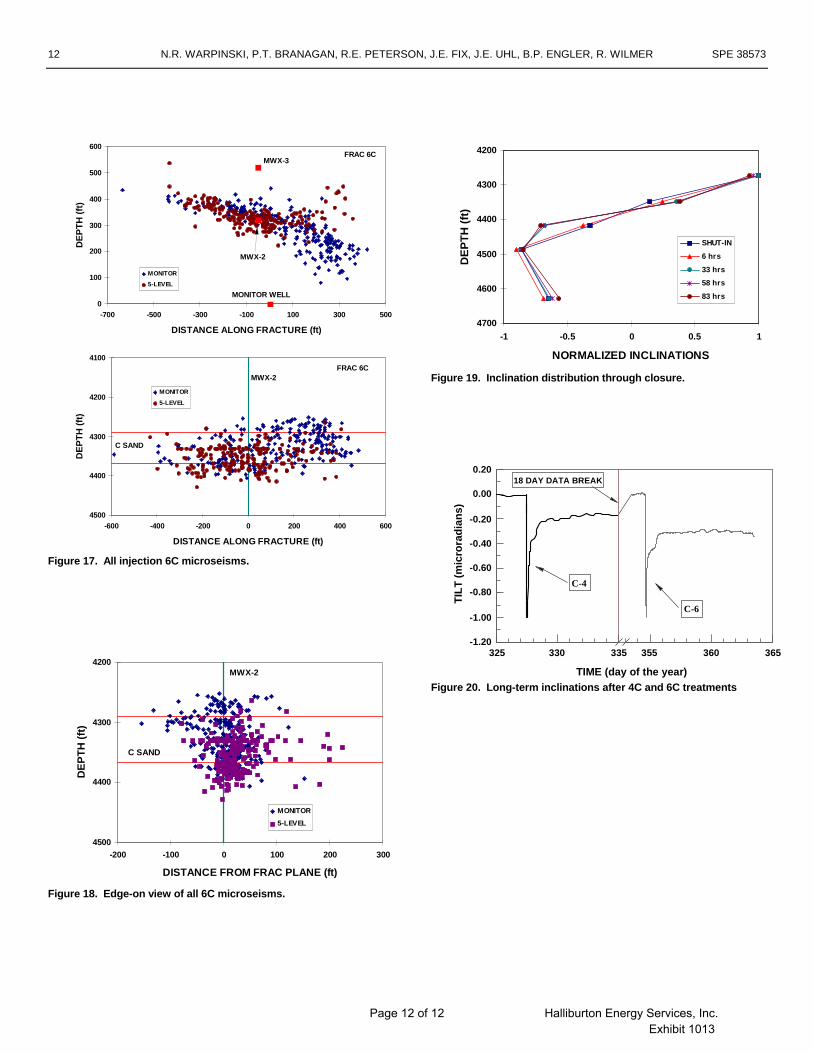
The final microseismic image is shown in Figure 17. Bythe end of the treatment, the imaging showed several levels ofcomplexity that are most easily seen in a time-historyvisualization, but will be briefly described here. The secondaryfracture propagating to the northeast apparently spawned oneor more fractures that propagated in the same orientation as theprimary fracture. These additional features occurred mostlyduring the first half of the treatment.
Later in the 6C treatment, however, microseismic activityfanned over a wide area to the south of the east fracture wing.As seen in the edge-on view of Figure 18, all of this activity(left side of plot) occurs in a narrow region at the top of the Csand. This type of activity is most likely a horizontal fracture,but could also be several vertical fractures propagating in anarrow zone at the top of the sandstone. It begins to occur afterthe injection pressure exceeds the overburden stress.
Figure 19 shows the inclination distribution at severaltimes from shut-in through closure. These distributions havebeen normalized by the maximum inclination at each time andcan only be compared relative to each other. If the propremains suspended in the fluid through closure, then thenormalized distribution of the inclinations should not changewith time, as only the absolute magnitude of the inclinationsshould change as the fracture slowly closes on an amount ofproppant proportional to its width. If, however, all of theproppant falls out to the bottom of the fracture, then the shapeof curves at later times will differ significantly from theoriginal shape at shut in. As can be seen here, there is only asmall difference in the shapes of the various curves, and it canbe inferred that only small amounts of proppant have fallen outor convected to the bottom of the fracture.
Figure 20 shows a longer-term view of the inclinationsmeasured by the top inclinometer for both injections 4C and6C. The residual inclinations for injection 4C, an unproppedtreatment, are about 15% of the maximum values. Theresidual inclinations after injection 6C remain at about 30% ofthe maximum width (which was very large due to the high netpressure). The much larger residual width after injection 6C isdue, to the propped width of the fracture (about 0.35 in, basedon the maximum fracture width predicted by FRACPRO).
DiscussionAs this series of tests completes the M-Site field experiments,the main diagnostic objective of validating the accuracy andreliability of the microseismic method has been achieved. Byusing the array of inclinometers, intersecting-well information,and much other data, it is clear that in formations wheremicroseismic activity is induced by a hydraulic fracture, a mapof this activity provides a reliable image of the fracture.
Page 5 of 12 Halliburton Energy Services, Inc.Exhibit 1013

6 N.R. WARPINSKI, P.T. BRANAGAN, R.E. PETERSON, J.E. FIX, J.E. UHL, B.P. ENGLER, R. WILMER SPE 38573
The C sand experiments had as their primary diagnosticobjective the determination of the accuracy of themicroseismic length through a correlation of the imaged datawith the intersection of a lateral wellbore. This intersectionwas achieved on the 2C injection and showed that the imagedlength was correct within the accuracy limits of the technique.
Previous M-Site results15 had shown that microseismicheights and azimuths were also correct within their accuracylimits. In addition, the fracture azimuth was found to closelyagree with the previously determined stress orientation.24
While the primary purpose of the inclinometer array(downhole tiltmeter array) was to provide validation of themicroseismic results by measuring the mechanical response ofthe rock to the hydraulic fracture, it was also found that theinclinometers can be a very useful tool for fracture diagnostics.In addition to the accurate height measurements, theinclinometer array has been found to be valuable fordetermining the residual width of the fractures and the finalpropped width distribution relative to the original fracturewidth distribution. In addition, the inclinometer is a veryprecise instrument for measuring fracture opening, and thusclosure stress.
These tests, along with previous results,15 have shown thatthe fracture height determined by models is not particularlyaccurate. There are clearly many additional mechanismsaffecting height growth that have not been incorporatedadequately into models. Diagnostic results such as these can beused to aid in improving the model capabilities.
The series of tests using both linear and cross-linked gelsalso shows that there is a significant viscosity effect.Comparing treatments 1C and 2C, it is found that the linear-gelfracture resulted in 100% more length growth for only 40%more fluid, even though there was higher leakoff of the lineargel. Comparing treatments 3C and 5C, it was found thatcomparable lengths were obtained for both treatments eventhough the cross-linked gel had twice the fluid volume. Whiletip effects may still be important in fracturing, it is clear thatviscosity has an important role in fracture extension. Inparticular, thin-fluid fractures achieve fast length extensionwith little height growth, a feature that could be used withgreat advantage to optimize fracturing procedures. On theother hand, it is not clear why such different behavior was notalways reflected in the net pressure. Again, it appears thatthere are some elements of fracturing that are not entirelyunderstood. Diagnostic results such as these can providevaluable data to improve model results.
The experiments have also demonstrated that themicroseismic method is accurate for measuring large-scalecomplexity in fracture treatments. While small-scalecomplexities such as multiple parallel strands cannot bedetected,25 the large scale complexities such as secondaryfractures and horizontal fractures are readily apparent (e.g.,injection 6C). It is also noteworthy that the secondary verticalfractures occurred after the injection pressure exceeded themaximum horizontal stress and the horizontal features
occurred after the pressure exceeded the overburden stress.The measurement of residual fracture deformation by the
inclinometers offers important insight into the successfulimplementation of water fractures (no prop). The largeresidual deformations, interpreted as fracture width, shows thatsignificant widths can remain even without proppant. Theinterpretation of the residual deformation as width is due to thecareful monitoring of reservoir pressure to ascertain that theeffect is not due to poro-elastic behavior. Although the effectcould be due to anelastic behavior, we hope that this is not thecase as it would invalidate all fracture models, reservoirmechanics models, tiltmeter analyses, stress logs, and manyother calculations which require elastic behavior of thereservoir.
The inclinometers have also been used for determiningchanges in the proppant distribution, an important element forevaluating convection and prop transport. In the twoexperiments at M-Site, little indication of dropout orconvection has been observed.
With regard to fracture models, these diagnostic techniquescannot provide details on fracture mechanisms (e.g., multiplefractures, tip effects, fissure opening, etc.), but the overallimage of the fracture does allow for accurate testing of modelaccuracy in given reservoirs. It is expected that such resultswill require modelers to re-examine the implementation ofmany mechanisms related to height growth, net pressure, andprop transport. Models are important elements in anyfracturing design/analysis program and any improvements inmodels based on imaging will pay valuable dividends in bothhydrocarbon recovery and economics.
Finally, the value of imaging technology should be readilyapparent to all companies involved in fracturing reservoirs. Itcan provide immediate benefits in designing the well layout fornew fields and infill operations, for the optimization of multi-zone completions, and for the evaluation of problemreservoirs.
ConclusionsHydraulic-fracture imaging using the microseismic method hasbeen shown to be an accurate technique for monitoringfracture growth and determining the final size and shape of thefracture. Fracture length, height, and azimuth have beenvalidated using other technology at M-Site.15
An inclinometer array (downhole tiltmeter array) has beenfound to provide important information on fracture parametersnot readily measured using microseisms or other availablediagnostic information. New features measured includeresidual widths, final prop placement, and closure stress.
Results at M-Site show that fracture height is much morecomplicated than currently implemented in models and thatviscosity has a significant effect on fracture growth. Inaddition, these field results provide proof of complex fracturegrowth when pressures exceed the maximum horizontal or theoverburden stress values. As imaging results become morewidely available and are incorporated into model
Page 6 of 12 Halliburton Energy Services, Inc.Exhibit 1013
SPE 38573 MICROSEISMIC AND DEFORMATION IMAGING OF HYDRAULIC FRACTURE GROWTH AND GEOMETRY … 7
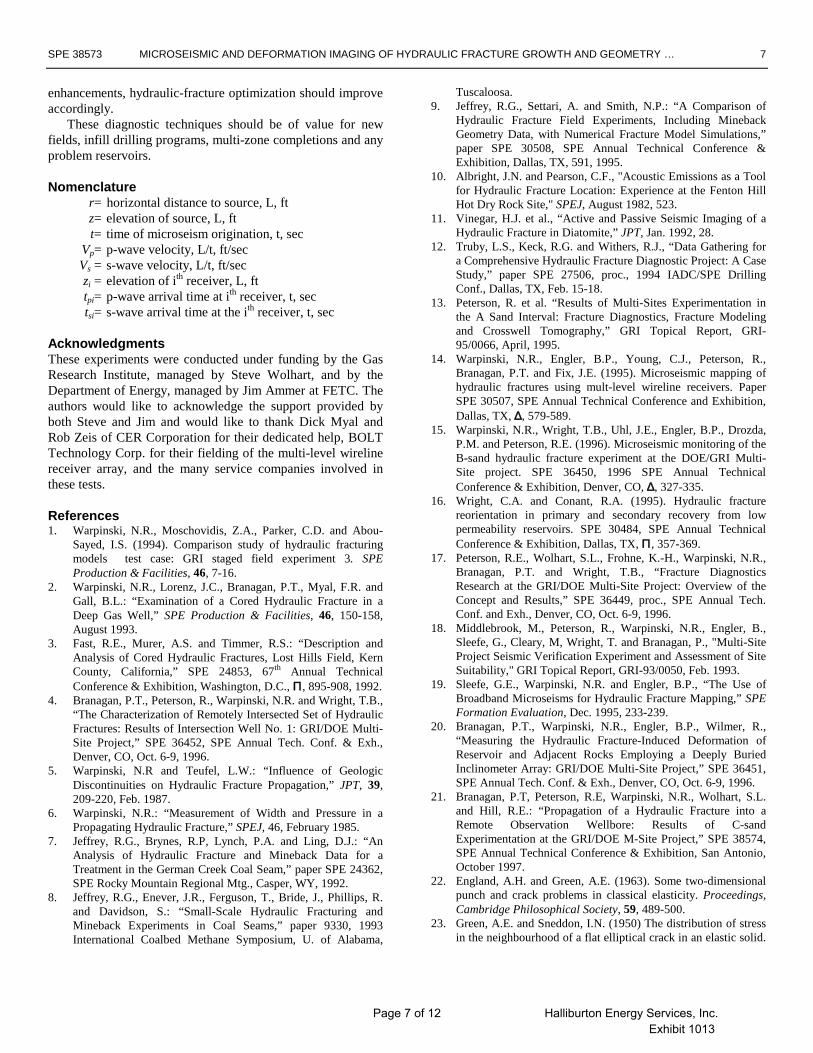
enhancements, hydraulic-fracture optimization should improveaccordingly.
These diagnostic techniques should be of value for newfields, infill drilling programs, multi-zone completions and anyproblem reservoirs.
Nomenclaturer= horizontal distance to source, L, ftz= elevation of source, L, ftt= time of microseism origination, t, sec
Vp= p-wave velocity, L/t, ft/secVs = s-wave velocity, L/t, ft/seczi = elevation of ith receiver, L, fttpi= p-wave arrival time at ith receiver, t, sectsi= s-wave arrival time at the ith receiver, t, sec
AcknowledgmentsThese experiments were conducted under funding by the GasResearch Institute, managed by Steve Wolhart, and by theDepartment of Energy, managed by Jim Ammer at FETC. Theauthors would like to acknowledge the support provided byboth Steve and Jim and would like to thank Dick Myal andRob Zeis of CER Corporation for their dedicated help, BOLTTechnology Corp. for their fielding of the multi-level wirelinereceiver array, and the many service companies involved inthese tests.
References1. Warpinski, N.R., Moschovidis, Z.A., Parker, C.D. and Abou-
Sayed, I.S. (1994). Comparison study of hydraulic fracturingmodels test case: GRI staged field experiment 3. SPEProduction & Facilities, 46, 7-16.
2. Warpinski, N.R., Lorenz, J.C., Branagan, P.T., Myal, F.R. andGall, B.L.: “Examination of a Cored Hydraulic Fracture in aDeep Gas Well,” SPE Production & Facilities, 46, 150-158,August 1993.
3. Fast, R.E., Murer, A.S. and Timmer, R.S.: “Description andAnalysis of Cored Hydraulic Fractures, Lost Hills Field, KernCounty, California,” SPE 24853, 67th Annual TechnicalConference & Exhibition, Washington, D.C., Π, 895-908, 1992.
4. Branagan, P.T., Peterson, R., Warpinski, N.R. and Wright, T.B.,“The Characterization of Remotely Intersected Set of HydraulicFractures: Results of Intersection Well No. 1: GRI/DOE Multi-Site Project,” SPE 36452, SPE Annual Tech. Conf. & Exh.,Denver, CO, Oct. 6-9, 1996.
5. Warpinski, N.R and Teufel, L.W.: “Influence of GeologicDiscontinuities on Hydraulic Fracture Propagation,” JPT, 39,209-220, Feb. 1987.
6. Warpinski, N.R.: “Measurement of Width and Pressure in aPropagating Hydraulic Fracture,” SPEJ, 46, February 1985.
7. Jeffrey, R.G., Brynes, R.P, Lynch, P.A. and Ling, D.J.: “AnAnalysis of Hydraulic Fracture and Mineback Data for aTreatment in the German Creek Coal Seam,” paper SPE 24362,SPE Rocky Mountain Regional Mtg., Casper, WY, 1992.
8. Jeffrey, R.G., Enever, J.R., Ferguson, T., Bride, J., Phillips, R.and Davidson, S.: “Small-Scale Hydraulic Fracturing andMineback Experiments in Coal Seams,” paper 9330, 1993International Coalbed Methane Symposium, U. of Alabama,
Tuscaloosa.9. Jeffrey, R.G., Settari, A. and Smith, N.P.: “A Comparison of
Hydraulic Fracture Field Experiments, Including MinebackGeometry Data, with Numerical Fracture Model Simulations,”paper SPE 30508, SPE Annual Technical Conference &Exhibition, Dallas, TX, 591, 1995.
10. Albright, J.N. and Pearson, C.F., "Acoustic Emissions as a Toolfor Hydraulic Fracture Location: Experience at the Fenton HillHot Dry Rock Site," SPEJ, August 1982, 523.
11. Vinegar, H.J. et al., “Active and Passive Seismic Imaging of aHydraulic Fracture in Diatomite,” JPT, Jan. 1992, 28.
12. Truby, L.S., Keck, R.G. and Withers, R.J., “Data Gathering fora Comprehensive Hydraulic Fracture Diagnostic Project: A CaseStudy,” paper SPE 27506, proc., 1994 IADC/SPE DrillingConf., Dallas, TX, Feb. 15-18.
13. Peterson, R. et al. “Results of Multi-Sites Experimentation inthe A Sand Interval: Fracture Diagnostics, Fracture Modelingand Crosswell Tomography,” GRI Topical Report, GRI-95/0066, April, 1995.
14. Warpinski, N.R., Engler, B.P., Young, C.J., Peterson, R.,Branagan, P.T. and Fix, J.E. (1995). Microseismic mapping ofhydraulic fractures using mult-level wireline receivers. PaperSPE 30507, SPE Annual Technical Conference and Exhibition,Dallas, TX, ∆, 579-589.
15. Warpinski, N.R., Wright, T.B., Uhl, J.E., Engler, B.P., Drozda,P.M. and Peterson, R.E. (1996). Microseismic monitoring of theB-sand hydraulic fracture experiment at the DOE/GRI Multi-Site project. SPE 36450, 1996 SPE Annual TechnicalConference & Exhibition, Denver, CO, ∆, 327-335.
16. Wright, C.A. and Conant, R.A. (1995). Hydraulic fracturereorientation in primary and secondary recovery from lowpermeability reservoirs. SPE 30484, SPE Annual TechnicalConference & Exhibition, Dallas, TX, Π, 357-369.
17. Peterson, R.E., Wolhart, S.L., Frohne, K.-H., Warpinski, N.R.,Branagan, P.T. and Wright, T.B., “Fracture DiagnosticsResearch at the GRI/DOE Multi-Site Project: Overview of theConcept and Results,” SPE 36449, proc., SPE Annual Tech.Conf. and Exh., Denver, CO, Oct. 6-9, 1996.
18. Middlebrook, M., Peterson, R., Warpinski, N.R., Engler, B.,Sleefe, G., Cleary, M, Wright, T. and Branagan, P., "Multi-SiteProject Seismic Verification Experiment and Assessment of SiteSuitability," GRI Topical Report, GRI-93/0050, Feb. 1993.
19. Sleefe, G.E., Warpinski, N.R. and Engler, B.P., “The Use ofBroadband Microseisms for Hydraulic Fracture Mapping,” SPEFormation Evaluation, Dec. 1995, 233-239.
20. Branagan, P.T., Warpinski, N.R., Engler, B.P., Wilmer, R.,“Measuring the Hydraulic Fracture-Induced Deformation ofReservoir and Adjacent Rocks Employing a Deeply BuriedInclinometer Array: GRI/DOE Multi-Site Project,” SPE 36451,SPE Annual Tech. Conf. & Exh., Denver, CO, Oct. 6-9, 1996.
21. Branagan, P.T, Peterson, R.E, Warpinski, N.R., Wolhart, S.L.and Hill, R.E.: “Propagation of a Hydraulic Fracture into aRemote Observation Wellbore: Results of C-sandExperimentation at the GRI/DOE M-Site Project,” SPE 38574,SPE Annual Technical Conference & Exhibition, San Antonio,October 1997.
22. England, A.H. and Green, A.E. (1963). Some two-dimensionalpunch and crack problems in classical elasticity. Proceedings,Cambridge Philosophical Society, 59, 489-500.
23. Green, A.E. and Sneddon, I.N. (1950) The distribution of stressin the neighbourhood of a flat elliptical crack in an elastic solid.
Page 7 of 12 Halliburton Energy Services, Inc.Exhibit 1013
8 N.R. WARPINSKI, P.T. BRANAGAN, R.E. PETERSON, J.E. FIX, J.E. UHL, B.P. ENGLER, R. WILMER SPE 38573
Proceedings Cambridge Philosophical Society, 46, 159-163.24. Warpinski, N.R. and Teufel, L.W., "In situ Stresses in Low-
Permeability Nonmarine Rocks," JPT, April 1989, 405.25. Warpinski, N.R., "Interpretation of Hydraulic Fracture Mapping
Experiments," paper SPE 27985, proc., Tulsa CentennialPetroleum Engineering Symp., Tulsa, OK, Aug. 1994, 291.
SI Metric Conversion Factorsft × 3.048* E-01 = min × 2.54* E+00 = cm
bbl × 1.589 873 E-01 = m3
LB × 4.448 222 E+00 = Npsi × 6.894 797 E+00 = kPa
bpm × 9.539 238 E+00 = m3/sgal ×3..785 412 E-03 = m3
Monitor Well
MWX-3
MWX-2
IW-1C
0 100
Distance, ft
N
Figure 1. Plan view of M-Site.
B SAND
C SAND
MWX-3 MWX-2 MONITOR
MULTI-LEVELWIRELINERECEIVERS
TILTMETERS
ACCELEROMETERS
PRESSURE,GAMMA, ORRECEIVERS
SIDE VIEW
4000 ft
5000 ft
Figure 2. Layout of M-Site wells and instrumentation
4200
4250
4300
4350
4400
0 50 100 150
GAMMA RAY (API UNITS)
DE
PT
H (
ft)
C SAND
Figure 3. Gamma ray log showing C sand lithology
4300
4400
4500
4600
4700
4800
4900
B SAND
C SAND
DE
PT
H (
ft)
2500 3000 3500 4000 4500 5000STRESS (psi)
4000
4100
4200
Figure 4. Stress contrasts around C sand
2500
3000
3500
4000
4500
5000
0 20 40 60 80 100
TIME (min)
PR
ES
SU
RE
(ps
i)
1C: BREAKDOWN2C: LINEAR GEL3C: LINEAR GEL4C: INTERSECTION6C: PROPPED5C: DIAGNOSTIC
Figure 5. Correlated pressure data for C sand injections.
Page 8 of 12 Halliburton Energy Services, Inc.Exhibit 1013

SPE 38573 MICROSEISMIC AND DEFORMATION IMAGING OF HYDRAULIC FRACTURE GROWTH AND GEOMETRY … 9
0
100
200
300
400
500
600
-300 -200 -100 0 100 200 300
WEST-EAST (ft)
NO
RT
H-S
OU
TH
(ft)
MONITOR
5-LEVEL
MWX-3
MWX2
MONITOR
N75W
4100
4200
4300
4400
4500-300 -200 -100 0 100 200 300
ALONG FRACTURE LENGTH (ft)
DE
PT
H (
ft)
MONITOR
5-LEVEL
C SAND
MWX2
Figure 6. All injection 1C microseisms.
0
100
200
300
400
500
600
-300 -200 -100 0 100 200 300
WEST-EAST (ft)
NO
RT
H-S
OU
TH
(ft)
MONITOR
5-LEVEL
MWX-3
MWX2
MONITOR
N75W
AFTER 5 MIN
4100
4200
4300
4400
4500-300 -200 -100 0 100 200 300
ALONG FRACTURE LENGTH (ft)
DE
PT
H (
ft)
MONITOR
5-LEVEL
C SAND
MWX2AFTER 5 MIN
Figure 7. Injection 1C microseisms after 5 minutes (shut in).
0
100
200
300
400
500
600
-400 -300 -200 -100 0 100 200 300 400
WEST-EAST (ft)
NO
RT
H-S
OU
TH
(ft)
MONITOR
5-LEVEL
MWX-3
MWX2
MONITOR
N74W
AT INTERSECTION
4100
4200
4300
4400
4500-400 -300 -200 -100 0 100 200 300 400 500
ALONG FRACTURE LENGTH (ft)
DE
PT
H (
ft)
MONITOR
5-LEVEL
C SAND
MWX2 AT INTERSECTION
INTERSECTION WELL
Figure 8. Injection 2C microseisms at intersection.
Page 9 of 12 Halliburton Energy Services, Inc.Exhibit 1013

10 N.R. WARPINSKI, P.T. BRANAGAN, R.E. PETERSON, J.E. FIX, J.E. UHL, B.P. ENGLER, R. WILMER SPE 38573
0
100
200
300
400
500
600
-400 -300 -200 -100 0 100 200 300 400
WEST-EAST (ft)
NO
RT
H-S
OU
TH
(ft)
MONITOR
5-LEVEL
MWX-3
MWX2
MONITOR
N74W
4100
4200
4300
4400
4500-400 -300 -200 -100 0 100 200 300 400 500
ALONG FRACTURE LENGTH (ft)
DE
PT
H (
ft)
MONITOR
5-LEVEL
C SAND
MWX2
INTERSECTION WELL
Figure 9. All injection 2C microseisms.
0
100
200
300
400
500
600
-500 -400 -300 -200 -100 0 100 200 300 400 500
WEST-EAST (ft)
NO
RT
H-S
OU
TH
(ft)
MONITOR
5-LEVEL
MWX-3
MWX2
MONITOR
N75W
4100
4200
4300
4400
4500-500 -400 -300 -200 -100 0 100 200 300 400 500
ALONG FRACTURE LENGTH (ft)
DE
PT
H (
ft)
MONITOR
5-LEVEL
C SAND
MWX2
Fig 10. All injection 3C microseisms.
1-C
2-C
3-C
-1.20
-1.00
-0.80
-0.60
-0.40
-0.20
0.00
0.20
INC
LIN
AT
ION
(m
icro
radi
ans)
215 220 225 230 235 240 245
TIME (day of the year)Figure 11. Long term inclinations after unpropped fractures.
0
100
200
300
400
500
600
-500 -300 -100 100 300 500 700
WEST-EAST (ft)
NO
RT
H-S
OU
TH
(ft)
MWX3
MWX2
MONITOR WELL
N74W
AFTER 30 MIN
4100
4200
4300
4400
4500-500 -300 -100 100 300 500 700
ALONG FRACTURE LENGTH (ft)
DE
PT
H (
ft)
MWX2
C SAND
AFTER 30 MIN
Figure 12.Injection 4C microseismic image prior to restart.
Page 10 of 12 Halliburton Energy Services, Inc.Exhibit 1013
SPE 38573 MICROSEISMIC AND DEFORMATION IMAGING OF HYDRAULIC FRACTURE GROWTH AND GEOMETRY … 11
0
100
200
300
400
500
600
-500 -300 -100 100 300 500 700
WEST-EAST (ft)
NO
RT
H-S
OU
TH
(ft)
MWX3
MWX2
MONITOR WELL
N74W
4100
4200
4300
4400
4500-500 -300 -100 100 300 500 700
ALONG FRACTURE LENGTH (ft)
DE
PT
H (
ft)
MWX2
C SAND
Figure 13. All injection 4C microseisms.
4000
4200
4400
4600
4800
5000-25 -20 -15 -10 -5 0 5 10 15 20 25
INCLINATION (Microradians)
DE
PT
H (
ft)
H=87 ft
H=107 ft
H=137 ft
4C
C Sandstone
Figure 14. Injection 4C inclination results (2-D Finite Element).
0
100
200
300
400
500
600
-700 -500 -300 -100 100 300 500
WEST-EAST (ft)
SO
UT
H-N
OR
TH
(ft)
MONITOR
MWX-2
MONITOR WELL
FRAC 5C
N76W
MWX-3
4100
4200
4300
4400
4500-600 -400 -200 0 200 400 600
ALONG FRAC LENGTH (ft)
DE
PT
H (
ft)
MONITOR
MWX-2
C SAND
FRAC 5C
Figure 15. All injection 5C microseisms.
0
100
200
300
400
500
600
-700 -500 -300 -100 100 300 500
DISTANCE ALONG FRACTURE (ft)
DE
PT
H (
ft)
MONITOR
5-LEVEL
FRAC 6C
MWX-2
MWX-3
MONITOR WELL
AFTER 15 MIN
4100
4200
4300
4400
4500-600 -400 -200 0 200 400 600
DISTANCE ALONG FRACTURE (ft)
DE
PT
H (
ft)
MONITOR
5-LEVEL
FRAC 6CMWX-2
C SAND
AFTER 15 MINUTES
Figure 16. Injection 6C microseisms after 15 minutes of injection
Page 11 of 12 Halliburton Energy Services, Inc.Exhibit 1013
12 N.R. WARPINSKI, P.T. BRANAGAN, R.E. PETERSON, J.E. FIX, J.E. UHL, B.P. ENGLER, R. WILMER SPE 38573
0
100
200
300
400
500
600
-700 -500 -300 -100 100 300 500
DISTANCE ALONG FRACTURE (ft)
DE
PT
H (
ft)
MONITOR
5-LEVEL
FRAC 6C
MWX-2
MWX-3
MONITOR WELL
4100
4200
4300
4400
4500-600 -400 -200 0 200 400 600
DISTANCE ALONG FRACTURE (ft)
DE
PT
H (
ft)
MONITOR
5-LEVEL
FRAC 6CMWX-2
C SAND
Figure 17. All injection 6C microseisms.
4200
4300
4400
4500-200 -100 0 100 200 300
DISTANCE FROM FRAC PLANE (ft)
DE
PT
H (
ft)
MONITOR
5-LEVEL
MWX-2
C SAND
Figure 18. Edge-on view of all 6C microseisms.
4200
4300
4400
4500
4600
4700-1 -0.5 0 0.5 1
NORMALIZED INCLINATIONS
DE
PT
H (
ft)
SHUT-IN
6 hrs
33 hrs
58 hrs
83 hrs
Figure 19. Inclination distribution through closure.
C-6
C-4
18 DAY DATA BREAK
-1.20
-1.00
-0.80
-0.60
-0.40
-0.20
0.00
0.20T
ILT
(m
icro
radi
ans)
325 330 335 355 360 365
TIME (day of the year)Figure 20. Long-term inclinations after 4C and 6C treatments
Page 12 of 12 Halliburton Energy Services, Inc.Exhibit 1013