special nutrient management challenges for fertigation of
TRANSCRIPT

Nitrogen Management in Organic Strawberries
Practical Training on Nitrogen Management in Organic Production of Vegetables and StrawberriesMarch 16, 2021
Joji MuramotoAssistant Cooperative Extension Organic Production Specialist
University of California, Agriculture and Natural Resources
Center for Agroecology and Sustainable Food Systems
Department of Environmental Studies
University of California, Santa Cruz

Overview
1. Nitrogen (N) Management Basics
• Roles in plants and forms in soils
• Synchrony: Matching N supply with N demand
2. N Uptake by organic strawberries
3. N Supply for organic strawberries
4. Tools for N management in organic strawberries
5. Field trial: Use of high carbon amendment to reduce
N loss in broccoli-strawberry rotation

N in Plants; A Key to Crop Production
• Primary nutrient affecting plant growth
• photosynthesis (chlorophyll)
• biomass structure (protein)
• metabolism (enzyme)
• energy production (ATP)
• reproduction (DNA, RNA)
• N deficiency
• Yellowish green leaves, smaller plants, lower yield
• N excess
• Dark green leaves, large plants, susceptive to diseases
N deficient strawberry plant (Ulrich et al., 1980)

N Forms in Soil and Plant Availability
Soil N
Organic N
Inorganic N
Ammonium N (NH4+-N)
Nitrate N (NO3--N)
~ 2%
~98%
Mineralization**
** Biological processes affected by environmental factors such as soil
temperature. moisture, pH, oxygen content etc.
Nitrification**
* Plants can absorb small amounts of organic N and some crop plants can do more
than others
[Plant Unavailable*]
[Plant Available]
Adsorb
-------------------------
Repel
Clay p
article o
rSo
il organ
ic matte
r(n
egative
ly charge
d)
Leaching susceptive

Synchrony
• Matching N supply with N demand of
plants - amount and timing
• Important for:
• Efficient use of N resources
• Protecting ground and surface
water from nitrate contamination
• Reducing N fertilizer cost
• Good fruit yield
Asynchrony of N supply and N demand
(Robertson, 1997)
Available for loss

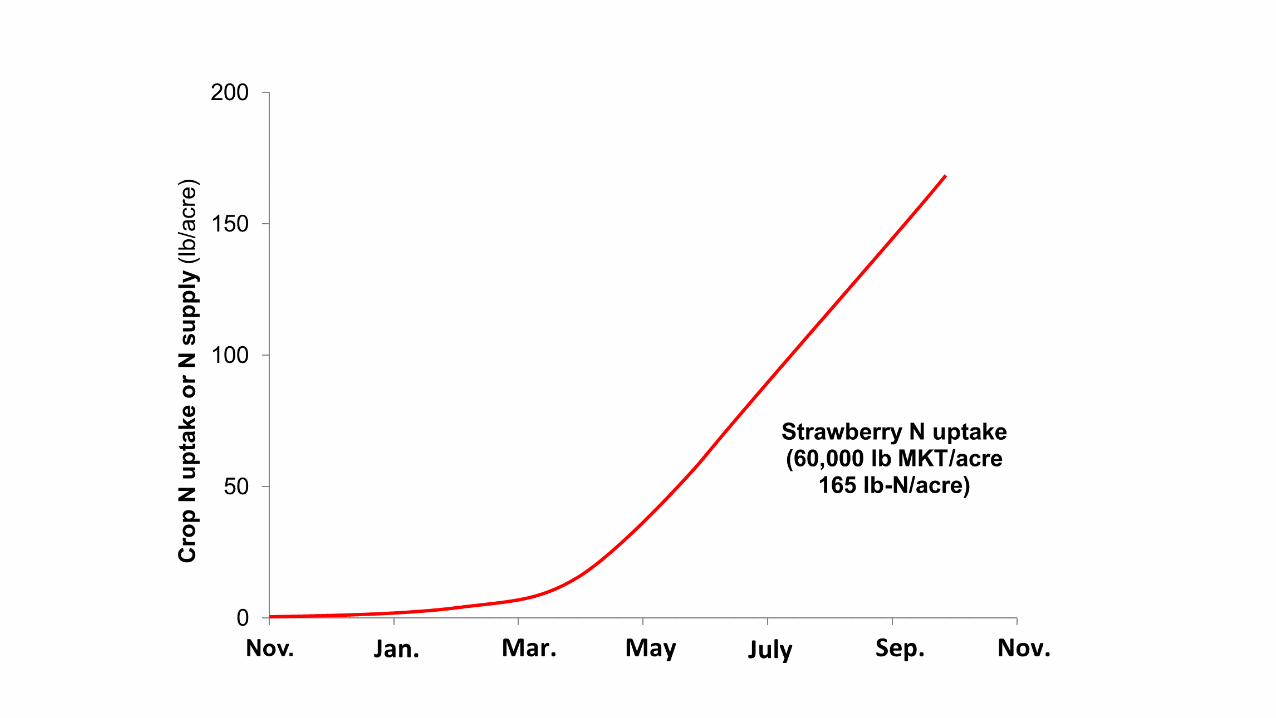
Cumulative N Uptake by Organic Strawberry in California
(Muramoto and Gaskell, 2011)
Marketable yield: 37,800 lb/acreMoss Landing, CA. Average of 4 seasons.cv. Aromas
Strawberry N uptake: Slow but constant for long period

Cumulative N Uptake by Conventional Strawberry in California
(Bottoms et al., 2013)
Santa Maria
Watsonville
150-220 lb-N/acre6-8 lb-N/acre/week during the harvest season
Av. Yield:
73,000 lb/ac

Approximate N Uptake by Strawberry during Harvest Season
Assumptions:• Each ton of fruit: 2.2 lb-N (N: 0.98% d.w., Fresh moisture 89%)• N uptake by Fruits vs. Shoots: 1 to 1• Harvest period: April to September (26 weeks)
Marketable
yield
lb/acre
Total yield
(20% cull)
lb/acre
Cumulative
plant N uptake
lb-N/acre
N uptake during
harvest season
lb-N/acre/week
40,000 50,000 110 4
50,000 62,500 138 5
60,000 75,000 165 6
70,000 87,500 193 7
80,000 100,000 220 8

Unique N Uptake Pattern of Strawberry
Steady N uptake4-8 lb-N/acre/week x 6 months
Low N uptake20-40 lb-N/acre/4 months

N Supply: Organic N sources
• Traditionally, organic growers concentrate on soil organic matter
(SOM) management as basis for organic production program

N Mineralization from SOM During the Pre-Harvest Season (Nov. – Mar.)
SOM 3.0%N = 8+6+6+6+7 = 33 lb-N/acre/foot
SOM 1.5%N = 4+3+3+3+4= 17 lb-N/acre/foot
(Geisseler, 2021)

N Supply: Organic N sources
• Traditionally, organic growers concentrate on soil organic matter
(SOM) management as basis for organic production program
• Nitrate from irrigation water

Nitrate-N from Irrigation Water during the Pre-Harvest Season (Nov. – Mar.)
• Typical Irrigation rate: ~12 inches (Cahn, Per. comm.)
5 ppm NO3-N
• NO3-N lb-N/acre = 5 x 12 x 0.23 = 14 lb-N/acre
10 ppm NO3-N
• NO3-N lb-N/acre = 10 x 12 x 0.23 = 28 lb-N/acre
Not much pre-plant N is necessary!

(N: 12%, PAN: 60%)
(Lazicki et al., 2020)
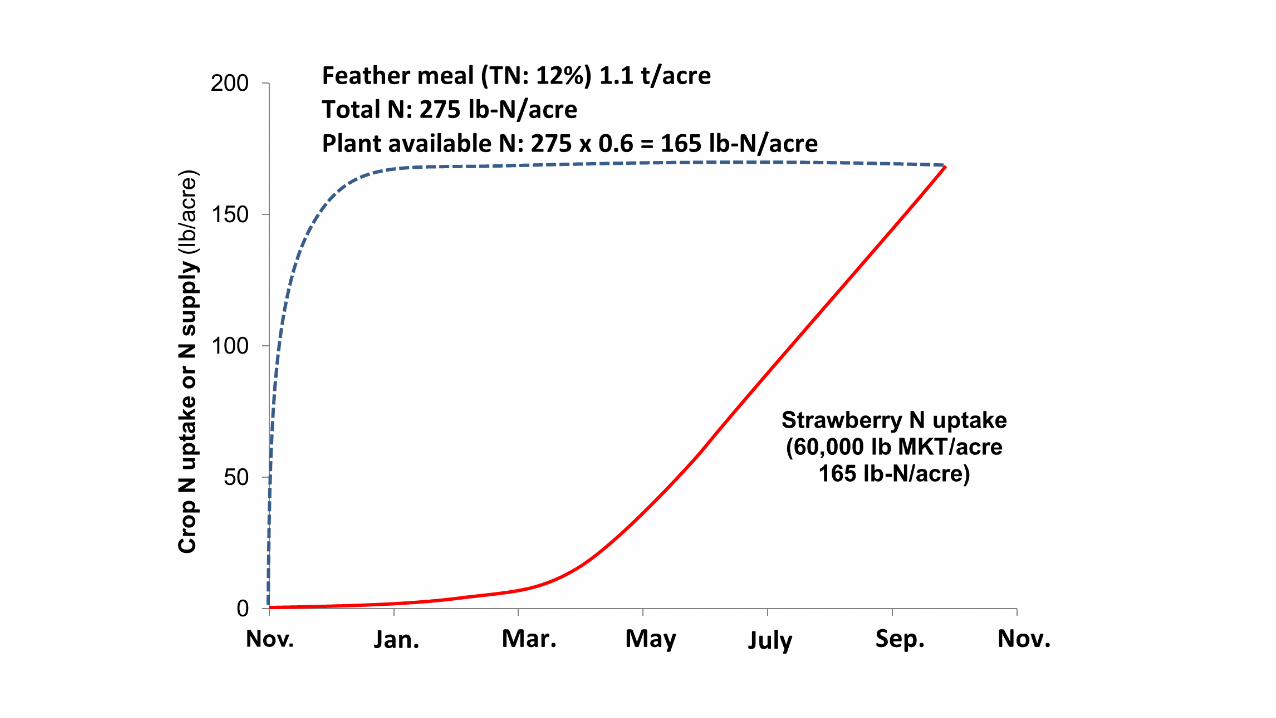

Available for loss
N Uptake and N Supply in Organic Tomatoes


N loss

Asynchrony of pre-plant nitrogen release and strawberry N uptake
In-season applications
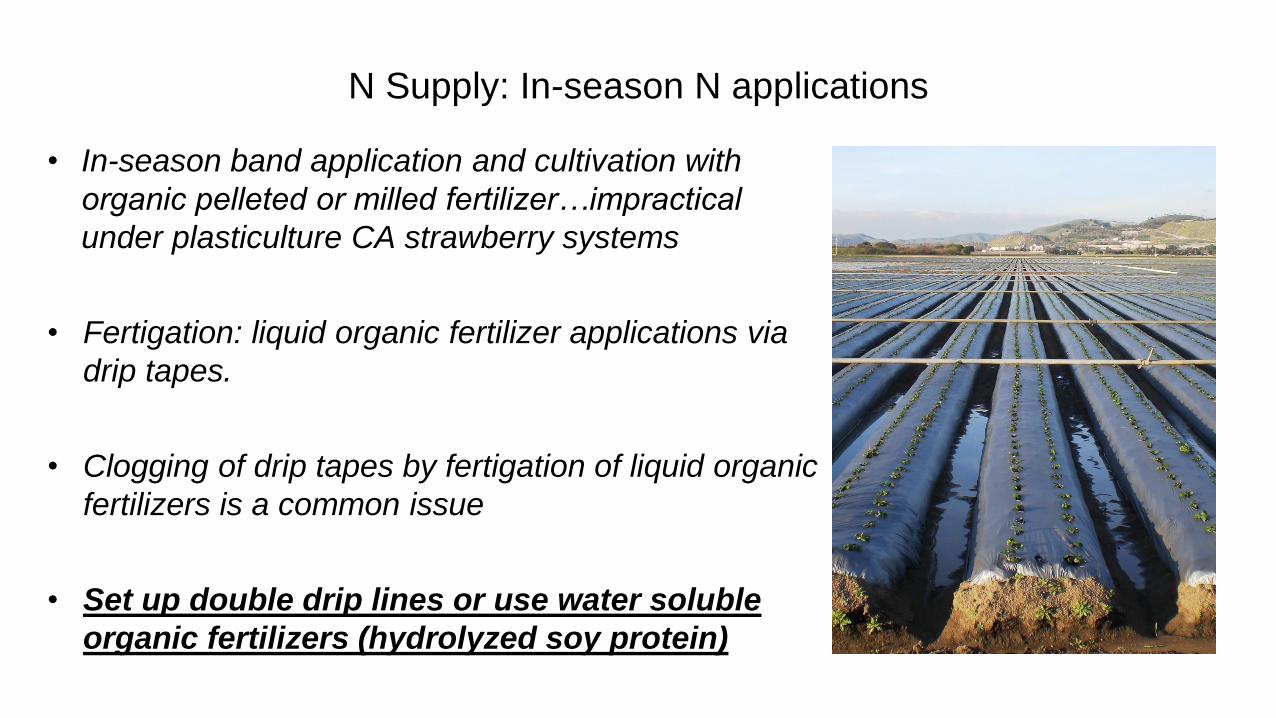
N Supply: In-season N applications
• In-season band application and cultivation with
organic pelleted or milled fertilizer…impractical
under plasticulture CA strawberry systems
• Fertigation: liquid organic fertilizer applications via
drip tapes.
• Clogging of drip tapes by fertigation of liquid organic
fertilizers is a common issue
• Set up double drip lines or use water soluble
organic fertilizers (hydrolyzed soy protein)

Costs of Liquid Organic Fertilizers
Material Type Cost/lb of Nitrogen
5-1-2 Liquid – Fish, corn $12.10
4-1-3 Liquid – Fish $13.30
14-0-0 Dry (soluble) – hydrolyzed soy protein
$18.50 – 35.70
4-4-2 Dry – Poultry manure, feather and meat & bone
$4.20
(Smith, Per. Comm.)

Assumptions:• Each ton of fruit: 2.2 lb-N (N: 0.98% d.w., Fresh moisture 89%)• N uptake by Fruits vs. Shoots: 1 to 1• Harvest period: April to September (26 weeks)
Marketable
yield
lb/acre
Total yield
(20% cull)
lb/acre
Cumulative
plant N uptake
lb-N/acre
N uptake during
harvest season
lb-N/acre/week
40,000 50,000 110 4
50,000 62,500 138 5
60,000 75,000 165 6
70,000 87,500 193 7
80,000 100,000 220 8
Approximate N Uptake by Strawberry during Harvest Season

N Mineralization from SOM During the Harvest Season (Apr. – Sep. 26 weeks)
SOM 3.0%N = 9+11+12+14+15+13 = 74 lb-N/acre/footAv. Per week74 / 26 = 2.8 lb-N/acre/week
SOM 1.5%N = 5+6+6+7+7+7 = 38 lb-N/acre/footAv. Per week38 / 26 = 1.5 lb-N/acre/week
(Geisseler, 2021)
It is worth building SOM!

Nitrate-N from Irrigation Water during the Harvest Season (April –Sep. 26 weeks)
• Typical Irrigation rate: ~18 inches (Cahn, Per. Comm.)
5 ppm NO3-N
• NO3-N lb-N/acre = 5 x 18 x 0.23 = 21 lb-N/acre
• For per week, 21 / 26 = 0.8 lb-N/acre/week
10 ppm NO3-N
• NO3-N lb-N/acre = 10 x 18 x 0.23 = 41 lb-N/acre
• For per week, 41 / 26 = 1.6 lb-N/acre/week

N Management Tools for Organic Strawberry
• Tissue test: TN of leaf blades (young matured leaves)
• NO3 in petioles: highly variable and may be less reliable for organic systems
• Soil nitrate test (combined with tissue TN test)
• NO3-N 10 - 25 ppm (=mg-N/kg dry soil) in 0’-1’ depth
• Optimum tissue TN and low soil nitrate pool may indicate a tightly-coupled plant-soil N cycling (Bowles et al., 2015)
Stage Early flowering Early harvest Main harvest
TN in blade 3.1-3.8% 2.7-3.2% 2.4-3.0%
(Bottoms et al., 2013)

N Management in Organic Strawberries: Summary
• N uptake of strawberries in the first 4 months is low (20-40 lb-N/acre) followed
by a steady uptake (4-8 lb-N/week) throughout the harvest period
• Pre-plant N: Moderate rate (50-75 lb-N/acre) recommended to avoid N loss
to the environment during rainy winters
• For a warm/dry winter, start fertigation early (e.g., Jan or Feb.)
• In-season N applications necessary during the harvest period
• 4-8 lb-N/acre/week during the harvest season…..adjust according to the
target yield, SOM content, Nitrate-N in irrigation water, and tissue TN tests
• Fertigation of liquid organic fertilizer
• Common organic liquid organic fertilizer + double drip lines, or
• Hydrolyzed soy protein N fertilizer (water soluble but expensive)
• SOM and irrigation water can be significant N sources for organic strawberry

0
50
100
150
200
250
300
-7 0 7 14 21 29 36 43Weeks after planting
N lb/ac
0
10
20
30
40
50
60
Precipitation
N uptake by strawberry plants
Precipitation
Asynchrony of N supply and N demand in
an organic strawberry field in the Northern region, CA
Soil inorg . N in 0-30cm depth2.0
1.0
inches
Sep. Nov. Jan. Mar. Apr. June Aug. Sep.
0’-1’ depth
(Muramoto et al., 2004)
Residual inorganic N at broccoli harvest
Post broccoli residue incorporation and preplant N application
150-250 lb-N/acreC:N ~10

Ground almond
shell (CN: 75)Ground olive
pomace (CN: 44)
Broadcasting ground almond shell and ground olive
pomace (Broccoli-Strawberry Rotation 2017-18)

Sandy loam – loam.Organic broccoli-strawberries.
Ground almond shell 6 t/acre (3.3 acres)
Untreated control (4.2 acres)
Large-scale non-replicated demonstration trial (Watsonville, CA 2019-20)
Ground almond
shell (CN: 75)

(CIMIS Pajaro)


(CIMIS Pajaro)
Nitrate Loss Examined period

March 3, 2020

April 7, 2020

Nitrate Loss during March 3 and April 7

Take-home Messages
• Although the almond shell 6 tons/acre plot did not increase marketable yield, it provided a comparable yield with untreated control (98% of untreated control)
• The almond shell plot immobilized soil nitrate derived from broccoli residues during the spring storms and delayed the peak soil nitrate release in the topsoil for 3 months from March to June
• Because of this delay, the almond shell plot reduced the estimated apparent nitrate loss from 136 to 52.2 lb-N/acre/3 ft during March and April (~60% reduction compared to untreated control)
• Economic analysis to be conducted

Acknowledgements
• Peter Navarra, Jacaranda Medina, Driscoll’s
• Jaime Mendez, Reiter Associate Company
• Guangwei Huang, Almond Board of California
• Margherita Zavatta, Sidney Lee, Carol Shennan, UCSC
