spores & cells media & modeling - wur
TRANSCRIPT
CLOSTRIDIUM PERFRINGENS:
SPORES & CELLS MEDIA & MODELING

Promotor: prof. dr. ir. Frans M. Rombouts Hoogleraar in de levensmiddelenhygiëne en –microbiologie Co-promotor: dr. Rijkelt R. Beumer Universitair docent Leerstoelgroep levensmiddelenmicrobiologie Promotiecommissie: prof. dr. ir. Johan M. Debevere (Universiteit Gent, België) dr. ir. Servé H.W. Notermans (TNO Voeding, Zeist) prof. dr. Michael W. Peck (Institute of Food Research, Norwich, UK) prof. dr. ir. Marcel H. Zwietering (Wageningen Universiteit)

CLOSTRIDIUM PERFRINGENS:
SPORES & CELLS MEDIA & MODELING
Aarieke Eva Irene de Jong
Proefschrift ter verkrijging van de graad van doctor
op gezag van de rector magnificus van Wageningen Universiteit,
prof. dr. ir. L. Speelman, in het openbaar te verdedigen op dinsdag 21 oktober 2003
des namiddags te vier uur in de Aula

A.E.I. de Jong – Clostridium perfringens: spores & cells, media & modeling – 2003 Thesis Wageningen University, Wageningen, The Netherlands – With summary in Dutch ISBN 90-5808-931-2

ABSTRACT
Clostridium perfringens is one of the five major food borne pathogens in the western world (expressed in cases per year). Symptoms are caused by an enterotoxin, for which 6% of type A strains carry the structural gene. This enterotoxin is released when ingested cells sporulate in the small intestine.
Research on C. perfringens has been limited to a couple of strains that sporulate well in Duncan and Strong (DS) medium. These abundantly sporulating strains in vitro are not necessarily a representation of the most dangerous strains in vivo. Therefore, sporulation was optimized for C. perfringens strains in general. None of the tested media and methods performed well for all strains, but Peptone-Bile-Theophylline medium (with and without starch) yielded highest spore numbers. DS medium may be optimized by adding theophylline, but PBT(S) medium is most suitable.
Since agar media influence cell counts of C. perfringens, six different media for enumerating C. perfringens from foods were tested, four of which were analyzed in an international collaborative trial. The examined media were equal from a microbiological point of view, but Tryptose-Sulphite-Cycloserine (TSC) agar was most favorable due to ease of use.
C. perfringens outbreaks are often associated with preparation of large food quantities. Large volumes of food are difficult to cool down, and cooling is one of the most important steps in preventing growth of C. perfringens. Data from the Dutch Inspectorate for Health Protection and Veterinary Public Health showed that pea soup was relatively often contaminated with C. perfringens. Therefore, the effect of different cooling procedures on growth of this pathogen was tested in pea soup. It was shown that cooling requirements stated by Dutch law allowed more than 1 log cycle growth of C. perfringens. This level of cell increase is inadmissible according to USA law. During subsequent refrigerated storage cell numbers remained constant. Therefore, a model was designed to predict the effect of various cooling scenarios on growth of this pathogen in pea soup. This model can be used to design Good Manufacturing Practices (GMP) procedures.
It can be concluded that C. perfringens is a heterogeneous species. To predict worst-case scenarios of the behavior of this pathogen in food, research should not focus on a couple of strains. To limit excessive screening of strains, a gamma-type growth model, based on general and interpretable parameters, was shown to accurately predict growth of C. perfringens. Combined with models that describe food-processing procedures, the growth model can serve as a good tool for GMP.

CONTENTS
Chapter 1 General introduction 1
Chapter 2 Optimizing sporulation of Clostridium perfringens 27
Chapter 3 Comparison of media for enumeration of Clostridium perfringens from foods 39
Chapter 4 Effect of cooling on Clostridium perfringens in pea soup 49
Chapter 5 Behavior of Clostridium perfringens at low temperatures 61
Chapter 6 Modeling growth of Clostridium perfringens in pea soup during cooling 73
Chapter 7 General discussion 91
References 97
Summary 117
Samenvatting 121
Nawoord 125
Curriculum vitae 127
Addendum 128

Spores & Cells, Media & Modeling

1 GENERAL INTRODUCTION

Chapter 1
2
Clos.tri’.di.um. Gr. n. closter: a spindle; N.L. neut. dim. n. Clostridium: a small spindle
per.frin’.gens. L. part. adj. perfringens : breaking through 66
The first reference of Clostridium perfringens in literature dates from 1892. It was then called Bacillus aerogenes capsulatus 320. Other known synonyms are Bacillus enteritidis sporogenes, Bacillus perfringens, Bacterium welchii, and Clostridium welchii 34,48,67,193,314. Although C. welchii is an unofficial name, it has been in use since 1939 and still can be found in British literature 267,296. Since 1980, the only valid name is Clostridium perfringens, which name has been in use since 1931 279. C. perfringens, alias B. enteritidis sporogenes, has been associated with diarrhea as early as 1895 193. The first suspected food vehicle, a rice pudding, was mentioned in 1899 34, but it still took over forty years to describe the first outbreak 195.
GENUS
The genus ‘Clostridium’ belongs to the Bacillaceae family. Clostridia are spore forming rods that usually stain Gram-positive. Spores of clostridia have oval or spherical shapes. Most clostridia are strictly anaerobic, but oxygen tolerance varies widely 5. The genus comprises of almost 150 species that vary in their metabolic activity and nutritional requirements 104.
C. perfringens is an anaerobic, but aerotolerant microorganism. Vegetative cells are non-motile and square-ended. Spores of this bacterium are ovally shaped and are rarely formed in vitro unless grown in special media (Figure 1) 5. C. perfringens is closely related with C. absonum, but differentiation between these two organisms is based on the lack of C. absonum to reduce sulphite 66. Other nearest related species are C. baratii (C. paraperfringens or C. perenne; gelatine not hydrolyzed) and C. sardiniensis (motile) 66,313. C. perfringens is antigenically related to C. bifermentans and C. sordelli, but these organisms are motile 5.
The species C. perfringens is divided into five types (A - E) according to the
Figure 1. Cell cycle of Clostridium perfringens (phase contrast micrographs). A: vegetative cells; B: sporulation cells; C: freed spores
General introduction
3
production of one or more of the four major lethal toxins produced by this species (Table 1) 5,66. In the past, strains belonging to the different subtypes were called C. agni (type B strains), C. paludis (type C strains), and C. ovitoxicus (type D strains)
267. For a long time, it was considered that no difference could be made between the five types on basis of biochemical reactions, metabolic end products, and cellular or colonial morphology 66. However, in 1988 a GLC technique was described to differentiate enterotoxin producing (Ent+) type A strains both from non-enterotoxin producing (Ent-) type A strains and from type B-E strains 197. This technique is based on volatile fatty acid production: food poisoning strains (Ent+) do not produce propionic acid, while all other strains, both non-food poisoning (Ent-) type A strains and type B-E strains, do produce this volatile fatty acid. Although all C. perfringens strains are pathogenic, only type A and C strains are harmful to humans; type B, C, D, and E strains are animal pathogens. C. perfringens is a well-known cause of food poisoning and gas gangrene in humans, but also causes sudden infant death syndrome, infectious diarrhea, antibiotic associated diarrhea, sporadic diarrhea, and biliary sludge and stone formation 89,204,208,217,239,267.
ECOLOGY
C. perfringens is a ubiquitous organism and is widely spread in nature 66. Type A strains are present in soil, dust, and water and are part of the endogenous flora of humans and animals, whereas the other types are obligate parasites 5,66,148. The endogenous flora of healthy people contains <103-105 colony forming units (cfu) per gram feces, while persons with C. perfringens food poisoning have counts of 103-106 cfu/g, with 105 cfu/g as average 164. C. perfringens has been isolated from many food types, but mostly from meat products. Raw meat is frequently contaminated with this pathogen: 66% of fresh swine meat, 26% of fresh cattle meat, 3% of cattle carcasses, 79% of poultry carcasses, 12% of pork organ meat, 39% of ground pork meat, and
Table 1. Classification of Clostridium perfringens by toxin type
C. perfringens Toxin
Type α β ε ι Enterotoxin Disease
A + - - - + Gas gangrene: man Food poisoning: man Enterotoxemia: cattle, horses
B + + + - Dysentery: lambs Enterotoxemia: sheep, goats, foals
C + + - - + Necrotic enteritis: man Enterotoxemia: calves, piglets, sheep
D + - + - (+) Enterotoxemia: sheep, lamb, cattle E + - - + Enterotoxemia: sheep, cattle

Chapter 1
4
81% of processed pork products are contaminated with C. perfringens 72. Processing of meat increases distribution of this pathogen: 2% of whole muscle meat samples are contaminated, while after emulsification 49% of the samples are infected 295. Another notorious source of C. perfringens are spices; 59% of different spice samples are contaminated 51.
CELL CYCLE CHARACTERISTICS
Vegetative growth C. perfringens is an anaerobic organism, but can withstand 5% of oxygen 119. It requires many amino acids and several vitamins for growth, conditions that are fulfilled by meats, fish, and other protein rich products 76,128,192. This pathogen has one of the fastest growth rates of all microorganisms: generation times are 6.3 min and 6.6 min in broth and meat, respectively, at temperatures between 43-47°C
5,199,202. Growth is supported in a temperature range of 15-50°C 199. The extreme growth temperatures are 6°C and 52.3°C, but growth at 6°C could not be maintained for a long period 47,275. Mathematically predicted maximum and minimum growth temperatures are 51.0°C (95% confidence interval: 50.92-51.13°C) and 10.1°C (95% confidence interval: 6.2-16.5°C) 186. The wide confidence interval for the minimal growth temperature is supported by data from literature, which show that growth does not invariably occur at 15°C 41,107,124,137,226,227,250.
Microorganisms encounter many temperature effects during processing of cooked food. These types of foods are heated to reduce microbial counts. Dutch law requires cooking to at least 75°C, while American law prescribes different time/temperature combinations for different products (see Prevention, page 21) 21,308. Subsequently, these foods are cooled and kept below 7°C or are held above 60°C to inhibit bacterial growth 21. Spores of C. perfringens, however, survive cooking. Subsequent hot holding at temperatures ≥60°C does not reduce spore numbers and germination will occur when the temperature is not sufficiently high 289. Hot holding is the most important step in reducing food poisoning outbreaks caused by C. perfringens 108. Holding at insufficiently high temperature may allow temperatures to drop below 50°C. At these temperatures rapid growth of C. perfringens occurs. Improper heating or inadequate storage at high temperature will even increase thermo-tolerance of vegetative cells of C. perfringens by inducing synthesis of presumptive heat shock proteins 153,154. Although hot holding of foods is a critical point during food processing, cooling is as important 108. Foods that are inadequately cooled permit growth of C. perfringens to high cell numbers 179,184,185,186. Subsequent refrigeration or frozen storage reduces the viability of C. perfringens to a limited extent 124,136,303.
Microbial growth is not dependent on temperature alone. Intrinsic food characteristics such as pH and water activity (aw) are important factors as well. C. perfringens will readily grow in a pH range from 5.5-8.0, with pH 7.2 being optimal
5,66. Growth is inhibited at values of pH 5.0 and below, and at pH 8.3 and above 282. The optimal aw is 0.995 and values below 0.94-0.96 prevent growth of this pathogen
General introduction
5
42,187,288. Cell densities influence growth characteristics as well. At low cell concentrations (<102 cells/ml) non-optimal temperature, pH or aw are more fatal than at higher cell concentrations. Cells are also more sensitive to nitrite at low cell levels and medium composition exerts greater influence as well 122,254.
Spores Some bacteria are able to form spores, like bacilli and clostridia. Spore formation is a manner to survive unfavorable conditions, such as heat, drought, chemicals, radiation or starvation. As a spore, a bacterium may survive for hundreds of years 225. Spores obtain high resistance by embedding core macromolecules, enzymes, and metabolites in a dehydrated calcium dipicolinic acid gel. This gel is surrounded by a semi-crystalline inner spore membrane 171. Spores are not metabolically active, but environmental changes trigger the process, which turns a spore back into a vegetative cell (Figure 2) 189,269.
Sporulation is the process of spore formation. Conditions that support sporulation are more restricted than growth condition. Sporulation of C. perfringens is limited to temperatures between 27-50°C, pH values of 6.0-8.0, and aw > 0.96 187,201,250. Spores are formed within 3 h during optimal conditions, but sporulation is greatly affected by medium composition 121. Some (partly) defined media have been developed for sporulation of C. perfringens, such as D-medium and New-Sporulation-Medium (NSM) 232,263. However, most media contain complex ingredients (peptone, yeast extract or trypticase) in combination with salts (manganese sulphate or sodium phosphate) and reducing agents (thioglycollate, resazurine or cystein-HCl). These media are: AEA, Peptone-Bile-Theophylline medium (PBT), Peptone-Bile-Theophylline-Starch medium (PBTS), SEC, Duncan and Strong medium, Ellner’s, Kim’s, and Tórtora’s medium 35,91,101,190,293,301,310. Single medium components may alter the sporulation pattern drastically. Manganese sulfate is known to increase sporulation of most C. perfringens strains 101, the effect of carbon/energy sources is more strain dependent 145. Starch is generally used as a carbon/energy source
91,190,293,301,309, but not all strains ferment starch. Instead, raffinose 145,203, mannitol 101, glycerol 294, and glucose 35,232,297 are used as carbon/energy source.
The sporulation process is also influenced by extrinsic factors: applying a heat shocking to a sporulating culture delays spore formation, but does not affect spore numbers 154. Vegetative cells of C. perfringens that cause food poisoning, survived stomach passage and start sporulating in the small intestine. The acidic environment of the stomach and bile salts in the duodenum may stimulate sporulation and enterotoxin production 155,330. Sporulation is enhanced by a sporulation promoting factor, which is produced by enterotoxin positive (Ent+) as well as enterotoxin negative (Ent-) strains 155,273,305. This factor is produced in sporulating and non-sporulating cultures, has a molecular weight between 100 and 500 Da, and is produced in the beginning of the growth cycle 305. Although only Ent+ strains cause food poisoning, Ent- may play a role in this gastrointestinal illness by means of the sporulating factor, especially since Ent- strains are more ubiquitously present in foods and the human intestine than Ent+ strains are 130,273. The sporulation factor

Chapter 1
6
produced by Ent- strains may induce sporulation of Ent+ strains in the intestines, causing release of the enterotoxin that causes food poisoning.
Germination is the process of spores turning into vegetative cells. This process may be defined as ‘a series of degradative events triggered by specific germinants leading to irreversible loss of spore resistance properties’ 171,189,269. The germination process starts with the loss of heat resistance, the commitment to germinate, and the release of dipicolinic acid, followed by loss of OD600nm, selective cortex hydrolysis, and onset of metabolism 171. This whole germination process may take only 15 minutes 225. Germination is an irreversible process and spores will continue to germinate after removal of the germinants. Amino acids, sugars, alcohols, dodecylamine, enzymes, hydrostatic pressure, and heat are possible germinants 78,171. The action of germinants is species and strain specific; bacilli are, for instance, triggered by L-alanine alone, while clostridia need more complex mixtures of
Figure 2. Morphological changes during differentiation of sporulating bacteria. During vegetative growth, cells divide by binary fission. Under conditions of nutrient deprivation asymmetric septation takes place (stage IIi). The forespore is then engulfed by the mother cell membrane (stages IIii and IIiii) and becomes completely surrounded by mother cell cytoplasm (stage III). During stage IV the primordial cell wall is laid down surrounding the forespore inner membrane (black line) and then the cortex (shaded area) is formed on the outside of the primordial cell wall. The coats (black line) are deposited outside the cortex during stage V. The spore matures (stage VI) and is released upon lysis of the mother cell (stage VII). Germination of the endospore occurs in the presence of germinants and the cortex is hydrolyzed, the germinated spore can then grow out to form a new vegetative cell (according to S.J. Foster et al.) 113. Outgrowth is the process of synthesis of new macromolecules, which converts the germinated spore to a newly emerged vegetative cell and the onset of metabolism
171,189
Sporulation
VVI
VII
Primordial cell-wallCortex
Core
Coats
Germinationoutgrowth
IIi
IIii
IIiii
III
IV
Mother cellForespore
SporulationSporulationSporulation
VVVI
VII
Primordial cell-wallCortex
Core
CoatsCortex
Core
Coats
GerminationoutgrowthGerminationoutgrowth
IIi
IIii
IIiii
III
IV
IIi
IIii
IIiii
III
IV
Mother cellForespore

General introduction
7
germinants like amino acids, sugars, and ions 171. On the species level it is known that most spores require heat treatment to germinate 256, but time-temperature conditions vary with each strain 91. For heat-activation of C. perfringens different time/temperature combinations are in use: 10 or 20 min at 70°C; 10, 15 or 20 min at 75°C; 10, 15 or 20 min at 80°C and 5 min at 85°C 41,73,91,138,190,232,234,273,330. Germination is supported over the whole temperature range that enables cell survival: 0°C-60°C 33.
The optimal growth range of microorganisms generally influences thermo-resistance of spores: thermophiles produce more heat resistance spores than mesophiles do and psychrophiles produce even less resistant spores 317. Thermo-resistance varies within the species and is affected by growth conditions and sporulation circumstances (Table 2) 121,167,190,258. Single components in the sporulation medium, such as peptone or starch in SEC medium, can increase heat resistance 190. Results from FD-1 and FD-1041 in DS show this effect: strains tested by García-Alvarado 121 are cultured in DS medium in which starch was replaced by raffinose and to which sodium carbonate was added to enhance sporulation. These spores are more resistant than those tested by Heredia 153 in standard DS medium. Applying a heat shock on a sporulating culture also results in more heat resistant spores 153. The type of heating medium used affects heat resistance as well, as is shown for buffer and beef gravy 52. Spores heated in beef gravy were more resistant to 102°C, but less resistant to 112.8°C compared to spores heated in buffer. Applying high temperatures to spores may damage spores, resulting in underestimation of spore counts. Sensitising spores to lysozyme by ethylenediaminetetraacetate and adding lysozyme to the plating medium allows damaged spores to grow out as well, solving the problem of underestimation 31,52. Sensitizing spores to lysozyme is necessary since only 1-2% of spores are naturally sensitive to this compound.
Table 2. D values (min) of spores of different Clostridium perfringens strains
Strain Menstruum Tsporulation (°C) D value (min) Reference
FD-1 DSa 32 D85: 37 121
FD-1 DS 43 D85: 85 121
FD-1 DS 43 D85: 24 153
ATCC 3624 DS 32 D85: 48 121
ATCC 3624 DS 43 D85: 90 121
ATCC 3624 SECb 37 D100: 0.31 319
FD-1041 DS 32 D95: 22 121
FD-1041 DS 43 D95: 200 121
FD-1041 DS 43 D95: 55 153
NCTC 8238 SEC 37 D100: 17.6 319
NCTC 8798 Beef gravy 37 D98.9: 30 52
NCTC 8798 Beef gravy 37 D115.6: 0.2 52
a Duncan and Strong medium 91; b Medium of Angelotti et al. 35

Chapter 1
8
ENUMERATION AND CONFIRMATION
Many media and methods have been described to isolate C. perfringens from foods and feces and to identify this pathogen. An enrichment procedure is normally superfluous for enumerating C. perfringens from foods or feces related to a food poisoning outbreak, since only high numbers of C. perfringens cause these outbreaks. However, freezing or prolonged refrigerated storage of food and feces samples may reduce cell numbers, which complicates direct enumeration on plating media 51,116. Addition of glycerol to food/feces samples will reduce the effect of cell damage caused by cold storage 116. When low cell numbers are suspected, Rapid-Perfringens-Medium (RPM) 102 or Perfringens-Enrichment-Medium (PEM) 86 may be used as enrichment medium. These media can also be used in the most-probable-number method. However, this procedure is very laborious and still needs subsequent confirmation. Many different plating media have been developed for direct quantitative enumeration of C. perfringens from foods or feces. DNA based methods
Text box 1. Methods used to enumerate and confirm Clostridium perfringens from food and feces
Enrichment - RPM: stormy fermentation of lithmus
milk; polymyxin and neomycin - PEM: cycloserine Enumeration Electivity of C. perfringens on the below mentioned media is based on the reduction of sulphite to sulphide, which results in black colonies due to iron sulphide precipitation. Both the additional elective characteristics and the types of antibiotics used are mentioned. - BISC: cycloserine - mCP: cycloserine and polymyxin - OPSP medium: oleandomycine,
polymyxin, and sulfadiazine - SCA medium: cycloserine and sodium
azide. - SFP medium: lecithinase activity;
kanamycin and polymyxin - SPS: polymyxin and sulfadiazine - TSC: cycloserine - TSC + egg-yolk: lecithinase activity;
cycloserine - TSN: neomycin
Confirmation - Acid phosphatase activity: MUP or
saccharose/phenolphthaleindifosfate + NaOH or phenolphthaleindifosfate + NH4OH or 1-naphtyl fosfate + diazonium o-dianisidine in citrate buffer
- Lecithinase activity: egg yolk hydrolysis; neutralized by anti-serum: Nagler reaction
- Lactose medium: production of acid and gas from lactose
- Lactose-sulphite (LS) medium: production of gas from lactose (Durham tubes) + reduction of sulphite to sulphide resulting in a black color.
- Motility medium: growth along the stab line indicates non-motile growth.
- Motility-nitrate (MN) medium + Lactose-gelatine (LG) medium: Non-motile growth and reduction of nitrate to nitrite + production of acid and gas from lactose and liquefaction of gelatine.
- Reverse-CAMP test: hemolysis of blood by the combined action of β-hemolytic activity from Streptococcus agalactiae and α-toxin activity by C. perfringens on sheep’s blood agar plates resulting in bright spots on the plate.

General introduction
9
and enterotoxin detection are used as qualitative techniques. In Europe, at least three different standard methods are in use for enumerating C.
perfringens from food or feces. The most important method is established by the European Standard and is ISO authorized 9. This standard prescribes the use of egg-yolk-free Tryptose-Sulphite-Cycloserine (TSC) 147,151 agar for enumerating C. perfringens from food and feeding stuff (Text box 1). TSC medium does not solely yield C. perfringens colonies, implying the use of further confirmatory tests. Either the Lactose-Sulphite (LS) reaction or the combined use of Motility-Nitrate (MN) medium and Lactose-Gelatine (LG) medium is imposed. This confirmatory method is based on the knowledge that the only gram-positive, (obligate) anaerobic bacterium that is non-motile, ferments lactose, liquefies gelatine and reduces sulphite to sulphide and nitrate to nitrite is C. perfringens 66. Another standard is imposed by the Nordic Committee on Food Analysis (NMKL) 7 for enumeration of this microorganism from food for Scandinavian countries. C. perfringens is enumerated with TSC and confirmed with motility medium and lactose medium. The German standard for determination of mesophilic sulphite-reducing clostridia from meat and meat products enforced by the German Institute for Normalization (DIN) states the use of Sulphite-Cycloserine-Azide (SCA) 44,100 agar and subsequent use of the reverse-CAMP 142 test for additional confirmation of C. perfringens 4.
Media designed to enumerate sulphite-reducing clostridia are based on the reduction of sulphite, which precipitates as iron sulphide, resulting in black colonies (Figure 3). This reaction is, however, not limited to clostridia. Other bacteria like salmonellae, Proteus, Escherichia freundii, Citrobacter sp. (formerly Paracolobactrum intermedium), and certain species of the genera Erwinia, Flavobacterium, and Achromobacter yield black colonies as well 35. Antibiotics are added to the media to inhibit growth of these sulphite-reducing organisms and of non-sulphite reducing anaerobic bacteria, which complicate growth of C. perfringens (Text box 2). The different media compete with each other in the ability to produce black colonies, the quantitative recovery yields, and selectivity. Many articles have been published comparing different media with regard to these characteristics. Most of these media are similar in their composition [Shahidi-Ferguson-Perfringens agar (SFP), Sulphite-Polymyxin-Sulfadiazine agar (SPS), TSC, and Tryptose-Sulphite-
Figure 3. Colony morphology of different Clostridium perfringens strains on TSC agar plates (37°C overnight) A: WU01147; B: ATCC 12916; C: NCTC 10239

Chapter 1
10
Table 3. Comparison of specific characteristics of different sulphite-reducing clostridia 66
Organism La G M N LG+MN LS
C. perfringens +b + - +- + +
C. absonum + + -+ + - +
C. bifermentans - + + - - -
C. botulinum (types A and B) - + + - - -
C. botulinum (types E and F) - + + - - -
C. butyricum + - +- - - +
C. cadaveris - + +- - - -
C. difficile - + +- - - -
C. felsineum +w + d - - +
C. formicaceticum - - + - - -
C. glycolicum - - +- - - -
C. hastiforme - + + -+ - -
C. histolyticum - + +- - - -
C. novyi - + +- - - -
C. paraperfringens +w - - d - +
C. paraputrificum + - +- -+ - +
C. pasteurianum -w - -+ - - -
C. perenne +w - - d - +
C. putrefaciens - + - - - -
C. putrificum - + + - - -
C. ramosum + - - - - +
C. roseum + + -+ - - +
C. rubrum + - + - - +
C. sardiniensis +w + + +- - +
C. scatologenes - - + - - -
C. sordellii - + +- - - -
C. sphenoides w+ - + +- - +
C. sporogenes - + +- - - -
C. sticklandii - - + - - -
C. subterminale - + +- - - -
C. tertium + - + +- - +
C. tetani - + -+ - - -
a L : production of acid and gas from lactose; G: liquefaction of gelatine; M: motility; N: reduction of nitrate to nitrite; LG+MN: combination of L+, G+, M-, and N+ (characteristics of C. perfringens); LS: lactose-sulphite medium; b +: reaction positive for 90-100% of strains; -: reaction negative for 90-100% of strains; +-: 61-89% of strains positive; -+: 11-39% of strains positive; d: 40-60% of strains positive; w: weak reaction. Where two reactions are listed, the first is the more usual and occurs in 60-90% of strains
General introduction
11
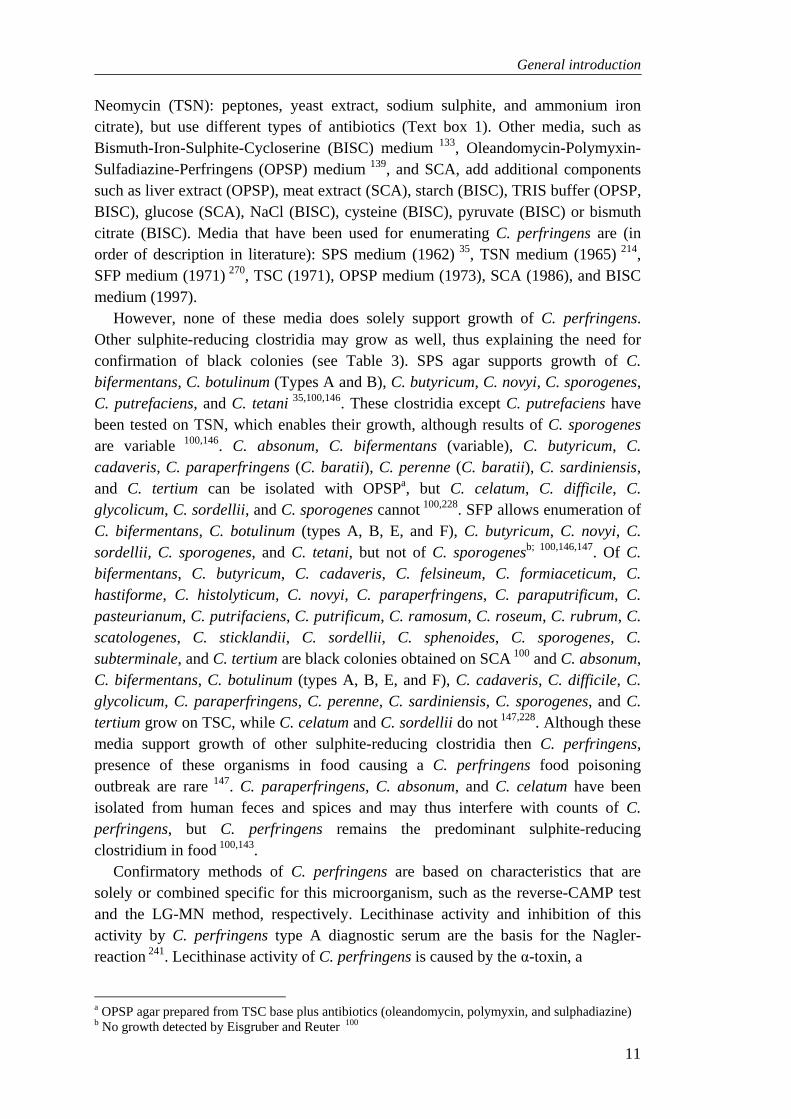
Neomycin (TSN): peptones, yeast extract, sodium sulphite, and ammonium iron citrate), but use different types of antibiotics (Text box 1). Other media, such as Bismuth-Iron-Sulphite-Cycloserine (BISC) medium 133, Oleandomycin-Polymyxin-Sulfadiazine-Perfringens (OPSP) medium 139, and SCA, add additional components such as liver extract (OPSP), meat extract (SCA), starch (BISC), TRIS buffer (OPSP, BISC), glucose (SCA), NaCl (BISC), cysteine (BISC), pyruvate (BISC) or bismuth citrate (BISC). Media that have been used for enumerating C. perfringens are (in order of description in literature): SPS medium (1962) 35, TSN medium (1965) 214, SFP medium (1971) 270, TSC (1971), OPSP medium (1973), SCA (1986), and BISC medium (1997).
However, none of these media does solely support growth of C. perfringens. Other sulphite-reducing clostridia may grow as well, thus explaining the need for confirmation of black colonies (see Table 3). SPS agar supports growth of C. bifermentans, C. botulinum (Types A and B), C. butyricum, C. novyi, C. sporogenes, C. putrefaciens, and C. tetani 35,100,146. These clostridia except C. putrefaciens have been tested on TSN, which enables their growth, although results of C. sporogenes are variable 100,146. C. absonum, C. bifermentans (variable), C. butyricum, C. cadaveris, C. paraperfringens (C. baratii), C. perenne (C. baratii), C. sardiniensis, and C. tertium can be isolated with OPSPa, but C. celatum, C. difficile, C. glycolicum, C. sordellii, and C. sporogenes cannot 100,228. SFP allows enumeration of C. bifermentans, C. botulinum (types A, B, E, and F), C. butyricum, C. novyi, C. sordellii, C. sporogenes, and C. tetani, but not of C. sporogenesb; 100,146,147. Of C. bifermentans, C. butyricum, C. cadaveris, C. felsineum, C. formiaceticum, C. hastiforme, C. histolyticum, C. novyi, C. paraperfringens, C. paraputrificum, C. pasteurianum, C. putrifaciens, C. putrificum, C. ramosum, C. roseum, C. rubrum, C. scatologenes, C. sticklandii, C. sordellii, C. sphenoides, C. sporogenes, C. subterminale, and C. tertium are black colonies obtained on SCA 100 and C. absonum, C. bifermentans, C. botulinum (types A, B, E, and F), C. cadaveris, C. difficile, C. glycolicum, C. paraperfringens, C. perenne, C. sardiniensis, C. sporogenes, and C. tertium grow on TSC, while C. celatum and C. sordellii do not 147,228. Although these media support growth of other sulphite-reducing clostridia then C. perfringens, presence of these organisms in food causing a C. perfringens food poisoning outbreak are rare 147. C. paraperfringens, C. absonum, and C. celatum have been isolated from human feces and spices and may thus interfere with counts of C. perfringens, but C. perfringens remains the predominant sulphite-reducing clostridium in food 100,143.
Confirmatory methods of C. perfringens are based on characteristics that are solely or combined specific for this microorganism, such as the reverse-CAMP test and the LG-MN method, respectively. Lecithinase activity and inhibition of this activity by C. perfringens type A diagnostic serum are the basis for the Nagler-reaction 241. Lecithinase activity of C. perfringens is caused by the α-toxin, a
a OPSP agar prepared from TSC base plus antibiotics (oleandomycin, polymyxin, and sulphadiazine) b No growth detected by Eisgruber and Reuter 100

Chapter 1
12
phospholipase C that hydrolyzes lecithin to phosphorylcholine and a diglyceride 66. The Nagler-reaction is applied in different methods, such as the antitoxin half-plate test and the antiserum test 51,159,325. Not all C. perfringens strains produce lecithinase
Text box 2. Characteristics of antibiotics used in media to enumerate Clostridium perfringens from food and feces
- - - Cycloserine inhibits Gram-positive
bacteria, Escherichia coli, some pseudomonads (P. pseudomalle and P. cepacea), and Chlamydia. It is used as a drug against Mycobacterium tuberculosis
17,316. Growth of group D streptococci, which are commonly present in foods associated with C. perfringens food poisoning, is completely inhibited 147. Cycloserine does not inhibit growth of C. paraperfringens (gelatine-negative), C. beijerinckii (nitrate-negative, motility-positive), C. sporogenes (motile, lactose negative), C. sordellii, C. bifermentans (both lactose negative, motility-positive), C. botulinum (types A, B, E, and F; motile, nitrate-negative, lactose-negative), Lacotobacillus, Bacteroides, and Serratia marcescens 51,147. Cycloserine reduces the diffuse and thus disturbing blackening around C. perfringens colonies and colonies that develop remain smaller 19. Cycloserine does not reduce growth of injured cells, but some C. perfringens strains are sensitive to cycloserine
37,147,161. - Polymyxin B sulfate is inhibitory to
Gram-negative rods (Pseudomonas, E. coli, Enterobacter, Klebsiella, Salmonella and Shigella spp.), but Proteus species are resistant. Gram-negative cocci, Gram-positive bacteria, yeasts and fungi are insensitive 2. Compared to cycloserine, polymyxin does not reduce accompanying flora sufficiently: enterococci, staphylococci, aerobic bacilli, proteae, and Gram-negative rods such as Salmonella, and certain species of Citrobacter still grow in presence of polymyxin 51,237,238.
- Kanamycin sulfate is a broad spectrum antibiotic. Its activity mainly affects Gram-negative bacteria, such as E. coli, Proteus, Enterobacter aerogenes, Klebsiella pneumoniae, Salmonella, Serratia marcescens, Shigella, and Acinetobacter. Its action is limited against Gram-positive bacteria, such as streptococci and enterococci, but kanamycin is effective against Staphylococcus aureus, Bacillus subtilis, and Mycobacterium 22,23.
- Sulfadiazine is a sulfonamide. This group of antiseptics is effective against microorganisms that synthesize folic acid, by competing with para-aminobenzoic acid (PABA), an ingredient of yeast extract. Sulfadiazine is effective against both Gram-positive and Gram-negative bacteria: E. coli, Klebsiella, Enterobacter, Proteus mirablis, Proteus vulgaris, S. aureus, Pseudomonas, and Shigella
17,18,120. Most salmonellae are resistant 65. - Oleandomycin has a minimal inhibiting concentration to C. perfringens of 16 mg/l, while other clostridia are inhibited by concentrations ≤ 4 mg/l (C. bifermentans, C. cadaveris NCIB 10676, C. clostridiiforme, C. sordelli, and C. sporogenes) or are more resistant (C. sphenoides, C. tertium, C. cadaversi P-1, C. symbiosum, and C. subterminale) 93.
- Sodium azide inhibits both Gram-positive and Gram-negative catalase positive organisms 27, although the former are more susceptible. Noteworthy, some C. perfringens strains associated with food poisoning are inhibited as well 238.

General introduction
13
resulting in false-negatives, while C. absonuma, C. bifermentansa, C. paraperfringens, C. sardiniensisa and C. sordellii are responsible for false-positives
53,144,325. Incorporation of lactose in the medium will rule out these clostridia, since they do not or weakly produce acid from lactose 66,325. Other important characteristics of C. perfringens are that it is non-motile, liquefies gelatine, produces acid and gas from lactose, produces acid from raffinose and salicin, ferments inositol, reduces nitrate, and produces acid phosphatase and lecithinase 66,144,268. Some closely related sulphite-reducing clostridia that are non-motile, reduce nitrate to nitrite, and produce acid and gas from lactose are differentiated from C. perfringens because they fail to liquefy gelatine (C. absonumb, C. celatum, and C. paraperfringens). C. sardiniensis (lactose-positive, nitrite-positive, gelatine-positive) can only be distinguished from C. perfringens by a weak positive motility test 144. Additional testing of salicin fermentation and raffinose fermentation for which C. perfringens reacts negative (or weakly positive) and positive, respectively, rules out false-positives 144. These and other closely related strains show that the use of LS medium as proposed by the European committee for standardization (CEN) 9 and the Nagler-reaction results in false-positives, whereas the combined use of LG and MN avoids these problems (see Table 3). However, most clostridia isolated from foods are C. perfringens 143,147, which explains the use of LS medium for confirming C. perfringens by the CEN accredited method. The reverse-CAMP test seems reliable for confirming C. perfringens, but use of fresh blood can be a problem in some countries.
Methods that combine enumeration and confirmation of C. perfringens are available as well; these methods are time-efficient since no further incubation time for confirmatory tests is needed. A highly specific indicator of C. perfringens is the presence of acid phosphatase activity 213. The activity of this enzyme is demonstrated by supplementing media with 4-methylumbelliferyl-phosphate (MUP), a fluorogenic enzyme substrate. Positive colonies will glow light blue when placed under UV light (366 nm). However, other clostridia such as C. bifermentans, C. sporogenes, C.sordellii, C. butyricum, C. baratii, C. ramosum, C. difficile, C. sardinensis, S. lituseburense, and C. tertium will react positively too 99. Other methods are based on the same enzyme activity, but use other substrates: saccharose + phenolphthaleindiphosphate or 1-naphtyl phosphate + diazonium o-dianisidine 43,99. The naphtyl containing reagent is highly specific for C. perfringens; this species reacts within seconds while other clostridia take more than 3 min to show phosphatase activity 99. Blood-free egg yolk medium (BCP) uses the lecithinase production and ability to ferment inositol 161. The mCP medium utilizes the ability to ferment sucrose, the production of acid phosphatase and the absence of β-D-glucosidase in combination with polymyxin and cycloserine 49.
Most time-efficient procedures are based on conductance measurements that correlate the number of colony forming units (cfu) to the time to turbidity. Detection times vary from 1 h to 18 h for 108 cfu/ml to 1 cfu/ml, respectively 90. This method
a Partially inhibited by C. perfringens anti-serum b Slowly liquefies gelatine 144

Chapter 1
14
may not be very useful in quantitative analysis, but for qualitative purposes it serves as a rapid screening method. Complimentary quantitative analysis may still be needed, but only a part of the samples has to be plated on agar. This will save time and money.
Quantitative enumeration of C. perfringens alone is not sufficient for epidemiological purposes, although high cell numbers are a good indicator for outbreaks caused by this organism 211. Food poisoning outbreaks are caused by strains that produce enterotoxin. Only 4.25-6% of C. perfringens strains possess the gene encoding enterotoxin production. The presence of enterotoxin in feces or the presence in food and/or feces of strains containing the enterotoxin gene is therefore of greater importance than the total number of C. perfringens cells isolated 259,311.
The enterotoxin can be detected by C. perfringens enterotoxin specific reverse passive latex agglutination assays and enzyme linked immunosorbent assays (ELISA) 55, while the presence of the cpe gene can be demonstrated by PCR based methods or by a dot-blot technique 211,259. C. perfringens is ubiquitous in nature and part of the normal intestinal flora of humans, which emphasizes the need of genotype analysis of strains both isolated from suspected food vehicles and of stools of patients involved in the outbreak. Matching of genotypes will strengthen the diagnosis of C. perfringens based outbreaks. Genotype analysis can be performed with pulsed-field gel electrophoresis (PFGE) in which digested chromosomal DNA patterns of different strains are compared 211. Another way to demonstrate the relationship between strains isolated from food and feces is by serotyping 164. This technique is based on specific antigen reactions by different strains. By 1973, 48 antisera were available; by 1975 this number had increased to 57. Nowadays over a hundred antisera are available, but the technique loses ground to molecular typing techniques.
FOOD BORNE ILLNESS
Toxin The enterotoxin of C. perfringens (CPE; see Table 4) is produced during sporulation after onset of sporulation stage II 92,198. The CPE accumulates in the cytoplasm and can make up 33% of the total cell protein 81,203. Previously, it was assumed that vegetative cells could also produce the enterotoxin 125,131, but it was demonstrated that a 48-kDa enterotoxin-related protein caused the confusion 261.
C. perfringens cells survive stomach passage and sporulate in the intestinal lumen when large quantities of cells are ingested with food. During lysis of the mother-cell to release the spore, the CPE is set free. Subsequently, the CPE is transformed to a more active toxin by trypsin and chymotrypsin after which it binds to receptors on the brush-border membrane of epithelial cells 326,327. CPE-sensitive mammalian cells often express >106 receptors/cell, which have been shown to be 22-kDa claudin proteins (proteins located in tight junctions of many cell types) 118,216,217. Cells posses both low affinity and high affinity binding sites for CPE 224. This affinity difference
General introduction
15
is caused by difference in receptor density. Binding of CPE to brush border cells is saturable, temperature-dependent and irreversible 219.The bound CPE protein changes its configuration from a β-sheet to an α-helix structure allowing the protein to insert in the cell membrane of the epithelial cell 129. This membrane insertion alters the mammalian cell membrane permeability for ions and small molecules. Simultaneously, CPE becomes resistant to proteases by binding to a ~45-50 kDa protein 219. The resulting ~90-100 kDa small complex rapidly binds with other proteins and forms larger complexes: a ~155 kDa complex or a ~200 kDa complex. Both complexes are still subject of study, but the 155-kDa complex seems to be effective in killing mammalian cells, which may be caused by pore formation in cell membranes. The 200-kDa complex contains occludin, a major structural component of tight junctions (cementing layer between epithelium cells). This complex may therefore alter tight junction function and structure, resulting in permeability alterations and thus contributing to diarrhea 217.
The permeability changes of epithelial cells caused by CPE result in a reversal of ileal transport of water, sodium, and chloride ions; net absorption is reversed into net secretion. Glucose uptake is reduced, but potassium and bicarbonate transport (secretion) is unchanged 220.Cell damage caused by CPE flattens out the brush border membrane and results in great losses of cell membranes and cytoplasm 222. These processes eventually lead to cell death followed by leakage of large molecules such as nucleotides and proteins 219. The process from binding till cell death is short: tissue damage occurs within 15 minutes and synthesis of DNA, RNA, and proteins is inhibited within half an hour 218,220.
The enterotoxin is highly cytotoxic: concentrations as low as 1 ng cause detectable cell damage 218,221. Food poisoning symptoms are only mild because C. perfringens cells and unbound enterotoxin are flushed from the small intestine due to profuse diarrhea 215. Oral administration of enterotoxin shows that 8-10 mg is necessary to cause diarrhea 278. Excretion of fluid feces starts between 1-2.5 h after administration of the enterotoxin and lasts 2-3 hours. Based on rabbit studies, CPE only has moderate activity in the jejunum and is almost inactive in the duodenum 223.
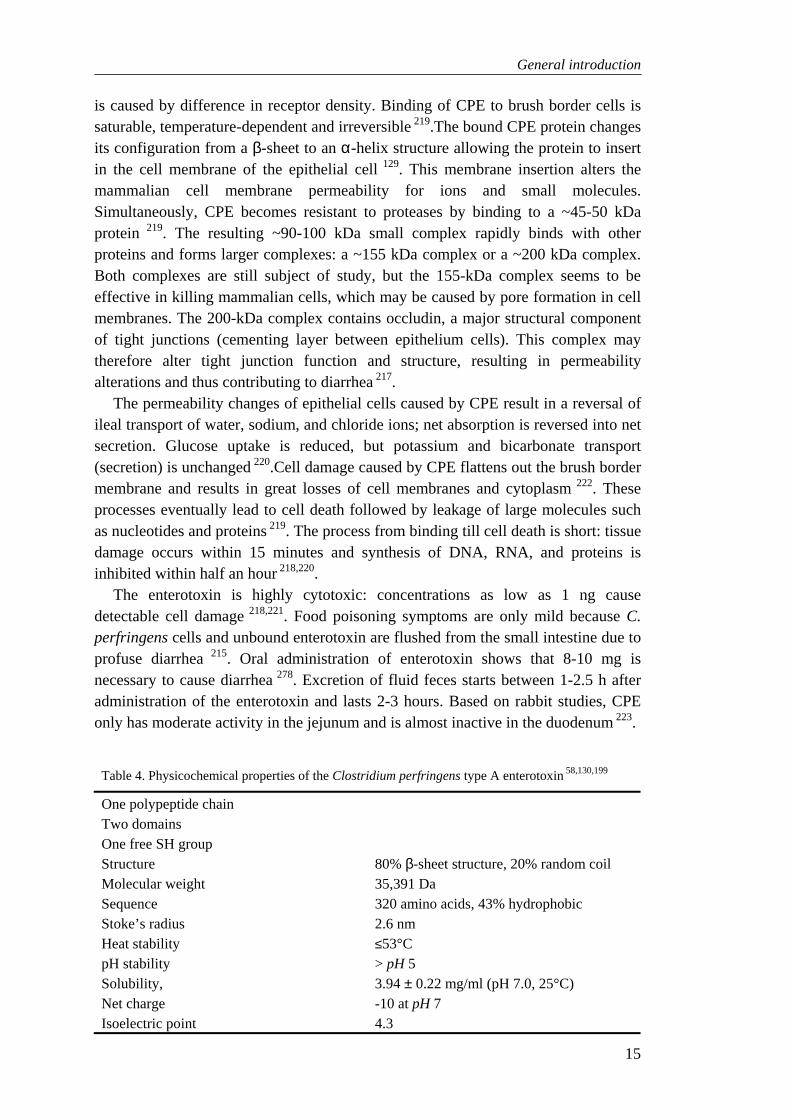
Table 4. Physicochemical properties of the Clostridium perfringens type A enterotoxin 58,130,199
One polypeptide chain Two domains One free SH group Structure 80% β-sheet structure, 20% random coil Molecular weight 35,391 Da Sequence 320 amino acids, 43% hydrophobic Stoke’s radius 2.6 nm Heat stability ≤53°C pH stability > pH 5 Solubility, 3.94 ± 0.22 mg/ml (pH 7.0, 25°C) Net charge -10 at pH 7 Isoelectric point 4.3

Chapter 1
16
The enterotoxin has a unique amino acid sequence, except for some homology with a C. botulinum protein 217. The enterotoxin produced by different type A strains or by variants of the same strain is similar in structure, but not identical 81. This is strongly suggested by comparison of the open reading frame of the gene encoding the enterotoxin (cpe) in different strains. This gene sequence shows at least four distinct epitopes:
1) The receptor-binding region located near the C-terminus, amino acids 290 to 319. The fragment decoded by these 29 amino acids, CPE290-319, is non-cytotoxic and may be used to obtain a CPE-neutralizing antibody, which can be used as a vaccine 141;
2) The region involved in insertion and cytotoxicity, including amino acids 26-171 141;
3) A non-functional region, which after removal increases toxicity, including amino acids 1-45. Removal of the first 25 N-terminal residues by trypsin or the first 37 N-terminal amino acids by chymotrypsin enhance toxic activity
217; 4) A fragment that plays an important role in cytotoxicity and large complex
formation, amino acids 45-116 217. Not all C. perfringens strains contain the gene coding for enterotoxin production (cpe): 4.3% of strains isolated from spices, 6% of strains isolated form feces of farm animals, and 86% and 88% of strains isolated from food and feces, respectively, from different food poisoning outbreaks contained the cpe gene 253,259,311. The gene can either be part of the chromosome or be present on a plasmid 74,286. Strains involved in food poisoning outbreaks consistently possess the chromosomal gene, while other diseases are caused by strains containing the gene on a plasmid. Part of this phenomenon may be explained by the greater heat resistance of strains containing the chromosomal gene versus strains carrying a plasmid cpe gene 217; strains containing the chromosomal cpe gene are more resistant to food processing conditions.
The enterotoxin not only causes food poisoning, but since 1984 it is recognized to cause infectious diarrhea as well. In this case, the organism multiplies and produces enterotoxin in the host, whereas with food poisoning, no multiplication occurs 8. Of the investigated outbreaks of infectious diarrhea in the United Kingdom between 1990 and 1996 85% were caused by C. perfringens, involving 259 people (53% attack rate) in 29 outbreaks. Most of these outbreaks occurred in residential institutions for the elderly. The reported symptoms are (bloody) diarrhea, abdominal pain, nausea, and vomiting. The diarrhea continues for 3 to 14 days, but can last 7 months 8.
The capability of CPE to kill mammalian cells by binding to claudins, a family of transmembrane domain proteins that are part of epithelial cell tight junctions 217, has been exploited in cancer research 233. Pancreatic cancer cells over-express clauding-4, a protein that serves as a CPE receptor, and intratumoral CPE injection results in tumor cell necrosis and reduction of tumor growth in mice. CPE may therefore be a promising anti-carcinogenic drug.
General introduction
17
Outbreaks C. perfringens is an important cause of food-poisoning world-wide (see Table 5 and Table 6). This organism is notorious for its large-scale outbreaks as is demonstrated by an outbreak in a prison in 1990 causing 700 people to fall ill after eating tacos 45. Most discussed outbreaks are restaurant based, which gives this pathogen nicknames such as “cafeteria germ” or “food service germ” 112,290; the food poisoning disease caused by this pathogen is called cafeteria cramps 132.
The majority of food poisoning outbreaks are caused by strains that form heat resistant spores 66. However, heat-sensitive spores are also able to survive the cooking process and cause food poisoning 152,158,291,329. Illness occurs after ingestion of approximately 108-109 viable cells. Foods incriminated in food poisoning outbreaks contain 103-108 cfu/g, with an average of 105 cfu/g 88,115,164. The onset of C. perfringens food poisoning starts with acute diarrhea, the predominant symptom of the disease. Symptoms occur 5-21 h after ingestion of contaminated foods and are rather mild, such as abdominal pain, nausea, and diarrhea and last for 1-2 days 88,152. People involved in C. perfringens outbreaks are mainly aged 65+ (70%), only 20% is aged between 15-64 years 25. Elderly are more susceptible too: per thousand cases of C. perfringens food poisoning 4 nursing home residents die compared to 0.46 persons in the general population 46,77,128,280. The attack rate of this pathogen ranges between 15.8-100%, but normally more than half of the exposed people fall ill 1,324.
Food poisoning outbreaks primarily involve meat and meat products 56,299, but other food items that may be contaminated are fish, vegetables, dairy products, dehydrated foods, such as soups and gravies, spices, milk, gelatine, spaghetti, pasta, flour, and soy protein 5. Although type A food poisoning is caused by intestinally produced enterotoxin, C. perfringens sporulates and produces enterotoxin in food 79.
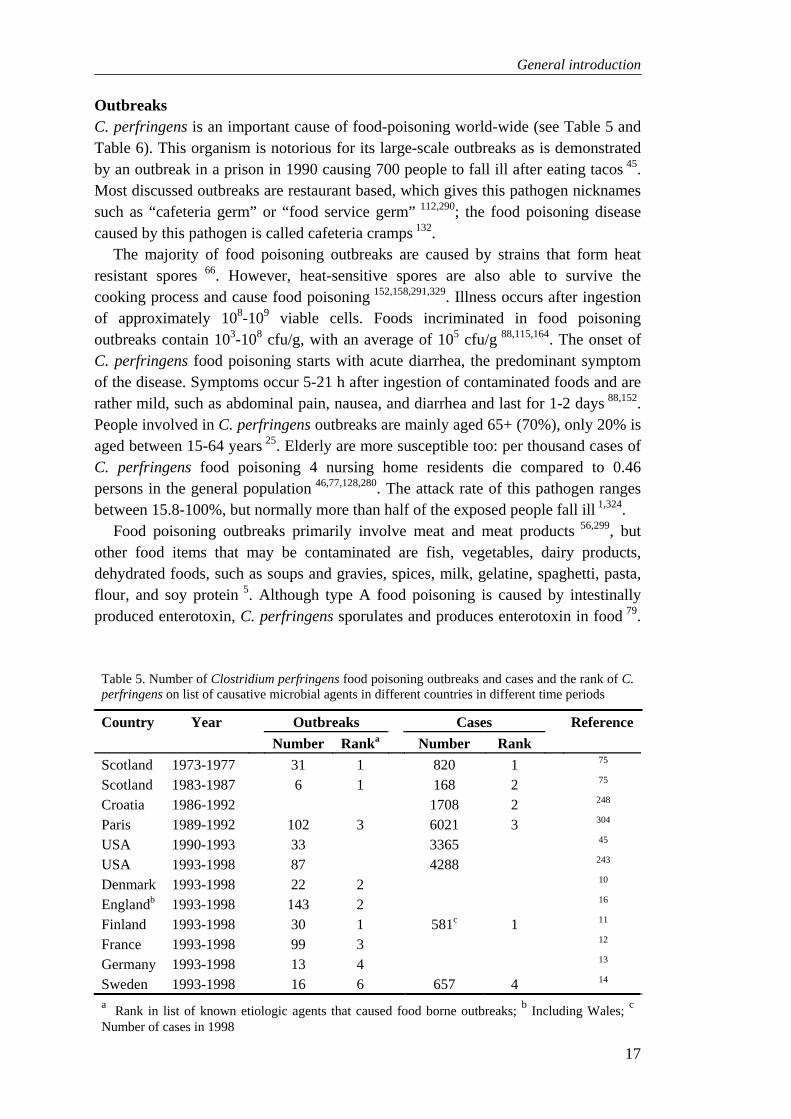
Table 5. Number of Clostridium perfringens food poisoning outbreaks and cases and the rank of C. perfringens on list of causative microbial agents in different countries in different time periods
Country Year Outbreaks Cases Reference
Number Ranka Number Rank
Scotland 1973-1977 31 1 820 1 75
Scotland 1983-1987 6 1 168 2 75
Croatia 1986-1992 1708 2 248
Paris 1989-1992 102 3 6021 3 304
USA 1990-1993 33 3365 45
USA 1993-1998 87 4288 243
Denmark 1993-1998 22 2 10
Englandb 1993-1998 143 2 16
Finland 1993-1998 30 1 581c 1 11
France 1993-1998 99 3 12
Germany 1993-1998 13 4 13
Sweden 1993-1998 16 6 657 4 14
a Rank in list of known etiologic agents that caused food borne outbreaks; b Including Wales; c Number of cases in 1998

Chapter 1
18
Heating of food will destroy the enterotoxin, since its biological activity is lost within 5 min at 60°C 242. Consumption of foods containing enterotoxin is unlikely, since foods are spoiled by the time enterotoxin will be produced 79. Furthermore, fairly high amounts of pre-formed enterotoxin are needed to cause food poisoning, ≥ 8 mg 149, because the enterotoxin is not acid stable (activity is lost at pH < 5) and will be inactivated by proteolytic enzymes before reaching the duodenum 128.
Type C food poisoning is caused by the ß-toxin of type C strains and is known as enteritis necroticans jejunitis or pig-bel disease, a fatal disease with severe symptoms. The ß-toxin is normally inactivated by proteolytic enzymes in the intestine, such as (chymo)trypsin. People suffering from type C food poisoning have either low production levels of these proteolytic enzymes, caused by their nutritional status or have impaired enzymes due to inhibitors in their diet. Nowadays this disease is only reported in Papua New Guinea 5,212, due to high consumption levels of sweet potatoes that contain trypsin inhibitors 5,130.
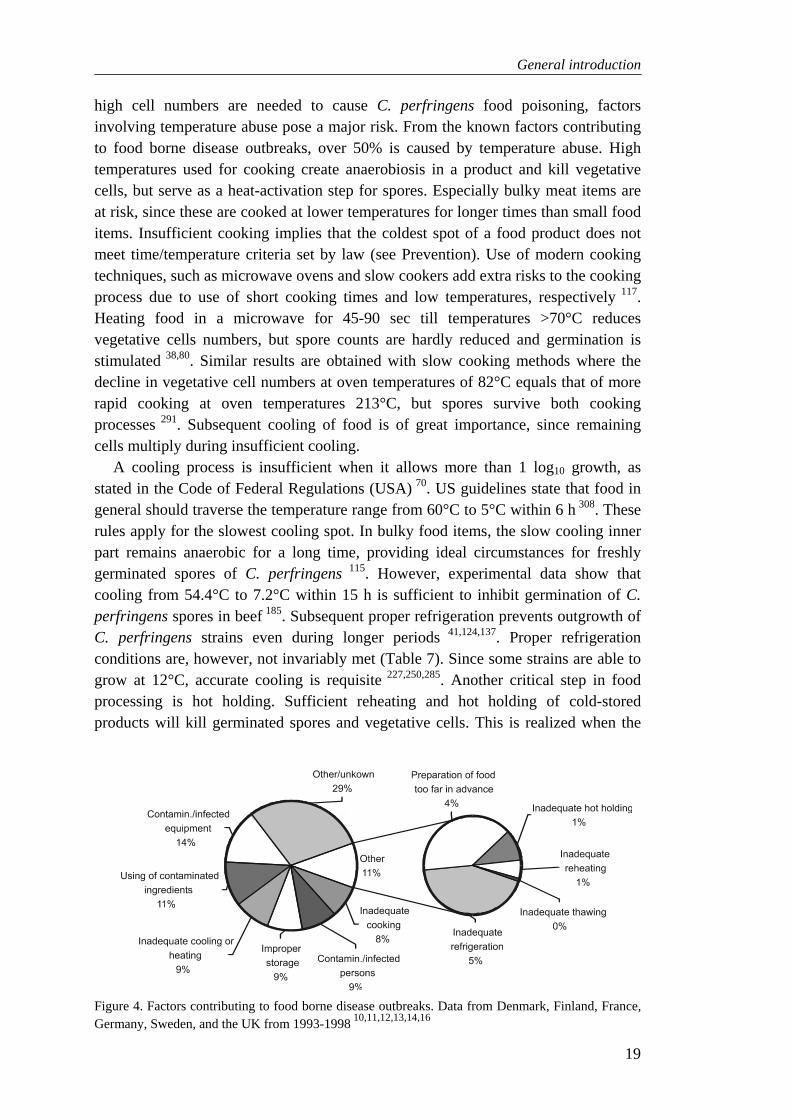
Food can become highly contaminated with C. perfringens when insufficiently cooked and inadequately cooled and/or reheated before use 156. Figure 4 shows the importance of various factors contributing to food borne disease outbreaks. Since
Table 6. Clostridium perfringens food poisoning outbreaks and cases reported by the Dutch Inspectorate for Health Protection and Veterinary Public Health (KvW) in absolute numbers, percentage, and rank on list of causative microbial agents in The Netherlands from 1983 to 2000
Year Outbreaks Cases Reference
Number Percentagea Rank Number Percentagea Rank
1983 10 3.8 2 60 3.6 5 162
1984 3 1.6 3 9 0.7 5 162
1985 2 0.9 5 5 0.3 5 162
1986 3 1.8 4 108 8.5 1 162
1987 4 2.3 3 25b 1.5 3 162
1988 2 1.9 3 6 0.6 4 162
1989 1 1.1 4 3c 0.6 4 162
1990 3 1.7 3 10 1 4 162
1991 7 2.0 2 24b 1.5 5 126
1992 8 2.1 2 61 3.7 2 126
1993 1 0.3 4 6 0.4 3 126
1994 6 1.2 3 26 1.4 3 126
1995 3 0.4 4 94
1996 9 0.9 4 94
1997 10 1.9 2 68d,e 2.5 3 94
1998 3 1.7 1 12 1.8 1 95
1999 2 0.6 4 18 1.1 3 96
2000 8 2.6 2 60c 3.9 2 98
2001 2 0.7 3 5 0.3 4 97
a 75-90% of outbreaks has an unknown etiologic agent; b Including 2 single cases; c Including 1 single case; d Including 6 single cases; e Excluding 38 cases in which C. perfringens was one of more etiologic agents
General introduction
19
high cell numbers are needed to cause C. perfringens food poisoning, factors involving temperature abuse pose a major risk. From the known factors contributing to food borne disease outbreaks, over 50% is caused by temperature abuse. High temperatures used for cooking create anaerobiosis in a product and kill vegetative cells, but serve as a heat-activation step for spores. Especially bulky meat items are at risk, since these are cooked at lower temperatures for longer times than small food items. Insufficient cooking implies that the coldest spot of a food product does not meet time/temperature criteria set by law (see Prevention). Use of modern cooking techniques, such as microwave ovens and slow cookers add extra risks to the cooking process due to use of short cooking times and low temperatures, respectively 117. Heating food in a microwave for 45-90 sec till temperatures >70°C reduces vegetative cells numbers, but spore counts are hardly reduced and germination is stimulated 38,80. Similar results are obtained with slow cooking methods where the decline in vegetative cell numbers at oven temperatures of 82°C equals that of more rapid cooking at oven temperatures 213°C, but spores survive both cooking processes 291. Subsequent cooling of food is of great importance, since remaining cells multiply during insufficient cooling.
A cooling process is insufficient when it allows more than 1 log10 growth, as stated in the Code of Federal Regulations (USA) 70. US guidelines state that food in general should traverse the temperature range from 60°C to 5°C within 6 h 308. These rules apply for the slowest cooling spot. In bulky food items, the slow cooling inner part remains anaerobic for a long time, providing ideal circumstances for freshly germinated spores of C. perfringens 115. However, experimental data show that cooling from 54.4°C to 7.2°C within 15 h is sufficient to inhibit germination of C. perfringens spores in beef 185. Subsequent proper refrigeration prevents outgrowth of C. perfringens strains even during longer periods 41,124,137. Proper refrigeration conditions are, however, not invariably met (Table 7). Since some strains are able to grow at 12°C, accurate cooling is requisite 227,250,285. Another critical step in food processing is hot holding. Sufficient reheating and hot holding of cold-stored products will kill germinated spores and vegetative cells. This is realized when the
Figure 4. Factors contributing to food borne disease outbreaks. Data from Denmark, Finland, France, Germany, Sweden, and the UK from 1993-1998 10,11,12,13,14,16

Chapter 1
20
product reaches temperatures >60°C. After reheating the number of C. perfringens cells left should be less than 10,000 per gram food 3,21.
Food borne illness poses an economic impact due to medical costs, lost productivity costs, psychological costs, and averting behavior costs 62. Estimating the impact of food borne pathogens on society is fairly difficult, since most causative agents of food borne illnesses are unknown and many cases are not reported due to mild symptoms. However, food borne illnesses are of governmental concern. The UK Food Standards Agency has set a target to reduce food borne illness by 20% in a 5-year period by 2006 24. Hence, reports are regularly published estimating food borne illness and infectious intestinal diseases. Data from the USA presented in 1989 show that 12.6 million people fall ill because of food borne illnesses each year. Total costs are estimated at $8.4 billion (in 1985 US dollars), including $123 million for C. perfringens. Costs per case for C. perfringens food poisoning are low, $190, in comparison with $322,200 for a C. botulinum case, since symptoms caused by C. perfringens are mild and those caused by C. botulinum are often fatal 298. Data from the USA presented in 1996 estimate total costs due to the seven most important food borne pathogens to range between $6.5-34.9 billion (in 1995 US dollars), of which $0.1-0.5 billion is accounted for by 10,000 cases and 100 deaths caused by C. perfringens 61. Data from the USA published in 1999 estimate the number of illnesses, hospitalization rate, and case-fatality rate of this pathogen at 248,520, 0.003%, and 0.0005%, respectively 229; the number of cases is estimated to be 38 times the number of reported cases. Trends in England and Wales demonstrate a decline in infectious intestinal disease over the last decade 29. Estimated cases of infectious intestinal disease, hospitalization, and deaths caused by C. perfringens decreased from 276,266, 1,163, and 291, respectively, in 1992 to 84,081, 354, and 89, respectively, in 2002. These numbers also include non-food borne infections: 94.4% of the cases in 1995 are food borne. Numbers of total deaths caused by infectious intestinal diseases were reduced by almost 50% in this period, mainly attributed to the strong decrease in deaths caused by C. perfringens. This decrease correlates with a drop in red meat consumption in the UK. However, C. perfringens is still the most important microorganism with respect to deaths in the UK after Salmonella. No estimation of costs is presented in this study, but in 1992 145,403 patients visited a General Practitioner and 1,163 patients occupied a hospital bed with a total of 17,216 days. In 2000 these numbers had decreased to 44,253, 354, and 5,240, respectively. PREVENTION
Many laws have been dedicated to safe handling of food to prevent (re)contamination with and growth of microorganisms in food. The easiest way to eliminate microorganisms of food is by heating. When correct time/temperature profiles are used microorganisms can either be completely eradicated or be strongly reduced, processes that are called “sterilization” and “pasteurization,” respectively.

General introduction
21
Sterilizing products is more stringent than pasteurization. Time/temperature combinations are product specific 181, but have to enable killing of all vegetative cells and spores. Pasteurization will leave bacteria in the product. Law states the maximum levels for specific (groups of) microorganisms in food. For C. perfringens this amount is <100.000/g; surpassing this level results in a penalty 3. To ensure these levels, foods should be heated to at least 75°C core temperature by Dutch law. American law prescribes time/temperature combinations for different products 21:
- Fish, meat, pork, and certain game animals must be cooked at ≥63°C for 15 sec - Ratites, injected meats, and comminuted fish/meat/certain game animals must be
heated ≥68°C for 15 sec or 3 min at 63°C, 1 min at 66°C or 1 sec at 70°C - Poultry, certain wild game animals, stuffing containing meat, fish, poultry or
ratites, and stuffed meat/poultry/fish/ratites must be cooked at ≥74°C for 15 sec - Cooked beef, roast beef, and cooked corned beef products must be cooked to
time/temperature combinations ranging from 112 min at 54.4°C to 1 sec at 70°C - Microwave cooking raw animal foods must ascertain a temperature of at least
74°C in all parts of the product - Fruit and vegetables must be cooked to a temperature of 60°C
These processes should ensure a 4-log units reduction for Listeria monocytogenes 312, a 6.5-7-log unit reduction for Salmonella 307 or a 12-log reduction of Enterococcus faecalis 281.
After heating, the product must either be held above 60°C or be cooled down to 4-7°C as soon as possible (but within 5 h) or be consumed directly according to Dutch law 21. Cooled products must be reheated to 60°C before use. American law is somewhat different: foods shall be maintained at temperature ≥60°C or ≥54°C for roast beef, cooked beef or cooked corned beef; products should be cooled from 60°C to 7°C or 5°C within 6 h, requiring to reach 21°C within 2 h; products should be reheated to 74°C for 15 sec 308. Accurate hot holding of food is of great importance, since temperature profiles in bulky food products may result in local temperatures that still support microbial growth 109. Probabilistic analysis of C. perfringens growth during foodservice operations shows that proper hot holding will strongly reduce food poisoning outbreaks caused by this pathogen 108. The same model shows that growth during chilling is more likely to occur than growth during hot holding, although cell numbers will not reach dangerous levels as easily as during hot
Table 7. Temperatures in different types of refrigerators measured at different places Apparatus Percentage >10°C Reference
Major stores dairy cases 7 251
Independent stores dairy cases 17 251
Family owned stores dairy cases 26 251
Convenience stores dairy cases 23 251
Supermarket fresh meat 4 83
Delicatessen displays 26 83
Home refrigerators 0 251
Home refrigerators 21 312
Chapter 1
22
holding. Many products are pasteurized nowadays, since sterilization reduces product
qualities, such as appearance, structure, and vitamin content. Although pasteurization does not fully eliminate microorganisms present, stable shelf life has to be guarantied. Preservatives are used to prevent microbial growth during further processing and storage. Nisin and lysozyme are natural preservatives. Lysozyme is a component in eggs and other foods of animal origin and inhibits growth of food pathogens including Listeria monocytogenes, Clostridium thermosaccharolyticum, Clostridium tyrobutyricum, and some Clostridium botulinum strains, but C. perfringens is resistant to concentrations up to 200 mg/ml 165. Nisin is ineffective against this pathogen as well; cells remain viable despite the great K+ losses caused by nisin 134. Growth of C. perfringens can be prevented by other preservatives, such as sodium nitrite, salt, and by pH and competitive (spoilage) populations 114. Sodium nitrite is not very effective against growth of C. perfringens, but does inhibit outgrowth of spores 127,200. Growth of this pathogen is inhibited at concentrations of 400-500 µg sodium nitrite/ml 127, while the maximum allowable level in foods of sodium nitrite is 120 µg/g. These allowable levels do prevent outgrowth of heat-injured spores. The effectiveness of nitrite is increased in combination with other salts and curing agents, such as sodium chloride 257 and sorbic acid 255 and by low pH
199,200,254,284, heat 127,254, and inoculum size 254. Salts that are commonly used in foods to lower the aw are chloride and sulfate
salts of sodium and potassium. These salts decrease specific growth rates and cell death occurs at sufficiently high concentrations. Effectiveness of the salts is dependent on the type of anion and cation used: potassium salts are more effective than sodium salts, whereas sulfate salts are more effective than chloride salts 42,135. This is demonstrated by the effect of sodium chloride and potassium sulfate on growth on C. perfringens: levels of up to 6-7% sodium chloride (1-1.2 M 226) still support growth, while 125 mM potassium sulfate completely inhibits growth 135. Sodium hypophosphite also serves as a preservative against C. perfringens 252. Sodium pyrophosphate is a cost effective preservative, since it reduces cooking times of meat 183. Spoilage of food by C. perfringens can be prevented by a mixture of sucrose laurate (SL; a GRAS food additive that functions as a stabilizer and emulsifier), ethylenediaminetetraacetate (E; a chelating agent), and butylated hydroxyl anisole (B; a phenolic antioxidant), called SLEB 276. SLEB effectively inhibits germination of spores and vegetative growth of C. perfringens. Another way to inhibit growth of C. perfringens in foods is to use other microorganisms. Lactobacillus acidophilus 123, Lactobacillus salivarius subs. salivarius 244, Lactococcus diacetilactis 82, and Enterococcus faecalis 292 inhibit growth of C. perfringens. Commercial probiotic products are introduced on the market that claim to inhibit growth of C. perfringens: NaturaFlora® (humans, contains Bacillus coagulans subs. Hammer; Natura Health Products, Middx, UK), and Provita Protect (calves, contains Lactobacillus acidophilus and Enterococcus faecium; Provita Eurotech Ltd., Omagh, Northern Ireland).

General introduction
23
Various edible and non-edible plants inhibit growth of C. perfringens. Extracts of Allium sativum (garlic), Capsicum annuum (Chile peppers), Lycopersicon esculentum (tomato), L. esculentum var. cerasiforme (cherry tomato), and Zingiber officinale (ginger) prevent growth of C. perfringens 191. Extracts of Curcuma longa (turmeric) roots, Eucommia ulmoides (hardy rubber tree) leafs, Pulsatilla cernua (anemone), and Simonmenium acutum (Chinese moonseed) roots also suppress growth of C. perfringens 207. Extracts of medicinal plants such as Astragalus membranaceus roots, Cassia obtusifolia (sicklepod) seeds, Cinnamomum cassia (cinnamon) stems, Coptis japonica (Japanese goldthread) roots, Corydalis turschaninvii roots, and Rhus chinensis galls strongly inhibited growth of C. perfringens 160. No in vivo studies in food or humans have been conducted with these products, but these extracts may serve as preservatives or health beneficial products. A preservation method, which is not generally accepted to be safe by consumers, is irradiation. Food can be preserved by an ionizing radiation dose from, for example, 60Co and 137Cs or by electron energies up to 10 million electron volts or by X-rays up to 5 million electron volts 71,235. Some European countries apply irradiation to certain types of food (Belgium, France, Italy, The Netherlands, and the United Kingdom), while others banned this procedure (Germany and Sweden) 20,175. However, since 20 September 2000 food irradiation directives became applicable for dried aromatic herbs, spices and seasonings. Since irradiation is not meant to replace good hygienic practices, only foods that impose health risks on consumers that cannot be treated otherwise to reduce bacterial counts may be approved to be irradiated in the future 20. Such foods are, for example:
- Deep-frozen aromatic herbs, dried fruit, cereal flakes and germs, which are used in compound foodstuffs, such as milk-based products that are not heated during processing
- Offal of chicken, egg white and gum arabic (additive) - Frog legs and peeled shrimps
Foods that may not be irradiated according to this argumentation are fresh fruits and vegetables, cereals, starchy tubers (potatoes), fish, camembert from raw milk, casein, rice flour, red meat, poultry meat and blood products. Products that may be irradiated in The Netherlands are legumes (1 kGy)a, dried vegetables and fruits (1 kGy), flakes from cereals (1 kGy), gum arabic (3 kGy), chicken meat (7 kGy), frozen frog legs (5 kGy), shrimps (3 kGy), and egg white (3 kGy). Irradiated poultry is allowed in France and Italy. France allows irradiation of poultry (5 kGy), mechanically recovered chicken meat (5 kGy), and chicken offal (5 kGy), while Italy allows irradiation of poultry (domestic fowls, geese, ducks, guinea fowls, pigeons, quails, and turkey; 7 kGy). Irradiation is more widely used in the USA: dehydrated aromatic vegetable substances (30 kGy), fresh or frozen, uncooked poultry [(parts of) carcasses, mechanically recovered chicken meat; 3 kGy], frozen packaged meats for NASA program use only (≥44 kGy), certain refrigerated or frozen uncooked meat products (≤4.5 kGy for refrigerated products and ≤7 kGy for frozen products), control
a Authorized at the given maximum dose

Chapter 1
24
of Salmonella in fresh eggs (≤3 kGy), control of microbial pathogens on seeds for sprouting (≤8 kGy) 71. Irradiation resistance of microorganisms depends on temperature and medium used. D-values of C. perfringens vegetative cells in different foodstuffs range from 0.342 kGy to 0.826 kGy at different temperatures and media 235. International health and safety authorities endorsed the safety of irradiation for all foods up to a dose level of 10 kGy, thus allowing a maximal reduction of 12-29 log cycles of C. perfringens.
Antibiotics are not suitable as C. perfringens anti-food poisoning drugs, since this disease is self-limiting. However, in elderly this disease can be fatal and treatment with metronidazole (400 µg three times per day for 10 days) is effective in stopping of diarrhea 264. Other diseases caused by C. perfringens may be treated by β-lactam antibiotics (penicillin-G, ampicillin, cephaloridine, cephalothin) 196. Gas gangrene caused by C. perfringens is treated with penicillin G, preferably in a mixture with aminoglycosides, penicillinase-resistant penicillins, or vancomycin 249. Other antibiotics that may be used to cure gas gangrene are chloramphenicol, clindamycin, cephalosporin, and aminoglycoside 300. CONCLUSION
C. perfringens is a ubiquitous spore forming pathogen that grows rapidly at high temperatures and causes, among other diseases, food poisoning in man. Heat-treated foods containing meat are the common vehicle for food borne outbreaks caused by this microorganism. Cooking of foods kills vegetative cells, but serves as a heat-activation step for spores. During inadequate cooling of foods or during improper hot holding spores can germinate and rapidly grow to high numbers. Ingestion of these high cell numbers will allow enough cells to pass the stomach and sporulate in the small intestines meanwhile releasing the enterotoxin that causes the food poisoning symptoms. C. perfringens is notorious for the large outbreaks it causes. This is probably due to the bulky food processes that are involved in these outbreaks, since these bulky types of food are difficult to cool down, keep heated or reheat properly. Although other ways of reducing cell numbers and inhibiting growth of C. perfringens are known, proper cooling and hot holding remain the most important ways to prevent gastroenteritis caused by C. perfringens.
OUTLINE OF THIS THESIS
C. perfringens is one of the “Big Five” (expressed in cases of food poisoning caused per year in western countries) next to Bacillus cereus, Campylobacter Salmonella, and Staphylococcus aureus. Due to the mild symptoms it causes data on C. perfringens food borne disease outbreaks are underestimated. This is probably also the reason for the fact that research dealing with this pathogen is limited. Data published mainly focus on a handful of strains that are easily culturable. For research

General introduction
25
purposes, the availability of a spore stock is desirable, since it standardizes experiments. C. perfringens is known to sporulate poorly in vitro and those strains that sporulate readily are used in literature. However, these readily sporulating strains are not necessarily a representation of the species C. perfringens. To obtain a more general view on this pathogen, sporulation of many C. perfringens strains was studied (Chapter 2).
Literature also shows that quite some agar media are available for enumerating and isolating C. perfringens from food. Ample research has been conducted comparing these media. However, newly developed media were mostly tested against poor or mediocre media. Since different countries prescribe different enumeration methods and comparison of published data is essential, several agar media were tested for their quantitative recovery of C. perfringens strains (Chapter 3). C. perfringens mainly causes problems in temperature-abused foodstuffs. Literature study shows that the cooling process is one of the main critical steps in a production process. Data from the Dutch Inspectorate for Health Protection and Veterinary Public Health show that soups most frequently contain high cell numbers of C. perfringens compared to other foods. Detailed study of these data revealed that Dutch pea soup, a viscous soup containing meat and vegetables, was the soup most frequently contaminated with high cell numbers of C. perfringens. Therefore, the effect of different cooling procedures on vegetative cells en spores in Dutch pea soup was studied (Chapter 4).
After cooling, a product is kept in a refrigerator with a preferable temperature of 3-7°C. However, different studies show discrepancies in these temperatures even up to 15°C. Mathematically modeling growth of C. perfringens shows that the minimal growth temperature of this microorganism is 10.1°C, with a 95% confidence interval of 6.2-16.5°C. The behavior of C. perfringens spores and vegetative cells was studied at different temperatures as well as the possibility of this microorganism to adapt to low temperatures and the effect of this adaptation on growth characteristics (Chapter 5).
Products are cooled in different ways: with or without stirring, in ice water, in a freezer or refrigerator. To predict growth of C. perfringens during cooling a model was designed that predicted growth of this pathogen. Another model was designed to mimic a cooling pan of pea soup and to predict the effect of stirring, product volume, and different cooling environments on the cooling rate of pea soup. This temperature model of a cooling pea was coupled to the growth model of C. perfringens, which enabled us to predict growth levels of this pathogen in cooling pea soup and the effect of stirring, product volume and various cooling environments on growth (Chapter 6).
The thesis is concluded with a general discussion and concluding remarks. (Chapter 7).

26
Spores & Cells, Media & Modeling

2 OPTIMIZING SPORULATION OF CLOSTRIDIUM
PERFRINGENS Many sporulation media have been developed for Clostridium perfringens, but none stimulates
sporulation for all strains. The aim of our experiments was to develop a sporulation method using
Duncan and Strong (DS) medium, which supports sporulation of a wide variety of strains. Different
inoculation levels were tested and the effects of sporulation�promoting substances and acid shock
were evaluated. Furthermore, DS medium was compared with other sporulation media. Highest
spore numbers in DS were obtained with a 10% 24�hour Fluid Thioglycollate broth inoculum
(5.0×10⁵ spores/ml). Addition of theophylline and replacement of starch by raffinose increased
spore yields for some strains, but most strains were not affected (average cell increase in log
N/ml of 0.2 and 0.3, respectively). One strain was enhanced by the addition of bile, but other
strains were strongly inhibited (average cell number decrease of 2.5 log N/ml); agar did not
influence sporulation. Neither short�time acid exposure nor addition of culture supernatant fluids of
well sporulating strains did result in higher spore numbers in DS medium. None of the tested
methods enhanced sporulation in general, only strain dependent effects were obtained. Highest
average spore yields were obtained in Peptone�Bile�Theophylline medium with or without starch
(PBT or PBTS; 1.0×10⁵ spores/ml), but some strains failed to sporulate in PBTS. In conclusion,
adding theophylline in DS medium may optimize sporulation of C. perfringens, but PBT(S) medium
is most suitable.
Published as A.E.I. de Jong, R.R. Beumer and F.M. Rombouts. 2002. Optimizing sporulation of Clostridium perfringens. Journal of Food Protection. 65: 1457-1462
Chapter 2
28
INTRODUCTION
Clostridium perfringens is nature’s most wide spread pathogen and causes food poisoning and gas gangrene in man 66. Food poisoning is caused by the enterotoxin produced by this organism, which is released during sporulation in the intestines.
Research primarily focuses on sporulation media, growth characteristics, and the production and characterization of the enterotoxin, but spore characteristics have hardly been studied. To obtain a more general view on these characteristics, poorly sporulating strains should be taken into account as well, although high spore numbers are required for research. Many sporulation media have been developed, such as AEA 293, New-Sporulation-Medium (NSM) 232, Peptone-Bile-Theophylline-medium (PBT), Peptone-Bile-Theophylline-Starch medium (PBTS) 310, SEC 35, Duncan and Strong medium (DS) 91, Ellner’s 101, Kim’s 190, and Tórtora’s medium 301. Of these media DS and Ellner’s medium perform best, but the former is used more widely. Although these media are especially designed to support sporulation of strains isolated from foods and stools of patients involved in food poisoning, many strains of C. perfringens still sporulate poorly under laboratory conditions. Several methods have been used to optimize sporulation of C. perfringens, such as replacement of starch by raffinose in DS medium and raising the pH of this medium from 7.2 to 7.8
145,203; both methods improve spore yields for some, but not all strains. A short acid exposure and addition of bile salts may favor sporulation as well 155,157,309,330. The latter two methods mimic conditions faced by C. perfringens during gastrointestinal-tract (GI-tract) passage, when this pathogen sporulates readily. Culture fluids of both sporulating and vegetative cells may contain a sporulation-promoting compound, a sporulation-factor (SF), which increases spore numbers of poorly sporulating strains
305. In this study we aimed to find the most optimal method, based on results from a
broad spectrum of strains, to obtain spores of both well and poorly sporulating strains of C. perfringens. DS medium was tested using different inoculation levels. The effect of sporulation-promoting substances such as agar, bile, theophylline, raffinose, and SF was evaluated, and the effect of an acid shock was investigated. Some of these methods were combined. Furthermore, DS medium was compared with other sporulation media, thus resulting in a general conclusion regarding sporulation media of C. perfringens.
MATERIALS AND METHODS
Strains Clostridium perfringens strains 82043, 82044, 82049, 82051, 82100, WU88105, WU90103, WU90107, WU90108, WU90109, WU9010, WU90111, and WU97114 were all isolated from foods by the Dutch Inspectorate for Health Protection and Veterinary Public Health. Strains ATCC 13124 and NCTC 10239 were also obtained

Optimizing sporulation
29
from the Dutch Inspectorate for Health Protection and Veterinary Public Health. Strains WU9910 and D10 (isolated from food involved in an outbreak), were obtained from the National Institute of Public Health and the Environment (Bilthoven, The Netherlands). Strains ATCC 3624 and ATCC 12916 were acquired from the State Institute for Quality Control of Agricultural Products (RIKILT, Wageningen, The Netherlands) and strain NCTC 8798 was kindly supplied by G. Daube (University of Liège, Liège, Belgium). Strain WU99118 was isolated from basil in our laboratory.
Inoculum Stocks of vegetative cells, grown overnight in Fluid Thioglycollate medium (FTG; Oxoid, Basingstoke, England) medium, were stored at –80°C in 20% glycerol (v/v). Inocula were prepared from stock cultures by inoculating 10 ml FTG tubes (24 h) and subsequently streak plating on Tryptose-Sulphite-Cycloserine agar (TSC; Merck, Darmstadt, Germany) without egg yolk and cycloserine. Plates were incubated anaerobically (24 h). One separate colony was used to inoculate a preculture in FTG, which was incubated (24 h) and subsequently used to inoculate the sporulation media.
FTG was freshly steamed before use and no further effort was taken to obtain anaerobic conditions. All incubations were at 37°C and anaerobic incubations were made using the Anoxomat system (jars flushed with an 80% N2, 10% CO2 and 10% H2 gas mixture plus catalyst; Mart, Lichtenvoorde, The Netherlands).
Sporulation media The sporulation medium described by Duncan and Strong was routinely used to obtain spores 91. DS medium was modified by replacing starch with raffinose (0.4% w/v; m-DS) or by adding agar (0.05% w/v, agar No. 1, Oxoid) before autoclaving 203. Theophylline (0.005% or 0.05% w/v, Sigma, Steinheim, Germany; DS-th) or bile (0.5% w/v, Sigma) was added aseptically to autoclaved DS medium using heat sterilized stock solutions. Other sporulation media used were NSM as described by Meyer and Tholozan and PBT(S) as described by Ushijima et al. 232,310. Different inocula levels were used for different sporulation media; these levels were as follows: DS (10%, unless stated otherwise), DS-th (10%), m-DS (10%), PBT(S) (5%), and NSM (2%). All media were freshly steamed before use. No further effort was taken to obtain anaerobic conditions for incubation of sporulating cultures, except for NSM.
Spore counts 1 ml or 0.1 ml samples were drawn from sporulating cultures after 18-22 h of incubation and diluted in 9 ml or 9.9 ml, respectively, of a reduced saline solution [RSS; 0.8% (w/v) NaCl and 0.05% (w/v) cysteine-HCl (Sigma)]. These diluted samples were heat treated for 20 min at 70°C in a water bath (Julabo MV-4 thermostat, Julabo Labortechnik GmbH, Seelbach, Germany) and immediately

Chapter 2
30
cooled in ice water. Serial dilutions were made in RSS and pour plated in TSC without egg yolk and cycloserine and with an overlayer of the same medium. Plates were anaerobically incubated overnight. Acid treatment FTG precultures of strains D10, 82043, NCTC 10239, WU9910, WU97114, and WU99118 were acid treated with HCl (pH 2, 30 min) as described by Wrigley et al. 330, then neutralized with NaOH and subsequently used to inoculate the following sporulation media: DS, m-DS, DS-th (0.05% theophylline), PBT, and PBTS.
Acid treatment lowers the amount of viable cells in the inoculum, which may influence spore yields. A diluted non-acid treated inoculum was used to test the effect of lower inoculum cell numbers on spore counts in DS medium.
Sporulation factor Precultures of strains 82049 and 82100 were inoculated (2% inoculum) in defined sporulation (D) medium except that the dextrin concentration was increased to 0.9% and in Trypticase-Yeast Extract (TYE) medium consisting of 1.5% Trypticase (BBL, Sparks, MD, USA) and 1% yeast extract 263,305. After incubation (8 h), cells were removed by centrifugation (16,300 × g; 15 min). The culture supernatant fluid (CSF) was lyophilized, subsequently dissolved in distilled water to obtain a 40-fold concentration, and then filter sterilized using a 0.45 µm filter and stored at 4°C. No protease inhibitor was added to the CSF, since Tseng and Labbe 305 show that proteases do not affect SF activity. Sporulation promoting ability of the CSF (50 µl CSF concentrate per 10 ml of medium) was tested for nine strains in DS and DS-th (0.05% theophylline) medium.
Statistical analysis Data were analyzed using the Tukey-test.
Figure 1. Time course of sporulation by three Clostridium perfringens strains. Symbols: �: strain 82100; �: strain NCTC 10239; �: strain WU97114. Open and closed symbols represent repetitive experiments

Optimizing sporulation
31
RESULTS Inoculum ratio Spore counts were followed in DS medium during a 27-h period to test if spore numbers changed during the time interval of sampling (18-22 h; Figure 1). Duplicate experiments were conducted at the same time, with the same batch of media, but with an inoculum from a different colony from the same TSC streak plate. From Figure 1 can be concluded that spore numbers did not change very much upon prolonged incubation and that strain WU97114 failed to form spores above the detection limit (10 spores/ml) in one of the two runs. Furthermore, strain WU97114 sporulated poorly and irregularly in DS medium throughout all experiments (Table 1); detectable spore numbers were produced in only 50% of the cases, while most strains produced detectible spore numbers in 70-100% of the experiments.
Five inoculation ratios (inoculum : DS medium, v/v) were tested (1:1, 1:2, 1:3.5, 1:5, and 1:9) for eight strains of C. perfringens. Results are partly shown in Figure 2; average values of the 1:2 and 1:3.5 inocula were 5.3 and 5.0 log spores/ml respectively. Spore numbers ranged from less than 100 spores/ml to 3.4×10⁷ spores/ml. Data as show n in Figure 2 are averages of at least three experiments. Values below the detection limit were excluded from the calculations. Standard deviations were calculated for series in which more than one experiment resulted in spore numbers above the detection limit. The 1:9 inoculum ratio yielded highest average spore numbers for most strains.
Sporulation media Twenty C. perfringens strains were used to test the sporulation supporting abilities of six sporulation media: DS, m-DS, DS-th, NSM, PBT, and PBTS (Table 1). Data
Figure 2. Sporulation of eight Clostridium perfringens strains in Duncan and Strong medium using varying inoculation ratios. Values are averages of three or more experiments. Values below the detection limit (1.0×10² spores/ml) were excluded causing some strains to have only one data point (*)
*
*
*
*
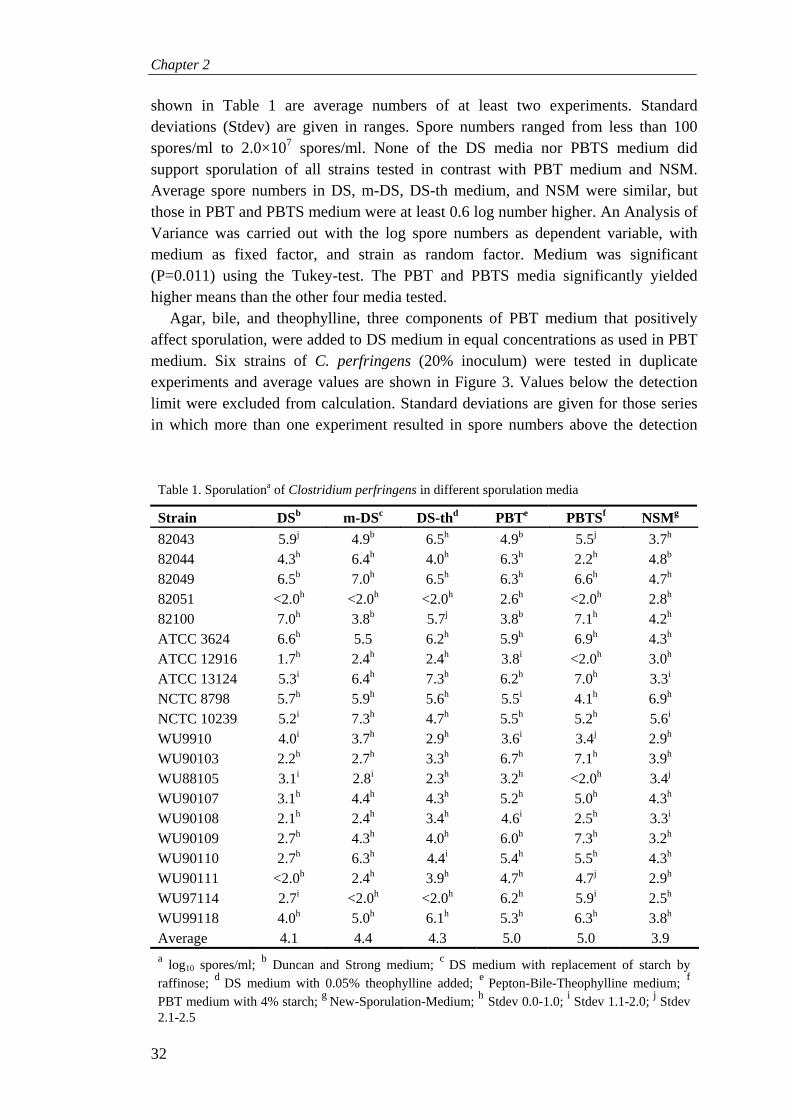
Chapter 2
32
shown in Table 1 are average numbers of at least two experiments. Standard deviations (Stdev) are given in ranges. Spore numbers ranged from less than 100 spores/ml to 2.0×10⁷ spores/ml. None of the DS media nor PBTS medium did support sporulation of all strains tested in contrast with PBT medium and NSM. Average spore numbers in DS, m-DS, DS-th medium, and NSM were similar, but those in PBT and PBTS medium were at least 0.6 log number higher. An Analysis of Variance was carried out with the log spore numbers as dependent variable, with medium as fixed factor, and strain as random factor. Medium was significant (P=0.011) using the Tukey-test. The PBT and PBTS media significantly yielded higher means than the other four media tested.
Agar, bile, and theophylline, three components of PBT medium that positively affect sporulation, were added to DS medium in equal concentrations as used in PBT medium. Six strains of C. perfringens (20% inoculum) were tested in duplicate experiments and average values are shown in Figure 3. Values below the detection limit were excluded from calculation. Standard deviations are given for those series in which more than one experiment resulted in spore numbers above the detection
Table 1. Sporulationa of Clostridium perfringens in different sporulation media
Strain DSb m-DSc DS-thd PBTe PBTSf NSMg
82043 5.9j 4.9b 6.5h 4.9b 5.5j 3.7h 82044 4.3h 6.4h 4.0h 6.3h 2.2h 4.8b 82049 6.5b 7.0h 6.5h 6.3h 6.6h 4.7h 82051 <2.0h <2.0h <2.0h 2.6h <2.0h 2.8h 82100 7.0h 3.8b 5.7j 3.8b 7.1h 4.2h ATCC 3624 6.6h 5.5 6.2h 5.9h 6.9h 4.3h ATCC 12916 1.7h 2.4h 2.4h 3.8i <2.0h 3.0h ATCC 13124 5.3i 6.4h 7.3h 6.2h 7.0h 3.3i NCTC 8798 5.7h 5.9h 5.6h 5.5i 4.1h 6.9h NCTC 10239 5.2i 7.3h 4.7h 5.5h 5.2h 5.6i WU9910 4.0i 3.7h 2.9h 3.6i 3.4j 2.9h WU90103 2.2h 2.7h 3.3h 6.7h 7.1h 3.9h WU88105 3.1i 2.8i 2.3h 3.2h <2.0h 3.4j WU90107 3.1h 4.4h 4.3h 5.2h 5.0h 4.3h WU90108 2.1h 2.4h 3.4h 4.6i 2.5h 3.3i WU90109 2.7h 4.3h 4.0h 6.0h 7.3h 3.2h WU90110 2.7h 6.3h 4.4i 5.4h 5.5h 4.3h WU90111 <2.0h 2.4h 3.9h 4.7h 4.7j 2.9h WU97114 2.7i <2.0h <2.0h 6.2h 5.9i 2.5h WU99118 4.0h 5.0h 6.1h 5.3h 6.3h 3.8h Average 4.1 4.4 4.3 5.0 5.0 3.9
a log10 spores/ml; b Duncan and Strong medium; c DS medium with replacement of starch by raffinose; d DS medium with 0.05% theophylline added; e Pepton-Bile-Theophylline medium; f PBT medium with 4% starch; g New-Sporulation-Medium; h Stdev 0.0-1.0; i Stdev 1.1-2.0; j Stdev 2.1-2.5

Optimizing sporulation
33
limit. Agar did not affect spore numbers, while bile strongly inhibited sporulation of most strains. However, strain WU97114 produced significantly higher spore levels (P=0.0104) in the presence of bile (see also Table 1 DS versus PBT(S) medium). Theophylline hardly influenced sporulation on average, but drastically increased spore counts for strain WU99118 (2.1 log units).
Acid treatment Sporulation of C. perfringens may be influenced by conditions in the GI-tract, such as acid exposure. To study the effect of acid on sporulation, FTG precultures of six C. perfringens strains were exposed to pH 2 for 30 minutes and subsequently inoculated in five different sporulation media (Figure 4). Standard deviations for most strain/media combinations varied between 0.0-1.2, but strain 82043 performed irregularly with standard deviations between 0.9-2.8. Acid treatment did not significantly increase average spore numbers compared to controls in any of the media tested. Only for strain NCTC 10239 did spore numbers of acid treated cells surpass (≥1 log unit) those of non-treated cells. Acid treatment did, however, affect cell numbers in the FTG inocula (Table 2). Most strains tested, showed at least one log reduction in viable cell numbers, while most spore numbers equaled or exceeded those of the control. To test the effect of these lowered cell numbers on spore yields, diluted non-acid treated precultures were used to inoculate DS medium. Comparison of spore/cell ratios showed that low inocula levels produced relatively more spores than control or acid treated cells did (averaged ratios for control, acid treated, and diluted cells were 68%, 80%, and 110% respectively).
Figure 3. Sporulation of six Clostridium perfringens strains in Duncan and Strong medium (20% inoculum) with agar (0.05% w/v) bile (0.5% w/v) or theophylline (0.005% w/v) added. Values are averages of two experiments. Values below the detection limit (1.0×10² spores/ml) were excluded causing some strains to have only one data point (*)
Figure 4. Average sporulation of six Clostridium perfringens strains (duplicate experiments) in five different sporulation media: Duncan and Strong medium (DS) DS, m-DS (replacement of starch by raffinose), DS-th (0.05% theophylline added), Pepton-Bile-Theophylline (PBT), and PBTS (PBT with 4% starch) medium
*
*
*
**
**
*
*

Chapter 2
34
Sporulation factor Nine strains of C. perfringens were used to test sporulation-promoting abilities of four different CSF’s in DS and DS-th medium. CSF was obtained from two well sporulating strains, 82049 and 82100, that were grown in D medium and in TYE medium, which only supports vegetative cell growth 305. In Table 3 the effect of CSF’s on spore numbers is shown. Values are averages of spore numbers of nine strains from duplicate experiments. Standard deviations were generally <1, except for strain WU90105 in DS-th (Stdev 1.6-2.9). None of the CSF’s tested showed a stimulating effect on spore numbers, with some exceptions for individual strains. Spore numbers in DS medium were increased compared to the control (>1 log unit) for strain WU90108 by 82049TYE CSF. In DS-th medium strains WU90105 and NCTC10239 yielded higher spore numbers with 82049D CSF and 82100D CSF.
DISCUSSION In this study several aspects, which affect spore numbers of C. perfringens, were studied. These aspects included the inoculation ratio, the influence of different sporulation media, acid treatment, and the effect of a sporulation factor. The inoculation level affected the spore numbers: the lower the amount of inoculated cells, the higher the amount of spores (Table 1). This effect leveled off, since low cell inocula (2.6-3.5 log cells/ml) resulted in comparable spore numbers as with our standard inoculum level (7.0-7.6 log N/ml; Table 2). Spore numbers in media with 50% inoculum were strongly reduced compared to those medium with 10% inoculum, which may be caused by carry over of inhibiting substances to the sporulation medium, such as glucose or (acid) end-products from glucose fermentation 240. In our study, these acid end products are likely to have caused the low spore yields, since the pH of an overnight FTG preculture is about 5.0 compared to 7.1 of fresh FTG (data not shown). Furthermore, Hikey and Johnson 157 showed
Table 2. Numbera of viable cells for six Clostridium perfringens strains in acid treated and non-acid treated inocula and in a diluted inoculum and their corresponding spore numbers in DSb medium
Strain Inoculum Sporesc
Controld Acide Dilutedf Control Acid Diluted
D10 8.8 7.4 NDg 7.5 7.5 ND 82043 8.4 6.9 3.6 6.3 6.7 5.8 NCTC 10239 8.3 6.1 3.8 4.6 5.6 3.9 WU9910 8.5 7.5 4.5 7.4 7.5 7.2 WU97114 8.0 6.8 3.8 3.9 3.3 <2.0 WU99118 8.6 8.1 4.4 4.9 3.6 3.3
a Average of duplicate experiments in log N/ml; b Duncan and Strong medium; c Spores formed in DS medium; d Non-treated Fluid Thioglycollate preculture; e Acid treated (HCl; pH 2, 30 min) preculture neutralized with NaCl; f Diluted preculture; g Not detected

Optimizing sporulation
35
that glucose levels up to 20 mM did not affect spore numbers in Riha-Solberg medium. An overnight FTG inoculum will transfer only very low glucose concentrations to the sporulation medium, since a 4-h culture in FTG contains approximately 8 mM of glucose 157.
Some of our strains sporulated unpredictably. It is a known phenomenon of C. perfringens that it sporulates irregularly 92,190,262,263, which may be caused by recycling of spores, thus lowering spore numbers in time: a commonly observed feature of this organism 263. Therefore spore numbers were followed over time (Figure 1). During our period of sampling (18-22 h), no change in spore numbers was observed, excluding spore recycling to cause the unpredictable sporulation behavior. Strain WU97114 did not sporulate in one of the two repetitive trials and performed irregularly during all our experiments. Since preculture conditions were identical in the two trials, the different sporulation results could not be caused by this factor, which is known to affect sporulation.
C. perfringens appears to sporulate readily in vivo, but is a notorious poor sporulator in vitro. Many sporulation media have been developed to improve sporulation, but none can be used successfully for all strains. Clostridia require a complex sporulation medium including amino acids, minerals, and a carbon and (slowly fermentable) energy source. Strains differ in their preference for energy sources, which is reflected in the composition of sporulation broths (Table 4) and in our results (Table 1). Some strains sporulated poorly in the presence of starch, while with others sporulation was promoted. Replacement of starch by raffinose in DS medium increased spore numbers with 1 to 3.8 log units for some strains, but decreased spore yields with more than 1 log unit for others, while for most strains no change in spore numbers occurred (Table 1). Harmon and Kautter 145 observed that strains that cannot ferment starch sporulate poorly in starch-containing media, while those that do, grow rapidly and sporulate hardly. Replacing starch with raffinose may yield better results, but higher spore numbers are not necessarily obtained 177,203,293. NSM yielded spores for every strain tested, but in low numbers. According to its composers, 100% sporulation should be routinely achieved in this medium, but only high spore yields were obtained with their test-strain NCTC 8798. PBT(S) media yielded highest spore numbers in 60% of the cases, 35% produced higher spore numbers in DS based media. Since PBT medium supported sporulation of all strains tested, this medium would be a better alternative to DS medium to test spore forming and enterotoxin production of strains isolated from suspected food specimens of
Table 3. Average spore numbersa for nine Clostridium perfringens strains in DSb and DS-thc medium with four different culture supernatant fluids (CSF) added
CSFd control 82049 De 82100 D 82049 TYEf 82100 TYE
DS 3.4 2.6 3.0 3.4 3.2 DS-th 4.2 4.1 4.3 4.1 4.2
a Average of duplicate experiments in log10 spores/ml; b Duncan and Strong medium; c DS medium with 0.05% theophylline added; d Culture supernatant fluid ; e Cells grown in defined medium for sporulation; f Cells grown in Trypticase-Yeast Extract medium for vegetative growth

Chapter 2
36
patients involved in food poisoning outbreaks. To optimize sporulation in DS medium agar, bile, and theophylline, components
of PBT medium that increase spore yields, were added. Both agar and theophylline did not significantly (P=0.97 and P=0.8, respectively) increase sporulation; theophylline, a major degradation product of caffeine, only augmented spore numbers for strain WU99118 (1.7 log units; Figure 4). Using a higher concentration of theophylline (500 µg/ml, Table 1) as recommended by Sacks and Thompson 262 did not show a significant effect either, although for nine strains spore yields were increased (>1 log unit) compared to the control. It should be noted that theophylline reduces cell clumping, thereby facilitating spore harvesting 177,262.
Bile and pH stress are conditions to which C. perfringens is exposed after being ingested with food. During digestion, cells are exposed to low pH (1.5) for 2-3 hs after which the acidic chyme is neutralized (pH 7.0) by bile when entering the duodenum. Both bile and pH stress have been simulated in our experiments to study their effect on sporulation of C. perfringens. Addition of bile to DS medium resulted in a large decrease of average spore numbers (Figure 4), although bile stimulated sporulation in PBT medium 310. In literature, divergent results have been obtained with different bile salts in varying media. Sodium taurocholate, for instance, is reported to stimulate sporulation at concentrations of 4 mg/ml in PBT 309, while in D medium only 0.5 mg/ml was stimulatory 155. Sodium cholate, with deoxycholate one of the main constituents of bile, stimulated sporulation in a strain dependent way
157,309 and increased spore numbers with increasing concentrations (up to 2.0 mg/ml)
155. Opposite effects were obtained for other bile salts (sodium salts of taurocholate, chenodeoxycholate, and glycochenodeoxycholate): the lower the concentration, the higher the stimulatory effect 155,157.
A short-time exposure (30 minutes) to pH 2 did not increase spore numbers compared to the control, except for strain NCTC 10239. For this strain similar results
Table 4. Energy sources in some sporulation media
Medium Energy source Reference
Noyes veal broth glucose 35
Ting-Fung’s glucose 297
NSM glucose 232
D-medium glucose and dextrin 263
AGA glycerol 294
m-DS raffinose 203
m-AEA raffinose 145
AEA starch 293
DS starch 91
Kim’s starch 190
PBTS starch 310
Tórtora’s starch 301
PBT none 301

Optimizing sporulation
37
were obtained by Wrigley et al. (ATCC 14809) 330. Acid treatment lowered the amount of viable cells in the inoculum (Table 4), but spore numbers often equaled those of non-treated cells. This relative enhancement may have been caused by the lower number of cells inoculated, which was confirmed using low cell inocula. These inocula showed highest cell/spore ratios compared to the control and acid treated cells. Acid exposure per se did not enhance sporulation, but cells did survive acid treatment and retained the ability to form spores. Even more severely acid treated cells (pH 2, 90 min) or more acid-sensitive cells still produce spores and enterotoxin, thus retaining the ability to cause food poisoning symptoms after stomach passage
111,330. Sporulation has been thought to occur in the absence of any intercellular
communication, but recent evidence indicates that cell-to-cell signaling occurs in both Gram-negative and Gram-positive bacteria 205. We tested the CSF of two well sporulating strains of C. perfringens on poorly sporulating strains of this microorganism, but could not detect an effect of any of the CSF’s unlike Shih and Labbe 273. They demonstrated the presence of a sporulation factor in CSF of sporulating and vegetative cultures of both enterotoxin-negative and -positive strains of C. perfringens.
In conclusion, the results presented here from a broad spectrum of strains indicate that enhancement of sporulation of C. perfringens by sporulation promoting compounds and methods is highly strain dependent. In DS medium, a 10% inoculum yielded highest spore numbers, while addition of agar, bile, theophylline or SF had no effect. Nor had replacement of starch with raffinose or pH stress any effect. Addition of theophylline to DS medium may be useful. Sporulation on average was not increased, but methylxanthines, such theophylline, partially avoid cell clumping, which facilitates spore harvesting. Average sporulation was higher using PBT(S) medium than in DS medium (5.0 log N/ml versus 4.1 log N/ml).

38
Spores & Cells, Media & Modeling

3 COMPARISON OF MEDIA FOR ENUMERATION OF
CLOSTRIDIUM PERFRINGENS FROM FOODS
Many media have been developed to enumerate Clostridium perfringens from foods. In this study,
six media [Iron�Sulphite agar (IS), Tryptose�Sulphite�Cycloserine agar (TSC), Shahidi�Ferguson�
Perfringens agar (SFP), Sulphite�Cycloserine�Azide (SCA), Differential�Clostridial�Agar (DCA), and
Oleandomycine�Polymyxine�Sulfadiazine�Perfringens agar (OPSP)] were compared in a pre�study, of
which four (IS, TSC, SCA, and DCA) were selected for an international collaborative trial. Recovery
of 15 pure strains was tested in the pre�study and recovery of one strain from foodstuffs was
tested in the collaborative trial. Results from the pre�study did reveal statistical difference of the
media, but recoveries on all media were within the microbiological limits (± 30%) of IS, which was
set as a reference medium. Recoveries on the media tested in the collaborative trial were
statistically different as well, but these differences were of no microbiological�analytical relevance.
Food matrices did not affect recovery of C. perfringens in general. DCA and SCA in particular, are
labor�intensive to prepare and DCA frequently failed to produce black colonies: grey colonies were
quite common. Since IS medium is non�selective, it was concluded that TSC was the most
favorable medium for enumeration of C. perfringens from foods.
Published as A.E.I. de Jong, G.P. Eijhusen, E.J.F. Brouwer-Post, M. Grand, T. Johansson, T. Kärkkäinen, J. Marugg, P.H. in’t Veld, F.H.M. Warmerdam, G. Wörner, A. Zicavo, F.M. Rombouts, and R.R. Beumer. 2003. Comparison of media for enumeration of Clostridium perfringens from foods. Journal of Microbiological Methods. 53: 359-366

Chapter 3
40
INTRODUCTION
Over the years many methods have been developed to isolate Clostridium perfringens from foods, some of which are integrated into national and international standards. Literature study shows that many different types of media and methods are used to isolate C. perfringens, but some media are more frequently employed: Tryptose-Sulphite-Cycloserine agar (TSC) is used most often (34.0%), followed by Sulphite-Polymyxin-Sulfadiazine agar (SPS; 24.3%), Shahidi-Ferguson-Perfringens agar (SFP; 15.5%), and Tryptone-Sulphite-Neomycin (TSN; 7.8%). Most of these media are similar in their base (peptones, yeast extract, sodium sulphite, and ammonium iron citrate), but different types of antibiotics are used. Other media, such as Sulphite-Cycloserine-Azide agar (SCA), Oleandomycin-Polymyxin-Sulfadiazine-Perfringens agar (OPSP), and Differential-Clostridial-Agar (DCA) add extra components like meat extract, liver extract, TRIS buffer, glucose or starch (Table 1).
Table 1. Comparison of media with reference to IS agar
Medium Base Electivity Antibiotics Remarks
IS ISa NH4 Fe(III)+ citrate: 1 g Na2S2O5: 1 g
none ISO 15213 NMKL 56
TSC IS idem cycloserine ISO 7937 SFP IS idem kanamycine
polymyxin
TSN IS tryptone i.o. b tryptose + 5 g YE
NH4 Fe(III)+ citrate: 0.5 g Na2SO3: 1 g
polymyxin neomycin
SPS IS tryptone i.o. tryptose + 5 g YE
NH4 Fe(III)+ citrate: 0.5 g Na2SO3· 7H2O: 0.5 g
polymyxin sulfadiazine
SCA IS + 5 g meat extract + 2 g glucose
NH4 Fe(III)+ citrate: 0.5 g Na2S2O5: 0.5 g
cycloserine Na-azide
DIN 10103
OPSP IS tryptone i.o. tryptose + 7 g liver extract + 1.5 g Tris buffer
NH4 Fe(III)+ citrate: 1 g Na2S2O5: 1 g
oleandomycin polymyxin sulfadiazine
DCA DCAc NH4 Fe(III)+ citrate: 1 g Na2SO3· 7 H2O : 0.75 g
none
a Tryptose: 15 g; peptone from soy meal: 5; yeast extract (YE): 5 g; agar: 15 g; water: 1000 ml; b
Instead of; c Starch: 1 g; casein peptone: 5 g; meat peptone: 5 g; meat extract: 8 g; yeast extract: 1 g; glucose: 1 g; resazurine: 0.002 g; cysteine-HCl: 0.5 g; agar: 20 g; water: 1000 ml

Comparison of media
41
The electivity of all these media is based on the reduction of sulphite, which precipitates as iron sulphide, resulting in black colonies. This reaction is, however, not limited to clostridia. Other bacteria like salmonellae, Proteus, Escherichia freundii, Paracolobactrum, and certain species of the genera Erwinia, Flavobacterium, and Achromobacter may yield black colonies as well 35. Non-sulphite reducing anaerobic bacteria also interfere with the outgrowth of C. perfringens. Antibiotics are added to increase the selectivity of the media for C. perfringens.
Eligibility of a medium for a specific microorganism is based on both the selectivity of the antibiotic(s) used and the growth supporting capabilities of the agar for the organism of choice, which depend on the medium composition (Table 1). In this research, six media (IS, TSC, SCA, SFP, OPSP, and DCA) have been compared for the recovery of pure C. perfringens strains, four of these (IS, TSC, SCA, and DCA) have been tested in a collaborative trial for recovery of C. perfringens from foodstuffs. The aim of these comparative studies was to reveal differences in recovery of C. perfringens on these media.
MATERIALS AND METHODS
Strains Strains used in this research have partly been described by de Jong et al. 172. Other strains (WU90103 and WU01147) were isolated from foods by the Dutch Inspectorate for Health Protection and Veterinary Public Health or in our laboratory; strain WU01147 was implicated in a food poisoning outbreak involving smoked salmon.
Preparation of spores and contaminated milk powder Duncan and Strong medium (DS) 91 was used to obtain spores from strains ATCC 13124, D10, 82049, 82100, WU99118, and WU01150 using a 10% overnight inoculum from a Fluid Thioglycollate medium (FTG; Oxoid, Basingstoke, England) culture. From strains WU00128, WU00129, WU00130, WU00131, WU00132, WU00134, and WU00135 spores were obtained using DS medium with a 20% overnight inoculum from a FTG culture and Pepton-Bile-Theophyline-Starch medium 310 was used to generate spores from strains WU90103, WU88105, WU90111, and WU01147 (5% overnight FTG inoculum). Spores were concentrated and washed by centrifugation (12,000 × g), and stored at 4°C in distilled water.
For the collaborative trial, spores of strain D10 were concentrated by centrifugation (12,000 × g), suspended in pasteurized skim milk, homogenized, and subsequently spray-dried in a Stork pilot plant spray dryer at an inlet temperature of 150°C and an outlet temperature of 85°C. The resulting highly contaminated milk powder (HCM) was stored at 5°C. This HCM was mixed in a stepwise manner in a mortar with equal volumes (w/w; of γ-irradiated milk product 17 (Nestlé,

Chapter 3
42
Amsterdam, The Netherlands) 315 to obtain two lower levels of contaminated milk powder (LCM) with approximately 4×10⁵ cfu/g (LCM1) and 4×10³ cfu/g (LCM2), respectively. Both LCM’s were distributed in size one white/white gelatine capsules (Elanco Qualicaps, Fegersheim, France) using an aluminum filling apparatus in a laminar air flow cabinet; 15.6 g LCM was distributed into 60 capsules (0.26 g LCM per capsule). Capsules were stored at -20°C with desiccant (silica gel), and mailed at room temperature. To minimize deviations due to storage conditions, all laboratories conducted the trial at the same time.
Media IS (Merck, Darmstadt, Germany), TSC (Merck), SFP (Merck), SCA, OPSP (Oxoid), and DCA (Merck). SCA in the pre-study was prepared by adding glucose and sodium azide to Perfringens-Agar base (Oxoid), SCA in the collaborative trial was prepared from its individual ingredients. Both SCA media differ in their concentration of elective substances: SCA from the pre-study contains 1 g/l of ammonium iron(III) citrate and 1 g/l of Na2S2O5, and SCA from the collaborative trial contains 0.5 g/l of both compounds. Dilutions were made with reduced saline solution (RSS) containing NaCl (8 g/l) and cysteine-HCl (0.5 g/l).
All media were tested in the pour plate method with an overlay of the same medium, since in (inter)national standards of ISO, DIN, and NMKL, only pour plate methods are described. Plates were incubated anaerobically (Anoxomat system: jars flushed with a 80% N2, 10% CO2, and 10% H2 gas mixture plus catalyst; Mart, Lichtenvoorde, The Netherlands) at 37°C for 18 ± 2 h. Different methods to obtain anaerobiosis were used with the collaborative trial, e.g. Anaerocult, Anaerogen (Oxoid), Anoxomat, and anaerobic chamber.
Method Pre-study: Spores were heat-activated (70°C, 20 min) in RSS and suitable dilutions were plated in triplicate using the pour plate method with an overlay of the same medium. The effect of a food matrix on the recovery was studied by inoculating ground beef. The first decimal dilution was heat-activated and cfu’s were determined in triplicate using the above-mentioned method. Both experiments were conducted twice.
Collaborative trial: Capsules containing contaminated milk powder were reconstituted in 10 ml RSS (control) or in a 10% food sample in RSS, without heat activation diluted, and plated in duplicate using the pour plate method with an overlay of the same medium. Two capsules of the same contamination level were tested in both RSS and in the foodstuffs. Control samples were plated on IS only, whereas capsules reconstituted in foodstuffs were plated on the four above-mentioned media. Thirteen laboratories participated in the international collaborative trial. Each laboratory tested both basil and ground beef (except for one laboratory) and an optional product. Products of choice were: instant roast meat gravy, pâté,

Comparison of media
43
fried rice, rice, rice with egg, cereal, milk, sheep’s cheese, milk powder, spinach soup, mushroom soup, vegetable soup, and pea soup (2x). Statistical analyses The homogeneity of the capsules was checked by means of two tests, both of which are based on Cochran’s dispersion test statistics 69,236. The first test, also called the T1 test, determines the variation between replicate samples from the same reconstituted capsule, and the second test, also called the T2 test, determines the variation between the sums of the replicate sample counts per reconstituted capsule. When the variation between the counts corresponds to a Poisson distribution, the value of T2 divided by (I – 1) equals one. Since over dispersion was expected, T2/(I – 1) ≤2.5 was used as a criterion for acceptance 236. The homogeneity of the capsules was determined using the results of 20 capsules of which the number of cfu’s was determined on IS just after encapsulation.
Analysis of Variance was used to determine the homogeneity of the laboratories (laboratories and capsules as fixed factors; α=0.05) and to compare the agar media tested (pre-study: strains as random factor and medium as fixed factor, collaborative trial: laboratories as random factor and medium and foodstuff as fixed factor; α=0.05). Data from the control samples were used to determine the homogeneity of the laboratories. Comparison of the agar media was carried out for both levels of contamination. Data from the collaborative trial were analyzed using a proposed ISO method 28.
RESULTS AND DISCUSSION
Fifteen strains were used to test the recovery of pure C. perfringens strains on 6 different isolation media in a pre-study: IS, TSC, SFP, SCA, OPSP, and DCA. IS, TSC, and SCA were chosen since they are described in standard methods; SFP was tested since it is commercially available and quite often used. OPSP was selected for its dissimilar composition compared to IS and DCA was chosen since it is a
Table 2. Comparison of recovery of pure Clostridium perfringens strains on 5 isolation media
Medium Recoverya
Experiment 1b Experiment 2c
TSC 100.3 ± 13.4 95.5 ± 4.5 SFP 74.5 ± 13.4 87.4 ± 5.3 SCA 95.6 ± 14.1 103.3 ± 9.0 OPSP 90.9 ± 13.4 94.5 ± 7.9 DCA 89.3 ± 13.8 94.3 ± 6.9
a Average recovery (± Stdev) of strains tested expressed as percentage from IS agar; b 15 strains used; highest and lowest counts were left aside; c 4 strains used; recovery from artificially contaminated ground beef

Chapter 3
44
relatively new and unknown medium. TSN and SPS were not selected since they mainly differ in the type of antibiotic(s) used compared to TSC and SFP (Table 1). Furthermore, SPS is known for the frequent failure of C. perfringens to form black colonies and its lack of selectivity 143,270 and TSN is inhibitory to some strains of C. perfringens 139,140. DCA and IS are not selective for C. perfringens but are used for sulphite reducing bacteria in general.
The media were statistically different (P=0.000), but microbiologically equal (within 30% range of IS), although the recovery on SFP was low (Table 2). The media could be divided into four statistically homogeneous subsets: 1) IS, TSC, and SCA; 2) SCA and OPSP; 3) OPSP and DCA; 4) SFP. Recovery on the media was strain dependent (P=0.008). In another experiment, ground beef was separately inoculated with 4 pure strains of C. perfringens spores and the effect of this food matrix on the recovery of C. perfringens was studied (Table 2). No statistical and microbiological difference in the recovery was detected.
Although the tested media performed equally well from a microbiologically quantitative point of view, literature reveals qualitative differences. SFP medium allows growth of a large number of facultative anaerobes, some of which are sulphite-reducing 147,270. OPSP medium suffers from the same problem as SFP 30 and additionally suppresses growth of some strains of C. perfringens 150. Therefore, these two media were not tested in the subsequent collaborative trial.
To test stability and homogeneity of the milk powders used in the collaborative trial, LCM1 and LCM2 capsules were weighed and numbers of cfu’s were determined on the day of encapsulation and on the day of trial (Table 3). Data demonstrate that the numbers of C. perfringens were stable during storage and transport. Homogeneity of LCM1 and LCM2 capsules was expressed as the T-value and a microbiological reproducibility range (R) was calculated for the data from the collaborative trial (Table 3).
Analysis of Variance of data from control samples showed that test results were significantly different among the laboratories (P=0.000), but most laboratories performed within the microbiological reproducibility limits (Figure 1). For LCM1, laboratories G, H, and K were below the 42% reproducibility limit of the average, whereas laboratories A, F, I, and L were above this range. For LCM2, laboratory K performed worse than the average minus 48%, whereas laboratories F and I showed
Table 3. Data from capsules
Capsule Weight (mg) Log Na T-valueb Rc
Day 1 Day 2
LCM1 34.49 ± 0.44 4.9 ± 0.05 5.0 ± 0.06 2.26 ± 42% (0.153 log) LCM2 34.94 ± 0.72 3.6 ± 0.24 3.2 ± 0.07 1.05 ± 48% (0.169 log)
a Number of cfu per capsule (± Stdev); day 1: day of encapsulation, 10 capsules; day 2: day of trial (capsules have been equally treated as ones mailed to the different labs), 7 capsules; b Measure of homogeneity; Poisson distribution: T-value = 1; c Reproducibility range for trial data calculated from Stdev of Log N of control samples; 0.058 for LCM1 and 0.065 for LCM2, respectively. R = Stdev *2.6 expressed as percentage of absolute counts and log numbers 322

Comparison of media
45
higher recoveries than averaged. Limits of reproducibility calculated with the proposed ISO method showed that for control samples of LCM1 data from laboratory L were different from those of laboratory G and H. For LCM2 it was demonstrated that results from laboratory K differed from those of A, F, and I and those of laboratory F were different from C, J, and K. Analysis of Variance of foodstuff data showed that the factor laboratory had a significant effect (P=0.000) for LCM1, but not for LCM2 (P=0.685), although for LCM2 the medium/laboratory interaction was significant (P=0.001). Data were also analyzed using a proposed ISO method. Reproducibility was calculated for basil and minced beef for all laboratory/medium/LCM combinations (Table 4). This analysis revealed that laboratory B produced divergent results on most media/LCM combinations for basil and minced meat. Laboratory F showed dissimilar results on IS and TSC for basil and on IS for ground meat and laboratory H reported aberrant results on SCA with basil at the low inoculum level.
Each laboratory tested the effect of three foodstuffs on the recovery of C. perfringens from both LCM’s on IS, TSC, SCA, and DCA to establish the adequacy of these media for enumerating C. perfringens from foods (Figures 2 and 3). IS agar
Table 4. Aberrant data based on ISO reproducibility limits
Medium Aberrant laboratories
LCM 1 LCM 2
Basil Ground beef Basil Ground beef
IS F/Ba F/Ca+Bb B+Fb Bb TSC F/Ka Bb Fb Bb SCA Bb Bb B+Hb Bb DCA Bb - Bb Bb
a Laboratories that significantly differed from each other; b Laboratories that significantly differed from more than one other laboratory
Figure 1. Comparison of test results from control samples by different laboratories. A: LCM1; B: LCM2. Solid bars: within microbiological reproducibility limits; dashed bars: beyond microbiological reproducibility limits. Horizontal lines: statistical homogeneous subsets

Chapter 3
46
was set as reference medium, since this medium does not contain antibiotics that may affect the recovery of this pathogen. Horizontal lines indicate the microbiological limits (+/- 42% and 48% for LCM1 and LCM2, respectively) of the average recovery on IS agar. Aberrant data (no formation of black colonies on any of the plates of a certain sample) and data from laboratory B were removed from the statistical analysis (Figure 3). Statistical analysis of the data showed that for LCM1 two subsets of media were formed; one subset consisted of IS, TSC, and DCA and the other subset of SCA and DCA. This was not of any microbiological importance (Figure 2a). Statistical analysis revealed that foodstuffs did affect the recovery on IS medium, but recovery of LCM1 from foods on SCA and DCA was statistically equal to the control samples. However, all data were within the calculated microbiological range (Figure 2a). Data for LCM2 were divided into three statistically homogeneous subsets: one subset was made up by IS and TSC, another subset by TSC and DCA, and the last one by DCA and SCA. All subsets were statistically equal to data of the control samples (Figure 2b), however, SCA was just outside the microbiological range of IS, while DCA was just within this range. These two media showed high standard deviations at this level of contamination. Combining data from LCM1 and LCM2 eliminated all statistical and microbial medium differences (laboratory as random factor; medium and foodstuff as fixed factor): control samples (log 4.1), IS (4.1), SCA (4.1), TSC (4.1), and DCA (4.0).
Although all media performed equally well, ease of use of the media differed. Growth of C. perfringens on IS and TSC was clear, although in some cases excessive blackening of the agar frustrated counting lower dilutions, even though low cell numbers were expected. SCA produced both pinpoint colonies as well as clearly distinguishable colonies of C. perfringens and on DCA medium colonies were sometimes (too) small and this medium did not consistently produce black colonies. Grey colonies occurred regularly on the DCA plates, despite the use of freshly added ferric ammonium citrate and disodium sulphite heptahydrate after autoclaving. Some
Figure 2. Comparison of test results from all samples tested sorted by medium. A: LCM1; B: LCM2. Control: contaminated milk powders in RSS, plated on IS; IS, TSC, SCA, and DCA: contaminated milk powder in foodstuff, plated on respective media. Lines indicate 30% interval of average from foodstuffs on IS

Comparison of media
47
laboratories had notable difficulties with SCA and/or DCA (Figure 3), since no black colonies were formed in some of the samples tested. These two media have another disadvantage over TSC: SCA is not commercially available and has to be prepared from its individual components and, just like DCA, it needs the addition of the ferric and sulphite source after autoclaving of the base.
Foodstuffs did not significantly influence counts (P=0.572 and 0.685 for LCM1 and LCM2, respectively), but did affect ease of counting of colonies: basil blackened IS, TSC, and DCA in the 1st and 2nd decimal dilution, thus frustrating counting of colonies; cereal, milk powder, and ground beef (1 laboratory) caused blackening of the agar plates in the first decimal dilution, while colony counts of ca. 100 per plate were expected. Glucose or other fermentable carbohydrates may partially cause these problems. Glucose is known to cause excessive blackening and gas formation 318, thus complicating detection of low numbers of C. perfringens in sugar-rich products.
It can be concluded that enumeration of C. perfringens from food on IS, TSC, SFP, SCA, DCA, and OPSP yielded statistical differences, but no microbiological difference was revealed between the media. SCA and DCA, however, performed slightly less well in the collaborative trial at low concentrations of C. perfringens in food, while SFP showed low counts in the pre-study. DCA and especially SCA are laborious to prepare and DCA did not consistently produce black colonies; grey colonies were frequently obtained. Since IS lacks selectivity, it was concluded that TSC is the most favorable medium for the enumeration of C. perfringens from foods.
Figure 3. Interaction between laboratories and media. Values shown are averaged recoveries from the foodstuffs tested expressed as a ratio of the recovery of the control samples (contaminated milk powders in RSS). A: data for LCM1; B: data for LCM2. Symbols: ◊: IS; ∆: TSC; ○: SCA, and �: DCA

48
Spores & Cells, Media & Modeling

4 EFFECT OF COOLING ON CLOSTRIDIUM PERFRINGENS
IN PEA SOUP
Foods associated with Clostridium perfringens outbreaks are usually abused after cooking. Due to
their short generation times, C. perfringens spores and cells may grow out to high levels during
improper cooling. Therefore, the potential of C. perfringens to multiply in Dutch pea soup during
different cooling times was investigated. Tubes of pre�heated pea soup (50°C) were inoculated
with cocktails of cells or heat�activated spores of this pathogen. The tubes were linearly cooled to
15°C in time spans of 3, 5, 7.5, and 10 h and were subsequently stored in a refrigerator at 3°C
or 7°C for up to 84 h. Cell numbers increased by 1 log cycle during the 3�h cooling period and
reached their maximum after 10 h of cooling. Subsequent refrigeration hardly reduced cell
numbers. Cooling of 3.75 l of pea soup in an open pan showed that this amount of pea soup
cooled down from 50→15°C in 5 h, which will allow more than a 10�fold increase in cell numbers.
These findings emphasize the need of good hygienic practices and quick cooling of heated foods
after preparation.
Accepted for publication A.E.I. de Jong, F.M. Rombouts, and R.R. Beumer. 2003. Effect of cooling on Clostridium perfringens in pea soup. Journal of Food Protection.

Chapter 4
50
INTRODUCTION
Food poisoning caused by Clostridium perfringens is mainly associated with foods that are improperly handled after cooking; especially preparation of large quantities of food is associated with outbreaks of this pathogen 156,245,246. C. perfringens is able to grow in a temperature range of 15-50°C, with generation times of 6.3 min at 43-47°C in meat or thioglycollate broth 199,202. Inadequate cooling of food may, therefore, result in high cell numbers. Subsequent refrigeration may not sufficiently reduce cell numbers and improper reheating will leave the consumer with a high-risk product 295. This is demonstrated by an outbreak with pea soup in an elderly home in Sweden in 2002, resulting in 64 cases and two deaths 26. Data from the World Health Organization about Denmark, Finland, France, Germany, Iceland, Spain, Sweden, and the United Kingdom show that in the period 1993-1998 inadequate cooling, refrigeration, and storage caused 24% of the food poisoning outbreaks with known contributing factors. In the USA 41% of C. perfringens outbreaks are caused by improper cooling 180. By Dutch law, foods should be cooled from 60°C to 7°C within 5 h and may subsequently be cooled to 4°C within 24 h. Products cooled to 7°C may be stored for 48 h, while products stored at 4°C may be used till 72 h after start of the cooling process 21.
Data from the Dutch Inspectorate for Health Protection and Veterinary Public Health (KvW) from September 1995 till May 2002 (N = 2413) show that 83% of pea soup samples had a temperature of ≤7°C; 32% of those samples were frozen. 12% of pea soup samples taken by the KvW were within the temperature range of 7-60°C (samples that were being heated were omitted); 2.4% was within the growth range of C. perfringens. Data from the KvW also show that 30% of Dutch companies do not
Table 1. Identification of strains of Clostridium perfringens
Strain Source of isolate Supplied by
82049 curry KvWa D10b RIVMc WU9910b RIVM WU00129 gravy WURd WU00130 curry WUR WU00132 oregano WUR WU01147b smoked salmon KvW ATCC 3624 RIKILTe ATCC 12916 RIKILT NCTC 8798 G. Daubef NCTC 10239 KvW
a Dutch Inspectorate for Health Protection and Veterinary Public Health, Den Bosch, The Netherlands; b Involved in food poisoning outbreak; c National Institute of Public Health and the Environment, Bilthoven, The Netherlands;d Wageningen University and Research centre; e State Institute for Quality Control of Agricultural Products, Wageningen, The Netherlands; f University of Liège, Liège, Belgium

Growth during cooling
51
meet temperature standards set by Dutch law; 19% of the companies did not properly cool products 206.
Since 87% of pea soup samples are kept in cooling devices, and 19.4% of Dutch companies do not meet cooling criteria, high-risk products may reach the consumer. To further investigate this risk, the cooling profile of an open pan of pea soup was determined and the effect of different cooling profiles on (out)growth and survival of C. perfringens cells and spores in pea soup was studied .
MATERIALS AND METHODS Strains Strains of C. perfringens used in this research are listed in Table 1.
Inoculum Stocks of vegetative cells, grown overnight in Fluid Thioglycollate medium (FTG; Oxoid, Basingstoke, England; 37°C), were stored at –80°C in 20% glycerol (v/v) plus glass beads. Inocula were prepared from thawed stock cultures by inoculating a glass bead in 10 ml FTG tubes (37°C, 24 h) and subsequently streak plating on Tryptose-Sulphite-Cycloserine agar (TSC; Merck, Darmstadt, Germany) without egg yolk and cycloserine. Plates were incubated anaerobically (37°C, 24 h; Anoxomat, Mart Microbiology BV, Lichtenvoorde, The Netherlands) and one separate colony was used to inoculate an FTG pre-culture (overnight, 37°C). FTG was freshly steamed before use (20 min, 100°C) and no further effort was taken to obtain anaerobic conditions.
Strains were screened for presence of the enterotoxin gene (cpe-gene) using a PCR based method. Genomic DNA was isolated from 5-h FTG cultures (37°C) according to the Wizard®SV Genomic DNA Purification System (Promega Benelux BV, Leiden, The Netherlands). The PCR assay was performed using the MJ Research PTC-200 Peltier Thermal Cycler (Biozym TC BV, Landgraaf, The Netherlands) in 25 µl PCR mixture containing 2.5 µl lysate, 2.0 µl 2.5 mM of each oligonucleotide primer, 2.5 µl PCR buffer, 0.75 µl Taq-polymerase (5U/µl), 2.0 µl 25 mM of each dNTP, 5.0 µl Tween20 (0.005%), and 8.125 µl MilliQ. The reactions were subjected to 35 cycles of amplification consisting of 15 s of denaturation at 90°C, 15 s for primer annealing at 48°C, and 45 s of chain extension at 72°C. The primers were as follows: 5’-TAA CAA TTT AAA TCC AAT GG-3’ and 5’-ATT GAA TAA GGG TAA TTT CC-3’ (Sigma Genosys Ltd, Cambridge, UK) 211. The size of an amplified fragment was 933 bp. Pre-cultures of strains containing the cpe-gene (Ent+; WU00147, D10, NCTC 8798, NCTC 10239, and ATCC 12916) were mixed in equal volumes, as well as the strains without the gene (Ent-; 82049, WU00129, WU00130, WU00132, and ATCC 3624) and both mixtures were subsequently diluted in reduced saline solution [RSS; 0.8% (w/v) NaCl plus 0.05% (w/v) cysteine-HCl (Sigma)] to obtain an 0.4 ml inoculum applied to 15 ml of pea

Chapter 4
52
soup, resulting in 100-1000 cfu/ml pea soup. The Ent+ mix was referred to as cocktail 1, the Ent- mix as cocktail 2.
From strains 82049, WU9910 (an Ent+ strain), WU00129, WU00130, WU00132, D10, ATCC 3624, and NCTC 10239 spores were obtained using Duncan and Strong medium 91 (37°C, overnight) with a 10% inoculum from an FTG pre-culture. Spores were washed twice and concentrated in distilled water by centrifugation (12,000 × g), and subsequently stored at 4°C. Strains that germinated without heat-activation in FTG at 37°C (82049, WU00130, ATCC 3624, and D10) were mixed in equal spore numbers as well as strains that germinated slowly without heat treatment in FTG at 37°C (WU9910, WU00129, WU00132, and NCTC 10239) and both mixtures were subsequently diluted in RSS to obtain an 0.4 ml inoculum applied to 15 ml of pea soup, resulting in 105-106 spores/ml pea soup. The mix containing rapidly germinating strains was referred to as cocktail 3, the slowly germinating strains were referred to as cocktail 4.
Cooling pea soup The cooling profile of an open pan (diameter 24.5 cm) containing 3.75 l of pea soup (approximately an 8-cm layer) was determined in an air-vented walk-in cabinet of 3°C, and in a refrigerated incubator at 10°C. The temperature was measured every 5 min using a Squirrel data logger (Grant Instruments Ltd., Cambridge, UK).
Growth and germination experiments Freshly sterilized mashed pea soup [kindly provided by Struik Foods Voorthuizen BV, Nijkerk, The Netherlands; pH 5.86; aw: 0.985; 0.8% salt (w/v)] was used as growth medium. Experiments were conducted in 50 ml disposable plastic screw cap tubes (Corning Inc., Corning, NY, USA) containing approximately 15 ml pea soup. Pea soup tubes were inoculated with 0.4 ml of spore or cell cocktail suspensions and mixed well. Spores were heat activated (20 min at 70°C) before inoculation to mimic cooking of pea soup.
Sterilized pea soup tubes were cooled down to 50°C in a water bath before inoculation. Inoculated tubes were placed in a water bath that was coupled to a refrigerated water bath (Julabo MV-4 thermostat, Julabo Labortechnik GmbH, Seelbach, Germany) by means of a heat exchanger. The water bath was initially set at 50°C and by a computer generated time-temperature ramp (Labworldsoft 3.0, Fischer Scientific, Staufen, Germany) linearly cooled to 15°C at rates varying from 3 h till 10 h. Comparison of the water bath temperature and the thermocouple temperature used to monitor the pea soup temperature during cooling, indicated a little difference in the cooling profile of the soup samples, compared to the enforced water bath temperature. However, tubes were sampled after the set time interval; time and temperature differences ranged between 20 min to 38 min, and 1.3°C to 3.8°C, respectively. After reaching a temperature of 15°C, tubes were stored at 7°C for 48 h and 72 h and at 3°C for 72 h and 84 h.
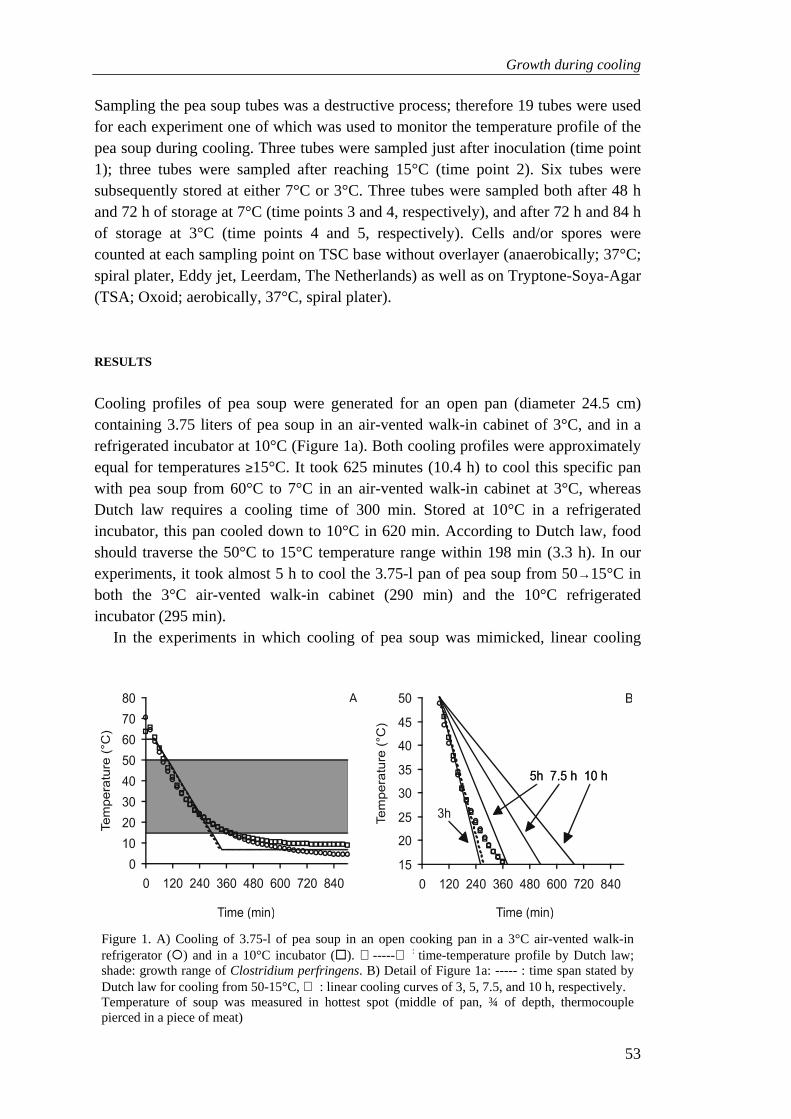
Growth during cooling
53
Sampling the pea soup tubes was a destructive process; therefore 19 tubes were used for each experiment one of which was used to monitor the temperature profile of the pea soup during cooling. Three tubes were sampled just after inoculation (time point 1); three tubes were sampled after reaching 15°C (time point 2). Six tubes were subsequently stored at either 7°C or 3°C. Three tubes were sampled both after 48 h and 72 h of storage at 7°C (time points 3 and 4, respectively), and after 72 h and 84 h of storage at 3°C (time points 4 and 5, respectively). Cells and/or spores were counted at each sampling point on TSC base without overlayer (anaerobically; 37°C; spiral plater, Eddy jet, Leerdam, The Netherlands) as well as on Tryptone-Soya-Agar (TSA; Oxoid; aerobically, 37°C, spiral plater).
RESULTS Cooling profiles of pea soup were generated for an open pan (diameter 24.5 cm) containing 3.75 liters of pea soup in an air-vented walk-in cabinet of 3°C, and in a refrigerated incubator at 10°C (Figure 1a). Both cooling profiles were approximately equal for temperatures ≥15°C. It took 625 minutes (10.4 h) to cool this specific pan with pea soup from 60°C to 7°C in an air-vented walk-in cabinet at 3°C, whereas Dutch law requires a cooling time of 300 min. Stored at 10°C in a refrigerated incubator, this pan cooled down to 10°C in 620 min. According to Dutch law, food should traverse the 50°C to 15°C temperature range within 198 min (3.3 h). In our experiments, it took almost 5 h to cool the 3.75-l pan of pea soup from 50→15°C in both the 3°C air-vented walk-in cabinet (290 min) and the 10°C refrigerated incubator (295 min).
In the experiments in which cooling of pea soup was mimicked, linear cooling
Figure 1. A) Cooling of 3.75-l of pea soup in an open cooking pan in a 3°C air-vented walk-in refrigerator (�) and in a 10°C incubator (�). ----- : time-temperature profile by Dutch law; shade: growth range of Clostridium perfringens. B) Detail of Figure 1a: ----- : time span stated by Dutch law for cooling from 50-15°C, : linear cooling curves of 3, 5, 7.5, and 10 h, respectively. Temperature of soup was measured in hottest spot (middle of pan, ¾ of depth, thermocouple pierced in a piece of meat)

Chapter 4
54
ramps were applied. These ramps represent worst-case scenarios, since the samples dwelled for a longer time period at the optimal growth range of C. perfringens (30-50°C) and for a shorter time period in the sub-optimal temperature range (15-30°C) compared to the cooling pan of pea soup: applying a 5-h linear cooling ramp took 51 min extra time to reach 30°C compared to the cooling pan of pea soup (Figure 1b). However, linear cooling of pea soup in a 3-h period underestimated growth of C. perfringens: time to reach 30°C equalled the cooling time of the 3.75-liter pan with pea soup, but the time spent in the sub-optimal temperature range was almost 2 h less (Figure 1b).
The experiments were conducted in a temperature range from 50°C to 15°C, since this is the growth range of C. perfringens 199. All strains used in these experiments were tested for growth capacities at 15°C and at 49.5°C; all strains showed positive results, but at 50°C none of the strains showed any growth within 24 h (data not
Figure 2. Experimental design and results for pea soup inoculated with two different cell cocktails of Clostridium perfringens and cooled down from 50°C to 15°C in 7.5 h. Bars: Temperature profile; Lines: Cell counts. Open symbols: pea soup stored at 7°C, closed symbols: pea soup stored at 3°C. �: strain cocktail 1 (Ent+), �: strain cocktail 2 (Ent-). Time points: 1) just after inoculation at 50°C, 2) just after reaching 15°C (∆t=7.5h), 3) after 48 h, 4) after 72 h, and 5) after approximately 84 h of refrigerated storage
Figure 3. Increase in cell numbers of four cocktails of Clostridium. perfringens in pea soup cooled down from 50 to 15°C in four different time spans. Error bars indicate Stdev of triplicate samples
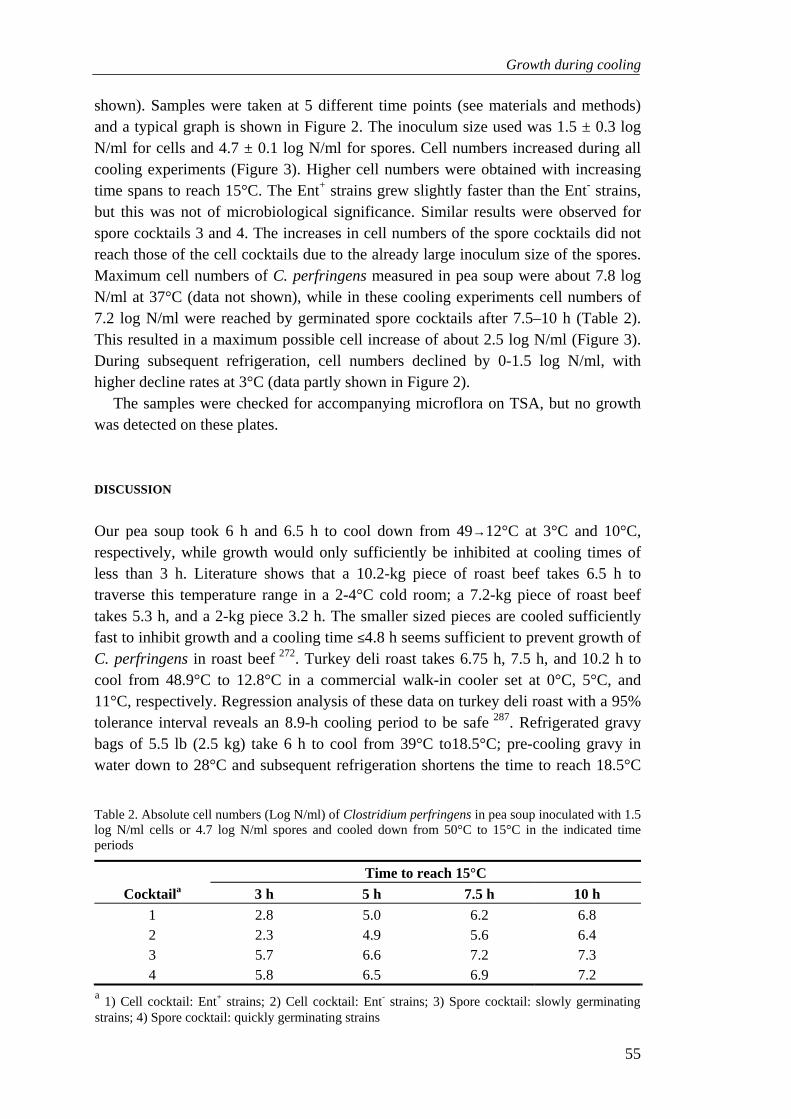
Growth during cooling
55
shown). Samples were taken at 5 different time points (see materials and methods) and a typical graph is shown in Figure 2. The inoculum size used was 1.5 ± 0.3 log N/ml for cells and 4.7 ± 0.1 log N/ml for spores. Cell numbers increased during all cooling experiments (Figure 3). Higher cell numbers were obtained with increasing time spans to reach 15°C. The Ent+ strains grew slightly faster than the Ent- strains, but this was not of microbiological significance. Similar results were observed for spore cocktails 3 and 4. The increases in cell numbers of the spore cocktails did not reach those of the cell cocktails due to the already large inoculum size of the spores. Maximum cell numbers of C. perfringens measured in pea soup were about 7.8 log N/ml at 37°C (data not shown), while in these cooling experiments cell numbers of 7.2 log N/ml were reached by germinated spore cocktails after 7.5–10 h (Table 2). This resulted in a maximum possible cell increase of about 2.5 log N/ml (Figure 3). During subsequent refrigeration, cell numbers declined by 0-1.5 log N/ml, with higher decline rates at 3°C (data partly shown in Figure 2).
The samples were checked for accompanying microflora on TSA, but no growth was detected on these plates.
DISCUSSION Our pea soup took 6 h and 6.5 h to cool down from 49→12°C at 3°C and 10°C, respectively, while growth would only sufficiently be inhibited at cooling times of less than 3 h. Literature shows that a 10.2-kg piece of roast beef takes 6.5 h to traverse this temperature range in a 2-4°C cold room; a 7.2-kg piece of roast beef takes 5.3 h, and a 2-kg piece 3.2 h. The smaller sized pieces are cooled sufficiently fast to inhibit growth and a cooling time ≤4.8 h seems sufficient to prevent growth of C. perfringens in roast beef 272. Turkey deli roast takes 6.75 h, 7.5 h, and 10.2 h to cool from 48.9°C to 12.8°C in a commercial walk-in cooler set at 0°C, 5°C, and 11°C, respectively. Regression analysis of these data on turkey deli roast with a 95% tolerance interval reveals an 8.9-h cooling period to be safe 287. Refrigerated gravy bags of 5.5 lb (2.5 kg) take 6 h to cool from 39°C to18.5°C; pre-cooling gravy in water down to 28°C and subsequent refrigeration shortens the time to reach 18.5°C
Table 2. Absolute cell numbers (Log N/ml) of Clostridium perfringens in pea soup inoculated with 1.5 log N/ml cells or 4.7 log N/ml spores and cooled down from 50°C to 15°C in the indicated time periods
Time to reach 15°C
Cocktaila 3 h 5 h 7.5 h 10 h 1 2.8 5.0 6.2 6.8 2 2.3 4.9 5.6 6.4 3 5.7 6.6 7.2 7.3 4 5.8 6.5 6.9 7.2
a 1) Cell cocktail: Ent+ strains; 2) Cell cocktail: Ent- strains; 3) Spore cocktail: slowly germinating strains; 4) Spore cocktail: quickly germinating strains

Chapter 4
56
with 2 h. These cooling times did not prevent growth of C. perfringens to high numbers 306. Food stored in a covered pan in a commercial walk-in refrigerator takes 13 h to cool from 54.4°C to 7.2°C when portioned at 2-inch (5.08 cm) height, and over 30 h at 4-inch height 283. This author suggested that food cooled at 2-inch height is safely stored, based on growth experiments of Juneja et al. in ground beef 185. However, the above-mentioned data from literature and our data of cooling pea soup samples showed that products other than ground beef would be highly contaminated with C. perfringens in a 13-h cooling period. Moreover, rapid cooling of pea soup according to Dutch law (from 50°C to 15°C within 3.3 h) did not prevent growth and outgrowth of C. perfringens cells and spores, respectively. Multiplication and germination followed by outgrowth took place within a 3-h linear cooling period (11.7°C/h). Since a linear cooling slope was employed, underestimation of growth was expected (Figure 1b), but with a linear cooling time of 5 h (5°C/h) (out)growth was overestimated. Thus, increase in cell numbers during cooling of pea soup will range between 2.3 and 5.0 log cycles for cell inocula, and between 1.0 and 1.6 log cycles for spore inocula, respectively. These increases violate the USDA safe cooling standard criteria, which allow no more than 3 multiplications (0.6 log cycles) during cooling 110.
Our data of pea soup were comparable with data of chili 50; chili and pea soup both contain legumes, vegetables and meat. Growth of about 1.8 log cycles is predicted to occur in chili 50 during the first 4 h of cooling (comparable to 4.5 h cooling in our experiments), whereas we observed an increase of 1.6-2.1 log cycles for spore inocula during a 5-h cooling period in pea soup. However, comparison with
Table 3. Legislation with regard to cooling procedures in the retail chain
Country Cooling range (°C) Time (h) Reference The Netherlands 60→7 5 21
7→4a 24 Denmark 65→1 3 105
France 70→10 2 105
Germany 80→15 4 105
15→2 24 Sweden 80→8 4 105
UK ≤10 2.5b 105
≤3 1.5c 105
Australia 60→5 6d 170
USA 60→5 4-6 308
48.8→12.7e 6 70
a Product should be cooled within 5 h to 7°C, subsequent cooling to 4°C should occur with in 24 h after finishing the cooking process; b Food stored in 80-mm trays; c Food stored in 40 mm and 10 mm trays; d Cooling from 60°C to 21°C within 2 h, subsequent cooling to 5°C within 4 h; e Cooked beef, roast beef, and corned beef

Growth during cooling
57
data from literature on ground beef showed that C. perfringens grew faster during cooling in pea soup than during cooling in ground beef. Growth of less than one log cycle is observed in FTG and ground beef when a linear cooling rate of 10°C/h is applied from 60°C to 12°C (corresponding to a 3.5-h cooling period in our experiments). At a cooling rate of 7.5°C/h or 5°C/h (corresponding to a 4.7-h and 7-h cooling period in our experiments, respectively) cell counts increase rapidly in both FTG and ground beef, but only after a 260-min lag phase 272. Another study of ground beef shows that spores do not germinate during log linear cooling from 54.4°C to 7.2°C in 15 h (15°C is reached after approximately 8.5 h), only during a log linear cooling period of 18 h (15°C is reached after approximately 10 h) do spores germinate and grow in cooked ground beef 185. These differences show the difficulty to extrapolate data from different studies and indicate the necessity of product specific testing with a broad range of strains.
However, our experiments with pea soup and the above-mentioned data from literature suggest that more rigorous cooling is required than the 13 h indicated by Snyder 283. It must be noted that none of the above-mentioned products satisfy law stated by different countries (Table 3). Legal cooling requirements in The Netherlands, Australia, and the USA may not even be sufficient in preventing growth of C. perfringens in pea soup. Taking into account that 19% of Dutch companies do not properly cool foods, that 26% of food service establishments in the USA would not meet standard microbiological cooling criteria 108, that 15% of Dutch household refrigerators constantly surpass 7°C 85, and that 29 % of kitchens throughout USA improperly cool leftovers 209, high-risk situations are likely to occur. To meet criteria set by law, food must either be cooled in pans <1 inch deep or be cooled in pots in a sink filled with ice water, and should be stirred every 15 min to reduce its temperature to 7.2°C in <4 h 185. These practices are time and space consuming, and use of better refrigerating facilities, such as a blast-chiller, seem to be a better solution. It should be noted that even when pea soup is properly cooled and no multiplication has taken place, spores may have germinated during cooling and cells would survive the cooling process. Subsequent refrigeration will only reduce these cell numbers to a certain extent. This is supported by data from Strong and Ripp 289, and Woodburn and Kim 329 that show approximately 50% reduction of cell numbers in turkey stored at 5°C for 48 h and turkey stuffing held at 5°C for 6 days, respectively. Since 41% of household refrigerators in The Netherlands exceed a temperature of 7°C, including 15% that constantly surpass this temperature 85, and data from the USA show that 10-21% and 4-13% of cooling devices at home and in the retail chain, respectively, exceed 10°C 83,312, growth of C. perfringens may even occur during storage of food.
Taking the production process of pea soup into account, several critical control points can be pointed out. Preparation and cooking of pea soup may introduce spores and cells into the pea soup. Boiling will eliminate vegetative cells, but spores of some C. perfringens are known to be very heat stable: D99°C of 14-30 min 52,178, and D100°C of 6-80 min 41,256 and cooking may just serve as an activation step. Since,

Chapter 4
58
according to Dutch law, cooked foods must be cooled uncovered to facilitate cooling, cross contamination or recontamination with vegetative cells may occur at this stage. Our experiments showed that these heat-activated spores and cells would multiply during the cooling period set by Dutch law: 3.3 h for cooling down from 50°C to 15°C. Data of cooling pea soup and literature show that foods take even longer time periods to cool down. Although Dutch law is not stringent enough to inhibit growth of C. perfringens in soup, these mild cooling standards are not met by 19-26% of Dutch food service establishments. Subsequent refrigerated storage of pea soup for 84 h did not sufficiently reduce cell and spore numbers. Reheating pea soup till 60°C to kill vegetative cells 272 is, therefore, essential. It should be noted that reheating may activate germination of spores that were left in the cold soup. Thus, great care must be taken with regard to hygienic practices and fast cooling of foods is essential.

Growth during cooling
59

60
Spores & Cells, Media & Modeling

5 Re3frigerated storage is an important step in the preparation of foods and inadequate storage is
one of the main causes of food poisoning outbreaks of Clostridium perfringens. Therefore, growth
and germination characteristics of C. perfringens in a temperature range of 3�42°C were
determined in Fluid Thioglycollate broth (FTG) and Dutch pea soup. To study the effect of
adaptation, cells were either inoculated from a 37°C pre�culture or from a temperature�adapted
pre�culture. Membrane fatty acid patterns were determined at all temperatures to examine the
effect of temperature on membrane composition. Spores were either inoculated with and without
heat treatment. Adaptation of cells did not influence growth rate nor lag phase. Growth in pea
soup, however, was slower and lag phases tended to be more extended compared to FTG. No
growth was observed at temperatures ≤10°C and death rates in pea soup were higher than those
in FTG at these low temperatures. Cells preserved the membrane fluidity by reducing the arachidic
acid content and increasing the lauric acid content when the temperature dropped. This resulted
in a net reduction in chain length. Microscopic analysis of cells grown at 15°C revealed a
morphological change: cells were elongated compared to those grown at 37°C. These data
demonstrate the ability of C. perfringens to adapt to lower temperatures. However, this did not
influence growth characteristics compared to non�adapted cells. Spores of C. perfringens did
germinate at all temperatures with and without heat�activation. Combining this fact with the
extended survival at low temperatures emphasizes the need for adequate heating of refrigerated
foods before consumption to eliminate health risks due to C. perfringens.
BEHAVIOR OF CLOSTRIDIUM PERFRINGENS AT LOW TEMPERATURES
Submitted as A.E.I. de Jong, F.M. Rombouts, and R.R. Beumer. Behavior of Clostridium perfringens at low temperatures.

Chapter 5
62
INTRODUCTION
Food poisoning outbreaks of Clostridium perfringens primarily involve foodstuffs, which were abused during handling: either the cooking process or the cooling process was insufficient. These conditions may arise during bulky food processes, such as production of Dutch pea soup. Traditional preparation of this viscous soup is quite laborious and more than 1-day quantities may be prepared and stored for the other day. Thus, proper cooling and storage of the product is essential.
Data from Germany, Denmark, Finland, Sweden, and the United Kingdom
10,11,13,14,16 demonstrate that inadequate refrigeration and storage contributed for 18% to food borne disease outbreaks in the period from 1993-1998. Refrigerated storage temperatures should not surpass 7°C 21, but the average temperature of household refrigerators in The Netherlands exceeds this temperature in 41% of the cases, while 15% of the refrigerators constantly surpass 7°C 85. A survey among Dutch food processing companies shows that 30% of the companies do not meet temperature standards set by Dutch law, i.e. storage temperatures were either not <7°C or hot-holding temperatures not >60°C 206. Data from literature show that 10-21% and 4-13% of cooling devices at home and in the retail chain, respectively, exceed 10°C
83,312. These improper temperatures may allow growth of C. perfringens, since the mathematically predicted minimal growth temperature of this pathogen is 10.1°C with a 95% confidence interval of 6.2-16.5°C 186.
In the present study, the behavior of C. perfringens at refrigeration temperatures and (sub)optimal growth temperatures was studied. Growth and germination experiments were conducted in FTG and in Dutch pea soup at temperatures between 3-42°C. The effect of temperature adaptation on growth kinetics was studied, as well as the effect of incubation temperature on cell membrane fatty acid composition and on germination rate of (non-) heat-activated spores.
MATERIALS AND METHODS
Strains Clostridium perfringens strains 82046, 82049, 82100, 95011, WU90103, WU01147, and ATCC 13124 were kindly supplied by the Dutch Inspectorate for Health Protection and Veterinary Public Health (KvW). Strains WU9910 and D10 were obtained from the National Institute of Public Health and the Environment (RIVM, Bilthoven, The Netherlands). Strains ATCC 3624 and ATCC 12916 were acquired from the State Institute for Quality Control of Agricultural Products (RIKILT, Wageningen, The Netherlands). Strains WU00128, WU00129, WU00130, and WU00132 were isolated in our laboratory from ground beef, instant gravy, curry and oregano, respectively. Strains WU01147 and D10 were isolated from food involved in an outbreak.

Behavior at low temperatures
63
Inoculum Stocks of vegetative cells, grown overnight in Fluid Thioglycollate medium (FTG; Oxoid, Basingstoke, England), were stored at –80°C in 20% glycerol (v/v) plus glass beads. Inocula were prepared from stock cultures by transferring a glass bead into 10 ml FTG tubes (24 h) and subsequently streak plating on Tryptose-Sulphite-Cysloserine agar (TSC; Merck, Darmstadt, Germany) without egg yolk and cycloserine. Plates were incubated anaerobically (24h; Anoxomat system: Mart Microbiology BV, Lichtenvoorde, The Netherlands; jars flushed with an 80% N2, 10% CO2 and 10% H2 gas mixture plus catalyst) and one separate colony was used to inoculate an FTG pre-culture (37°C; overnight).
From strains 82100, 95011, D10, WU9910, WU00128, WU00129, WU00130, WU00132, ATCC 3624, and ATCC 13124 spores were obtained using Duncan and Strong medium 91 with a 10% inoculum from an overnight FTG pre-culture. Spores were washed twice and concentrated in distilled water by centrifugation (12,000 × g), and subsequently stored at 4°C. Spores were heat activated at 70°C for 20 min just before inoculation.
FTG was freshly steamed before use (20 min, 100°C) and no further effort was taken to obtain anaerobic conditions. All incubations were at 37°C unless stated otherwise and anaerobic incubation conditions were obtained using the Anoxomat system.
Growth and germination experiments Freshly steamed FTG and sterilized mashed pea soup (kindly provided by Struik Foods Voorthuizen BV, Nijkerk, The Netherlands; pH 5.86; aw: 0.985) were used as growth media. Growth experiments were conducted with strains 82046, WU90103, WU00128, WU01147, D10, and ATCC 12916. FTG was inoculated from a stationary-phase pre-culture and aerobically incubated at desired temperatures (42°C, 37°C, 30°C, 25°C, 15°C, 10°C, 7°C, and 3°C). The optical density (OD600nm) and cell counts (on TSC base without overlayer at 37°C; spiral plater, Eddy jet, Leerdam, The Netherlands) were followed in time till stationary-phase was reached for temperatures ≥15°C. Cell numbers at temperatures <15°C were followed for 8 weeks. Cells were microscopically examined in exponential phase and cell specific gravity was measured using Percoll (Amersham Pharmacia Biotech AB, Uppsala, Sweden). Experiments were carried out in 100 ml flasks with rubber sealed screw caps. Samples were aseptically taken through the rubber seals with a sterile syringe after thoroughly shaking the flasks. For growth experiments in pea soup, disposable 50 ml screw cap tubes (Greiner-Bio One GmbH, Frickenhausen, Germany) were used. Tubes were filled with approximately 15 ml mashed pea soup and sterilized. After cooling down till room temperature tubes were immediately inoculated with 1 ml of a diluted stationary-phase FTG pre-culture and thoroughly mixed. Tubes were incubated at 37°C, 20°C, 15°C, 10°C, 7°C, and 3°C and cell numbers were followed in time. The viscosity of mashed pea soup did not allow drawing samples from a batch, thus, for each data point a different tube was used. Growth experiments were

Chapter 5
64
conducted with adapted and non-adapted cells. Cells were adapted to the required incubation temperature in a stepwise manner. Temperature steps used were: 42→37→30→25→20→15°C. Cells did not grow at 10°C, thus, at incubation temperatures ≤10°C cells adapted to 15°C were used as inoculum. Non-adapted cells were pre-incubated at 37°C. Growth in pea soup was studied with adapted cells only, while in FTG both types of cells were used. Growth curves were generated for each growth condition by fitting the Gompertz function through the data using TableCurve 2DTM from Jandel Scientific Europe (Erkrath, Germany).
Germination experiments were conducted in the same way as the growth experiments. FTG was inoculated with either heat-activated or non-heat-activated spores; pea soup was inoculated with heat-activated spores only. Inoculation levels ranged between 3.8-5.0 log N/ml in FTG and 4.0-5.5 log N/ml in pea soup. Germination of strains 82100, D10, WU00130, WU00132, and ATCC 3624 was followed on a weekly basis for 8 weeks by counting the number heat-resistant spores (20 min, 70°C) after storage at 37°C, 20°C, 15°C, 10°C, 7°C, and 3°C in both FTG and pea soup; germination of strains 95011, ATCC 13124, WU9910, WU00128, and WU00129 was followed in FTG only.
Fatty acid analysis Cells grown in FTG at different temperatures (see growth experiment) were harvested at late-exponential phase. To obtain a desired concentration of cells (50 ml OD600nm ≥0.5), different volumes of cells were harvested at different temperatures. Cells were washed twice with water, concentrated and freeze-dried. Lipids were extracted and esterified according to Isken et al. 168. The resulting fatty acid methyl esters were subjected to gas chromatography (GC; Chrompack CP-9000, Delft, The Netherlands) using a Chrompack WCOT fused silica column packed with CP-Sil 88 with the following temperature program: 100°C (10 min) to 220°C (5 min) at 4°/min
Figure 1. Average growth rate (A) and lag phase (B) of six different strains of Clostridium perfringens (5 strains at 15°C) in FTG and pea soup. Adapted and non-adapted cells were used in FTG; adapted cells only were used in pea soup. Error bars indicate standard deviations between the different strains

Behavior at low temperatures
65
with a carrier gas (He) flow rate of 40 ml per min. Fatty acids were identified by aid of a standard bacterial fatty acid methyl esters CP mix (Supelco, Bellefonte, PA, USA). Relative amounts of fatty esters were calculated from the peak areas of the methyl esters using a Chromatopac C-R6A integrator (Shimadsu, Kyoto, Japan).
RESULTS
Growth rate and lag phase were calculated from growth curves of six different C. perfringens strains in FTG and pea soup using the Gompertz function (Figure 1). Growth rates increased with increasing incubation temperatures. Growth in pea soup was somewhat slower than in FTG. Generation times in FTG at 37°C ranged from 14-22 min (average: 19 min) and at 15°C generation times ranged from 1.2-2.3 h (average: 1.6 h) and 2.3-2.8 (average: 2.5 h) for adapted cells and non-adapted cells, respectively. In pea soup generation times ranged from 15-48 min (average: 29 min) and 3.3-6.3 h (average: 4.1 h) were measured for both temperatures, respectively, for adapted cells. Lag phases in FTG were quite similar for temperatures ≥20°C. At 15°C an increase in lag phase was demonstrable due to large strain deviations; the minimal lag phase time did, however, hardly change. Lag phases tended to be longer in pea soup at 20°C and 37°C, but not at 15°C. Adaptation of cells affected neither growth rate nor lag phase.
At refrigeration temperatures no growth was observed for any strain of C. perfringens (Figure 2). Reduction of viable cells in FTG was fastest at 10°C and slowest at 3°C. This pattern was reversed for average results in pea soup, but no clear pattern was observed for individual strains and most temperature/strain combinations resulted in a reduction ≥3.0 log cycles after three weeks. No effect was observed by adaptation, except for cells incubated at 3°C: the reduction of cell numbers was greater for adapted cells. This effect was mainly caused by food poisoning strains
Figure 2. Behavior of five different strains of Clostridium perfringens in FTG and pea soup at refrigeration temperatures. ——: FTG; ----: pea soup; ∆: 3°C; □: 7°C; ○: 10°C; open symbols: adapted cells; closed symbols: non-adapted cells

Chapter 5
66
D10 and WU01147, which died off more quickly than the other strains. Strain WU01147 showed the highest death rates in all cases for temperatures ≤15°C.
Both the number of cfu and the optical density (OD600nm) were followed in time. Comparison of both types of growth curves showed discrepancies in OD versus cfu numbers for cells grown at different temperatures: cells grown at low temperatures (15-20°C) tended to have reduced optical densities compared to cells grown at higher temperatures (37-42°C), suggesting cells to be smaller at low temperatures. Microscopic analysis revealed the opposite: cells grown at 15°C were elongated compared to cells grown at 37°C (Figure 3). However, cells grown at 15°C tended to clump together and the specific gravity of the cells grown at 37°C was higher than those grown at 15°C (data not shown). Maximum cell numbers at all incubation temperatures were 7.8 ± 0.4 log N/ml.
The membrane fatty acid compositions of six different C. perfringens strains were determined (Figure 4a). The membranes of these six strains mainly (93% at 37°C) consisted of saturated fatty acids with an even number of C-atoms. Adaptation to lower temperatures was achieved by changing the ratio of C12 versus C20 fatty acids
Figure 3. Clostridium perfringens strain WU90103 cells grown at 37°C (A) and 15°C (B) in FTG (100*10 enlargement)
Figure 4. Averaged fatty acid composition of six (five strains at 20 and 25°C) different strains of Clostridium perfringens in FTG at six different incubation temperatures. Error bars indicate standard deviations between different strains
A
A B

Behavior at low temperatures
67
(Figure 4b) and hardly by raising the amount of unsaturated fatty acids (Figure 4a). Spores of C. perfringens did germinate without heat-activation in FTG (Figure
5a), but this process was more pronounced with heat-activation (Figure 5b). At temperatures ≤10°C spores of most strains maintained heat stability. However, non-heat-activated spores of strain WU00132 germinated for 60% after 42 days storage at 3°C and heat-activated spores of strains D10 and WU00132 germinated for 89% under equal conditions. At higher temperatures, more deviation in germination was observed. Heat-resistant spore numbers were only reduced below the detection limit (20 spores/ml) when spores were heat-activated and subsequently incubated at 37°C for 2 weeks. Three strains retained ≥90% of heat-resistant spore numbers after 6 weeks of incubation at 37°C without prior heat treatment and only two strains dropped below the detection limit at this condition. Germination occurred at a slower rate in pea soup than in FTG (Figure 5c): spore numbers were reduced below 1% within 7 days when incubated at 37°C in FTG, whereas it took 35 days to obtain this reduction in pea soup stored at the same temperature for all strains except strain 82100. This strain germinated for only 90% at this condition. At 20°C spore numbers were reduced to 5-40% in pea soup, while spore levels of all strains were reduced to ≤15% in FTG. However, food poisoning strain D10 almost fully germinated in pea soup with remaining spore levels of 10-14% at temperatures ≤15°C. The germination pattern in pea soup at low temperatures was surprising: at 3°C the averaged germination was 69% after 42 days, while at 7°C to 20°C averaged germination was only 47%. DISCUSSION
Market trends show an increased interest of consumers in fresh, refrigerated foods. Preferably, these foods are mildly processed to enhance their image as fresh and
Figure 5. Percentage of spores of Clostridium perfringens strains in FTG without heat-activation (A), with heat-activation (B), and in pea soup with heat-activation (C) after 7 weeks of storage at various temperatures. Different lines indicate individual strains

Chapter 5
68
healthy. The safety of these products greatly relies on proper refrigeration. However, refrigeration temperatures are frequently inappropriate and the estimated minimal growth temperature of C. perfringens is 10°C 186. Some studies have been conducted addressing the effect of improper refrigeration on growth of C. perfringens, but these studies are very limited, since only 1-3 strains are tested 41,178,182,285. In this study, we tested the ability of 49 strains, isolated from random food samples and foods involved in C. perfringens food poisoning outbreaks, to grow at 10°C and 15°C (data not shown). All strains failed to grow at 10°C, contrasting with the report about growth of C. perfringens at 6°C 47. However, growth at 6°C could not be maintained for a longer period by these researchers, thus invalidating the observation. Growth of C. perfringens at 15°C was observed in 94% of the strains tested at our laboratory, which is in accordance with data from literature that show no growth 41,107,227,250 and growth 122,176,182,192,227,250,285 at 15°C, respectively. Although not tested in this research, some strains of C. perfringens are able to grow at 12°C in food 285. To investigate the risk of growth of C. perfringens at improper refrigeration temperatures, growth characteristics of some strains were studied in FTG and pea soup.
Growth rates declined with dropping temperatures, but lag phases remained similar in a range of 20-42°C. Comparison of data from FTG and pea soup showed that growth in pea soup was slower, but growth rates in pea soup were proportional to those in FTG. These data suggested that generation times in a temperature range from 15-37°C were only affected by incubation temperature and not by intrinsic characteristics of pea soup, such as pH and aw
41. Our data on growth rates in pea soup at 15°C showed that growth in our pea soup was slower than in ground turkey, but much faster than in ground beef 182. Comparison of growth characteristics of C. perfringens in pea soup with those in ground beef reveals some apparent differences. Growth at 37°C was 1.7 times slower in pea soup than in ground beef, but at 15°C growth was eight times faster in pea soup than in anaerobically incubated ground beef. Additional data on the products are minimal, only pH values are given: 5.86, 6.25, and 6.46 for pea soup, ground beef, and ground turkey, respectively. The pea soup used contained 0.8 % (w/v) salt and had a aw of 0.985. Although pea soup had a fairly low pH value and contained salt, growth in pea soup was faster than in ground beef. However, the most rapidly growing strain tested would take 10 h (without lag phase) to increase 1 log unit in pea soup at 15°C. Refrigerators at home and in the industry regularly violate temperature standards, but a 10-h abuse period at 15°C is unlikely to occur. The possibility to grow at 12°C 285 and the fact that 10-20% of refrigerators exceed a temperature of 10°C 83,166,251,312, is more likely to impose health risks on refrigerated foods.
On the other hand, refrigeration temperatures ≤10°C will reduce cell numbers. Our data on incubations at these temperatures showed cell numbers to decrease with 2.5 and 3.7 log units in FTG and pea soup, respectively, in a 3-week period. Cell numbers in FTG declined at a slower rate at low temperatures than at higher refrigeration temperatures, which has been demonstrated for foods as well 68,285. Death rates in pea soup at temperatures ≤10°C were higher than death rates in FTG,

Behavior at low temperatures
69
but cell numbers of C. perfringens did not decrease more than 2 log units within a 7-day period. Combined with the fact that freshly prepared foods should not be stored for more than three days 21, it was demonstrated that proper refrigeration did not reduce the risk of food poisoning caused by this pathogen.
Lag phases in pea soup ranged from 2.2-5.1 h at 37°C, which is similar to lag phases reported in literature 50,137,182. Lag phases at 15°C ranged from 1.0-6.3 h in pea soup, which is quite short since lag phases of 112 h and 238 h have been reported for anaerobic incubation of foods inoculated with C. perfringens and up to 9 days for aerobic incubation 176,182. Lag phases in pea soup at 15°C seemed to be shorter than at 20°C, which is probably caused by the inaccuracy of the experiment; more data points are needed to meticulously calculate lag phases at low growth rates. However, these data showed that lag phases may be quite short in pea soup at 15°C. This will not influence food safety aspects concerning C. perfringens, since growth at this temperature is too slow.
Adaptation of cells, on the other hand, will affect food safety aspects and cells may adapt to refrigeration temperatures in kitchen environments. Therefore, the effect of adaptation to low temperatures was tested for C. perfringens in FTG. No difference in growth rate was observed between adapted and non-adapted cells, which was in accordance to our expectations, since it is assumed that exponentionally growing cells instantaneously adapt to growth temperatures 40. However, adaptation of cells to low temperatures did not influence lag phase either. This finding was somewhat surprising, since lag phases are influenced by temperature downshifts 40. However, cold-shock induced lag phases are dependent on growth phase and the range of the temperature shift 40,302. In our experiments, stationary cells were used. These cells are hardly susceptible to cold-shock. Furthermore, a minimal temperature difference of 17-23°C is needed to obtain detectable lag phase differences for C. perfringens 302. This is in accordance with our data in FTG: lag phases are similar for non-adapted and adapted cells for temperature differences of ≤22°C.
Although growth characteristics were not affected by adapting cells to low temperatures, cells did change the fatty acid composition of the cell membrane to a more favorable one at low temperatures. Bacteria control the fluid, liquid-crystalline state of the membrane by incorporating lower-melting-point fatty acids into the membrane when the temperature drops. Lower-melting-point fatty acids have reduced chain lengths or contain double bonds or methyl groups 194. The way to change the fluidity of the membrane is species-specific. C. perfringens reduced the fatty acid chain length at lower temperatures only by reducing the arachidic acid content and concurrently increasing the lauric acid content. Screening the genome map of C. perfringens 13 proved the absence of desaturases 274, which may explain the lack of unsaturated fatty acids at low temperatures. The inability to synthesize unsaturated fatty acids may be the cause of the mesophilic character of C. perfringens. Further study of the genome map of C. perfringens shows the presence of a putative cold-shock protein. The role of this protein is unknown and data on

Chapter 5
70
Escherichia coli and Listeria monocytogenes show that cold-shock proteins are not necessarily induced at low temperature, but are also induced by other environmental stresses 103,321. Further study of this protein must reveal its function, which was not in the scope of this article.
Our results indicated that cells shifted from 37°C to 15°C adapted the fatty acid composition of the membrane, however, this adaptation process did not affect growth characteristics compared to cells pre-cultured at 15°C. Similar results are reported in literature: growth at low temperature occurs before the fatty acid composition of the membrane is shifted to a more suitable one 36,271. On the other hand, low-temperature adapted cells were unable to grow appropriately at 37°C. When cells were shifted from 15°C to 37°C after an 8-week incubation period, growth rates were strongly reduced: cell numbers increased 3 log units after ≥8.5 h, while cells inoculated from a 37°C pre-culture will only take 4 h to reach this number, as calculated from averaged Gompertz growth characteristics for the strains tested. This is in accordance with literature that states that short-time static temperature abuse does not result in growth; longer incubation periods, however, do 176,178,182,192. Thus, adaptation of C. perfringens cells to lower temperatures does not add extra risks in a food production process; adaptation even limits the risk of short-time temperature abuse.
Cells of C. perfringens not only changed the fatty acid composition of the membrane when grown at lower temperatures, but also changed physical appearance: cell elongation occurred. Cell elongation as been described for Salmonella Enteritidis during chilling and Clostridium tyrobutyricum and Clostridium botulinum form elongated cells at low pH 106,328. This increase in cell length of C. botulinum was not associated with poor growth. Contrasting with the results of C. tyrobutyricum, cell cultures of C. perfringens grown at 15°C showed a reduced optical density at equal cell numbers compared to cells grown at 37°C; whereas at equal cell numbers, stressed cultures of C. tyrobutyricum showed an increased optical density in time. The decreased optical density at low temperatures may be explained by clustering of cells (microscopic analysis, data not shown) and loss of specific gravity (data not shown).
Germination of spores may be even more complex than growth. It has been reported that one strain did fully germinate in cooked meat, but failed to germinate in a growth supporting medium 41. Strains tested in this research did germinate poorly at temperatures ≤10°C without heat activation. Heat-activated spores of some strains did, however, germinate for 90% at temperatures ≤10°C in FTG and in pea soup. Although outgrowth will not necessarily follow 32, it implies a risk for further processing. Subsequent outgrowth during improper handling may cause health risks. For all strains tested in both pea soup and FTG germination was reduced in pea soup, except for strain D10. This food poisoning strain germinated equally well in both media. The inhibiting effect of pea soup on germination happens to co-occur with growth inhibition.
On the basis of this research’s findings on growth and germination characteristics of C. perfringens in FTG and pea soup, it can be concluded that growth rate and lag
Behavior at low temperatures
71
phase were not influenced by adaptation of cells to low temperatures and that germination occurred with and without heat-activation at all temperatures tested between 3-37°C. Cells changed their morphology and membrane fatty acid composition when grown at low temperatures, but failed to grow at temperature ≤10°C. Other factors such as the lack to synthesize unsaturated fatty acids, the unknown role of a putative cold-shock protein may contribute to the fact that C. perfringens is not to be considered psychrotrophic. In fact, C. perfringens died off when stored at temperatures ≤10°C. However, cells stored at 3°C in FTG remained stable for up to 7 weeks. Pea soup negatively affected all growth and germination characteristics, but spores were still able to geminate at 3°C. However, considering the inadequate refrigerator temperatures in households and in the retail chain, dangerous situations are likely to occur. Therefore, foods must be heated properly (>60°C) before use to limit consumer risks for C. perfringens food poisoning.

72
Spores & Cells, Media & Modeling

6 MODELING GROWTH OF CLOSTRIDIUM PERFRINGENS
IN PEA SOUP DURING COOLING Clostridium perfringens is a ubiquitous pathogen. This pathogen mainly causes food poisoning
outbreaks when large quantities of food are prepared. The probable reason for this is the difficulty
to sufficiently heat and cool down large portions of food. C. perfringens is regularly isolated from
pea soup in The Netherlands. Therefore, a model was developed to predict the effect of different
cooling procedures on growth of this pathogen during cooling of pea soup. Firstly, a growth rate
model based on interpretable parameters was used to predict growth during linear cooling of pea
soup. Secondly, a temperature model for cooling pea soup was constructed by fitting the model
(α as fit parameter) to experimental data published earlier. This cooling model was used to
estimate the effect of various cooling environments on average cooling times, taking into account
the effect of stirring and product volume. The two models were combined to predict growth of C.
perfringens during various cooling scenarios. The combined model indicated that cooling
requirements stated by Dutch law were met by stirring every 60 min for a volume of 3.75 l
(R=0.1225 m) of pea soup in a 3°C air�vented refrigerator. Decreasing the heat transfer
resistance of the surroundings allowed for no stirring at all. Cooling in water was, therefore,
effective in reducing the average cooling time, but other precautions have to be taken as well to
meet cooling requirements for larger volumes. Reducing the volume to 780 ml sufficiently
shortened cooling times in our air�vented cabinet (3°C) without the need to stir. Cooling
requirements stated by Dutch law (60°C to 7°C within 5 h) correlated well with growth limitations
set by USA law for cooling of food. Validation of the combined model showed that cell increase of
C. perfringens during cooling of pea soup in various cooling environments was accurately
predicted. It was also demonstrated that the combined model could be used to predict growth of
C. perfringens in different volume sizes. It was concluded that the combined model can be a
useful tool for designing Good Manufacturing Practices (GMP) procedures.
To be submitted A.E.I. de Jong, R.R. Beumer, and M.H. Zwietering. Modeling growth of Clostridium perfringens in pea soup during cooling.

Chapter 6
74
INTRODUCTION C. perfringens is a pathogen, which is present in soil and dust and is part of the endogenous flora of humans and animals. Due to its ubiquitous character C. perfringens is present in many raw foods, spices and meats. Plants become contaminated with this pathogen from contact with soil, while meat is contaminated during slaughter and by cross-contamination during further processing 51,72,295. Therefore, foods containing spices and/or meat are at risk to cause C. perfringens-related food poisoning outbreaks.
A survey on the presence of Staphylococcus aureus, Bacillus cereus, and C. perfringens in ready-to-eat meals (soups, stews, rice dishes, and Chinese noodles; N=1625) by the Dutch Inspectorate for Health Protection and Veterinary Public Health (KvW) in 2001 demonstrated that soup was the only group of meals in which C. perfringens was present (Nsoup=327, ncontaminated=4=1.2%) 169. In total, eight soup samples were positive for one of the tested pathogens; half of the samples positive for C. perfringens were Dutch pea soup. This soup is composed of several vegetables (green pea, carrot, potato, leek, celeriac, onion, and parsley) and meat (pork meat, such as bacon, leg of pork, and sausage). An additional data set from the KvW on pea soup based on surveillance studies conducted in winter 2002-2003 (N=347) shows that 1.1% of the pea soup samples was contaminated with C. perfringens. Cell numbers ranged from 2.6×10⁵ to 1.5×10⁶ cfu/ml (data not published). Research in our laboratory showed that C. perfringens was able to multiply in pea soup during linear cooling from 50°C to 15°C in periods of 3 h to 10 h; cell numbers increased with 1.2-5.4 log N/ml for vegetative cells, spores germinated and subsequent cell numbers increased with 1.0-2.7 log N/ml 174.
Growth of pathogens and spoilage bacteria in foods should be limited or prevented. Models have been developed to estimate the effects of different preparation steps of food on bacterial growth. These models show which processing steps are unnecessary harsh or are not sufficiently controlled and need to be optimized. Cooling and hot holding of foods are critical steps in controlling growth of C. perfringens 108. The study of Fazil et al. 108 showed that hot holding is the most critical step for growth of C. perfringens since inadequate procedures result in high cell numbers. Cooling, however, is assumed to cause most problems since this procedure is more difficult to control.
Preparation of pea soup from its original ingredients is laborious, which discourages homemade preparation of this soup. However, many restaurants have pea soup on their menus in The Netherlands during wintertime and this soup can be purchased (frozen) at the local butcher’s. Production of larger quantities of pea soup increases the risk on growth of C. perfringens during cooling. Therefore, the aim of this research was to predict growth of C. perfringens in pea soup during various cooling scenarios by use of a model.
Initially, a model based on growth rates of microorganisms as a function of temperature, pH, and water activity was used to predict growth of C. perfringens

Modeling growth during cooling
75
during linear cooling of pea soup. Earlier published data were used to validate this model 174. Furthermore, a model was created to predict cooling profiles of pea soup. This model was fitted on earlier published data on cooling of 3.75 l of pea soup 174. This cooling model was then used to study the effect of different cooling procedures on the cooling time, as well as the effect of soup volume on cooling times. The cooling model was subsequently combined with the growth model to predict the effect of different cooling procedures on growth of C. perfringens. Finally, the combined model was validated with newly measured cooling curves of pea soup including subsequent growth of C. perfringens.
MODELS Growth model C. perfringens Growth of microorganisms can be divided in several stages. Most models distinguish three stages: lag phase, exponential growth phase, and stationary phase. However, our model predicted growth of C. perfringens during cooling using only the exponential growth phase (lag phase was assumed zero). The increase in cell numbers in a time increment ∆t was calculated using equation (1).
t
tt eNN ∆⋅−= µ1 (1)
Where Nt is the number of microorganisms present at time t, Nt-1 is the number of organisms present after the previous time step, µ [h-1] is the specific growth rate of the microorganism (calculated with equations 2-5), and ∆t [h] is the time difference between t-1 and t.
Growth rates of microorganisms are affected by product characteristics. Therefore, a gamma-type growth model was used to take into account the effect of temperature, water activity (aw), and pH on the growth rate of C. perfringens. This type of model has been described by others to predict the effect of temperature, water activity and/or pH on growth rates of Escherichia coli, Lactobacillus amylovorus, and Lactobacillus curvatus 230,231,260. The model is based on the independency of the previous mentioned factors on the growth rate of the microorganism and is given by
)()()( wopt apHT γγγµµ = (2)
Where µopt is the optimal specific growth rate of the microorganism, γ(T) is the relative temperature effect on the specific growth rate, γ(pH) the relative pH effect, and γ(aw) the relative effect of the water activity.
The relative effect of the temperature used is given by the temperature equation of Rosso (equation 3) 260, the γ-function of pH is given by the pH equation of Rosso

Chapter 6
76
(equation 4) 260, and the γ-function of water activity is assumed linear (equation 5)
323.
[ ])2)(())(()(
)()()(
minmaxminmin
max2
min
TTTTTTTTTTT
TTTTT
optoptoptoptopt −+−−−−−−−
=γ (3)
))(())((
))(()(
minmaxmin
minmax
pHpHpHpHpHpHpHpH
pHpHpHpHpH
optoptopt −−−−−−−
=γ (4)
min,
min,
1)(
w
www a
aaa
−−
=γ (5)
Where Tmin, pHmin, and aw,min are the theoretical minimum temperature, pH, and water activity for growth, respectively. Tmax and pHmax are the theoretical maximum temperature and pH for growth, respectively, and Topt and pHopt are the optimal temperature and pH, respectively.
Cooling model of pea soup Food products can be cooled in different ways: in still air, in circulating air, in water. These methods differ in external heat transfer resistance. Therefore, a model was used that includes the Biot number (Bi); this number indicates the ratio of heat transfer resistance between the product and its surroundings. The model includes convective heat transfer effects only. Heat transfer of foods stored in cooking pans is modeled by multiplying the heat transfer of an infinite cylinder by the heat transfer of an infinite slab 277 (equation 6).
slabcylinderpan uuTT
TTu ×=
−−
=∞
∞
0
(6)
Where u is the fraction of non-transferred heat (1≥u≥0), T is the temperature of the product, T∞ is the temperature of the surroundings, and T0 is the temperature of the product at t=0.
To solve equation (6) one initial condition (7) and two boundary conditions (8, 9) are set:
t = 0 0<X
x<1 0
0,TT
X
x = (7)
In words: The initional temperature is constant and equal to T0

Modeling growth during cooling
77
t>0 0=X
x 0
0
=
∂∂
=X
xx
T (8)
In words: The temperature profile is symetric around the center
t>0 1=X
x )( ,1
1t
X
xTT
x
T −=
∂∂
∞= λ
α (9)
In words: The heat flux at the surface equals the external transfer
Where X
x can be either
R
r or
L
l.
For an infinite cylinder the equation of u is given by 64
)()(
)(2
022
0
1
2
nn
n
n
Focylinder
JBiR
rJ
eBiu n
µµ
µµ
+= ∑
∞
=
− (10)
Where Bi is defined by equation (11), µn are eigenvalues satisfying µn J1(µn) = Bi J0(µn), Fo is given by equation (12), J0 and J1 are Bessel functions of the first kind of zero and first orders, respectively, r is the place coordinate, and R is the radius of the cylinder.
λαR
Bi = = transport resistance product / transport resistance surroundings (11)
Where α [Wm-2K-1] is the convective-heat-transfer coefficient of the surroundings and λ [Wm-1 K-1] the product’s thermal conductivity.
2R
atFo = (dimensionless time) (12)
Where a [m2s-1] is the product’s thermal diffusion coefficient, which is given by equation (13).
pca
ρλ= (13)
Where ρ [kgm-3] is the product’s specific density and cp [Wskg-1K-1] is the specific heat capacity.
Bi for different environments can be estimated using the following equations for α 39
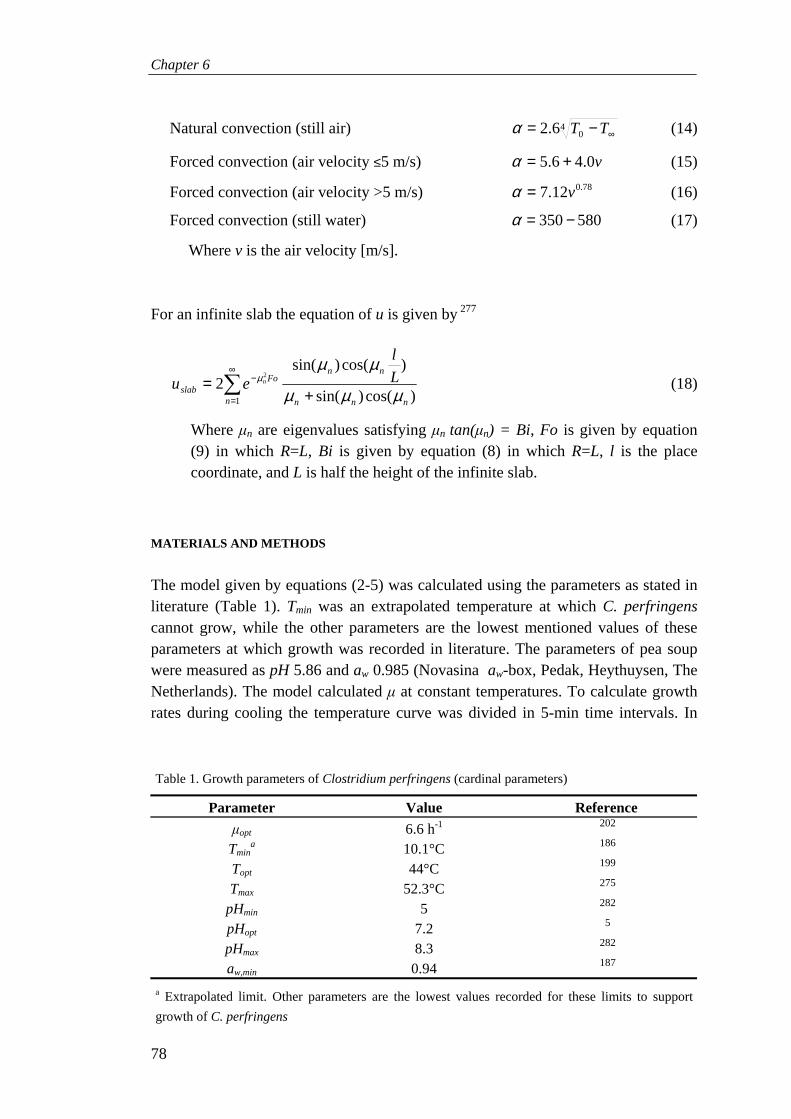
Chapter 6
78
Natural convection (still air) 406.2 ∞−= TTα (14)
Forced convection (air velocity ≤5 m/s) v0.46.5 +=α (15)
Forced convection (air velocity >5 m/s) 78.012.7 v=α (16)
Forced convection (still water) 580350 −=α (17)
Where v is the air velocity [m/s].
For an infinite slab the equation of u is given by 277
∑∞
=
−
+=
1 )cos()sin(
)cos()sin(2
2
n nnn
nnFo
slabL
l
eu n
µµµ
µµµ (18)
Where µn are eigenvalues satisfying µn tan(µn) = Bi, Fo is given by equation (9) in which R=L, Bi is given by equation (8) in which R=L, l is the place coordinate, and L is half the height of the infinite slab.
MATERIALS AND METHODS The model given by equations (2-5) was calculated using the parameters as stated in literature (Table 1). Tmin was an extrapolated temperature at which C. perfringens cannot grow, while the other parameters are the lowest mentioned values of these parameters at which growth was recorded in literature. The parameters of pea soup were measured as pH 5.86 and aw 0.985 (Novasina aw-box, Pedak, Heythuysen, The Netherlands). The model calculated µ at constant temperatures. To calculate growth rates during cooling the temperature curve was divided in 5-min time intervals. In
Table 1. Growth parameters of Clostridium perfringens (cardinal parameters)
Parameter Value Reference
µopt 6.6 h-1 202
Tmina 10.1°C 186
Topt 44°C 199
Tmax 52.3°C 275
pHmin 5 282
pHopt 7.2 5
pHmax 8.3 282
aw,min 0.94 187
a Extrapolated limit. Other parameters are the lowest values recorded for these limits to support
growth of C. perfringens
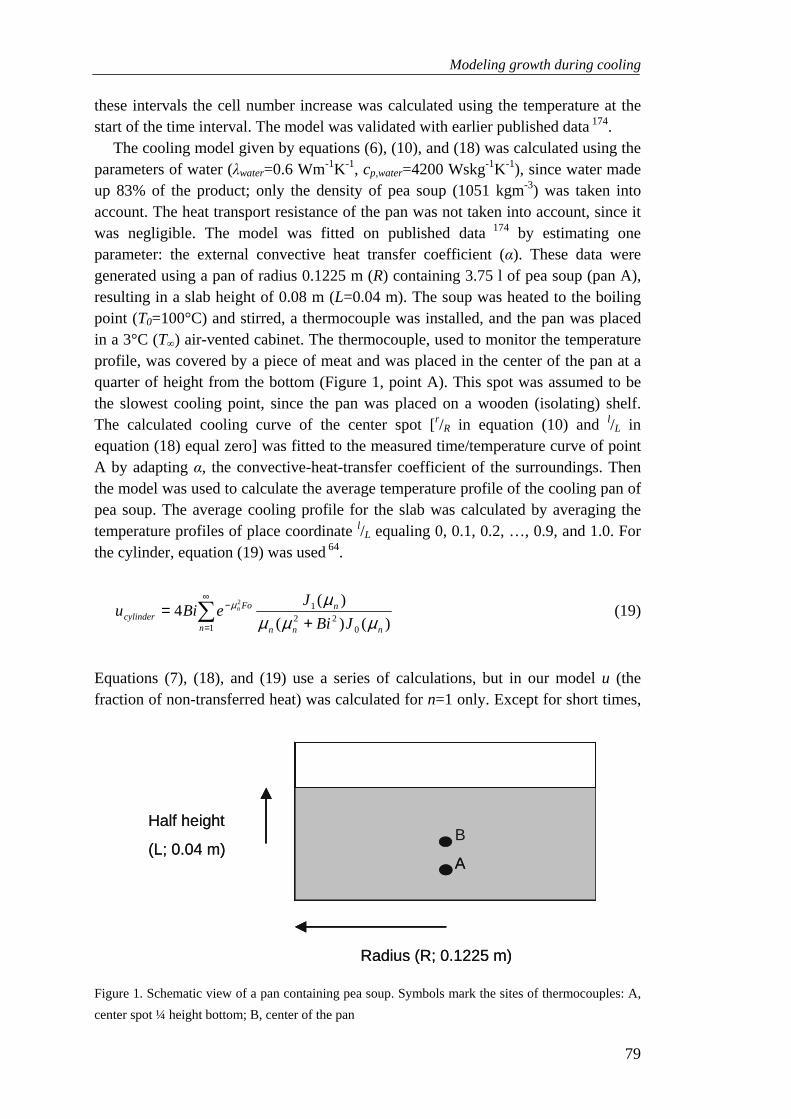
Modeling growth during cooling
79
these intervals the cell number increase was calculated using the temperature at the start of the time interval. The model was validated with earlier published data 174.
The cooling model given by equations (6), (10), and (18) was calculated using the parameters of water (λwater=0.6 Wm-1K-1, cp,water=4200 Wskg-1K-1), since water made up 83% of the product; only the density of pea soup (1051 kgm-3) was taken into account. The heat transport resistance of the pan was not taken into account, since it was negligible. The model was fitted on published data 174 by estimating one parameter: the external convective heat transfer coefficient (α). These data were generated using a pan of radius 0.1225 m (R) containing 3.75 l of pea soup (pan A), resulting in a slab height of 0.08 m (L=0.04 m). The soup was heated to the boiling point (T0=100°C) and stirred, a thermocouple was installed, and the pan was placed in a 3°C (T∞) air-vented cabinet. The thermocouple, used to monitor the temperature profile, was covered by a piece of meat and was placed in the center of the pan at a quarter of height from the bottom (Figure 1, point A). This spot was assumed to be the slowest cooling point, since the pan was placed on a wooden (isolating) shelf. The calculated cooling curve of the center spot [r/R in equation (10) and l/L in equation (18) equal zero] was fitted to the measured time/temperature curve of point A by adapting α, the convective-heat-transfer coefficient of the surroundings. Then the model was used to calculate the average temperature profile of the cooling pan of pea soup. The average cooling profile for the slab was calculated by averaging the temperature profiles of place coordinate l/L equaling 0, 0.1, 0.2, …, 0.9, and 1.0. For the cylinder, equation (19) was used 64.
)()(
)(4
022
1
1
2
nnn
n
n
Focylinder
JBi
JeBiu n
µµµµµ
+= ∑
∞
=
− (19)
Equations (7), (18), and (19) use a series of calculations, but in our model u (the fraction of non-transferred heat) was calculated for n=1 only. Except for short times,
Figure 1. Schematic view of a pan containing pea soup. Symbols mark the sites of thermocouples: A,
center spot ¼ height bottom; B, center of the pan
Radius (R; 0.1225 m)
Half height
(L; 0.04 m)B
A
Radius (R; 0.1225 m)
Half height
(L; 0.04 m)B
A
B
A
B
AA
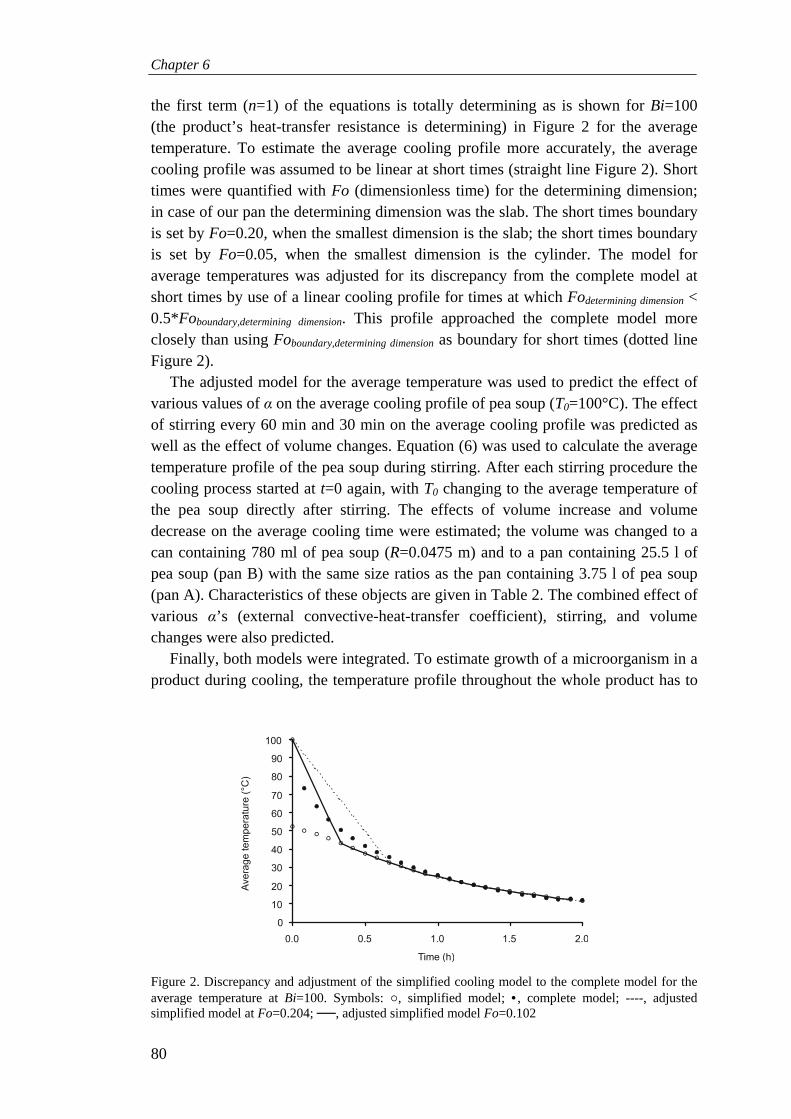
Chapter 6
80
the first term (n=1) of the equations is totally determining as is shown for Bi=100 (the product’s heat-transfer resistance is determining) in Figure 2 for the average temperature. To estimate the average cooling profile more accurately, the average cooling profile was assumed to be linear at short times (straight line Figure 2). Short times were quantified with Fo (dimensionless time) for the determining dimension; in case of our pan the determining dimension was the slab. The short times boundary is set by Fo=0.20, when the smallest dimension is the slab; the short times boundary is set by Fo=0.05, when the smallest dimension is the cylinder. The model for average temperatures was adjusted for its discrepancy from the complete model at short times by use of a linear cooling profile for times at which Fodetermining dimension < 0.5*Foboundary,determining dimension. This profile approached the complete model more closely than using Foboundary,determining dimension as boundary for short times (dotted line Figure 2).
The adjusted model for the average temperature was used to predict the effect of various values of α on the average cooling profile of pea soup (T0=100°C). The effect of stirring every 60 min and 30 min on the average cooling profile was predicted as well as the effect of volume changes. Equation (6) was used to calculate the average temperature profile of the pea soup during stirring. After each stirring procedure the cooling process started at t=0 again, with T0 changing to the average temperature of the pea soup directly after stirring. The effects of volume increase and volume decrease on the average cooling time were estimated; the volume was changed to a can containing 780 ml of pea soup (R=0.0475 m) and to a pan containing 25.5 l of pea soup (pan B) with the same size ratios as the pan containing 3.75 l of pea soup (pan A). Characteristics of these objects are given in Table 2. The combined effect of various α’s (external convective-heat-transfer coefficient), stirring, and volume changes were also predicted.
Finally, both models were integrated. To estimate growth of a microorganism in a product during cooling, the temperature profile throughout the whole product has to
Figure 2. Discrepancy and adjustment of the simplified cooling model to the complete model for the average temperature at Bi=100. Symbols: ○, simplified model; • , complete model; ----, adjusted simplified model at Fo=0.204; ──, adjusted simplified model Fo=0.102

Modeling growth during cooling
81
be known. Since this fact complicates calculations, the average temperature profile of pea soup during cooling was used to estimate the number of C. perfringens cells during cooling. The combined model used 5-min time intervals to calculate the increase in cell numbers of C. perfringens, since it was assumed that the log-linear cooling profile was linear in such a short time interval. It was assumed that as soon as the average temperature was <60°C, at least 1 viable cell of C. perfringens per ml was present.
The cooling model of pea soup and the combined growth/cooling model were validated with new data. The experiments were conducted using pea soup from the same batch as the earlier published data 174, using the same cooking pan and air-vented cabinet (T∞=3°C). This time the soup was inoculated with C. perfringens (10 strain-mixture, a combination of cocktails 1 and 2 174; approximately 1000 cfu/ml). Therefore, the soup was mashed to obtain a homogeneous soup, boiled, cooled down to 50°C (T0), and inoculated. The soup was thoroughly mixed before starting the experiment to equilibrate the temperature and to homogenize the inoculated cells of C. perfringens. The temperature of the soup was recorded in the center spot every 5 min (Squirrel data logger, Grant Instruments Ltd., Cambridge, UK). The pan was placed on a wire rack to facilitate heat transfer through the bottom of the pan. The experiment was ended when the center spot temperature had reached 10°C. The soup was thoroughly mixed and three 5-g samples were taken to determine the number of C. perfringens cells on TSC base without overlayer (spiral plater, Eddy jet, Leerdam, The Netherlands; incubated anaerobically at 37°C). The number of cells in the inoculum solution was determined as well. This experiment was repeated in ice water to validate the estimated curve of α=350. Both cooling profiles were measured for a can of pea soup (780 ml) as well.
RESULTS The growth model given by equations (1-5) was used to predict cell numbers of C. perfringens during a cooling experiment conducted earlier (Figure 3) 174. This experiment used linear cooling profiles from 50°C to 15°C in 3 h, 5 h, 7.5 h, and 10 h. The model predicted the measured data sufficiently well: calculated cell numbers after cooling according to the model did not differ more than 0.7 log units from the measured data (Table 3). Therefore, the effect of lag phase was not added to the model to avoid needless complexity.
Table 2. Characteristics of objects for which cooling curves were calculated
Object Radius (m)
R Half height (m)
L Volume (l)
Pan A 0.1225 0.04 3.77 Pan B 0.23 0.0767 25.5 Can 0.0475 0.055 0.780

Chapter 6
82
The experiment used to validate the growth model applied a linear cooling curve, whereas foods cool down log-linearly 283. Cooling 3.75 l of pea soup (pan A) from 50°C to 15°C in an air-vented cabinet (3°C) took 5 h 174. Linear cooling of pea soup in 5 h will over-estimate cell growth of C. perfringens, since time spent at higher growth temperatures is longer compared to log-linear cooling; a 3-h cooling period will underestimate cell growth 174. Earlier published data showed that for all linear cooling procedures cell numbers increased with more than 1.0 log cycles (Table 3)
174. USA law does not permit increase of C. perfringens during cooling of foods: growth is limited to 1 log cycle 110. Since linear cooling did not allow precise predictions of growth of C. perfringens during log-linear cooling of pea soup, a model (given by equation 6) was used to predict cooling curves of pea soup.
To model the time/temperature profile of cooling pea soup, earlier published data were used to fit the model 174. This cooling profile was measured to gain information on the slowest cooling spot in a pan of pea soup placed on a wooden shelf (point A Figure 1). Temperatures measured in this spot were plotted in Figure 4 (for clarity not all data points were plotted). The model given by equation (6), however, assumes
Table 3. Predicted and measured cell increase of Clostridium perfringens during linear cooling of pea soup from 50°C to 15°C
Time to cool from
50°C to 15°C
(h)
Predicted cell
increase
(log N/ml)
Measured cell
increase
(log N/ml)
Discrepancy
(log N/ml)
3 1.9 1.5 0.4
5 3.3 3.2 0.1
7.5 4.9 4.4 0.5
10 6.1 5.4 0.7
Figure 3. Increase in cell numbers of Clostridium perfringens during cooling of pea soup from 50°C to 15°C in different time periods. Symbols: ♦ , 3-h cooling period; ■, 5-h cooling period; ▲, 7.5 h cooling period; • , 10 h cooling period. Open symbols, estimated number of cells in time during cooling; closed symbols, measured number of cells before and after cooling. The average inoculum of the measured cell numbers was 1.4 log N/ml

Modeling growth during cooling
83
the center to be the slowest cooling spot. To compensate for the wooden shelf, calculations for our slowest cooling spot were compared with the center temperature. The model fitted the measured data best, when α=20 (measured with forced convection; Figure 4).
Since the model used to predict the temperature profile in the slowest cooling spot showed good agreement with the measured data, the model was used to predict the effect of different cooling environments on the averaged time/temperature curve. Dutch law requires foods to cool down from 60°C to 7°C within 5 h 21, whereas measured data on our 3.75 l of pea soup showed that cooling in the slowest cooling spot took 10.4 h. The cooling process needed to be accelerated. Accelerated cooling can be obtained by decreasing the surrounding heat transport resistance (increasing α) by increased air ventilation or by using water instead of air as cooling medium. The predicted effect of different α’s (external convective-heat-transfer coefficient) on cooling times to traverse the 60→7°C temperature range for pan A are listed in Table 4, column 4; time/temperature profiles are shown in Figure 5. Predictions showed that safe cooling times according to Dutch law for this specific pan of pea soup were obtained by increasing α by a factor 2 or more. Leaving the pan in our air-vented cabinet at 3°C was shown to be insufficient.
Stirring accelerates cooling of foods 210. Therefore, the effect of stirring was modeled. Two stirring procedures were calculated: stirring after every hour and stirring every 30 min. The effects of both stirring procedures on the average temperature of pea soup in pan A cooled at α=20 are shown in Figure 6. Both stirring procedures at α=20 did sufficiently reduce cooling times according to Dutch law. The effect of both stirring procedures on the cooling time in the other cooling environments is presented in Table 4.
Another effective way to influence cooling rates of foods is changing the geometry of foods 87. Therefore, the effect of minimizing the volume on cooling
Figure 4. Time/temperature curve of slowest cooling spot of a 3.75 l pan of pea soup (T0=100°C and T∞=3°C) in an air-vented cabinet (forced convection). Symbols: ○, measured data points (measuring
started at 80°C and was stopped at 10°C); ──, fitted temperature curve with α=20 (α: external convective-heat-transfer coefficient)
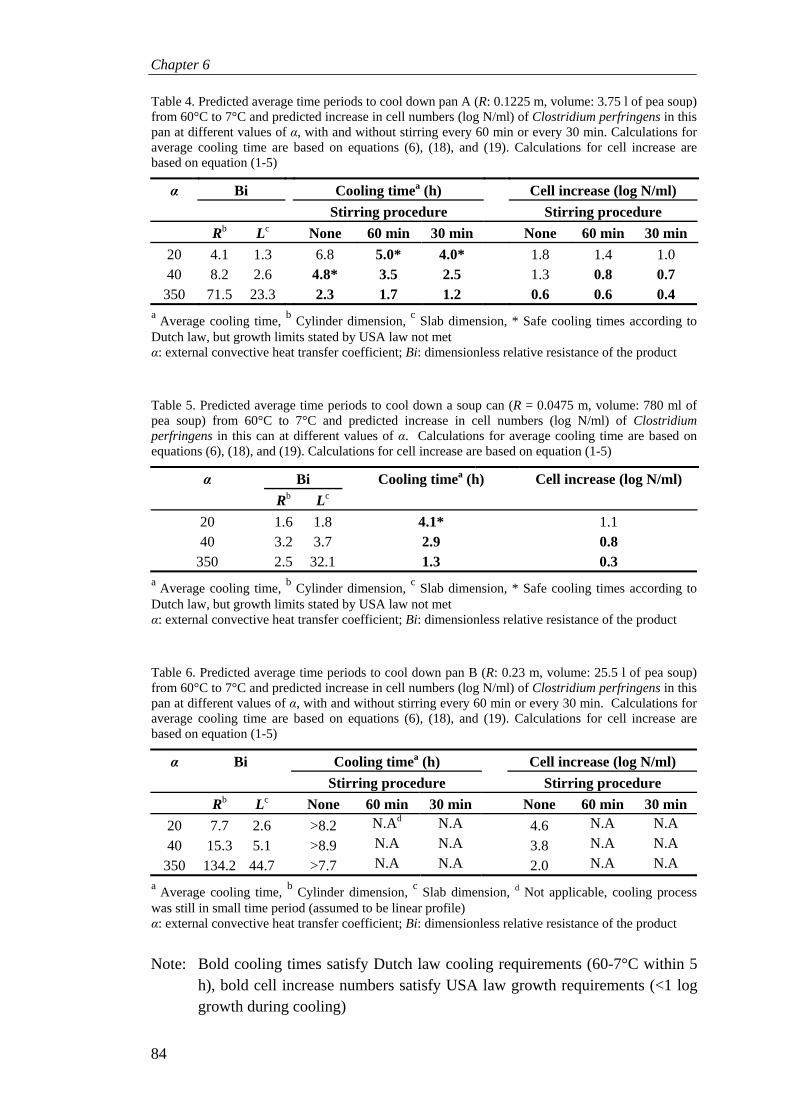
Chapter 6
84
Note: Bold cooling times satisfy Dutch law cooling requirements (60-7°C within 5
h), bold cell increase numbers satisfy USA law growth requirements (<1 log growth during cooling)
Table 4. Predicted average time periods to cool down pan A (R: 0.1225 m, volume: 3.75 l of pea soup) from 60°C to 7°C and predicted increase in cell numbers (log N/ml) of Clostridium perfringens in this pan at different values of α, with and without stirring every 60 min or every 30 min. Calculations for average cooling time are based on equations (6), (18), and (19). Calculations for cell increase are based on equation (1-5)
α Bi Cooling timea (h) Cell increase (log N/ml)
Stirring procedure Stirring procedure
Rb Lc None 60 min 30 min None 60 min 30 min
20 4.1 1.3 6.8 5.0* 4.0* 1.8 1.4 1.0 40 8.2 2.6 4.8* 3.5 2.5 1.3 0.8 0.7
350 71.5 23.3 2.3 1.7 1.2 0.6 0.6 0.4
a Average cooling time, b Cylinder dimension, c Slab dimension, * Safe cooling times according to Dutch law, but growth limits stated by USA law not met α: external convective heat transfer coefficient; Bi: dimensionless relative resistance of the product
Table 5. Predicted average time periods to cool down a soup can (R = 0.0475 m, volume: 780 ml of pea soup) from 60°C to 7°C and predicted increase in cell numbers (log N/ml) of Clostridium perfringens in this can at different values of α. Calculations for average cooling time are based on equations (6), (18), and (19). Calculations for cell increase are based on equation (1-5)
α Bi Cooling timea (h) Cell increase (log N/ml)
Rb Lc
20 1.6 1.8 4.1* 1.1 40 3.2 3.7 2.9 0.8
350 2.5 32.1 1.3 0.3
a Average cooling time, b Cylinder dimension, c Slab dimension, * Safe cooling times according to Dutch law, but growth limits stated by USA law not met α: external convective heat transfer coefficient; Bi: dimensionless relative resistance of the product
Table 6. Predicted average time periods to cool down pan B (R: 0.23 m, volume: 25.5 l of pea soup) from 60°C to 7°C and predicted increase in cell numbers (log N/ml) of Clostridium perfringens in this pan at different values of α, with and without stirring every 60 min or every 30 min. Calculations for average cooling time are based on equations (6), (18), and (19). Calculations for cell increase are based on equation (1-5)
α Bi Cooling timea (h) Cell increase (log N/ml)
Stirring procedure Stirring procedure
Rb Lc None 60 min 30 min None 60 min 30 min
20 7.7 2.6 >8.2 N.Ad N.A 4.6 N.A N.A
40 15.3 5.1 >8.9 N.A N.A 3.8 N.A N.A
350 134.2 44.7 >7.7 N.A N.A 2.0 N.A N.A
a Average cooling time, b Cylinder dimension, c Slab dimension, d Not applicable, cooling process was still in small time period (assumed to be linear profile) α: external convective heat transfer coefficient; Bi: dimensionless relative resistance of the product
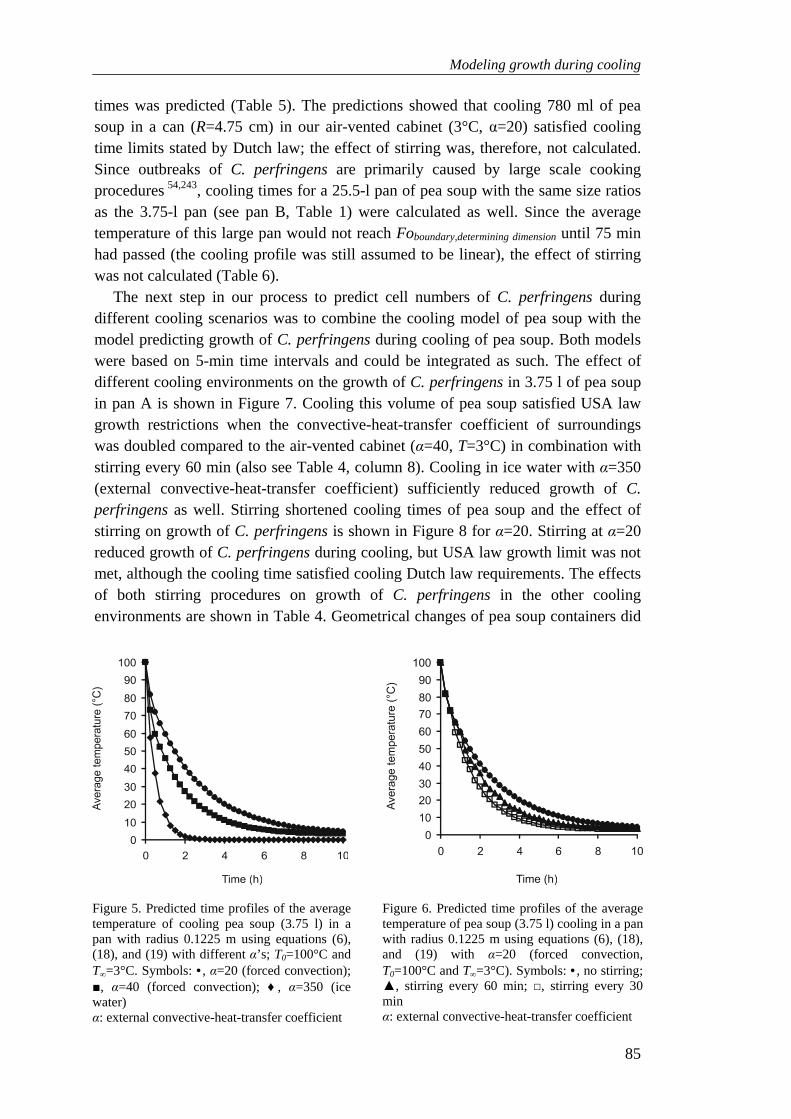
Modeling growth during cooling
85
times was predicted (Table 5). The predictions showed that cooling 780 ml of pea soup in a can (R=4.75 cm) in our air-vented cabinet (3°C, α=20) satisfied cooling time limits stated by Dutch law; the effect of stirring was, therefore, not calculated. Since outbreaks of C. perfringens are primarily caused by large scale cooking procedures 54,243, cooling times for a 25.5-l pan of pea soup with the same size ratios as the 3.75-l pan (see pan B, Table 1) were calculated as well. Since the average temperature of this large pan would not reach Foboundary,determining dimension until 75 min had passed (the cooling profile was still assumed to be linear), the effect of stirring was not calculated (Table 6).
The next step in our process to predict cell numbers of C. perfringens during different cooling scenarios was to combine the cooling model of pea soup with the model predicting growth of C. perfringens during cooling of pea soup. Both models were based on 5-min time intervals and could be integrated as such. The effect of different cooling environments on the growth of C. perfringens in 3.75 l of pea soup in pan A is shown in Figure 7. Cooling this volume of pea soup satisfied USA law growth restrictions when the convective-heat-transfer coefficient of surroundings was doubled compared to the air-vented cabinet (α=40, T=3°C) in combination with stirring every 60 min (also see Table 4, column 8). Cooling in ice water with α=350 (external convective-heat-transfer coefficient) sufficiently reduced growth of C. perfringens as well. Stirring shortened cooling times of pea soup and the effect of stirring on growth of C. perfringens is shown in Figure 8 for α=20. Stirring at α=20 reduced growth of C. perfringens during cooling, but USA law growth limit was not met, although the cooling time satisfied cooling Dutch law requirements. The effects of both stirring procedures on growth of C. perfringens in the other cooling environments are shown in Table 4. Geometrical changes of pea soup containers did
Figure 5. Predicted time profiles of the average temperature of cooling pea soup (3.75 l) in a pan with radius 0.1225 m using equations (6), (18), and (19) with different α’s; T0=100°C and T∞=3°C. Symbols: • , α=20 (forced convection);
■, α=40 (forced convection); ♦ , α=350 (ice water) α: external convective-heat-transfer coefficient
Figure 6. Predicted time profiles of the average temperature of pea soup (3.75 l) cooling in a pan with radius 0.1225 m using equations (6), (18), and (19) with α=20 (forced convection, T0=100°C and T
∞=3°C). Symbols: • , no stirring;
▲, stirring every 60 min; □, stirring every 30 min α: external convective-heat-transfer coefficient

Chapter 6
86
affect cooling times and changed cell growth as well (Tables 4-6). Cell numbers of C. perfringens were estimated to increase 1.8 log N/ml in a 3.75-l pan at α=20, while 1.1 log N/ml increase was estimated for a 780-ml can and 4.6 log N/ml increase for a 25.5-l pan (pan B).
The final step in our modeling process was to validate the predicted temperature profiles and the predicted increase in cell numbers with new data. The cooling process of the new data set started at 50°C, since growth of C. perfringens was measured simultaneously. The cooling model using α=20 and T0=50°C satisfactory predicted the new data set for the 3.75-l pan (Figure 9a). The measured temperature profiles in ice water (α=350; external convective-heat-transfer coefficient) were less well predicted by the cooling model for both the 3.75-l pan and the 780-ml can. The temperature profile for the 780-ml can of pea soup was less accurately estimated at α=20 as well. The calculated average cooling curve was used to predict the growth profile of C. perfringens during this cooling procedure. The model predicted an average cell number increase of 1.8 log cycles during cooling at α=20 and of 0.6 log cycles during cooling in ice water (α=350) in the 3.75-l pan, the measured values were 1.9 log N/ml and 0.9 log N/ml, respectively. The increase in cell numbers of C. perfringens during cooling of 0.78 l of pea soup was estimated to be 0.9 log N/ml at α=20 and 0.1 log N/ml at α=350. The measured increase in cell numbers was 0.9 log N/ml and 0.2 log N/ml, respectively.
Figure 7. Predicted time profiles for the number of Clostridium perfringens cells/ml using equations (1-5) during cooling of pea soup (3.75 l) in a pan with radius 0.1225 m [equations (6), (18), and (19)] with different α’s; T0=100°C and T
∞=3°C. Symbols: ●, α=20
(forced convection); ■, α=40 (forced convection); ♦ , α=350 (ice water) α: external convective-heat-transfer coefficient
Figure 8. Predicted time profiles for the number of Clostridium perfringens cells/ml using equations (1-5) during cooling of pea soup (3.75 l) in a pan with radius 0.1225 m [equations (6), (18), and (19)] with α=20 (forced convection, T0=100°C and T
∞=3°C).
Symbols: ●, no stirring; ▲, stirring every 60 min; □, stirring every 30 min α: external convective-heat-transfer coefficient

Modeling growth during cooling
87
DISCUSSION The growth model used closely predicted growth of C. perfringens during linear and log-linear cooling of pea soup. It should be noted that for the growth model no parameters were fitted; predictions of cell numbers were based on growth models and general literature cardinal parameters. For calculating growth of C. perfringens during cooling, it was assumed that at least one cell per ml was present as soon as the average temperature was <60°C. Foods heated to temperatures >60°C only contain spores and the cooking process serves as a heat-activation step for spore germination. When the temperature drops below 60°C, spores will germinate. Since the temperature of the food near the outside will drop below 60°C before the average temperature does, stirring will kill germinated spores from near the outside of the food. Spores that were located in the center of the food, however, had not started to germinate yet and stirring will distribute these spores throughout the product again. Therefore, this assumption holds true in practice when the spore contamination level is sufficiently high.
To simulate practical conditions, no ideal experiment for heating and cooling of pea soup was performed. The pan with pea soup was placed on a wooden (isolating) shelf during cooling and not on a wire shelf. Therefore, for this initial experiment not the center of the layer of pea soup, but a spot closer to the bottom was supposed to be the slowest cooling spot. Basing the model on this slowest cooling point showed to be accurate, since the model predicted the temperature profile of the validating data set sufficiently well. The subsequent experiment used to validate the combined model used a wire shelf to facilitate cooling through the bottom of the pan, since this
Figure 9. Validation of cooling model of pea soup and growth model of Clostridium perfringens during cooling of pea soup. A: 3.75 l pan of pea soup (R=0.1225 m), B: 780 ml can of pea soup (R=0.0475 m). ——: predicted temperature in center spot and predicted growth profile α=20, T
∞=3°C;
----: predicted temperature in center spot and predicted growth profile α=350, T∞=0°C; ●: measured
temperatures in center spot α=20, T∞=3°C; ♦ : measured temperatures in center spot α=350, T
∞=0°C;
○: measured increase in cell numbers during cooling α=20, T∞=3°C; ◊: measured increase in cell
numbers during cooling α=350, T∞=0°C
α: external convective-heat-transfer coefficient

Chapter 6
88
is preferable in practice too. To model the temperature profile of pea soup during cooling, pea soup was
assumed to behave like water, whereas the water content of the soup was 83%. This factor affects the heat transfer coefficient λ of the product and thus Bi [equation (11); dimensionless relative resistance] and Fo [equation (12); dimensionless time]. However, even when the heat-transfer coefficient of pea soup would be 0.4 instead of 0.6 (λwater), the average cooling time in our air-vented cabinet (α=20; T0=100°C and T∞=3°C) would increase 1.3 h resulting in an additional 0.3 log N/ml increase in predicted cell numbers. This inaccuracy of the model was acceptable from a microbiological point of view, therefore pea soup was regarded to behave like water. Furthermore, the model predicted the measured temperature profile sufficiently well when the pea soup was regarded to behave like water.
The model accounted conductive heat transport effects only. The air velocity in the air-vented cabinet was approximated as 1 ms-1. Equation (15) showed that forced convection at an air velocity of 1 ms-1 results in α=9.6 (external convective heat transfer coefficient), while our model fitted measured data using α=20. In reality, a hot product transports heat by means of diffusion, evaporation, radiation, and convection. It is possible to account for these other effects, but this will result in a very complex model. The aim of our study was to keep the model clear and simple to facilitate its use in practice. Therefore, the model was fitted with α, which showed to be sufficiently accurate. In addition, our model did not calculate the series in equations (18) and (19). Only in the case of short time periods did our simplified model deviate from the complete model. This inaccuracy was overcome by linearly interpolating small time temperature profiles.
Not only calculations were fairly straightforward, use of the model itself was simple since only one parameter had to be fitted. The model allowed calculation of the average temperature profile of our pea soup by measuring the temperature profile in the center spot of the food only. The average temperature of the food has to be known to estimate growth of microorganisms during cooling of food. The model can also be used to calculate temperature as a function of place. This allows another option to estimate average growth during cooling. Temperature profiles in various sections of the food can be used to estimate growth in these sections, which subsequently can be used to estimate average growth during cooling. Furthermore, the developed cooling model allowed extrapolation to other product dimensions as well as the effect of changing the cooling temperature (T∞). A disadvantage of using α (external convective heat transfer coefficient) as fit-parameter was that the effect of increased air velocity to a certain level could not be predicted. However, the degree of increasing α needed to obtain satisfactory cooling times, gives an indication of the effort that has to be taken to reach these cooling times. In our model α was doubled. According to equations (15) using α=9.6 for our air-vented cabinet (1 ms-1), the air velocity had to be increased to 3.4 ms-1 to double α.
Closer study of the results of estimated average time periods to traverse the 60-7°C temperature range and the growth estimates showed that time limits and growth
Modeling growth during cooling
89
limits set by different laws showed good correlation. In most cases, estimated growth was limited to less than 1 log cycle when average cooling from 60°C to 7°C was completed within 5 h (Table 3-5). In the other cases (Table 3-5 marked with *), cooling was regarded as safe, but cell numbers were estimated to increase with 1.0-1.4 log cycles. However, it should be noted that Dutch law requires that a product as a whole should be cooled down from 60°C to 7°C within 5 h. Our estimations are based on the average temperature. Thus, the average temperature has to decrease more rapidly than from 60°C to 7°C in 5 h. In case of our 3.75-l pan at α=0.20 (T0=100°C, T∞=3°C) it took 1.6 h extra for the center spot to reach 7°C compared to the average temperature. When the average temperature decreases to 7°C within 3.4 h, growth of C. perfringens will be limited to <1 log cycle according to our model (Table 4).
The model showed substantial differences with the measured data when predicting the temperature profile of cooling the 3.75-l pan in ice water. This can be explained by the fact that cooling in the vertical direction was determining for this pan and the topside of the pan was in contact with air (20°C), instead of with ice water. Thus, the combined model underestimated cell increase of C. perfringens during cooling. Although the vertical direction is not totally determining for the 0.78-l can, the same holds true for this geometry.
In conclusion, data presented in this paper showed that a simple cooling model adequately predicted the temperature profile of pea soup during cooling. The effect of volume changes and different cooling environments on the cooling profile of pea soup was sufficiently accurately predicted. The cooling model in combination with the growth model used correctly predicted growth of C. perfringens during cooling. The model was easy to use and was based on worst-case scenarios due to the cardinal parameters used. Furthermore, the combined model allowed quantitative prediction of various interventions on estimated cell number increase and on reduction of cooling time. In this manner, the model can be used to evaluate various GMP requirements.

90
Spores & Cells, Media & Modeling

7 GENERAL DISCUSSION

Chapter 7
92
Clostridium perfringens, a small spindle that breaks through.
This small, but ubiquitous spindle causes food poisoning illness. Many outbreaks remain unknown due to the fact that the symptoms are mild and of short duration. Even so, C. perfringens breaks through often enough to be listed as one of the main food borne pathogens in the western world (expressed as cases per year). This microorganism is notorious for the massive food poisoning outbreaks it causes with up to 700 cases 45. The total number of cases is assumed to be 40 times the number of reported cases 229. This underestimation is regarded to be independent of the surveillance system. However, committal registration of food poisoning outbreaks caused by C. perfringens does somewhat increase the number of reported outbreaks compared to non-committal registration, which can be shown as followsa. In the UK, C. perfringens food poisoning is a reportable disease, in contrast with The Netherlands. In England and Wales, approximately 360 outbreaks were reported including approximately 7400 ill persons in the period 1987-1994, against 32 outbreaks including 161 ill persons in The Netherlands 6,94,126. Disregarding cultural eating habits shows that, extrapolating data from England and Wales (53 million inhabitants) 16 to The Netherlands (15.8 million inhabitants) 15, committal registration of C. perfringens outbreaks comparatively increases registered outbreaks only by a factor 3.4. Underestimation of reported outbreaks is among other things caused by ill persons that do not seek medical care or the absence of a food or feces specimen for diagnosis. The type of surveillance system does not influence these factors. When the underestimation of registered cases in the UK is assumed to be 40, as suggested by Mead et al. 229, than the underestimation of registered cases in The Netherlands may be even as high as 100 times the number of reported cases. The great underestimation of C. perfringens food poisoning outbreaks is probably the reason that research on this pathogen is limited. To increase our knowledge on this microorganism, research methods should be standardized to be able to compare the fragmented studies on this pathogen, since culture conditions and strain variation influence the outcome of experiments.
Most experiments on the behavior of C. perfringens in foods use spore stocks as an easy and standardized means of inoculum. Spore stocks can be stored for a couple of weeks, which decreases the deviation in test results due to inoculum variations. However, the method used to obtain spores from C. perfringens may greatly affect spore characteristics and thus the outcome of the experiment. It is known that heat resistance of spores is influenced by sporulation medium, sporulation temperature, and heating medium 121,190. It cannot be ruled out that these factors change other spore characteristics as well. Since in vitro sporulation of C. perfringens can be difficult, a dozen of media have been designed to optimize sporulation of this microorganism 35,91,101,190,232,263,293,301,310. The species comprises of many strains that a The number of outbreaks in England and Wales is compared to the number of outbreaks in The Netherlands, instead of the number of cases. Due to cultural eating habits, outbreaks of C. perfringens involve on average 20 persons in England and Wales compared to 5 persons in The Netherlands. Therefore, the number of outbreaks was taken as a means of comparison.
General discussion
93
are different in their sporulating capacity. Sporulation media designed for a specific group of strains do not necessarily obtain good results for other strains 172,232. Sporulation media based on the formula of Duncan and Strong (DS) are the most widely used media. As a result, strains that sporulate abundantly in these types of media are frequently used in research 52,163,177,234,285. This narrows our knowledge of the species C. perfringens, since the well sporulating strains in vitro are not necessarily the most dangerous strains in vivo. Poorly sporulating strains, that have higher pH resistance and higher enterotoxin production compared to well sporulating strains, may be equally effective in causing food poisoning outbreaks as the abundantly sporulating strains. Moreover, media that do not yield high spore numbers may produce more resistant spores than spores produced in DS medium. To study the behavior of C. perfringens in foods, use of worst-case scenarios is preferable. Therefore, screening the effect of sporulation media on cell and spore characteristics is useful.
Characteristics of cells and spores are not only affected by sporulation media, but are also dependent on the type of strains used. Since spore stocks limit the amount of strains studied due to the selection for abundantly sporulating strains, the heterogeneous character of the species C. perfringens is almost lost in research. Selecting strains that represent worst-case scenarios is time consuming and difficult, especially since results obtained in culture broths have to be extrapolated to foods. However, screening a strain library on specific cell characteristics in broth before conducting the experiment in food is preferable compared to the use of a limited amount of randomly chosen strains.
Not only spore characteristics and cell characteristics influence the outcome of experiments, the type of agar media affects C. perfringens counts as well. Some agar media are known to underestimate C. perfringens cell numbers, while media that include lysozyme in their formula are known to yield higher recoveries of heat-injured spores compared to media without lysozyme 31,52. Most media perform equally well, although some antibiotics in media reduce cell numbers 173. Studies, in which sterile food is inoculated with C. perfringens, may therefore exclude antibiotics from the agar media to avoid a negative influence on cell numbers.
The species’ heterogeneity is important in our understanding how to control C. perfringens food poisoning outbreaks. The main issue in this matter is the capability of strains to produce the enterotoxin that causes food poisoning symptoms. Only about 6% of C. perfringens strains contain the enterotoxin gene. Not even all strains isolated from food or feces involved in a food poisoning outbreak are enterotoxin-positive (Ent+) 253,259,311; the heterogeneous character of the species C. perfringens is also reflected in the enterotoxin production. Food poisoning is only caused by type A strains, but some B-E type strains may also produce the enterotoxin 84,188. Within type A strains, the gene encoding the enterotoxin, cpe, is either located on the chromosome or on a plasmid 74,286. Strains that cause food poisoning consistently contain chromosomal cpe, while veterinary strains and non-food borne gastrointestinal isolates contain plasmid encoded cpe. A possible reason for the fact

Chapter 7
94
that food poisoning strains contain chromosomal cpe is that these strains are more heat resistant than strains containing the plasmid encoded gene. Thus, strains containing chromosomal encoded cpe are less sensitive to cooking temperatures than plasmid encoded cpe strains 266. However, research shows that the difference between Ent+ and Ent- strains is not as clear as is supposed, since the cpe gene seems to be transferable between strains. It was noted that Ent+ strains sometimes lose the enterotoxin producing capacity and that more than one strain can be involved in a food poisoning outbreak 247,253,311. Sequencing DNA of Ent+ C. perfringens strains revealed that the enterotoxin gene is positioned in a single copy on a hyper-variable region on the chromosome 63. The gene is situated on an apparent transposon, which may be able to excise 57,60. It has been shown that the plasmid encoding cpe is transferable by means of conjugation and that Ent- strains which receive cpe are able to produce enterotoxin 59,81,265. Brynestad and Granum 58 suggested that the conjugative cpe transfer and the association with mobile elements on chromosomal DNA may imply that strains exchange the cpe gene in situations where enterotoxin production is an advantage, such as in the kitchen and in the gut. The possibility of cpe transfer may also explain the low amount of Ent+ strains in nature, since strains containing the gene act as a reservoir of the gene. Brynestad et al. 59 also suggested that non-food borne diseases caused by C. perfringens originate from the inhalation or ingestion of a few Ent+ spores that germinate in the gastrointestinal tract and subsequently transfer the cpe gene to the endogenous C. perfringens cells of the normal intestinal flora. These donor strains are fully adapted to our intestinal tract, which may explain the severe and prolonged symptoms of antibiotic associated diarrhea and infectious diarrhea compared to food poisoning symptoms.
Cell signalling is another way in which Ent+ and Ent- strains may affect each other. C. perfringens strains can produce a sporulation-factor (SF) that stimulates sporulation of other strains 273,305. The SF is produced by vegetative cells and sporulating cultures of both Ent+ strains and Ent- strains. In combination with the presence of Ent- stains in our endogenous gastrointestinal flora may the production of SF by Ent- strains imply that these strains play a role in food poisoning outbreaks by means of stimulating sporulation of Ent+ strains and subsequent enterotoxin release
273. The fact that the influence of Ent- strains on Ent+ strains is not fully elucidated, explains that research should not only focus on strains that produce the enterotoxin
130,273. In addition, limits set by law concerning C. perfringens levels in food do not distinguish between the two types of strains. From a public health point of view, studies should contain a broad spectrum of C. perfringens strains. Since this increases the burden on research, screening and selecting a collection of strains for extremes on certain important characteristics before setting up an experiment would greatly improve research on this pathogen, as suggested earlier. For reason of comparison, it would be preferable to relate experimental results to results of a reference strain under reference conditions and under the conditions tested to account for culture variations between different laboratories.
General discussion
95
To solve the problem of culture effects and strain effects, predictive modeling is an easy and rapid way to predict the behavior of C. perfringens during various interventions. The strain effect is ruled out by use of general parameters such as Tmin and pHmax. These parameters are theoretical growth limits and apply to the entire species; the parameters can be found in or can be extrapolated from literature. Use of these general growth limits (cardinal parameters) provides prediction of worst-case scenarios. These scenarios allow us to design safe processes that are efficient and result in high quality foods. Furthermore, growth models express data comprehensively. Discrepancies of test results and data from other experiments are easily comparable to the model. Studying the behavior of C. perfringens on basis of growth models allows a relatively easy and rapid risk evaluation of this pathogen in foods during different critical control points in the processing chain. Use of predictive modeling also reduces the amount of labour intensive experiments. Only those experiments need to be conducted that are necessary to validate the predicted outcomes of the model.
In conclusion, C. perfringens is a greatly underestimated pathogen. This underestimation is binary. On the one hand, outbreaks and cases of food poisoning caused by this pathogen are underestimated due to the mild symptoms C. perfringens causes. On the other hand, the risk of C. perfringens is underestimated since the virulence of those strains that contain the enterotoxin encoding gene is only partly elucidated. Furthermore, the heterogeneous character of the species complicates comparison of different experiments and hampers setting up worst-case scenarios. Research should not only focus on Ent+ strains, because it is probable that Ent+ strains pass the cpe gene to Ent- strains. Predictive modeling may be a useful tool to minimize experimental work while still allowing great transparency of test results. These models can be used to set up safety guidelines to control C. perfringens outbreaks.

96

References
97
REFERENCES 1. Anonymous. 1985. Clostridium perfringens. State of Alaska Epidemiology Bulletin.
9: Available at http://www.epi.hss.state.ak.us/bulletins/docs/b1985_09.htm. Accessed 25-03-2003
2. Anonymous. 1989. Polymyxin B sulphate. Available at: http://www.mdbio.com.tw/AM/am-polymixin.htm. Accessed 05-08-2002.
3. Warenwetbesluit bereiding en behandeling van levensmiddelen. 1992. Koninklijke Vermande BV, Lelystad, The Netherlands, W 15.
4. Microbiological analysis of meat and meat products. Determination of mesophilic sulphite-reducing clostridia. 1993. Deutsches Institut für Normung e.V., DIN, Berlin, Germany, DIN 10103.
5. Anonymous. 1996. Clostridium perfringens, p. 112-125. In T.A. Roberts,A.C. Baird-Parker, andR.B. Tompkin (ed.), Microorganisms in foods: Microbiological specifications of food pathogens, vol. 5. James & James and Blackie Academic and Professional, London.
6. Anonymous. 1997. Clostridium perfringens food poisoning. CDR Weekly. 7: 59-60.
7. Clostridium perfringens. Determination in foods. 1997. Nordisk Metodikkommitté för Livsmidel, Oslo, Sweden, NMKL 95.
8. Anonymous. 1997. Infectious diarrhoea caused by Clostridium perfringens. CDR Weekly. 7: 210.
9. Microbiology of food and animal feeding stuffs - Horizontal method for enumeration of Clostridium perfringens - Colony-count technique. 1998. Commité Européen de Normalisation, Brussels, Belgium, prEN 13401(E).
10. Anonymous. 2000. 7th Report on surveillance of foodborne diseases in Europe 1993-1998; Denmark. Available at: http://www.bgvv.de/internet/7threport/CRs/den.pdf. Accessed 08-10-2002.
11. Anonymous. 2000. 7th Report on surveillance of foodborne diseases in Europe 1993-1998; Finland. Available at: http://www.bgvv.de/internet/7threport/CRs/fin.pdf. Accessed 08-10-2002.
12. Anonymous. 2000. 7th Report on surveillance of foodborne diseases in Europe 1993-1998; France. Available at: http://www.bgvv.de/internet/7threport/CRs/fra.pdf. Accessed 08-10-2002.
13. Anonymous. 2000. 7th Report on surveillance of foodborne diseases in Europe 1993-1998; Germany. Available at: http://www.bgvv.de/internet/7threport/CRs/deu.pdf. Accessed 08-10-2002.
14. Anonymous. 2000. 7th Report on surveillance of foodborne diseases in Europe 1993-1998; Sweden. Available at: http://www.bgvv.de/internet/7threport/CRs/swe.pdf. Accessed 08-10-2002.
15. Anonymous. 2000. 7th Report on surveillance of foodborne diseases in Europe 1993-1998; The Netherlands. Available at: http://www.bgvv.de/internet/7threport/CRs/net.pdf. Accessed 09-07-2003.
16. Anonymous. 2000. 7th Report on surveillance of foodborne diseases in Europe 1993-1998; United Kingdom (England and Wales). Available at: http://www.bgvv.de/internet/7threport/CRs/uk_ew.pdf. Accessed 08-10-2002.

References
98
17. Anonymous. 2000. Cycloserine. 2002. Available at: http://www.webhealthcentre.com/ref/drugix/DI0042.asp. Accessed 05-08-2002.
18. Anonymous. 2000. Sulfadiazine. 2002. Available at: http://www.webhealthcentre.com/ref/drugix/di0129.asp. Accessed 05-08-2002.
19. Anonymous. 2000. TSC Agar, Base. 2002. Available at: http://www.merck.de/english/services/chemdat/catalogs/mibio/intro/tedisdata/111972.html. Accessed 05-08-2002.
20. Anonymous. 2001. Communication from the commission on foods and food ingredients authorised for treatment with ionising radiation in the community. Official Journal of the European Communities. C 241/6.
21. Hygiënecode voor de voedingszorg in zorginstellingen. 2001. Stichting Voedingscentrum, Den Haag, The Netherlands.
22. Anonymous. 2001. Kanamycin. 2002. Available at: http://www.mdbrowse.com/Druginf/K/kanamycin.htm. Accessed 05-08-2002.
23. Anonymous. 2001. Kanamycin sulfate. 2002. Available at: http://www.nursespdr.com/members/database/ndrhtml/kanamycinsulfate.html. Accessed 05-08-2002.
24. Anonymous. 2002. How we measure food poisoning trends. 2002. Available at: http://www.food.gov.uk/news/newsarchive/59179. Accessed 25-03-2003.
25. Anonymous. 2002. Laboratory reports of Clostridium perfringens (all specimen types). Available at: http://www.cdscni.org.uk/surveillance/Gastro/Clostridium_perfringens.htm. Accessed 9-8-2003.
26. Anonymous. 2002. Matförgiftning i Tierp. EPI-aktuellt. 1: 2-3. 27. Anonymous. 2002. Methods of growing and handling microorganisms. Available
at: http://www.bmb.psu.edu/courses/Micrb107/notes/handling.htm. Accessed 05-08-2002.
28. Statistics of analytical data. Protocol for the establishment of precision characteristics of microbiological quantitative methods by interlaboratory studies. 2002. ISO/TC 34/SC 9 N 543.
29. Adak, G.K., S.M. Long and S.J. O'Brien. 2002. Trends in indigenous foodborne disease and deaths, England and Wales: 1992 to 2000. Gut. 51: 832-841.
30. Adams, B.W. and G.C. Mead. 1980. Comparison of media and methods for counting Clostridium perfringens in poultry meat and further-processed products. J. Hyg. 84: 151-158.
31. Adams, D.M. 1974. Requirement for and sensitivity to lysozyme by Clostridium perfringens spores heated at ultrahigh temperatures. Appl. Microbiol. 27: 797-801.
32. Ahmed, M. and H.W. Walker. 1971. Germination of spores of Clostridium perfringens. J. Milk Food Technol. 34: 378-384.
33. Ando, Y. 1980. Mechanism of nitrite-induced germination of Clostridium perfringens spores. J. Appl. Bacteriol. 49: 527-535.
34. Andrewes, F.W. 1899. On an attack of diarrhoea in the wards of St. Bartholomew's Hospital, probably caused by infection of rice pudding with Bacillus enteritidis sporogenes. Lancet. 1: 8-9.
35. Angelotti, R., H.E. Hall, M.J. Foter and K.H. Lewis. 1962. Quantitation of Clostridium perfringens in foods. Appl. Microbiol. 10: 193-199.
References
99
36. Annous, B.A., L.A. Becker, D.O. Bayles, D.P. Labeda and B.J. Wilkinson. 1997. Critical role of anteiso-C15:0 fatty acid in the growth of Listeria monocytogenes at low temperatures. Appl. Environ. Microbiol. 63: 3887-3894.
37. Apiluktivongsa, P. and H.W. Walker. 1980. Influence of selective agents on recovery of cold-stressed cells of Clostridium perfringens. J. Food Sci. 45: 574-576.
38. Arias, M.L., M. Jimenez and F. Antillon. 1998. Microwave effect on the survival of sporulated bacteria inoculated in minced meat. Arch. Latinoam. Nutr. 48: 152-155.
39. Atteveld, J.A.J., B. Berkepeis, A.J. Beuker, C.G. Booij, P.C.H.d. Haan, W.A. Hommes, J.M. Hornes, J.G. Hulsbergen, H.J.A. Klein Nagelvoort, J.T. Knoop Pathuis, H. Leegwater, M.G.v. Leeuwen, P.v. Leeuwen, H.B. Monster, L. Nederlof, J.G.M. Nillezen, D.J. Noomen, H.C.E. Palstra, H. Peters, H.v.d. Pluijm, A.M.L. Raaijmakers, I.G. Rácz, A.J.H. Venemans, R.F. Wassenaar, C.H.M. Winkels and Y.G.D.M.d. Woerd. 1984. Polytechnisch zakboekje. Koninklijke PBNA, Arnhem, The Netherlands, pp. 1472.
40. Augustin, J.-C., L. Rosso and V. Carlier. 2000. A model describing the effect of temperature history on lag time for Listeria monocytogenes. Int. J. Food Microbiol. 57: 169-181.
41. Barnes, E.M., J.E. Despaul and M. Ingram. 1963. The behavior of a food-poisoning strain of Clostridium welchii in beef. J. Appl. Bacteriol. 26: 415-427.
42. Bartsch, A.G. and H.W. Walker. 1982. Effect of temperature, solute and pH on the tolerance of Clostridium perfringens to reduced water activities. J. Food Sci. 47: 1754-1755.
43. Baumgart, J., O. Baum and S. Lippert. 1990. Schneller und direkter Nachweis von Clostridium perfringens. Fleischw. 70: 1010-1014.
44. Eisgruber, H. 1986. In Baumgart, J., O. Baum and S. Lippert. 1990. Schneller und direkter Nachweis von Clostridium perfringens. Fleischw. 70: 1010-1014.
45. Bean, N.H., J.S. Goulding, C. Lao and F.J. Angulo. 1996. Surveillance for foodborne-disease outbreaks - United States, 1988-1992. Morbid. Mortal. Weekly Rep. 45: 1-55.
46. Bean, N.H., P.M. Griffin, J.S. Goulding and C.B. Ivey. 1990. Foodborne disease outbreaks, 5-year summary, 1983-1987. Morbid. Mortal. Weekly Rep. 39: 15-23.
47. Beerens, H., S. Sugama and M. Tahon-Castel. 1965. Psychrotrophic Clostridia. J. Appl. Bacteriol. 28: 36-48.
48. Bergey, D.H., F.C. Harrison, R.S. Breed, B.W. Hammer and F.M. Huntoon. 1923. Bergey's manual of determinative bacteriology : a key for the identification of organisms of the class Schizomycetes. Williams and Wilkins, Baltimore, MD, USA, pp.
49. Bisson, J.W. and V.J. Cabelli. 1979. Membrane filter enumeration for Clostridium perfringens. Appl. Environ. Microbiol. 37: 55-66.
50. Blankenship, L.C., S.E. Craven, R.G. Leffler and C. Custer. 1988. Growth of Clostridium perfringens in cooked chili during cooling. Appl. Environ. Microbiol. 54: 1104-1108.
51. Boer, E.d. and E.M. Boot. 1983. Comparison of methods for isolation and confirmation of Clostridium perfringens from spices and herbs. J. Food Protect. 46: 533-536.

References
100
52. Bradshaw, J.G., J.T. Peeler and R.M. Twedt. 1977. Thermal inactivation of ileal loop-reactive Clostridium perfringens type A strains in phosphate buffer and beef gravy. Appl. Environ. Microbiol. 34: 280-284.
53. Brett, M.M. 1994. Outbreaks of food-poisoning associated with lecithinase-negative Clostridium perfringens. J. Med. Microbiol. 41: 405-407.
54. Brett, M.M. 1998. 1566 outbreaks of Clostridium perfringens food poisoning, 1970-1996. 4th World congress Foodborne Infections and Intoxications, Berlin, Germany, Bundesinstitut fuer gesundheitlichen Verbraucherschutz und Veterinaermedizin (BgVV), pp. 243-244.
55. Brett, M.M., J.C. Rodhouse, T.J. Donovan, G.M. Tebbutt and D.N. Hutchinson. 1992. Detection of Clostridium perfringens and its enterotoxin in cases of sporadic diarrhoea. J. Clin. Pathol. 45: 609-611.
56. Bryan, F.L. 1988. Risks associated with vehicles of foodborne pathogens and toxins. J. Food Protect. 51: 498-508.
57. Brynestad, S. and P.E. Granum. 1999. Evidence that Tn5565, which includes the enterotoxin gene in Clostridium perfringens, can have a circular form which may be a transposition intermediate. FEMS Microbiol. Lett. 170: 281-286.
58. Brynestad, S. and P.E. Granum. 2002. Clostridium perfringens and foodborne infections. Int. J. Food Microbiol. 74: 195-202.
59. Brynestad, S., M.R. Sarker, B.A. McClane, P.E. Granum and J.I. Rood. 2001. Enterotoxin plasmid from Clostridium perfringens is conjugative. Infect. Immun. 69: 3483-3487.
60. Brynestad, S., B. Synstad and P.E. Granum. 1997. The Clostridium perfringens enterotoxin gene is on a transposable element in type A human food poisoning strains. Microbiol. 143: 2109-2115.
61. Buzby, J.C. and T. Roberts. 1996. ERS updates U.S. foodborne disease costs for seven pathogens. FoodReview. 19: 20-25.
62. Buzby, J.C. and T. Roberts. 1997. Economic costs and trade impacts of microbial foodborne illness. World Health Stat. Q. 50: 57-66.
63. Canard, B., B. Saint-Joanis and S.T. Cole. 1992. Genomic diversity and organization of virulence genes in the pathogenic anaerobe Clostridium perfringens. Mol. Microbiol. 6: 1421-1429.
64. Carslaw, H.S. and J.C. Jaeger. 1959. Conduction of heat in solids. Clarendon Press, Oxford, UK, pp. 510.
65. Carvalho Campos, L. and E. Hofer. 1989. Antimicrobial resistance among Salmonella serovars isolated from different sources in Brazil during 1978-1983. Antonie van Leeuwenhoek. 55: 349-359.
66. Cato, E.P., W.L. George and S.M. Finegold. 1986. Endospore-forming Gram-positive rods and cocci: Genus Clostridium Prazmowski 1880, p. 1141-1200. In P.H.A. Sneath,N.S. Mair,M.E. Sharpe, andJ.G. Holt (ed.), Bergey's Manual of Systematic Bacteriology, vol. 2. Williams & Wilkins., Baltimore, Md.
67. Migula,W., 1900. In Cato, E.P., W.L. George and S.M. Finegold. 1986. Endospore-forming Gram-positive rods and cocci: Genus Clostridium Prazmowski 1880, p. 1141-1200. In P. H. A. Sneath, N. S. Mair, M. E. Sharpe, and J. G. Holt (ed.), Bergey's Manual of Systematic Bacteriology, vol. 2. Williams & Wilkins, Baltimore. 2.

References
101
68. Chavez Lopez, C., A. Gianotti, S. Torriani and M.E. Guerzoni. 1997. Evaluation of the safety and prediction of the shelf-life of vacuum cooked foods. Ital. J. Food Sci. 9: 99-110.
69. Cochran, W.G. 1954. Some methods of strengthening the common chi-quadrate test. Biometrics. 10: 417-451.
70. Code of Federal Regulations. 1998. Requirements for the production of cooked beef, roast beef and cooked corned beef. Docket no. 9CFR 318.17. Available at: http://www.access.gpo.gov/nara/cfr/waisidx_98/9cfr318_98.html. Accessed 06-03-2003.
71. Code of Federal Regulations. 2002. Irradiation in the production, processing and handling of food, Docket no. 21CFR 179.26. 3. Available at: http://a257.g.akamaitech.net/7/257/2422/14mar20010800/edocket.access.gpo.gov/cfr_2002/aprqtr/pdf/21cfr179.26.pdf. Accessed 12-05-2003.
72. Committee on drug use in food animals, Panel on animal health, food safety, and public health, National Research Council, 1999. In Coffman, J. 2000. Regulation of antibiotic resistance in the US. AgBioForum. 3: 141-147. Available at http://www.agbioforum.org/v3n23/v3n23a12-coffman.htm.
73. Collee, J.G., J.A. Knowlden and B.C. Hobbs. 1961. Studies on the growth and sporulation and carriage of Clostridium welchii with special reference to food-poisoning strains. J. Appl. Bacteriol. 24: 326-339.
74. Collie, R.E. and B.A. McClane. 1998. Evidence that the enterotoxin gene can be episomal in Clostridium perfringens isolates associated with non-food-borne human gastrointestinal diseases. J. Clin. Microbiol. 36: 30-36.
75. Collier, P.W., J.C.M. Sharp, A.F. MacLeod, G.I. Forbes and F. MacKay. 1988. Food poisoning in hospitals in Scotland, 1978-87. Epidemiol. Infect. 101: 661-667.
76. Craven, S.E. 1980. Growth and sporulation of Clostridium perfringens in foods. Food Technol. 4: 80-87.
77. Craven, S.E. 1990. The effect of the pH of the sporulation environment on the heat resistance of Clostridium perfringens spores. Curr. Microbiol. 22: 233-237.
78. Craven, S.E. and L.C. Blankenship. 1985. Activation and injury of Clostridium perfringens spores by alcohols. Appl. Environ. Microbiol. 50: 249-256.
79. Craven, S.E., L.C. Blankenship and J.L. McDonel. 1981. Relationship of sporulation, enterotoxin formation, and spoilage during growth of Clostridium perfringens type A in cooked chicken. Appl. Environ. Microbiol. 41: 1184-1191.
80. Craven, S.E. and H.S. Lillard. 1974. Effect of microwave heating of precooked chicken on Clostridium perfringens. J. Food Sci. 39: 211-212.
81. Czeczulin, J.R., R.E. Collie and B.A. McClane. 1996. Regulated expression of Clostridium perfringens enterotoxin in naturally cpe-negative type A, B, and C isolates of C. perfringens. Infect. Immun. 64: 3301-3309.
82. Daly, C., W.E. Sandine and P.R. Elliker. 1972. Interactions of food starter cultures and foodborne pathogens: Streptococcus diacetilactis versus food pathogens. J. Milk Food Technol. 35: 349-357.
83. Daniels, R.W. 1991. Applying HACCP to new-generation refrigerated foods at retail and beyond. Food Technol. 45: 122-124.

References
102
84. Daube, G., B. China, P. Simon, K. Hvala and J. Mainil. 1994. Typing of Clostridium perfringens by in-vitro amplification of toxin genes. J. Appl. Bacteriol. 77: 650-655.
85. de Lezenne Coulander, P.A. 1993. Koelkasttemperaturen thuis. Keuringsdienst van Waren, Leeuwarden, The Netherlands. pp 27.
86. Debevere, J.M. 1979. A simple method fot the isolation and determination of Clostridium perfringens. Eur. J. Appl. Microbiol. 6: 409-414.
87. Dickerson, R.W. and R.B. Read. 1973. Cooling rates of foods. J. Milk Food Technol. 36: 167-171.
88. Dische, F.E. and S.D. Elek. 1957. Experimental food-poisoning by C. welchii. Lancet. 2: 71-74.
89. Doyle, M.E. 2001. SIDS and enteric bacteria. FRI Newsletter. 13: 5. 90. Dromigny, E., F. Bourrion, Y. Rugraf, F.J. Bolton and N. Leden. 1997. New media
for detection and counting of Clostridia in foods. Lett. Appl. Microbiol. 24: 19-22. 91. Duncan, C.L. and D.H. Strong. 1968. Improved medium for sporulation of
Clostridium perfringens. Appl. Microbiol. 16: 82-89. 92. Duncan, C.L., D.H. Strong and M. Sebald. 1972. Sporulation and enterotoxin
production in mutants of Clostridium perfringens. J. Bacteriol. 110: 378-391. 93. Dutta, G.N., L.A. Devriese and P.F. Van Assche. 1983. Susceptibility of clostridia
from farm animals to 21 antimicrobial agents including some used for growth promotion. J. Antimicrob. Chemother. 12: 347-356.
94. Duynhoven, Y.T.H.P., van and M.A.S. de Wit. 1998. Registratie van voedselinfecties en -vergiftigingen onderzocht door GGD's en Regionale Inspecties Gezondheidsbescherming/Keuringsdiensten van Waren, 1997. RIVM, Bilthoven. pp
95. Duynhoven, Y.T.H.P.v. and M.A.S. de Wit. 1999. Registratie van voedselinfecties en -vergiftigingen onderzocht door GGD's en Keuringsdiensten van Waren, 1998. RIVM, Bilthoven. pp 30.
96. Duynhoven, Y.T.H.P.v. and M.A.S. de Wit. 2000. Registratie van voedselinfecties en -vergiftigingen bij GGD's en Keuringsdiensten van Waren, 1999. RIVM, Bilthoven. pp
97. Duynhoven, Y.T.H.P.v., L.J.M. Eerden and M.J.M.v.d. Broek. 2002. Registratie van voedselinfecties en -vergiftigingen onderzocht door GGD's en Keuringsdiensten van Waren, 2001. RIVM, Bilthoven. pp 24.
98. Duynhoven, Y.T.H.P.v., M.A.S.d. Wit and M.J.M.v.d. Broek. 2001. Registratie van voedselinfecties en -vergiftigingen onderzocht door GGD's en Keuringsdiensten van Waren, 2000. RIVM, Bilthoven. pp 27.
99. Eisgruber, H., P. Geppert, B. Sperner and A. Stolle. 2003. Evaluation of different methods for the detection of Clostridium perfringens phosphatases. Int. J. Food Microbiol. 82: 81-86.
100. Eisgruber, H. and G. Reuter. 1995. A selective medium for the detection and enumeration of mesophilic sulphite-reducing clostridia in food monitoring programs. Food Res. Int. 28: 219-226.
101. Ellner, P.D. 1956. A medium promoting rapid quantitative sporulation in Clostridium perfringens. J. Bacteriol. 71: 495-496.

References
103
102. Erickson, J.E. and R.H. Deibel. 1978. New medium for rapid screening and enumeration of Clostridium perfringens in foods. Appl. Environ. Microbiol. 36: 567-571.
103. Etchegaray, J.P. and M. Inouye. 1999. CspA, CspB, and CspG, major cold shock proteins in Escherichia coli, are induced at low temperature under conditions that completely block protein synthesis. J. Bacteriol. 181: 1827-1830.
104. Euzéby, J.P. 1997. List of bacterial names with standing in nomenclature. 1999. Available at: http://www-sv.cict.fr/bacterio/c/clostridium.html. Accessed 13-10-1999.
105. Evans, J., S. Russell and S. James. 1996. Chilling of recipe dish meals to meet cook-chill guidelines. Int. J. Refrig. 19: 79-86.
106. Everis, L. and G. Betts. 2001. pH stress can cause cell elongation in Bacillus and Clostridium species: a research note. Food Control. 12: 53-56.
107. Fapohunda, A.O., K.W. McMillin, D.L. Marshall and W.M. Waites. 1994. Growth of selected cross-contaminating bacterial pathogens on beef and fish at 15 and 35°C. J. Food Protect. 57: 337-340.
108. Fazil, A.M., T. Ross, G. Paoli, P. Vanderlinde, P. Desmarchelier and A.M. Lammerding. 2001. A probabilistic analysis of Clostridium perfringens growth during food service operations. Int. J. Food Microbiol. 73: 315-329.
109. Microtech Laboratories, 1998. In Fazil, A.M., T. Ross, G. Paoli, P. Vanderlinde, P. Desmarchelier and A.M. Lammerding. 2002. A probabilistic analysis of Clostridium perfringens growth during food service operations. Int. J. Food Microbiol. 73: 315-329.
110. Federal Register. 1999 (January 6). Rules and regulations. 64:732-749. Available at: http://www.access.gpo.gov/su_docs/fedreg/a990106c.html. Accessed 06-03-2003.
111. Fischer, L.H., D.H. Strong and C.L. Duncan. 1970. Resistance of Clostridium perfringens to varying degrees of acidity during growth and sporulation. J. Food Sci. 35: 91-95.
112. Food Safety and Inspection. Service US Department of Agriculture. 2000. Focus on: holiday or party buffets. Available at: http://www.fsis.usda.gov/OA/pubs/buffets.htm. Accessed 12-03-2003.
113. Foster, S.J. 1994. The role and regulation of cell wall structural dynamics during differentiation of endospore-forming bacteria. J. Appl. Bact. Symp. Suppl. 76: 25S-39S.
114. Franz, C.M.A.P. and A.v. Holy. 1996. Thermotolorance of meat spoilage lactic acid bacteria and their inactivation in vacuum-packaged vienna sausages. Int. J. Food Microbiol. 29: 59-73.
115. Fruin, J.T. 1977. Significance of Clostridium perfringens in processed foods. J. Food Protect. 40: 330-332.
116. Fruin, J.T. and F.J. Babel. 1977. Changes in the population of Clostridium perfringens type A frozen in a meat medium. J. Food Protect. 40: 622-625.
117. Fruin, J.T. and L.S. Guthertz. 1982. Survival of bacteria in food cooked by microwave oven, conventional oven and slow cookers. J. Food Protect. 45: 695-698.

References
104
118. Fujita, K., J. Katahira, Y. Horiguchi, N. Sonoda, M. Furuse and S. Tsukita. 2000. Clostridium perfringens enterotoxin binds to the second extracellular loop of claudin-3, a tight junction integral membrane protein. FEBS Lett. 476: 258-261.
119. Futter, B.V. and G. Richardson. 1971. Anaerobic jars in the quantitative recovery of Clostridia, p. 81-91. In D.A. Shapton and R.G. Board (ed.), Isolation of anaerobes, vol. 5. Academic press Inc., London, UK.
120. Galton, M.M., W.D. Lowery and A.V. Hardy. 1954. Salmonella in fresh and smoked pork sausage. J. Infect. Dis. 95: 232-235.
121. García-Alvarado, J.S., R.G. Labbe and M.A. Rodriguez. 1992. Sporulation and enterotoxin production by Clostridium perfringens type A at 37and 43°C. Appl. Environ. Microbiol. 58: 1411-1414.
122. Gibson, A.M. and T.A. Roberts. 1986. The effect of pH, sodium chloride, sodium nitrite and storage temperature on the growth of Clostridium perfringens and faecal streptococci in laboratory media. Int. J. Food Microbiol. 3: 195-210.
123. Gilliland, S.E. and M.L. Speck. 1977. Antagonistic action of Lactobacillus acidophilus toward intestinal and foodborne pathogens in associated cultures. J. Food Protect. 40: 820-823.
124. Goepfert, J.M. and H.U. Kim. 1975. Behavior of selected food-born pathogens in raw ground beef. J. Milk Food Technol. 38: 449-452.
125. Goldner, S.B., M. Solberg, S. Jones and L.S. Post. 1986. Enterotoxin synthesis by nonsporulating cultures of Clostridium perfringens. Appl. Environ. Microbiol. 52: 407-412.
126. Goosen, E.S.M., M.J.W. Sprenger and M.W. Borgdorff. 1995. Meldingen van voedselinfecties en voedselvergiftigingen bij Inspecties Gezondheidsbescherming/Keuringsdiensten van Waren in de periode 1991-1994. RIVM, Bilthoven. pp
127. Gough, B.J. and J.A. Alford. 1965. Effect of curing agents on the growth and survival of food-poisoning strains of Clostridium perfringens. J. Food Sci. 30: 1025-1029.
128. Granum, P.E. 1990. Clostridium perfringens toxins involved in food poisoning. Int. J. Food Microbiol. 10: 101-112.
129. Granum, P.E. and O. Harbitz. 1991. A circulardichroism study of the enterotoxin from Clostridium perfringens type A. TOXIA. 9: 137-146.
130. Granum, P.E. and G.S.A.B. Stewart. 1992. Molecular biology of Clostridium perfringens enterotoxin, p. 235-247. In M. Sebald (ed.), Genetics and Molecular Biology of Anaerobic Bacteria. Springer-Verlag, New York.
131. Granum, P.E., W. Telle and O. Stavn. 1984. Enterotoxin formation by Clostridium perfringens during sporulation and vegetative growth. Int. J. Food Microbiol. 1: 43-49.
132. Greene, A. 2002. Clostridium perfringens. Available at: http://www.drgreene.com/21_1047.html. Accessed 12-03-2003.
133. Gubash, S.M. and L. Ingham. 1997. Comparison of a new, bismuth-iron-sulfite-cycloserine agar for isolation of Clostridium perfringens with the tryptose-sulfite-cycloserine and blood agars. Zbl. Bakt. 285: 397-402.

References
105
134. Guerlava, P., S. Nolf and J.L. Tholozan. 1998. Rapid cooling, moderate heat treatment and nisin addition influence cell homeostasis of Clostridium perfringens type A. Int. J. Food Microbiol. 39: 195-203.
135. Guerlava, P. and J.L. Tholozan. 1995. Influence of metal ions on growth kinetics and internal pH regulation of Clostridium perfringens. Meded. Fac. Landb. Toegep. Biol. Wet. Univ. Gent. 60: 1875-1878.
136. Hagberg, M.M., F.F. Busta, E.A. Zottola and E.A. Arnold. 1973. Incidence of potentially pathogenic microorganisms in further-processed turkey products. J. Milk Food Technol. 36: 625-634.
137. Hall, H.E. and R. Angelotti. 1965. Clostridium perfringens in meat and meat products. Appl. Microbiol. 13: 352-357.
138. Hall, H.E., R. Angelotti, K.H. Lewis and M.J. Foter. 1963. Characteristics of Clostridium perfringens strains associated with food and food-borne disease. J. Bacteriol. 85: 1094-1103.
139. Handford, P.M. and J.J. Cavett. 1973. A medium for the detection and enumeration of Clostridium perfringens (welchii) in foods. J. Sci. Food Agr. 24: 487.
140. Handford, P.M., D.A. Kautter and J.T. Peeler. 1971. Comparison of media for the enumeration of Clostridium perfringens. Appl. Microbiol. 21: 922-927.
141. Hanna, P.C., E.U. Wieckowski, T.A. Mietzner and B.A. McClane. 1992. Mapping of functional regions of Clostridium perfringens type A enterotoxin. Infect. Immun. 60: 2110-2114.
142. Hansen, M.V. and L.P. Elliott. 1980. New presumptive identification test for Clostridium perfringens: reversed CAMP test. J. Clin. Microbiol. 12: 617-619.
143. Harmon, S.M. 1976. Collaborative study of an improved method for the enumeration and confirmation of Clostridium perfringens in foods. J. Assoc. Off. Anal. Chem. 59: 606-612.
144. Harmon, S.M. and D.A. Kautter. 1978. Media for the confirmation of Clostridium perfringens from food and feces. J. Food Protect. 41: 626-630.
145. Harmon, S.M. and D.A. Kautter. 1986. Improved media for sporulation and enterotoxin production by Clostridium perfringens. J. Food Protect. 49: 706-711.
146. Harmon, S.M., D.A. Kautter and J.T. Peeler. 1971. Comparison of media for the enumeration of Clostridium perfringens. Appl. Microbiol. 21: 922-927.
147. Harmon, S.M., D.A. Kautter and J.T. Peeler. 1971. Improved medium for enumeration of Clostridium perfringens. Appl. Microbiol. 22: 688-692.
148. Smith,L., 1975. In Hatheway, C.L., D.N. Whaley and V.R.j. Dowell. 1980. Epidemiological aspects of Clostridium perfringens foodborne illness. Food Technol. 4: 77-79.
149. Hauschild, A.H.W. 1971. Clostridium perfringens enterotoxin. J. Milk Food Technol. 34: 596-599.
150. Hauschild, A.H.W. and R. Hilsheimer. 1974. Evaluation and modifications of media for enumeration of Clostridium perfringens. Appl. Microbiol. 27: 78-82.
151. Hauschild, A.H.W., R. Hilsheimer and D.W. Griffith. 1974. Enumeration of fecal Clostridium perfringens spores in egg yolk-free tryptose-sulfite-cycloserine agar. Appl. Microbiol. 27: 527-530.
152. Hauschild, A.H.W. and F.S. Thatcher. 1967. Experimental food poisoning with heat-susceptible Clostridium perfringens Type A. J. Food Saf. 32: 467.

References
106
153. Heredia, N.L., G.A. García, R. Luévanos, R.G. Labbe and J.S. García-Alvarado. 1997. Elevation of the heat resistance of vegetative cells and spores of Clostridium perfringens type A by sublethal heat shock. J. Food Protect. 60: 998-1000.
154. Heredia, N.L., R.G. Labbe and J.S. García-Alvarado. 1998. Alteration in sporulation, enterotoxin production, and protein synthesis by Clostridium perfringens type A following heat shock. J. Food Protect. 61: 1143-1147.
155. Heredia, N.L., R.G. Labbe, M.A. Rodriguez and J.S. García-Alvarado. 1991. Growth, sporulation and enterotoxin production by C. perfringens type A in the presence of human bile salts. FEMS Microbiol. Lett. 84: 15-22.
156. Hewitt, J.H., N. Begg, J. Hewish, S. Rawaf, M. Stringer and B. Theodore-Gandi. 1986. Large outbreaks of Clostridium perfringens food poisoning associated with the consumption of boiled salmon. J. Hyg. (Cambridge). 97: 71-80.
157. Hickey, C.S. and M.G. Johnson. 1981. Effect of pH shift, bile salts, and glucose on sporulation of Clostridium perfringens NCTC 8798. Appl. Environ. Microbiol. 41: 124-129.
158. Hobbs, B.C. and R.G.A. Sutton. 1967. Characteristics of spores Clostridium welchii in relation to food hygiene, In V. Fredetti (ed.), The Anaerobic Bacteria; Proceedings of an International Workshop. University of Montreal, Canada, Montreal.
159. Hobbs, G., K. Williams and A.T. Willis. 1971. Basic methods for the isolation of Clostridia, p. 1-23. In D.A. Shapton and R.G. Board (ed.), Isolation of anaerobes, vol. 5. Academic Press Inc., London.
160. Hoi Seon, L., L. Sang Guei, L. Sung Eun, M. Sang Yong and K. Moo Key. 2000. Effect of growth-inhibitory substances from domestic medicinal plants against human lactic acid and harmful intestinal bacteria. Food Sci. Biotechnol. 9: 222-227.
161. Hood, A.M., A. Tuck and C.R. Dane. 1990. A medium for the isolation, enumeration and rapid presumptive identification of injured Clostridium perfringens and Bacillus cereus. J. Appl. Bacteriol. 69: 359-372.
162. Hoogenboom-Verdegaal, A.M.M., M. During and J.M. Klokman-Houweling. 1992. Voedselinfecties en -vergiftigingen in Nederland 1979 t/m 1990. RIVM, Bilthoven. pp
163. Huang, L. 2002. Destription of growth of Clostridium perfringens in cooked beef with multiple linear models. Food Microbiol. 19: 577-587.
164. Hughes, J.A., P.C.B. Turnbull and M.F. Stringer. 1976. A serotyping system for Clostridum welchii (C. perfringens) type A, and studies on the type-specific antigens. J. Med. Microbiol. 9: 475-485.
165. Hughey, V.L. and E.A. Johnson. 1987. Antimicrobial activity of lysozyme against bacteria involved in food spoilage and food-borne disease. Appl. Environ. Microbiol. 53: 2165-2170.
166. Hutton, M.T., P.A. Dhehak and J.H. Hanlin. 1991. Inhibition of botulinum toxin production by Pedicoccus acidilacti in temperature abused refrigerated foods. J. Food Saf. 11: 255-267.
167. Ingram, M. 1969. Sporeformers as food spoilage organisms, p. 568-582. In G.W. Gould and A. Hurst (ed.), The bacterial spore. Academic Press Ltd., London.

References
107
168. Isken, S., P.M.A.C. Santos and J.A.M. Bont, de. 1997. Effect of solvent adaptation on the antibiotic resistance in Pseudomonas putida S12. Appl. Microbiol. Biotechnol. 48: 642-647.
169. Jansen, H.A.P.M. 2002. Microbiolgisch onderzoek van kant en klaar maaltijden in Nederland, 2001. Keuringsdienst van Waren Zuid, Den Bosch, The Netherlands. pp 10.
170. Jansson, E. 1998. Maximum, safe food cooling times in food service situations. Available at: http://www.dfst.csiro.au/fshbull/fshbull12.htm. Accessed 02-11-2002.
171. Johnstone, K. 1994. The trigger mechanism of spore germination: current concepts. J. Appl. Bact. Symp. Suppl. 76: 17S-24S.
172. Jong, A.E.I., de, R.R. Beumer and F.M. Rombouts. 2002. Optimizing sporulation of Clostridium perfringens. J. Food Protect. 65: 1457-1462.
173. Jong, A.E.I., de, G.P. Eijhusen, E.J.F. Brouwer-Post, M. Grand, T. Johansson, T. Kärkkäinen, J. Marugg, P.H. in't Veld, F.H.M. Warmerdam, G. Wörner, A. Zicavo, F.M. Rombouts and R.R. Beumer. 2003. Comparison of media for enumeration of Clostridium perfringens from foods. J. Microbiol. Methods. 54: 359-366.
174. Jong, A.E.I., de., F.M. Rombouts and R.R. Beumer. 2003. Effect of cooling on Clostridium perfringens in pea soup. Journal of Food Protection, in press.
175. Jukes, D.J. 1999. Food irradiation - Agreement at last. Available at: http://www.foodlaw.rdg.ac.uk/news/eu-99-3.htm. Accessed 12-05-2003.
176. Juneja, V.K., J.E. Call, B.S. Marmer and A.J. Miller. 1994. The effect of temperature abuse on Clostridium perfringens in cooked turkey stored under air and vacuum. Food Microbiol. 11: 187-193.
177. Juneja, V.K., J.E. Call and A.J. Miller. 1993. Evaluation of methylxanthines and related compounds to enhance Clostridium perfringens sporulation using a modified Duncan and Strong medium. J. Rapid Meth. Autom. Microbiol. 2: 203-218.
178. Juneja, V.K. and W.M. Majka. 1995. Outgrowth of Clostridium perfringens spores in cook-in-bag beef products. J. Food Saf. 15: 21-34.
179. Juneja, V.K. and H.M. Marks. 2002. Predictive model for growth of Clostridium perfringens during cooling of cooked cured chicken. Food Microbiol. 19: 313-327.
180. Angulo, F.L., A.C. Voetsch, D. Vugia, J.L. Hadler, M. Farley, C. Hedberg, P.R. Cieslak, D. Morse, D. Dwyer, and D.L. Swerdlow. 1998. In Juneja, V.K. and H.M. Marks. 2002. Predictive model for growth of Clostridium perfringens during cooling of cooked cured chicken. Food Microbiol. 19: 313-327.
181. Juneja, V.K. and B.S. Marmer. 1998. Thermal inactivation of Clostridium perfringens vegetative cells in ground beef and turkey as affected by sodium pyrophosphate. Food Microbiol. 15: 281-287.
182. Juneja, V.K., B.S. Marmer and A.J. Miller. 1994. Growth and sporulation potential of Clostridium perfringens in aerobic and vacuum-packaged cooked beef. J. Food Protect. 57: 393-398.
183. Juneja, V.K., B.S. Marmer, J.G. Phillips and S.A. Palumbo. 1996. Interactive effects of temperature, initial pH, sodium chloride, and sodium pyrophosphate on the growth kinetics of Clostridium perfringens. J. Food Protect. 59: 963-968.
References
108
184. Juneja, V.K., J.S. Novak, H.M. Marks and D.E. Gombas. 2001. Growth of Clostridium perfringens from spore inocula in cooked cured beef: development of a predictive model. Innovative Food Science & Emerging Technologies. 2: 289-301.
185. Juneja, V.K., O.P. Snyder, Jr. and M. Cygnarowicz-Provost. 1994. Influence of cooling rate on outgrowth of Clostridium perfringens spores in cooked ground beef. J. Food Protect. 57: 1063-1067.
186. Juneja, V.K., R.C. Whiting, H.M. Marks and O.P. Snyder. 1999. Predictive model for growth of Clostridium perfringens at temperatures applicable to cooling of cooked meat. Food Microbiol. 16: 335-349.
187. Kang, C.K., M. Woodburn, A. Pagenkopf and R. Cheney. 1969. Growth, sporulation, and germination of Clostridium perfringens in media of controlled water activity. Appl. Microbiol. 18: 798-805.
188. Katayama, S., B. Dupuy, G. Daube, B. China and S.T. Cole. 1996. Genome mapping of Clostridium perfringens strains with I-CeuI shows many virulence genes to be plasmid-borne. Mol. Gen. Genet. 251: 720-726.
189. Keynan, A. and H. Halvorson. 1965. Transformation of a dormant spore into a vegetative cell, p. 174-179. In L.L. Campbell and H.O. Halvorson (ed.), Spores III. American Society for Microbiology, Washinton, DC.
190. Kim, C.H., R. Cheney and M. Woodburn. 1967. Sporulation of Clostridium perfringens in a modified medium and selected foods. Appl. Microbiol. 15: 871-876.
191. Kim, M.-K., M.-J. Kim, D.-H. Shin, C.-G. Song and H.-S. Lee. 2001. Growth-inhibiting effects of vegetable extracts on beneficial and harmful human intestinal bacteria. Agricultural Chemistry and Biotechnology. 44: 65-70.
192. Kimura, B., S. Kuroda, M. Murakami and T. Fujii. 1996. Growth of Clostridium perfringens in fish fillets packaged with a controlled carbon dioxide atmosphere at abuse temperatures. J. Food Protect. 59: 704-710.
193. Klein, E. 1895. On a pathogenic anaerobic intestinal bacillus, Bacillus enteritidis sporogenes. Zbl. Bakt. Paras. Infekt. Abt. Orig. 18: 737-743.
194. Klein, W., M.H.W. Weber and M.A. Marahiel. 1999. Cold shock response of Bacillus subtilis: isoleucine-dependent switch in the fatty acid branching pattern for membrane adaptation to low temperatures. J. Bacteriol. 181: 5341-5349.
195. Knox, R. and E.K. MacDonald. 1943. Outbreaks of food poisoning in certain Leicester institutions. Med. Off. 69: 21-22.
196. Kondo, F. and H. Kuroki. 2001. The effects of subminimal inhibitory concentrations of beta-lactam antibiotics against Clostridium perfringens. Microbios. 105: 163-174.
197. Kondo, F. and S. Nagsui. 1988. Gas-liquid chromatographic determination of organic acid production differentiates between the food-poisoning and toxigenic-type strains of Clostridium perfringens. J. Food Protect. 51: 283-288.
198. Labbe, R.G. 1980. Relationship between sporulation and enterotoxin production in Clostridium perfringens type A. Food Technol. 34: 88-90.
199. Labbe, R.G. 1989. Clostridium perfringens, p. 191-234. In M.P. Doyle (ed.), Foodborne Bacterial Pathogens. Marcel Dekker, Inc., New York.
200. Labbe, R.G. and C.L. Duncan. 1970. Growth from spores of Clostridium perfringens in the presence of sodium nitrite. Appl. Microbiol. 19: 353-359.

References
109
201. Labbe, R.G. and C.L. Duncan. 1974. Sporulation and enterotoxin production by Clostridium perfringens type A under conditions of controlled pH and temperature. Can. J. Microb. 20: 1493-1501.
202. Labbe, R.G. and T.H. Huang. 1995. Generation times and modeling of enterotoxin-positive and enterotoxin-negative strains of Clostridium perfringens in laboratory media and ground beef. J. Food Protect. 58: 1303-1306.
203. Labbe, R.G. and D.K. Rey. 1979. Raffinose increases sporulation and enterotoxin production by Clostridium perfringens type A. Appl. Environ. Microbiol. 37: 1196-1200.
204. Larson, H.E. and S.P. Borriello. 1988. Infectious diarrhea due to Clostridium perfringens. J. Infect. Dis. 157: 390-391.
205. Lazazzera, B., T. Palmer, J. Quinsel and A. Grossman. 1999. Cell density control of gene expression and development in Bacillus subtilis, p. 27-46. In G.M. Dunny and S.C. Winans (ed.), Cell-cell signaling in bacteria. ASM Press, Washington, D.C.
206. Leblanc, J.M.J. and P. Rijswijk. 2002. Doel gericht handhaven; Interne tussen rapportage temperatuursactie periode 01-06-2002 tot 31-07-2002. Keuringsdienst van Waren, Den Bosch, The Netherlands. pp 21.
207. Lee, H.S., M.S. Beon and M.K. Kim. 2001. Selective growth inhibitor toward human intestinal bacteria derived from Pulsatilla cernua root. J. Agr. Food Chem. 49: 4656-4661.
208. Leung, J.W., Y.L. Liu, P.S. Leung, R.C. Chan, J.F. Inciardi and A.F. Cheng. 2001. Expression of bacterial beta-glucuronidase in human bile: an in vitro study. Gastrointest. Endosc. 54: 346-350.
209. Lewis, C. 1998. Home cookin'; consumers' kitchens fail inspections. Available at: http://www.cfsan.fda.gov/~dms/fdcookin.html. Accessed 02-11-2002.
210. Longrée, K., L. Moragne and J.C. White. 1963. Cooling menu items by agitation under refrigeration. J. Milk Food Technol. 26: 317-322.
211. Lukinmaa, S., E. Takkunen and A. Siitonen. 2002. Molecular epidemiology of Clostridium perfringens related to food-borne outbreaks of disease in Finland from 1984 to 1999. Appl. Environ. Microbiol. 68: 3744-3749.
212. Lund, B.M. 1990. Foodborne illness; foodborne disease due to Bacillus and Clostridium species. Lancet. 336: 982-986.
213. Manafi, M. 2000. New developments in chromogenic and fluorogenic culture media. Int. J. Food Microbiol. 60: 205-218.
214. Marshall, R.S., J.F. Steenbergen and L.S. McClung. 1965. Rapid technique for the enumeration of Clostridium perfringens. Appl. Microbiol. 13: 559-563.
215. McClane, B.A. 1992. Clostridium perfringens enterotoxin: structure, action and detection. J. Food Saf. 12: 237-252.
216. McClane, B.A. 2000. Clostridium perfringens enterotoxin and intestinal tight junctions. Trends Microbiol. 8: 145-146.
217. McClane, B.A. 2001. The complex interactions between Clostridium perfringens enterotoxin and epithelial tight junctions. TOXIA. 39: 1781-1791.
218. McClane,B.A., and K.L. McDonel, 1979. In McClane, B.A. and J.L. McDonel. 1979. In McDonel, J.L. 1980. Mechanism of action of Clostridium perfringens enterotoxin. Food Technol. 34: 91-95.

References
110
219. McClane, B.A., A.P. Wnek, K.I. Hulkower and P.C. Hanna. 1988. Divalent cation involvement in the action of Clostridium perfringens type A enterotoxin. J. Biol. Chem. 263: 2423-2435.
220. McDonel, J.L. 1974. In McDonel, J.L. 1980. Mechanism of action of Clostridium perfringens enterotoxin. Food Technol. 34: 91-95.
221. McDonel, J.L. 1986. Toxins of Clostridium perfringens types A, B, C, D and E., p. 477-517. In F. Dorner and J. Drews (ed.), Pharmacology of bacterial toxins. Pergamom Press, Oxford.
222. McDonel, J.L., L.W. Chang, J.G. Pounds, and C.L. Duncan, 1978. In McDonel, J.L., L.W. Chang, J.G. Pounds and C.L. Duncan. 1978. In McDonel, J.L. 1980. Mechanism of action of Clostridium perfringens enterotoxin. Food Technol. 34: 91-95.
223. McDonel, J.L. and C.L. Duncan. 1977. In McDonel, J.L. 1980. Mechanism of action of Clostridium perfringens enterotoxin. Food Technol. 34: 91-95.
224. McDonel, J.L. and B.A. McClane. 1979. In McDonel, J.L. 1980. Mechanism of action of Clostridium perfringens enterotoxin. Food Technol. 34: 91-95.
225. McKane, L. and J. Kandel. 1996. Bacterial structures and their functions, p. 66-95. In K.M. Prancan,D. Cloud, andE. Castellano (ed.), Microbiology; essentials and application. McGraw-Hill, Inc., New York.
226. Mead, G.C. 1969. Combined effect of salt concentration and redox potential of the medium on the initiation of vegetative growth by Clostridium welchii. J. Appl. Bacteriol. 32: 468-475.
227. Mead, G.C. 1969. Growth and sporulation of Clostridium welchii in breast and leg muscle of poultry. J. Appl. Bacteriol. 32: 86-95.
228. Mead, G.C. 1985. Selective and differential media for Clostridium perfringens. Int. J. Food Microbiol. 2: 89-98.
229. Mead, P.S., L. Slutsker, V. Dietz, L.F. McCaig, J.S. Bresee, C. Shapiro, P.M. Griffin and R.V. Tauxe. 1999. Food-related illness and death in the United States. Emerg. Infect. Dis. 5: 607-625.
230. Messens, W., P. Neysens, W. Vansieleghem, J. Vanderhoeven and L. De Vuyst. 2002. Modeling growth and bacteriocin production by Lactobacillus amylovorus DCE 471 in response to temperature and pH values used for sourdough fermentations. Appl. Environ. Microbiol. 68: 1431-1435.
231. Messens, W., J. Verluyten, F. Leroy and L. De Vuyst. 2003. Modelling growth and bacteriocin production by Lactobacillus curvatus LTH 1174 in response to temperature and pH values used for European sausage fermentation processes. Int. J. Food Microbiol. 81: 41-52.
232. Meyer, M. and J.L. Tholozan. 1999. A new growth and in vitro sporulation medium for Clostridium perfringens. Lett. Appl. Microbiol. 28: 98-102.
233. Michl, P., M. Buchholz, M. Rolke, S. Kunsch, M.L¦(hr, B. McClane, S. Tsukita, G. Leder, G. Adler and T.M. Gress. 2001. A new target for pancreatic cancer treatment using Clostridium perfringens enterotoxin. Gastroenterology. 121: 678-684.
234. Miwa, N., T. Masuda, A. Kwamura, K. Terai and M. Akiyama. 2002. Survival and growth of enterotoxin-positive and enterotoxin-negative Clostridium perfringens in laboratory media. Int. J. Food Microbiol. 72: 233-238.
References
111
235. Monk, J.D., L.R. Beuchat and M.P. Doyle. 1995. Irradiation inactivation of food-borne microorganisms. J. Food Protect. 58: 197-208.
236. Mooijman, K.A., P.H. Veld, in't, J.A. Hoekstra, S.H. Heisterkamp, A.H. Havelaar, S.H.W. Notermans, D. Roberts, B. Griepink and E. Maier. 1992. Development of microbiological reference materials. Commission of the European Communities, Luxembourg. pp 122.
237. Mossel, D.A.A. 1959. Enumeration of sulfite-reducing clostridia occurring in foods. J. Sci. Food Agr. 10: 662-669.
238. Mossel, D.A.A., A.S. de Bruin, H.M.J. van Diepen, C.M.A. Vendrig and G. Zoutewelle. 1956. The enumeration of anaerobic bacteria, and of Clostridium species in particular, in foods. J. Appl. Bacteriol. 19: 142-154.
239. Mpamugo, O., T. Donovan and M.M. Brett. 1995. Enterotoxigenic Clostridium perfringens as a cause of sporadic cases of diarrhoea. J. Med. Microbiol. 43: 442-445.
240. Muhammed, S.I., S.M. Morrison and W.L. Boyd. 1975. Nutritional requirements for growth and sporulation of Clostridium perfringens. J. Appl. Bacteriol. 38: 245-253.
241. Nagler, F.P.O. 1939. Observations on a reaction between the lethal toxin of C. welchii (type A) and human serum. Br. J. Exp. Pathol. 20: 473-485.
242. Naik, H.S. and C.L. Duncan. 1978. Thermal inactivation of Clostridium perfringens enterotoxin. J. Food Protect. 41: 100-103.
243. Olsen, S.J., L.C. MacKinnon, J.S. Goulding, N.H. Bean and L. Slutsker. 2000. Surveillance for foodborne-disease outbreaks - United States, 1993-1997. Morbid. Mortal. Weekly Rep. 49: 1-72.
244. O'Mahony, L., M. Feeney, S. O'Halloran, L. Murphy, B. Kiely, J. Fitzgibbon, G. Lee, G. O'Sullivan, F. Shanahan and J.K. Collins. 2001. Probiotic impact on microbial flora, inflammation and tumour development in IL-10 knockout mice. Aliment. Parm. Therap. 15: 1219-1225.
245. Parikh, A.I., M.T. Jay, D. Kassam, T. Kociemba, B. Dworkis, P.D. Bradley and K. Takata. 1997. Clostridium perfringens outbreak at a juvenile detention facility linked to a thanksgiving holiday meal. West. J. Med. 166: 417-419.
246. Petersen, L.R., R. Mshar, G.H. Cooper, jr, A.R. Bruce and J.L. Hadler. 1988. A large Clostridium perfringens foodborne outbreak with an unusual attack rate pattern. Am. J. Epidemiol. 127: 605-611.
247. Petit, L., M. Gibert and M.R. Popoff. 1999. Clostridium perfringens: toxinetype and genotype. Trends Microbiol. 7: 104-110.
248. Razem, D. and B. Katusin-Razem. 1994. The incidence and costs of foodborne diseases in Croatia. J. Food Protect. 57: 746-753.
249. Reenstra-Buras, W.R. and N.E. Wang. 2002. Gas gangrene. Available at: http://www.emedicine.com/EMERG/topic211.htm. Accessed 13-03-2003.
250. Rey, C.R., H.W. Walker and P.L. Rohrbaugh. 1975. The influence of temperature on growth, sporulation, and heat resistance of spores of six strains of Clostridium perfringens. J. Milk Food Technol. 38: 461-465.
251. Harris, R.D. 1989. In Rhodehamel, E.J. 1992. FDA's concerns with sous vide processing. Food Technol. 46: 73-76.

References
112
252. Rhodehamel, E.J. and M.D. Pierson. 1990. Sodium hypophosphite inhibition of the growth of selected gram-positive foodborne pathogenic bacteria. Int. J. Food Microbiol. 11: 167-178.
253. Ridell, J., J. Björkroth, H. Eisgrueber, B. Schalch, A. Stolle and H. Korkeala. 1998. Prevalence of the enterotoxin gene and clonality of Clostridium perfringens strains associated with food-poisoning outbreaks. J. Food Protect. 61: 240-243.
254. Riha, W.E.j. and M. Solberg. 1975. Clostridium perfringens inhibition by sodium nitrite as a function of pH, inoculum size and heat. J. Food Sci. 40: 439-442.
255. Robach, M.C., F.J. Ivey and C.S. Hickey. 1978. System for evaluating clostridial inhibition in cured meat products. Appl. Environ. Microbiol. 36: 210.
256. Roberts, T.A. 1968. Heat and radiation resistance and activation of spores of Clostridium welchii. J. Appl. Bacteriol. 32: 133-144.
257. Roberts, T.A. and C.M. Derrick. 1978. The effect of curing salts on the growth of Clostridium perfringens (welchii) in a laboratory medium. J. Food Technol. 13: 349-353.
258. Roberts, T.A. and A.D. Hitchins. 1969. Resistance of spores, p. 611-624. In G.W. Gould and A. Hurst (ed.), The bacterial spore. Academic Press Ltd., London.
259. Rodrigues Romo, L.A., N.L. Heredia, R.G. Labbe and J.S. García-Alvarado. 1998. Detection of enterotoxigenic Clostridium perfringens in spices used in Mexico by dot blotting using a DNA probe. J. Food Protect. 61: 201-204.
260. Rosso, L., J.R. Lobry, S. Bajard and J.P. Flandrois. 1995. Convenient model to describe the combined effects of temperature and pH on microbial growth. Appl. Environ. Microbiol. 61: 610-616.
261. Ryu, S. and R.G. Labbe. 1993. A 48 kilodalton enterotoxin-related protein from Clostridium perfringens vegetative and sporulating cells. Int. J. Food Microbiol. 17: 343-348.
262. Sacks, L.E. and P.A. Thompson. 1977. Increased spore yields of Clostridium perfringens in the presence of methylxanthines. Appl. Environ. Microbiol. 34: 189-193.
263. Sacks, L.E. and P.A. Thompson. 1978. Clear defined medium for the sporulation of Clostridium perfringens. Appl. Environ. Microbiol. 35: 405-410.
264. Samuel, S.C., P. Hancock and D.A. Leigh. 1991. An investigation into Clostridium perfringens enterotixin-associated diarrhoea. J. Hosp. Infect. 12: 237-252.
265. Sarker, M.R., R.J. Carman and B.A. McClane. 1999. Inactivation of the gene (cpe) encoding Clostridium perfringens enterotoxin eliminates the ability of two cpe-positive C. perfringens type A human gastrointestinal disease isolates to affect rabbit ileal loops. Mol. Microbiol. 33: 946-958.
266. Sarker, M.R., R.P. Shivers, S.G. Sparks, V.K. Juneja and B.A. McClane. 2000. Comparative experiments to examine the effects of heating on vegetative cells and spores of Clostridium perfringens isolates carrying plasmid enterotoxin genes versus chromosomal enterotoxin genes. Appl. Environ. Microbiol. 66: 3234-3240.
267. Saunders, W.B. 2002. Dorland's Medical Dictionary. Available at: http://www.mercksource.com/pp/us/cns/cns_hl_dorlands.jsp?pg=/ppdocs/us/common/dorlands/dorland/dmd_c_41.htm. Accessed 13-03-2003.

References
113
268. Schallehn, G. and H. Brandis. 1973. Phosphatase-Reagenz zur schnellen Identifizierung von Clostridium perfringens. Zbl. Bakt. Hyg., I. Abt. Orig. A. 225: 343-345.
269. Setlow, P. 1984. Germination and outgrowth, p. 211-254. In A. Hurst and G.W. Gould (ed.), The bacterial spore, vol. 2. Academic Press, London.
270. Shahidi, S.A. and A.R. Ferguson. 1971. New quantitative, qualitative, and confirmatory media for rapid analysis of food for Clostridium perfringens. Appl. Microbiol. 21: 500-506.
271. Shaw, M.K. and J.L. Ingraham. 1965. Fatty acid composition of Escherichia coli as a possible controlling factor of the minimal growth temperature. J. Bacteriol. 90: 141-146.
272. Shigehisa, T., T. Nakagami and S. Taji. 1985. Influence of heating and cooling rates on spore germination and growth of Clostridium perfringens in media and in roast beef. Jpn. J. Vet. Sci. 47: 259-267.
273. Shih, N.J. and R.G. Labbe. 1996. Sporulation-promoting ability of Clostridium perfringens culture fluids. Appl. Environ. Microbiol. 62: 1441-1443.
274. Shimizu, T., S. Ohshima, K. Ohtani and H. Hayashi. 2001. Genomic map of Clostridium perfringens strain 13. MIIMD. 45: 179-189.
275. Shoemaker, S.P. and M.D. Pierson. 1976. "Phoenix phenomenon" in growth of Clostridium perfringens. Appl. Environ. Microbiol. 32: 803-807.
276. Sikes, A. and R. Ehioba. 1999. Feasibility of using food-grade additives to control the growth of Clostridium perfringens. Int. J. Food Microbiol. 46: 179-185.
277. Sissom, L.E. and D.R. Pitts. 1972. Elements of transport phenomena. McGraw-Hill Book Company, New York, USA, pp. 814.
278. Skelkvale, R. and T. Uemura. 1977. Experimental diarrhea in human volunteers following oral administration of Clostridium perfringens enterotoxin. J. Appl. Bacteriol. 43: 281-286.
279. Skerman, V.B.D., V. McGowan and P.H.A. Sneath. 1980. Approved lists of bacterial names. Int. J. Syst. Bacteriol. 80: 225-420.
280. Smith, J.L. 1998. Foodborne illness in the elderly. J. Food Protect. 61: 1229-1239. 281. Smith, J.P., C. Toupin, B. Gagnon, R. Voyer, P.P. Fiset and V. Simpson. 1990. A
Hazard Analysis Critical Control Point approach (HACCP) to ensure the microbiological safety of sous vide processed meat/pasta product. Food Microbiol. 7: 177-198.
282. Smith, L. 1972. Factors involved in the isolation of Clostridium perfringens. J. Milk Food Technol. 35: 71-76.
283. Snyder, O.P., Jr. 1999. The basics of cooling food. Available at: http://www.hi-tm.com/Documents/Basic-cool.html. Accessed 14-01-2003.
284. Sofos, J.N. and F.F. Busta. 1980. Alternatives to the use of nitrite as an antibotulinal agent. Food Technol. 34: 244-251.
285. Solberg, M. and B. Elkind. 1970. Effect of processing and storage conditions on the microflora of Clostridium perfringens inoculated frankfurters. J. Food Sci. 35: 126-129.
286. Sparks, S.G., R.J. Carman, M.R. Sarker and B.A. McClane. 2001. Genotyping of enterotoxigenic Clostridium perfringens fecal isolates associated with antibiotic-

References
114
associated diarrhea and food poisoning in North America. J. Clin. Microbiol. 39: 883-888.
287. Steele, F.M. and K.H. Wright. 2001. Cooling rate effect on outgrowth of Clostridium perfringens in cooked, ready-to-eat turkey breast roasts. Poul. Sci. 80: 813-816.
288. Strong, D.H., E.F. Foster and C.L. Duncan. 1970. Influence of water activity on the growth of Clostridium perfringens. Appl. Microbiol. 19: 980-987.
289. Strong, D.H. and N.M. Ripp. 1967. Effect of cookery and holding on hams and turkey rolls contaminated with Clostridium perfringens. Appl. Microbiol. 15: 1172-1177.
290. Summer, S.S. and J.A. Albrecht. 1994. Clostridium perfringens. Available at: http://www.ianr.unl.edu/pubs/foods/nf167.htm. Accessed 17-03-2003.
291. Sutton, R.G.A., M. Kendall and B.C. Hobbs. 1972. The effect of two methods of cooking and cooling on Clostridium welchii and other bacteria in meat. J. Hyg. (Cambridge). 70: 415-424.
292. Tabatabai, L.B. and H.W. Walker. 1974. Inhibition of Clostridium perfringens by Streptococcus faecalis in a medium containing curing salts. J. Milk Food Technol. 37: 387-391.
293. Taniguti, T. 1968. Sporulation media for Clostridium perfringens (I) Influence of media composition on sporulation of Clostridium perfringens. J. Food Hyg. Soc. Jap. 9: 214-218.
294. Taniguti, T. 1968. Sporulation media for Clostridium perfringens (II) A method with a new medium (AGA medium) for sporulation of Clostridium perfringens and some properties of formed spores. J. Food Hyg. Soc. Jap. 9: 219-223.
295. Taormina, P.J., G.W. Bartholomew and W.J. Dorsa. 2003. Incidence of Clostridium perfringens in commercially produced cured raw meat product mixtures and behavior in cooked products during chilling and refrigerated storage. J. Food Protect. 66: 72-81.
296. Thompson, L. 1939. Medium of Wilson and Blair for determination of Clostridium welchii. Am. J. Clin. Path. 3: 173.
297. Ting, M.N. and D.Y.C. Fung. 1972. Chemically defined medium for growth and sporulation of Clostridium perfringens. Appl. Microbiol. 24: 755-759.
298. Todd, E.C.D. 1989. Preliminary estimates of costs of foodborne disease in the United States. J. Food Protect. 52: 595-601.
299. Todd, E.C.D. 1992. Foodborne disease in Canada - a 10-year summary from 1975 to 1984. J. Food Protect. 55: 123-132.
300. Toit, D., du,. 2002. Gas gangrene. Available at: http://xtramsn.co.nz/health/0,,8065-1669854,00.html. Accessed 13-03-2003.
301. Tórtora, J.C.O. 1984. Alternative medium for Clostridium perfringens sporulation. Appl. Environ. Microbiol. 47: 1172-1174.
302. Traci, P.A. and C.L. Duncan. 1974. Cold shock lethality and injury in Clostridium perfringens. Appl. Microbiol. 28: 815-821.
303. Trakulchang, S.P. and A.A. Kraft. 1977. Survival of Clostridium perfringens in refrigerated and frozen meat and poultry items. J. Food Sci. 42: 518-521.
304. Tromoliers, F. 1996. Toxi-infections alimentaires en France métropolitaine. La Rev. Praticien. 46: 158-165.

References
115
305. Tseng, W.J. and R.G. Labbe. 2000. Characteristics of a sporulation stimulating factor from Clostridium perfringens type A. Lett. Appl. Microbiol. 30: 254-257.
306. Tuomi, S., M.E. Matthews and E.H. Marth. 1974. Behavior of Clostridium perfringens in precooked chilled ground beef gravy during cooling, holding and reheating. J. Milk Food Technol. 37: 494-498.
307. US Department of Agriculture. 1999. Performance standards for the production of certain meat and poultry products. 9 CFR 301, 317, 318, 320, 381. Federal Register. 64: 732-749.
308. US Public Health Service. 2001. Food Code. Pub. No. PB97-133656. Available at: http://www.cfsan.fda.gov/~dms/fc01-3.html#3-5. Accessed 06-03-2003.
309. Ushijima, T. 1986. Glycocholic and taurocholic acids as potent sporulation stimulating agents for Clostridium perfringens. Med. and Biol. 113: 193-195.
310. Ushijima, T., A. Sugitani and Y. Ozaki. 1987. A pair of semisolid media facilitate detection of spore and enterotoxin of Clostridium perfringens. J. Microbiol. Methods. 6: 145-152.
311. Van Damme-Jongsten, M., K. Wernars and S. Notermans. 1989. Cloning and sequencing of the Clostridium perfringens enterotoxin gene. Antonie Leeuwenhoek J. Microbiol. 56: 181-190.
312. Van Garde, S.J. and M.J. Woodburn. 1987. Food discard practices of householders. J. Am. Diet. Assoc. 84: 322-329.
313. Varnam, A.H. and M.G. Evans. 1991. Clostridium perfringens, p. 312-326. In Foodborne pathogens; an illustrated text. Wolfe Publishing Ltd., London.
314. Veillon, A. and A. Zuber. 1898. Recherches sur quelques microbes strictement anaérobies et leur role en pathologie. Arch. Med. Exp. Anat. Path. 10: 517-545.
315. Veld, P.H., in't, A.H. Havelaar and N.G.W.M. van Strijp-Lockefeer. 1999. The certification of a reference material for the evaluation of methods for the enumeration of Bacillus cereus. J. Appl. Microbiol. 86: 226-274.
316. Vigorita, M.G., G. Donato Alessi, T. Previtera, G. Gabbrielli, G. Bisignano, A. Arena, R.A. Merendino and L. Bonina. 1992. Fluoro containing D-cycloserines. Synthesis and in vitro evaluation of antimicrobial and antiviral activities. Farmaco. 47: 907-18.
317. Warth, A.D. 1978. Relationship between the heat resistance of spores and the optimum and maximum growth temperatures of Bacillus species. J. Bacteriol. 134: 699-705.
318. Weenk, G.H., E. Fitzmaurice and D.A.A. Mossel. 1991. Selective enumeration of spores of Clostridium species in dried foods. J. Appl. Bacteriol. 70: 135-143.
319. Weiss, K.F. and D.H. Strong. 1967. Some properties of heat-resistant and heat-sensitive strains of Clostridium perfringens. J. Bacteriol. 93: 21-26.
320. Welch, W.H. and G.H.F. Nuttall. 1892. A gas producing bacillus (Bacillus aerogenes capsulatus, nov. spec.) capable of rapid development in the blood vessels after death. Bull. Johns Hopk. Hosp. 3: 81-91.
321. Wemekamp-Kamphuis, H.H., A.K. Karatzas, J.A. Wouters and T. Abee. 2002. Enhanced levels of cold shock proteins in Listeria monocytogenes LO28 upon exposure to low temperature and high hydrostatic pressure. Appl. Environ. Microbiol. 68: 456-463.
References
116
322. Werkgroep chemische kwaliteitsborging, K.v.w. 1984. Wat is een afwijking?. A.E.I. Jong, de. Den Bosch, The Netherlands.
323. Wijtzes, T., F.M. Rombouts, M.L.T. Kant-Muermans, K.v.t. Riet and M.H. Zwietering. 2001. Development and validation of a combined temperature, water activity, pH model for bacterial growth rate of Lactobacillus curvatus. Int. J. Food Microbiol. 63: 57-64.
324. Wildemeersch, D. 1997. Kippenpastei: "Koninginnenhapje" of soms ook "La belle dame sans merci"? Epidemiologisch Bulletin. 20: Available at http://www.wvc.vlaanderen.be/epibul/20/hasselt1.htm. Accessed 25-03-2003
325. Willis, A.T. and G. Hobbs. 1958. A medium for the identification of clostridia producing opalescence in egg yolk emulsions. J. Pathol. Bacteriol. 75: 299-305.
326. Wnek, A.P. and B.A. McClane. 1983. Identification of a 50,000 Mr protein from rabbit brush border membranes that binds Clostridium perfringens enterotoxin. Biochem. Biophys. Res. Commun. 112: 1099-1105.
327. Wnek, A.P. and B.A. McClane. 1989. Preliminary evidence that Clostridium perfringens type A enterotoxin is present in a 160,000-Mr complex in mammalian membranes. Infect. Dis. 57: 574-581.
328. Wong, D.M., K.E. Young Perkins and R.L. Merson. 1988. Factors influencing Clostridium botulinum spore germination, outgrowth, and toxin formation in acidified media. Appl. Environ. Microbiol. 54: 1446-1450.
329. Woodburn, M. and C.H. Kim. 1966. Survival of Clostridium perfringens during baking and holding of turkey stuffing. Appl. Microbiol. 14: 914-920.
330. Wrigley, D.M., H.D.S.H. Hanwella and B.L. Thon. 1995. Acid exposure enhances sporulation of certain strains of Clostridium perfringens. Anaerobe. 1: 263-267.
Summary
117
SUMMARY
Clostridium perfringens is one of the five major pathogens causing food borne illness in the western world expressed in cases caused per year, but this pathogen causes other diseases as well. The species C. perfringens is divided in subtypes A-E, according to the produced toxins. These toxins cause gas gangrene in humans and enterotoxemia and dysenteria in animals. C. perfringens causes two types of food poisoning: type A, the common type, and type C, which is rare. Type A food poisoning is caused by the enterotoxin produced by type A strains. About 6% of type A strains contain the gene encoding for the enterotoxin. The enterotoxin is released during sporulation of cells. To cause food poisoning, cells of C. perfringens have to pass the stomach. Only ingestion of high cell numbers will allow some cells to survive stomach passage. Upon entering the small intestines, these cells sporulate while releasing the enterotoxin. The symptoms of C. perfringens food poisoning are rather mild: abdominal pain, nausea, and diarrhea that last for 1-2 days. These mild symptoms are the reason that the number of C. perfringens food poisoning outbreaks is underestimated and that research on this pathogen is limited compared to other food born pathogens.
For research purposes, spores are used as an easy and standardized inoculum. The sporulation capacity of C. perfringens strains in vitro is heterogeneous and medium dependent. Since spores of this pathogen are often produced in Duncan and Strong (DS) medium, strains that sporulate abundantly in this medium are used mainly in research. This selection of strains is not necessarily the most dangerous selection in vivo. Therefore, a method was developed that supported sporulation of a variety of strains (Chapter 2). Different inoculation levels were tested and the effects of sporulation-promoting substances and acid shock were evaluated. Furthermore, DS medium was compared with other sporulation media. Highest spore numbers in DS were obtained with a 10% 24-h Fluid Thioglycollate broth inoculum (5.0×10⁵ spores/ml). Addition of theophylline and replacement of starch by raffinose increased spore yields for some strains, but most strains were not affected (average cell increase of 0.2 and 0.3 log N/ml, respectively). Sporulation of one strain was enhanced by the addition of bile, but other strains were strongly inhibited (average decrease in cell numbers of 2.5 log N/ml). Sporulation was not influenced by addition of agar. Neither short-time acid exposure nor addition of culture supernatant fluids of well sporulating strains resulted in higher spore numbers in DS medium. None of the tested methods enhanced sporulation in general, only strain dependent effects were obtained. Highest average spore yields were obtained in Peptone-Bile-Theophylline medium with or without starch (PBT or PBTS; 1.0×10⁵ spores/ml), but some strains failed to sporulate in PBTS. In conclusion, adding theophylline in DS medium may optimize sporulation of C. perfringens, but PBT(S) medium is most suitable.
A dozen agar media for enumerating C. perfringens from foods have been described in literature. Some media are known to underestimate the number of cells

Summary
118
present in food, while others are designed to recover heat treated spores, thus overestimating cell numbers compared to “standard” media. These standard media differ among countries, therefore the quantitative recovery of C. perfringens on six media [Iron-Sulphite agar (IS), Tryptose-Sulphite-Cycloserine agar (TSC), Shahidi-Ferguson-Perfringens agar (SFP), Sulphite-Cycloserine-Azide (SCA), Differential-Clostridial-Agar (DCA), and Oleandomycine-Polymyxine-Sulfadiazine-Perfringens agar (OPSP)] was tested in a pre-study (Chapter 3). Four of these media (IS, TSC, SCA, and DCA) were selected for an international collaborative trial. Recovery of 15 pure strains was examined in the pre-study from which one strain was selected for testing foodstuffs in the collaborative trial. Results from the pre-study revealed statistically significant differences between the media, but recoveries on all media were within microbiological limits (± 30%) of IS, which was set as a reference medium. Recoveries on the media tested in the collaborative trial were statistically different as well, but these differences were of no microbiological-analytical relevance. Food matrices did not affect recovery of C. perfringens in general. It was concluded that TSC was the most favorable medium for enumeration of C. perfringens from foods, since IS medium is non-selective and DCA and particularly SCA are labor-intensive to prepare. Moreover, DCA frequently failed to produce black colonies: grey colonies were quite common.
C. perfringens food poisoning outbreaks are mainly associated with large scale cooking procedures. Heating and cooling of large food quantities is difficult and adequately cooling of foods is essential to prevent growth of this pathogen, due to the short generation times of C. perfringens. Therefore, the effect of different cooling procedures on growth of C. perfringens was studied (Chapter 4). Since data from the Dutch Inspectorate for Health Protection and Veterinary Public Health showed that pea soup contained high cell numbers of this microorganism relatively frequently, the experiments were conducted with this typical Dutch soup. Tubes of pre-heated pea soup (50°C) were inoculated with cocktails of cells or with heat-activated spores of this pathogen. The tubes were linearly cooled to 15°C in time spans of 3, 5, 7.5, and 10 h and were subsequently stored in a refrigerator at 3°C or 7°C for up to 84 h. Cell numbers increased by 1 log cycle during the 3-h cooling period and reached their maximum after 10 h of cooling. Subsequent refrigeration hardly reduced cell numbers. Cooling 3.75 l of pea soup in an open pan showed that this amount of pea soup cooled down from 50→15°C in 5 h, which will allow more than a 10-fold increase in cell numbers. These findings emphasize the need of good hygienic practices and quick cooling of heated foods after preparation.
Foods that are cooled down for storage are subsequently held at low temperatures. The theoretical growth limit of C. perfringens is 10.1°C. Therefore, the effect of temperature on the behavior of spores and vegetative cells of this pathogen was studied, as well as the possibility of this microorganism to adapt to low temperatures and the effect of this adaptation on growth characteristics (Chapter 5). The experiments were conducted in Fluid Thioglycollate broth (FTG) and in Dutch pea soup at temperatures from 3°C to 42°C. To study the effect of adaptation, cells were

Summary
119
either inoculated from a 37°C pre-culture or from a temperature-adapted pre-culture. Membrane fatty acid patterns were determined from cells grown at all temperatures to examine the effect of temperature on membrane composition. Spores were inoculated either with or without heat treatment. Cell adaptation neither influenced lag phase nor growth rates. Growth in pea soup, however, was slower and lag phases were more extended compared to FTG. No growth was observed at temperatures ≤10°C and death rates in pea soup were higher compared to those in FTG at these low temperatures. Cells preserved the membrane fluidity by reducing the arachidic acid content and increasing the lauric acid content in their membranes when the temperature decreased. This resulted in a net reduction in membrane fatty acids chain length. Microscopic analysis of cells grown at 15°C revealed a morphological change: cells were elongated compared to those grown at 37°C. These data demonstrate the ability of C. perfringens to adapt to lower temperatures. However, this adaptation did not influence growth characteristics compared to non-adapted cells. C. perfringens spores germinated at all temperatures between 3°C and 42°C with and without heat-activation. Combining this fact with the extended survival at low temperatures emphasizes the need for adequate heating of refrigerated foods before consumption to eliminate health risks due to C. perfringens.
To reduce the risk of C. perfringens food poisoning, adequate cooling of foods is a requirement. Therefore, a model was developed to predict the effect of different cooling procedures on growth of this pathogen during cooling of pea soup (Chapter 6). Firstly, a growth rate model based on interpretable parameters was used to predict growth during linear cooling of pea soup. Secondly, a model for cooling pea soup was constructed by fitting on experimental data published earlier. This cooling model was used to estimate the effect of various cooling environments on cooling times, taking into account the effect of stirring and product volume. The two models were combined to predict growth of C. perfringens during various cooling scenarios. The combined model indicated that cooling requirements stated by Dutch law (cooling from 60°C to 7°C within 5 h) were met by stirring every 60 min for a volume of 3.75 l (R=0.1225 m) of pea soup in a 3°C air-vented cabinet. Decreasing the heat transfer resistance of the surroundings allowed for no stirring at all. Cooling in water was, therefore, effective in reducing the average cooling time, but extra precautions need to be taken as well to meet cooling requirements for larger volumes. Reducing the volume to 780 ml sufficiently shortened cooling times in our air-vented cabinet (3°C) without the need to stir. Cooling requirements stated by Dutch law (60°C to 7°C within 5) correlated well with growth limitations set by USA law for cooling food. Validation of the combined model showed that cell increase of C. perfringens during cooling of pea soup in various cooling environments was accurately predicted. It was concluded that the combined model can be a useful tool for designing Good Manufacturing Practises (GMP) procedures.

120

Samenvatting
121
SAMENVATTING Clostridium perfringens is een van de vijf voornaamste veroorzakers van voedsel gerelateerde uitbraken van gastro-enteritis in de westerse wereld (uitgedrukt in aantal gevallen per jaar), maar veroorzaakt tevens andere ziekten. De soort C. perfringens is onderverdeeld in subtypes A-E aan de hand van de toxines die worden geproduceerd. Deze toxines veroorzaken gas-gangreen bij mensen en enterotoxaemia en dysenterie bij dieren. C. perfringens veroorzaakt twee typen voedselvergiftiging: type A, het meest voorkomende type, en type C, een zeldzame ziekte. Voedselvergiftiging type A wordt veroorzaakt door het enterotoxine dat wordt geproduceerd door type A stammen. Ongeveer 6% van de type A stammen bezit het gen dat codeert voor het enterotoxine-gen. Het enterotoxine komt vrij tijdens sporulatie van vegetatieve cellen. Om een voedselvergiftiging te veroorzaken is het noodzakelijk dat vegetatieve cellen van C. perfringens de maag passeren. Alleen wanneer een grote hoeveelheid cellen wordt geconsumeerd, zal een deel in staat zijn de maagbarrière te overleven. Deze cellen zullen bij het bereiken van de dunne darm sporuleren, waardoor het enterotoxine vrij komt. C. perfringens voedselvergiftiging heeft milde symptomen, zoals buikpijn, misselijkheid en diarree die 1 à 2 dagen aanhouden. De mildheid van de symptomen is de oorzaak van de onderschatting van het aantal uitbraken van C. perfringens-voedselvergiftiging, waardoor onderzoek naar deze pathogeen beperkt is in vergelijking met andere pathogenen.
Voor onderzoek naar C. perfringens worden vaak sporen gebruikt als eenvoudig en gestandaardiseerd inoculum. Het vermogen van C. perfringens om in vitro te sporuleren is stam- en medium-afhankelijk. Aangezien sporen van C. perfringens vaak worden geproduceerd in het medium van Duncan en Strong (DS) worden in het onderzoek hoofdzakelijk stammen gebruikt die in dit medium rijkelijk sporuleren. Deze stammen, die in vitro goed sporuleren, zijn niet noodzakelijkerwijs de meest gevaarlijke stammen in vivo. Om deze ongewilde selectie te ondervangen werd een methode ontwikkeld die voor sporulatie van een variëteit aan stammen zorgt (Hoofdstuk 2). Verschillende inoculatie niveaus werden vergeleken en het effect van sporulatie-stimulerende stoffen en een zuurschok werden geëvalueerd. DS medium werd eveneens vergeleken met andere sporulatiemedia. In DS medium werd het hoogste aantal sporen (5.0×10⁵/ml) bereikt door aan te enten met een 24 uur oude FTG (vloeibare thioglycolaat bouillon) culture in de verhouding 1:9. De sporenopbrengst van sommige stammen werd verhoogd door toevoeging van theophylline en vervanging van zetmeel door raffinose, maar op de meeste stammen had dit geen effect (gemiddelde toename van respectievelijk 0.2 en 0.3 log N/ml). Bij een van de stammen verhoogde toevoeging van gal de sporenopbrengst, maar op de andere stammen had deze toevoeging een sterk reducerend effect (gemiddelde afname van 2.5 log N/ml). Toevoeging van agar aan DS medium beïnvloedde de sporenopbrengst niet. Het blootstellen aan een zuurschok en het toevoegen van cultuur-supernatant van sporulerende stammen hadden eveneens geen effect op de hoeveelheid sporen die in DS medium werd gevormd. Geen van de gebruikte

Samenvatting
122
methoden resulteerde in hogere sporenopbrengsten van C. perfringens in het algemeen, er werden alleen stam-afhankelijke effecten waargenomen. De hoogste gemiddelde sporenopbrengst werd waargenomen in Peptone-Bile-Theophylline medium met of zonder zetmeel [PBT of PBTS; pepton-gal-theophylline(-zetmeel); 1.0×10⁵/ml], maar niet alle stammen sporuleerden in PBTS medium. Geconcluderend kan worden dat de sporenopbrengsten van C. perfringens in DS medium kan worden verhoogd door toevoeging van theophylline, maar dat PBT(S) medium breder toepasbaar is.
In de literatuur zijn verschillende agarmedia beschreven voor het aantonen van C. perfringens in levensmiddelen. Sommige media onderschatten het aantal C. perfringens cellen in levensmiddelen, terwijl andere media ook hitte-beschadigde cellen isoleren, waardoor het aantal cellen wordt overschat in vergelijking met “standaard” media. Deze “standaard” media verschillen van land tot land, daarom werd in een voorstudie kwantitatief gekeken naar de celopbrengst van deze media [IJzer-Sulfiet agar (IS), Tryptose-Sulfiet-Cycloserine agar (TSC), Shahidi-Ferguson-Perfringens agar (SFP), Sulfiet-Cycloserine-Azide agar (SCA), Differential-Clostridial-Agar (DCA; Differentiële-Clostridium-Agar) en Oleandomycine-Polymyxine-Sulphadiazine-Perfringens agar (OPSP); Hoofdstuk 3]. Vier van deze media (IS, TSC, SCA en DCA) werden geselecteerd voor een internationaal ringonderzoek. In de voorstudie werd de celopbrengst van 15 stammen bestudeerd. Eén van deze stammen werd gebruikt in het ringonderzoek om het effect van levensmiddelen op de celopbrengst van de media te onderzoeken. In de voorstudie werden significante verschillen aangetoond tussen de media, maar de verschillen bleven binnen de microbiële gestelde grenzen (± 30%) ten opzichte van IS medium, het referentiemedium. In het ringonderzoek werd eveneens significant verschil aangetoond tussen de geteste media, maar ook deze verschillen waren microbiologisch gezien niet van belang. Levensmiddelen hadden in het algemeen geen invloed op de celopbrengst van C. perfringens. Voor het aantonen van C. perfringens in levensmiddelen ging de voorkeur uit naar TSC medium, omdat IS medium niet-selectief is voor C. perfringens en DCA en SCA arbeidsintensief zijn in gebruik. Tevens kleurden de kolonies op DCA niet altijd zwart: grijze kolonies kwamen vaak voor.
Voedselvergiftigingsuitbraken van C. perfringens worden vooral geassocieerd met grootschalige productie van levensmiddelen, doordat opwarmen en afkoelen van grote hoeveelheden levensmiddelen moeilijk is. Het is noodzakelijk om levensmiddelen adequaat af te koelen om groei van C. perfringens te voorkomen, omdat dit micro-organisme zeer snel kan groeien. Daarom werd het effect van verschillende afkoelprocedures op de groei van C. perfringens bestudeerd (Hoofdstuk 4). Gegevens van de Keuringsdienst van Waren toonden aan dat hoge celaantallen van C. perfringens relatief vaak voorkwamen in erwtensoep, daarom werden de experimenten in deze soep uitgevoerd. Voorverwarmde buizen met erwtensoep (50°C) werden aangeënt met een mix van cellen of een mix van hitte-geactiveerde sporen van deze pathogeen. De buizen werden lineair afgekoeld naar
Samenvatting
123
15°C in een tijdsbestek van 3, 5, 7½ en 10 uur en werden vervolgens bewaard in een koelkast van 3°C of van 7°C voor 84 uur. De hoeveelheid cellen nam toe met 1 log cyclus tijdens het afkoelen in 3 uur en de hoeveelheid cellen was maximaal na een tien uur durend koelproces. De hoeveelheid cellen nam tijdens de gekoelde opslag nauwelijks af. Het afkoelen van 3¾ liter erwtensoep in een open pan toonde aan dat deze hoeveelheid soep afkoelt van 50→15°C in 5 uur, wat dus minstens zal resulteren in een vertienvoudiging van het aantal cellen. Deze constateringen maken duidelijk dat goede hygiëne en snelle afkoeling van levensmiddelen na bereiding essentieel is.
Afgekoeld voedsel dat moet worden bewaard, wordt opgeslagen bij lage temperaturen. De theoretische laagste temperatuur waarbij C. perfringens kan groeien is 10,1°C. Het effect van temperatuur op het gedrag van cellen en van sporen werd daarom bestudeerd, evenals de mogelijkheid van dit micro-organisme tot aanpassing aan lage temperaturen en het effect van deze aanpassingen op groei-eigenschappen (Hoofdstuk 5). De experimenten werden uitgevoerd in FTG bouillon en in erwtensoep bij temperaturen variërend tussen 3-42°C. Om het effect van aanpassing aan lagere temperaturen te bestuderen werden de experimenten uitgevoerd met cellen die óf bij 37°C werden opgekweekt óf bij een lagere temperatuur. Om het effect van temperatuur op de membraansamenstelling te bepalen werd van cellen die werden opgekweekt bij verschillende temperaturen de vetzuursamenstelling van de celmembranen bepaald. Sporen werden aan de media toegevoegd met en zonder hitte-activatie. Temperatuuradaptatie van de cellen had geen invloed op de lag-fase en op de groeisnelheid, maar de groeisnelheid in erwtensoep was lager dan in FTG en de lag-fases waren langer. Bij temperaturen onder de 10°C werd geen groei waargenomen; de afname van cellen was groter in erwtensoep dan in FTG bij deze temperaturen. De cellen handhaafden de vloeibaarheid van het membraan door de hoeveelheid arachidezuur (C20:0) te verlagen en die van laurierzuur (C12:0) te verhogen. Dit resulteerde in een netto daling van de vetzuurlengte. Microscopische analyse van de cellen die bij 15°C werden gekweekt lieten een morfologische verandering zien: de cellen waren langer in vergelijking met cellen die bij 37°C werden gekweekt. Deze gegevens toonden aan dat C. perfringens zich aan lagere temperaturen aanpast en dat deze aanpassing geen effect had op de groei-eigenschappen in vergelijking met onaangepaste cellen. Sporen van C. perfringens ontkiemden met en zonder hitte-activatie bij alle geteste temperaturen tussen 3°C en 42°C. Deze eigenschap gecombineerd met de lange overleving bij lage temperaturen benadrukt het belang van opwarmen van gekoelde levensmiddelen vóór consumptie om gezondheidsrisico’s door C. perfringens besmetting te voorkomen.
Om het gevaar van C. perfringens voedselvergiftiging te verlagen is het adequaat afkoelen van levensmiddelen een vereiste. Daarom werd een model ontwikkeld dat het effect van verschillende afkoelprocedures op de groei van deze pathogeen tijdens het afkoelen van erwtensoep kan voorspellen (Hoofdstuk 6). Als eerste werd groei van C. perfringens tijdens lineair afkoelen van erwtensoep voorspeld met een

Samenvatting
124
groeimodel dat alleen gebruik maakte van interpreteerbare parameters. Vervolgens werd een model ontwikkeld voor het afkoelen van erwtensoep aan de hand van eerder gepubliceerde data. Dit afkoelmodel werd gebruikt om het effect van verschillende koelprocedures op de afkoeltijd te voorspellen. Tevens werd het effect van roeren en product-volume op de afkoeltijd bestudeerd. Tenslotte werden de twee modellen gecombineerd, zodat de groei van C. perfringens tijdens verschillende afkoelprocedures kon worden voorspeld. Volgens het gecombineerde model voldoet men aan de Nederlandse Hygiëne Code (afkoelen van 60°C naar 7°C in 5 uur) wanneer een pan soep (diameter 24 cm) gevuld met 3¾ l erwtensoep, geplaatst in een geventileerde koelcel (3°C), elke 60 min wordt geroerd. Roeren werd overbodig wanneer de warmteoverdrachtscoëfficiënt van de omgeving werd verhoogd. Afkoelen in water bleek dan ook effectief in het verkorten van de afkoeltijd, maar voor grote volumes (25½ l) zijn extra maatregelen essentieel om binnen de gestelde norm te blijven. Reductie van het volume tot 780 ml bleek voldoende om aan de afkoelnorm te voldoen zonder dat roeren noodzakelijk was (bij opslag in een geventileerde koelcel van 3°C). De afkoelnorm van de Nederlandse Hygiëne Code kwam overeen met de gestelde norm voor groei van C. perfringens tijdens afkoelen van levensmiddelen in de Verenigde Staten. Validatie van het gecombineerde model toonde aan dat dit model de groei van C. perfringens tijdens verschillende afkoelprocedures kon voorspellen. Het model kan daarom nuttig zijn bij het opstellen van Good Manufacturing Practices (GMP).

Nawoord
125
NAWOORD
Het begon allemaal op een vroege vrijdagochtend in december 1998. Mijn huisgenoot belde me om 10:00 uur wakker met de mededeling dat prof. Rombouts zojuist had gebeld. Maar goed dat ik niet slaapdronken aan de telefoon was gekomen. Na het ontbijt de moed gevat om terug te bellen. Prof. Rombouts had opgevangen dat ik interesse had in een promotieonderzoek. Niet dat hij wat concreets op de plank had liggen, maar een oriënterend gesprek kon toch geen kwaad. Om een lang verhaal kort te maken, op de linkerhoek van prof. Rombouts’ bureau lag dus wel degelijk mijn AIO-projectvoorstel. Zo fietste ik maandag 1 februari, de dag na mijn 25e verjaardag, met twee appeltaarten weer “De Berg” op.
Dat was dus 4 jaar en bijna 9 maanden geleden. Er volgden nog vele appeltaarten en andere oven-creaties en prof. Rombouts werd gewoon Frans, wat wel wennen was in het begin. Maar na alle spontane uitlatingen mijnerzijds was het afstandelijke “professor” niet echt meer op z’n plaats. Frans, ik wil je bij dezen bedanken dat je mij ooit uit mijn bed hebt gebeld, maar natuurlijk vooral voor de tijd die je in mij en mijn proefschrift hebt gestoken op de meest onmogelijke momenten.
Een promotor kan niet zonder zijn co-promotor, mijn dagelijkse begeleider: Rijkelt Beumer. Het eerste jaar op Lab 429 wilde niet echt vlotten: Clostridium perfringens was toch net iets minder aerotolerant dan het milieu in de oude “anaerobe” jars. Deze lag-fase in mijn onderzoek werd beëindigd met de aanschaf van de Anoxomat. Op deze dikke vier jaar terugkijkend, sluit ik mij aan bij een stelling die ik ooit in het Wub heb gelezen: “De frequentie van gesprekken met je begeleider is omgekeerd evenredig met de voortgang van je onderzoek”. Het uitblijven van bruikbare resultaten in het begin van het onderzoek moet hebben bijgedragen aan een aantal grijze haren op jouw hoofd. Maar uiteindelijk zag ik het licht, waardoor de frequentie van de maandagochtendsessies sterk werd gereduceerd. Toch bleef je deur altijd open, zelfs op de Boeslaan. Rijkelt, ik heb de afgelopen jaren heel veel aan je bijna onuitputtelijke kennis op microbiologisch gebied gehad. Je enthousiasme en nieuwsgierigheid voor dit vakgebied hebben er zeker toe bijgedragen dat ik mijn onderzoek met veel plezier heb afgerond op de 4e verdieping van het Biotechnion. Bedankt voor alles.
Naast een promotor en co-promotor werd ik ook bijgestaan door een commissie van wijzen: Adrie, Jaap, Matthé, Wilma, Paul B. en Paul V. ook jullie wil ik bedanken voor alle raad betreffende mijn onderzoek. Wilma wil ik in het bijzonder bedanken voor de correcties van de teksten. Het compliment heb je al indirect gekregen van prof. Michael Peck…….
Mijn promotieonderzoek werd gedeeltelijk uitgevoerd bij de Keuringsdienst van Waren in Den Bosch. Een jaar lang reed ik elke maandag richting het zuiden, waar ik me altijd welkom voelde. Paul V. en Herman, bedankt voor jullie inzet bij onder andere het surveillance project naar het voorkomen van C. perfringens in erwtensoep, het had er zonder jullie heel anders uitgezien. Rob en Ben, bedankt voor

Nawoord
126
het uitdraaien van gegevens uit het datasysteem. Michael wil ik bedanken voor het dagje achter de schermen van een keurmeester.
Dan weer terug naar Wageningen, te beginnen bij Lab 429. Aan al mijn labgenoten: Excuses voor de “kenmerkende aroma’s”. Het lab werd door vele studenten bezocht, onder ander door Wim, Liesbeth, Gijs en Freek: bedankt voor jullie bijdrage aan mijn onderzoek. En dan natuurlijk nog mijn mede AIO-labgenote, Harsi. Je grote ijver was een stimulans om zelf ook hard door te werken. Iedereen bedankt voor de gezelligheid op Lab 429. Ook de nieuwe bewoner van K430, prof. Marcel Z., wil ik bedanken voor zijn enthousiasme en geduld om mijn proefschrift aan te vullen met een proceskundige draai. Rest mij nog Boudewijn, bedankt voor alle hulp bij invoegen van foto’s en grafieken in dit proefschrift. In samenwerking met Anne werd de voorkant echt geslaagd.
En de rest van mijn collega’s en oud-collega’s, ik heb me echt goed vermaakt tijdens de koffie- en theepauzes of gewoon op de gang. Met als een van de hoogtepunten de skivakantie in Frankrijk. Maar het was niet alleen op de 4e gezellig, de 5e was bijna net zo leuk. Mirjam, je vroeg me ooit voor de organisatie van de AIO-reis en sindsdien werden mijn bezoekjes aan de “chemietjes” steeds frequenter. Je stond altijd voor me klaar, luisterde gewillig naar mijn spraakwaterval, gaf goede adviezen en monterde me op als het even tegenzat. Jij en Christiaan, en de kleine Maud, zorgden voor de nodige afleiding en een goed klankbord. Inderdaad, dit jaar mijn feestje.
Als een-na-laatste wil ik mijn ouders en vrienden bedanken voor de steun en gezelligheid die ze me de afgelopen jaren hebben gegeven: wandelen langs de Linge, volleyballen in de Bongerd, fröbelen in Harderwijk, uitzweten in de sauna of gewoon op de bank zitten en bijtanken. Het was me allemaal een waar genoegen.
Tenslotte de aller leukste oud-labgenoot en het liefste chemietje, Gerd-Jan. Ik wil je bedanken voor al “jouw” goede ideeën wat betreft vakanties en andere vrijetijdsbestedingen en voor alles wat je hebt gedaan om mijn laatste zware loodjes te verlichten. Over drie jaar help ik je mee de jouwe te tillen…………

Curriculum vitae
127
CURRICULUM VITAE
Aarieke Eva Irene de Jong werd geboren op 31 januari 1974 te Voorburg. In 1992 behaalde zij haar VWO-gymnasium diploma aan de Christelijke Scholengemeenschap Het Loo te Voorburg. In datzelfde jaar begon zij aan de studie Levensmiddelentechnologie aan de Landbouwuniversiteit te Wageningen. Afstudeervakken werden afgelegd in de richtingen Levensmiddelenmicrobiologie en Industriële microbiologie. Haar stage liep ze bij University of Queensland, Gatton College, Food Safety group in Gatton, Australië. In November 1998 behaalde ze haar doctoraal diploma. In februari 1999 begon zij met een promotieonderzoek dat bij het Laboratorium voor Levensmiddelenmicrobiologie en de Keuringsdienst van Waren te Den Bosch werd uitgevoerd. De resultaten hiervan zijn beschreven in dit proefschrift.

Addendum
128
ADDENDUM
The research described in this thesis was performed at the Laboratory of Food Microbiology of Wageningen Universiteit, Department of Agrotechnology and Food Science, Wageningen Universiteit, The Netherlands and at the Dutch Inspectorate for Health Protection and Veterinary Public Health, Den Bosch, The Netherlands, who financially supported the project.
The research was part of the research programme of the Graduate School VLAG (Food Technology, Agrotechnology, Nutrition and Health Sciences).
Cover by Boudewijn van Veen and Anne de Bree: Micrograph of Clostridium perfringens cells.