stability and rheological behaviour of … · tree and citronella oil have been induced in...
TRANSCRIPT

STABILITY AND RHEOLOGICAL BEHAVIOUR OF
FUNCTIONAL ESSENTIAL OILS IN GLYCOLIPID
CREAM EMULSION
SAW MEI MEI
FACULTY OF SCIENCE
UNIVERSITY OF MALAYA
KUALA LUMPUR
2013

STABILITY AND RHEOLOGICAL BEHAVIOUR OF
FUNCTIONAL ESSENTIAL OILS IN GLYCOLIPID
CREAM EMULSION
SAW MEI MEI
DISSERTATION SUBMITTED IN FULFILLMENT OF
THE REQUIREMENTS FOR THE DEGREE OF
MASTER OF SCIENCE
DEPARTMENT OF CHEMISTRY
FACULTY OF SCIENCE
UNIVERSITY OF MALAYA
KUALA LUMPUR
2013


ii
ABSTRACT
Essential oils carries distinctively unique aroma from parts of a plant where they are
extracted. Essential oils have widely been known for its aromatherapy and therapeutic
effect on human. High concentration of essential oil comprises of thyme, lavender, tea
tree and citronella oil have been induced in emulsions system using olive oil as carrier
oil stabilized by glycolipid surfactants of sucrose stearate, surcrose palmitate and
sucrose myristate respectively. Co-surfactants, TritonTM
X-100 and TritonTM
X-45 was
utilised to create high interactions and compatibility associated with short chain
terpenes, terpenoids and phenolic compound presents in essential oils inverting
emulsion droplet forming o/w emulsion system. Essential oil emulsions were subjected
to a series of physical properties evaluation specifically accelerated ageing test
conducted at 45.0±0.1 °C, zeta potential, mean droplet size measurement and polarising
microscope observation. Rheological evaluations by mean of oscillatory and
viscometric studies were carried out at constant temperature of 30.0±0.1 °C over the
period of 30 days. Viscometric flow curve shows shear thinning behaviour for all
essential oil emulsions exhibiting reduction of yield stress directly proportionate with
reduction of lipid chain length. Mean droplet size and PDI govern the variation of
viscosity of thyme and lavender oil where large droplet forming uniform distribution
yield high viscosity emulsion possessing strong structural integrity with high critical
strains and G’ magnitude. Frequency dependent shear oscillation display dominancy of
G’ over G” throughout the measured frequency (ω) domain implicates emulsions
system exhibiting solid like behaviour. Thyme and lavender essential oil emulsions
possessing higher G’ and viscosity was concluded to be more stable than tea tree oil and
citronella emulsions. All the emulsion tested possessed a long shelf life sustaining high
emulsion fractions over 30 days of storage.

iii
ABSTRAK
Minyak pati mempunyai aroma unik yang tersendiri dimana pati tumbuhan diekstrak
daripada bahagian tumbuhan seperti pucuk, daun, dan pohon. Minyak pati digunakan
secara meluas untuk tujuan aromaterapi untuk memberi kesan terapeutik ke atas
pemakainya. Miyak jenis ‘thyme’, ‘lavender’, ‘tea tree’ dan ‘citronella’ telah digunakan
dalam kepekatan tinggi dalam pembentukan system emulsi yang distabilkan oleh miyak
zaitun dan surfaktan glycolipid seperti stearat sukrosa, palmitat sukrosa dan myristat
sukrosa. TritonTM
X-100 dan TritonTM
X-45 digunakan untuk meningkatkan interaksi
dan keserasian pembentukan dengan hidro-karbon rangkaian pendek dan sebatian
fenolik yang wujud dalam miyak pati untuk membentuk sistem emulsi o/w. Penilaian
kestabilan emulsi miyak pati telah dijalankan dengan mengunakan beberapa kaedah
ujian seperti pengukuran kadar penceraian emulsi pada suhu 45.0±0.1 °C, potensi zeta,
min saiz titisan yang terbentuk dan permerhatian fizikal emulsi melalui mikroskop
polaroid. Penilaian reologi berdasarkan pengajian osilatori dan ‘viscometric’ telah
dijalankan pada suhu malar 30.0±0.1 °C dalam tempoh 30 hari. Data ‘viscometric’
memaparkan pengurangan daya kelikatan emulsi dan tegasan ricih yang berkadar terus
dengan pengurangan kepanjangan rangkaian lipid. Taburan dan min saiz titisan emulsi
memainkan peranan penting dalam mengawal kelikatan emulsi, pembentukan saiz
titisan emulsi yang besar dan tersusun meningkatkan daya geseran diantara titisan
emulsi serta terbinanya struktur integriti yang kukuh dengan terikan kritikal yang tinggi
selaras dengan peningkatan magnitud tenaga G’ menjurus kepada peningkatan daya
kelikatan emulsi dan keseluruhannya menstabilkan emulsi. Pengajian osilatori frekuensi
memaparkan dominasi G’ kepada G” menunjukkan ciri-ciri pepejal sistem emulsi.
Kesimpulannya, emulsi ‘thyme’ dan ‘lavender’ yang memiliki tenaga G’ dan daya
kelikatan yang lebih tinggi adalah lebih stabil daripada emulsi ‘tea tree’ dan ‘citronella’.

iv
ACKNOWLEDGEMENTS
I would like to express my gratitude to Professor Dr. Misni Misran for giving me
a chance to carry out this project. I would like to state my appreciation for his guidance,
attention, support, encouragement and advises given throughout the period of the
project carried out. He was a respected and responsible supervisor which spends most of
his time for academic purposes, readily giving guidance, informative suggestion and
comment to students. His constructive encouragement and guidance given enable me to
overcome hardship encountered throughout the period of research. Besides stressing on
academic achievement, Prof. Dr. Misni Misran cultivates teamwork, trust and
responsibility between laboratory members, creating awareness of selflessness in project
participation encouraging active involvement of his students in laboratory projects.
I would also like to state my appreciation to Puan Radziah bt. Muhamad @
Mohd Annuar, Dr. Teo Yin Yin, Ms. Tan Hsiao Wei, Ms. Chia Si Wai, Mr. Vicit Rizal
Eh Suk, Mr. Woo Juin Onn and many others laboratory members and friends for their
sincere comments, suggestion, and advice. Special thanks to Mr. Poo Lup Soon for
providing basic technical support on information technology facilities. I would also like
to express my gratitude to my parents and my brother who always been on my side
supporting me and always be there to give encouragements for my success. I would like
to thanks my fellow friends who had willingly listens to my problem and the giving
useful suggestion in assisting me to complete this work. Last but not least, I take great
pleasure in extending my profound gratitude to University of Malaya, for kindly
providing financial assistance for this project under Postgraduate Research Fund
PS334/2009C.

v
TABLE OF CONTENTS
ABSTRACT ...................................................................................................................... ii
ABSTRAK ....................................................................................................................... iii
ACKNOWLEDGEMENTS ............................................................................................. iv
TABLE OF CONTENTS .................................................................................................. v
LIST OF FIGURES ......................................................................................................... ix
LIST OF TABLES ......................................................................................................... xvi
LIST OF SYMBOLS AND ABBREVIATIONS ......................................................... xvii
Symbols ..................................................................................................................... xvii
Abbreviations ............................................................................................................. xix
LITERATURE REVIEW............................................................................................... xxi
CHAPTER 1: INTRODUCTION ..................................................................................... 1
1.1 Essential Oil ............................................................................................................ 2
1.1.1 Thyme Oil ......................................................................................................... 4
1.1.2 Lavender Oil ..................................................................................................... 5
1.1.3 Tea Tree Oil ...................................................................................................... 7
1.1.4 Citronella Oil .................................................................................................... 8
1.1.5 Carrier Oil: Olive Oil ...................................................................................... 10

vi
1.2 Surfactant ............................................................................................................... 13
1.2.1 Glycolipid Surfactant ...................................................................................... 16
1.2.2 Co-Surfactant: TritonTM
X-100 and TritonTM
X-45 ........................................ 17
1.2.3 Co-Surfactant: Ceteareth-20 ........................................................................... 18
1.3 Emulsion ................................................................................................................ 19
1.3.1 Phase Inversion ............................................................................................... 22
1.4 Viscosity ................................................................................................................ 24
1.5 Zeta Potential ......................................................................................................... 25
1.6 Rheology ............................................................................................................... 28
1.7 Objective of Studies .............................................................................................. 32
CHAPTER 2: MATERIALS AND METHODS ............................................................ 33
2.1 Materials ................................................................................................................ 34
2.2 Experimental Technique and Preparation ............................................................. 34
2.2.1 Emulsion preparation ...................................................................................... 34
2.3 Instrumentation ...................................................................................................... 35
2.3.1 Viscometer ...................................................................................................... 35
2.3.2 GC-MS ............................................................................................................ 36
2.3.3 Polarizing Microscope .................................................................................... 36
2.3.4 Zetasizer .......................................................................................................... 37
2.3.5 Rheometer ....................................................................................................... 37

vii
CHAPTER 3: RESULTS AND DISCUSSIONS ............................................................ 39
3.1 Viscosities and Densities of Oil ............................................................................ 40
3.2 Essential Oil Emulsion System ............................................................................. 43
3.3 Dispersed Phase of Emulsion System ................................................................... 47
3.4 Stability Test .......................................................................................................... 50
3.4.1 Stability Test of Thyme Essential Oil Emulsion ............................................ 51
3.4.2 Stability Test of Lavender Essential Oil Emulsion ......................................... 54
3.4.3 Stability Test of Tea Tree Essential Oil Emulsion ......................................... 56
3.4.4 Stability Test of Citronella Essential Oil Emulsion ........................................ 59
3.5 Light Micrograph, Mean Droplet Size and Zeta Potential Analysis of Essential Oil
Emulsions .................................................................................................................... 62
3.5.1 Morphology, Particle Size and Zeta Potential Analysis of Thyme Essential
Oil Emulsion ............................................................................................................ 64
3.5.2 Morphology, Particle Size and Zeta Potential Analysis of Lavender Essential
Oil Emulsion ............................................................................................................ 67
3.5.3 Morphology, Particle Size and Zeta Potential Analysis of Tea Tree Essential
Oil Emulsion ............................................................................................................ 70
3.5.4 Morphology, Particle Size and Zeta Potential Analysis of Citronella Essential
Oil Emulsion ............................................................................................................ 73

viii
3.6 Rheology ............................................................................................................... 76
3.6.1 Rheological Analysis of Thyme Essential Oil Emulsions .............................. 76
3.6.2 Rheological Analysis of Lavender Essential Oil Emulsions .......................... 84
3.6.3 Rheological Analysis of Tea Tree Essential Oil Emulsions ........................... 90
3.6.4 Rheological Analysis of Citronella Essential Oil Emulsions ......................... 96
CHAPTER 4: CONCLUSIONS ................................................................................... 102
CHAPTER 5: REFERENCES ...................................................................................... 105

ix
LIST OF FIGURES
Figure 1.1: Image of fresh thyme herbs used for culinary purposes. ................................ 5
Figure 1.2: Image of contrived lavender plant. ................................................................. 6
Figure 1.3: Image of citronella plant captured in Spice Garden Penang, Malaysia. ......... 9
Figure 1.4: Image of olive leave captured in Secret Garden Bandar Utama Selangor,
Malaysia. ......................................................................................................................... 12
Figure 1.5: Schematic diagram of a surface active molecule.......................................... 13
Figure 1.6: The structure of glycolipid surfactant of sucrose stearate, sucrose palmitate
and sucrose myristate. ..................................................................................................... 16
Figure 1.7: Chemical structure of TritonTM
X series surfactant. ..................................... 17
Figure 1.8: Chemical structure of ceteareth-20. .............................................................. 18
Figure 1.9: Illustration of destabilization mechanism of emulsions adapted from
reference [106]. ............................................................................................................... 21
Figure 1.10: Illustration of phase inversion of emulsion structure transition from (a) o/w
emulsion to (b) w/o emulsion and vice versa, adapted from reference [108]. ................ 22
Figure 1.11: Illustration of proposed mechanism for transitional inversion and
formulation-composition map adapted from reference [109-113]. ................................. 23
Figure 1.12: Illustration of viscosity quantification picturing a piece of liquid moving at
shear rate () under applied shear stress () adapted from reference [130]. .................... 24
Figure 1.13: Illustration of stern model electrical double layer; distribution of counter-
ions in the vicinity of charged surface and variation of electrical potential with
increasing distance from charged surface adapted from reference [131]. ...................... 26
Figure 1.14: Illustration representing particle behaviour when exerted with (a) high zeta
potential and (b) low zeta potential; variation of free energy with particle separation in
suspension adapted from reference [133]. ...................................................................... 26

x
Figure 1.15: Illustration of (a) parallel plate; (b) cone and plate measuring system
adapted from reference [134]. ......................................................................................... 28
Figure 1.16: Maxwell model [10]. .................................................................................. 30
Figure 1.17: Plot of complex modulus G* [10]. ............................................................. 30
Figure 1.18: Diagram showing real time oscillation measurement of amplitude variation
performed at constant temperature and frequency (f). .................................................... 30
Figure 1.19: Diagram showing real time frequency measurement with frequency
variation performed at constant temperature and strain ()............................................. 31
Figure 3.1: Molecular structures of major chemical compounds present in thyme oil [19,
150, 151]. ........................................................................................................................ 45
Figure 3.2: Illustrations of emulsion droplet formation, (a) initial o/w emulsion system
and (b) inversion of emulsion droplet, w/o emulsion system. ........................................ 45
Figure 3.3: Illustration of emulsions droplets dispersed in continuous phase. ............... 47
Figure 3.4: Molecular structure of (a) Sudan IV and (b) crystal violet [156, 157]. ........ 47
Figure 3.5: Solubility of Sudan IV in (a) oil medium and, (b) aqueous medium. .......... 48
Figure 3.6: Solubility test of crystal violet in (a) oil medium and, (b) aqueous medium.
......................................................................................................................................... 48
Figure 3.7: Diagram showing Sudan IV in emulsion with addition of (a) solubilised
Sudan IV in oil (b) solid Sudan IV without stirring and (c) solid Sudan IV with stirring.
......................................................................................................................................... 49
Figure 3.8: Diagram showing crystal violet in emulsion with addition of (a) solubilised
crystal violet in water, (b) solid crystal violet without stirring and (c) solid crystal violet
with stirring. .................................................................................................................... 49
Figure 3.9: Accelerated test of emulsions at 45.0±0.1 ºC, 12.5 wt% thyme oil, o:w =
1:1; variation of 1-10 wt% sucrose palmitate glycolipid surfactants. ............................. 51

xi
Figure 3.10: Accelerated test of emulsions at 45.0±0.1 ºC, 12.5 wt% thyme oil, 5 wt%
SP; variation of oil percentage in total volume of emulsions from 10% to 90%. ........... 51
Figure 3.11: Accelerated test of emulsions at 45.0±0.1 ºC, 12.5 wt% thyme oil, 5 wt%
SP, o:w = 1:1; variation of 0.006-0.0074 wt% TritonTM
X-100. .................................... 52
Figure 3.12: Accelerated test of emulsions at 45.0±0.1 ºC, 12.5 wt% thyme oil, o:w =
1:1, 0.007 wt% TritonTM
X-100; variation of 0.1-1.0 wt% Ceteareth-20 for 5 wt% (a)
SS, (b) SP, (c) SM. .......................................................................................................... 53
Figure 3.13: Accelerated test of emulsions at 45.0±0.1 ºC, 12.5 wt% lavender oil, 5 wt%
SP, o:w = 1:1, 0.002 wt% TritonTM
X-100, 0.2 wt% ceteareth-20; variation of 0.005-
0.010 wt% TritonTM
X-45. .............................................................................................. 54
Figure 3.14: Accelerated test of emulsions at 45.0±0.1 ºC, 12.5 wt% lavender oil, o:w =
1:1, 0.010 wt% TritonTM
X-45, 0.002 wt% TritonTM
X-100; variation of 0.1-1.0 wt%
ceteareth-20 for 5 wt% (a) SS, (b) SP, (c) SM. ............................................................... 55
Figure 3.15: Accelerated test of emulsions at 45.0±0.1 ºC, 12.5 wt% tea tree oil, 5 wt%
SP, o:w = 1:1, 0.004 wt% TritonTM
X-100, 0.2 wt% ceteareth-20; variation of 0.005-
0.010 wt% TritonTM
X-45. .............................................................................................. 56
Figure 3.16: Accelerated test of emulsions at 45.0±0.1 ºC, 12.5 wt% tea tree oil, o:w =
1:1, 0.010 wt% TritonTM
X-45, 0.004 wt% TritonTM
X-100; variation of 0.1-0.5 wt%
ceteareth-20 for 5 wt% (a) SS (b) SP and (c) SM. .......................................................... 57
Figure 3.17: Accelerated test of emulsions at 45.0±0.1 ºC, 12.5 wt% tea tree oil, o:w =
1:1, 0.009 wt% TritonTM
X-45, 0.004 wt% TritonTM
X-100; variation of 0.1-0.5 wt%
ceteareth-20 for 5 wt% (a) SS (b) SP and (c) SM. .......................................................... 58
Figure 3.18: Accelerated test of emulsions at 45.0±0.1 ºC, 12.5 wt% citronella oil, 5
wt% SP, o:w = 1:1, 0.002 wt% TritonTM
X-45, 0.2 wt% ceteareth-20; variation of
0.001-0.09 wt% TritonTM
X-100. .................................................................................... 59

xii
Figure 3.19: Accelerated test of emulsions at 45.0±0.1 ºC, 12.5 wt% citronella oil, o:w =
1:1, 0.002 wt% TritonTM
X-45, 0.008 wt% TritonTM
X-100; variation of 0.1-0.5 wt%
ceteareth-20 for 5 wt% (a) SS (b) SP and (c) SM. .......................................................... 60
Figure 3.20: Accelerated test of emulsions at 45.0±0.1 ºC, 12.5 wt% citronella oil, o:w =
1:1, 0.002 wt% TritonTM
X-45, 0.008 wt% TritonTM
X-100; variation of 0.005-0.009
wt% ceteareth-20 for 5 wt% (a) SS (b) SP and (c) SM. .................................................. 61
Figure 3.21: Light micrograph of thyme oil emulsions stabilized by glycolipid
surfactants of (a) SS (b) SP, (c) SM. The micrograph was captured after one day of
storage at temperature of 45.0±0.1 ºC. ............................................................................ 64
Figure 3.22: The measurements of (a) mean droplet size (b) polydispersity index and (c)
zeta potential of thyme essential oil emulsions stabilized by glycolipid surfactants taken
for duration of 30 days. ................................................................................................... 65
Figure 3.23: Light micrograph of lavender oil emulsion stabilized by glycolipid
surfactants of (a) SS (b) SP, (c) SM. The micrograph was captured after one day of
storage at temperature of 45.0±0.1 ºC. ............................................................................ 67
Figure 3.24: The measurements of (a) mean droplet size (b) polydispersity index and (c)
zeta potential of lavender essential oil emulsions stabilized by glycolipid surfactant
taken for duration of 30 days. ......................................................................................... 68
Figure 3.25: Light micrograph of tea tree oil emulsion stabilized by glycolipid
surfactants of (a) SS (b) SP, (c) SM. The micrograph was captured after one day of
storage at temperature of 45.0±0.1 ºC. ............................................................................ 70
Figure 3.26: The measurements of (a) mean droplet size (b) polydispersity index and (c)
zeta potential of tea tree essential oil emulsions taken for duration of 30 days. ............. 71
Figure 3.27: Light micrograph of citronella oil emulsion stabilized by glycolipid
surfactants of (a) SS (b) SP, (c) SM. The micrograph was captured after one day of
storage at temperature of 45.0 ± 0.1 ºC. .......................................................................... 73

xiii
Figure 3.28: The measurements of (a) mean droplet size (b) polydispersity index and (c)
zeta potential of citronella essential oil emulsions stabilized by glycolipid surfactants
taken for duration of 30 days. ......................................................................................... 74
Figure 3.29: Rheological analysis of (a) viscosity as a function of shear rate, (b)
amplitude sweep and (c) frequency sweep of thyme emulsion stabilized by glycolipid
surfactants on first day of observation. ........................................................................... 78
Figure 3.30: Rheological analysis of (a) viscosity as a function of shear rate, (b)
amplitude sweep and (c) frequency sweep of thyme emulsion stabilized by sucrose
stearate after 30 days. ...................................................................................................... 81
Figure 3.31: Rheological analysis of (a) viscosity as a function of shear rate, (b)
amplitude sweep and (c) frequency sweep of thyme emulsion stabilized by sucrose
palmitate after 30 days. ................................................................................................... 82
Figure 3.32: Rheological analysis of (a) viscosity as a function of shear rate, (b)
amplitude sweep and (c) frequency sweep of thyme emulsion stabilized by sucrose
myristate after 30 days. ................................................................................................... 83
Figure 3.33: Rheological analysis of (a) viscosity as a function of shear rate, (b)
amplitude sweep and (c) frequency sweep of lavender emulsion stabilized by glycolipid
surfactants on first day of observation. ........................................................................... 85
Figure 3.34: Rheological analysis of (a) viscosity as a function of shear rate, (b)
amplitude sweep and (c) frequency sweep of lavender emulsion stabilized by sucrose
stearate after 30 days. ...................................................................................................... 87
Figure 3.35: Rheological analysis of (a) viscosity as a function of shear rate, (b)
amplitude sweep and (c) frequency sweep of lavender emulsion stabilized by sucrose
palmitate after 30 days. ................................................................................................... 88

xiv
Figure 3.36: Rheological analysis of (a) viscosity as a function of shear rate, (b)
amplitude sweep and (c) frequency sweep of lavender emulsion stabilized by sucrose
myristate after 30 days. ................................................................................................... 89
Figure 3.37: Rheological analysis of (a) viscosity as a function of shear rate, (b)
amplitude sweep and (c) frequency sweep of tea tree emulsion stabilized by glycolipid
surfactants on first day of observation. ........................................................................... 90
Figure 3.38: Rheological analysis of (a) viscosity as a function of shear rate, (b)
amplitude sweep and (c) frequency sweep of tea tree emulsion stabilized by sucrose
stearate after 30 days. ...................................................................................................... 93
Figure 3.39: Rheological analysis of (a) viscosity as a function of shear rate, (b)
amplitude sweep and (c) frequency sweep of tea tree emulsion stabilized by sucrose
palmitate after 30 days. ................................................................................................... 94
Figure 3.40: Rheological analysis of (a) viscosity as a function of shear rate, (b)
amplitude sweep and (c) frequency sweep of tea tree emulsion stabilized by sucrose
myristate after 30 days. ................................................................................................... 95
Figure 3.41: Rheological analysis of (a) viscosity as a function of shear rate, (b)
amplitude sweep and (c) frequency sweep of citronella emulsion stabilized by
glycolipid surfactants on first day of observation. .......................................................... 97
Figure 3.42: Rheological analysis of (a) viscosity as a function of shear rate, (b)
amplitude sweep and (c) frequency sweep of citronella emulsion stabilized by sucrose
stearate after 30 days. ...................................................................................................... 99
Figure 3.43: Rheological analysis of (a) viscosity as a function of shear rate, (b)
amplitude sweep and (c) frequency sweep of citronella emulsion stabilized by sucrose
palmitate after 30 days. ................................................................................................. 100

xv
Figure 3.44: Rheological analysis of (a) viscosity as a function of shear rate, (b)
amplitude sweep and (c) frequency sweep of citronella emulsion stabilized by sucrose
myristate after 30 days. ................................................................................................. 101
xvi
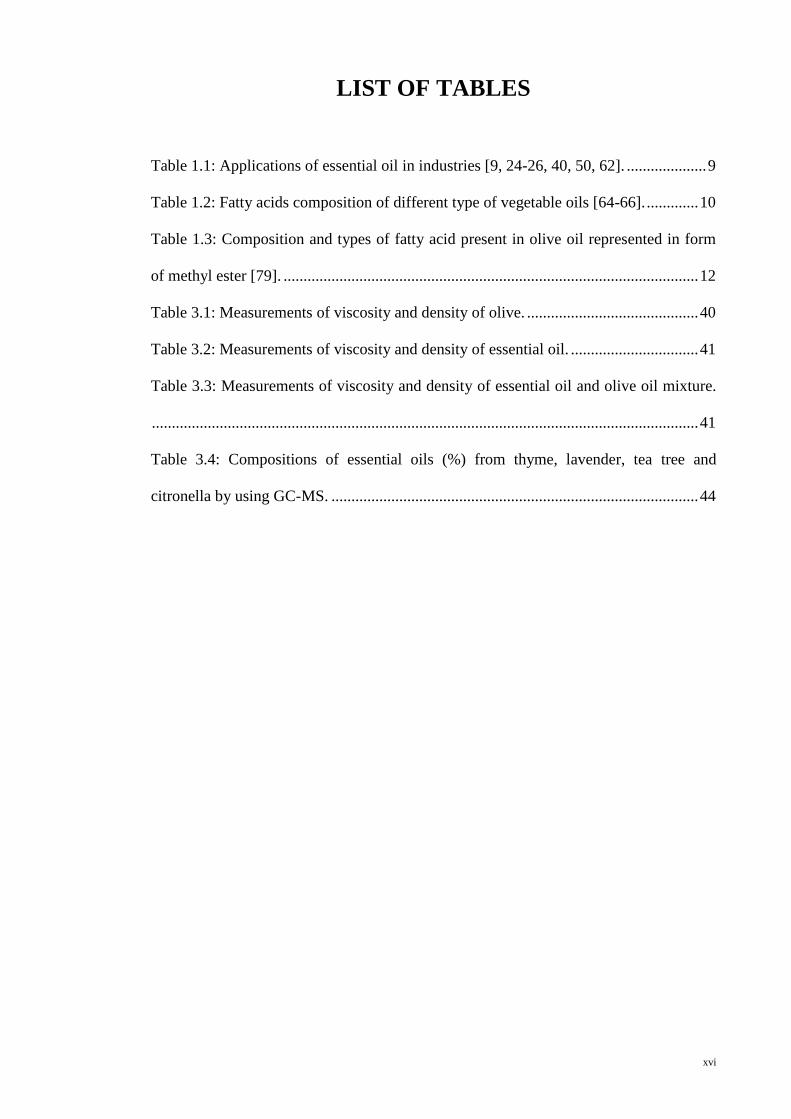
LIST OF TABLES
Table 1.1: Applications of essential oil in industries [9, 24-26, 40, 50, 62]. .................... 9
Table 1.2: Fatty acids composition of different type of vegetable oils [64-66]. ............. 10
Table 1.3: Composition and types of fatty acid present in olive oil represented in form
of methyl ester [79]. ........................................................................................................ 12
Table 3.1: Measurements of viscosity and density of olive. ........................................... 40
Table 3.2: Measurements of viscosity and density of essential oil. ................................ 41
Table 3.3: Measurements of viscosity and density of essential oil and olive oil mixture.
......................................................................................................................................... 41
Table 3.4: Compositions of essential oils (%) from thyme, lavender, tea tree and
citronella by using GC-MS. ............................................................................................ 44

xvii
LIST OF SYMBOLS AND ABBREVIATIONS
Symbols
Angular Speed
ηa Apparent Viscosity
A Area
VA Attraction Energy
B Boltzmann Constant
Ec Cohesive Force
VT Combined Energy
η* Complex Viscosity
Cone Angle
ε Dielectric Constant
D Displacement
η Dynamic Viscosity
UE Electrophoretic Mobility
σ Extensional Stress
ρ Fluid Density
F Force
f Frequency
g Gravity
H Height
f(a) Henry’s Function
γI Interfacial Tension
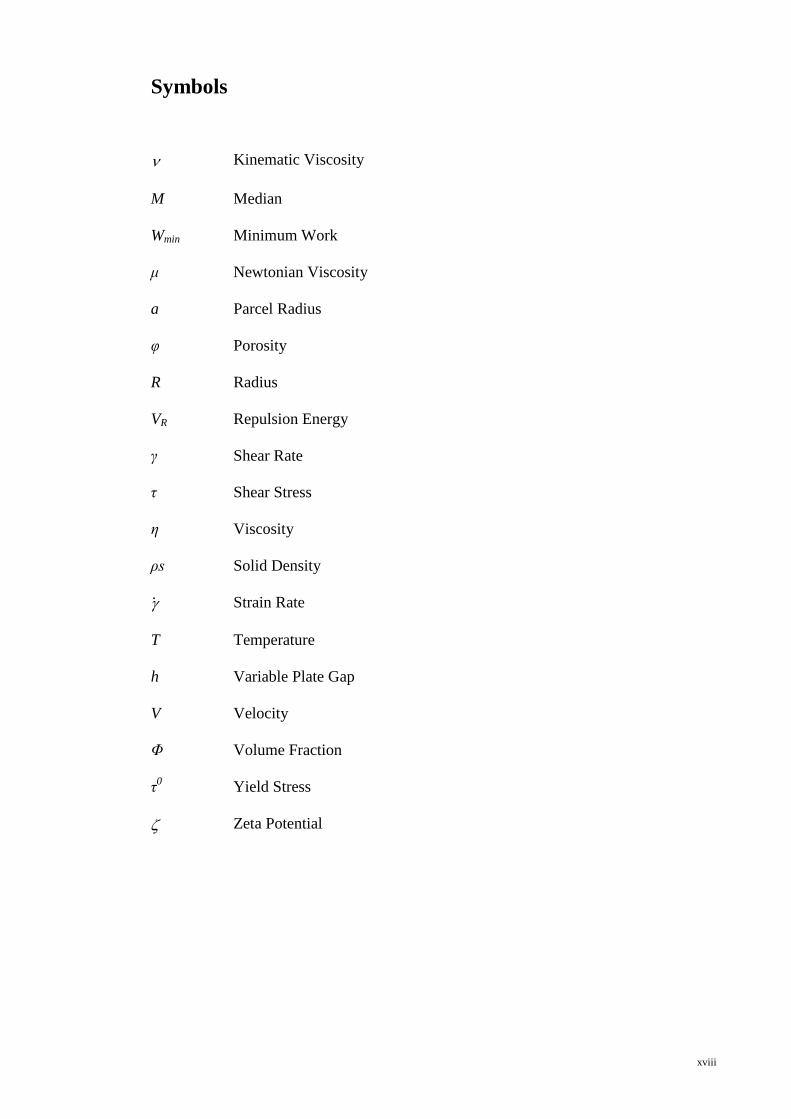
xviii
Symbols
Kinematic Viscosity
M Median
Wmin Minimum Work
μ Newtonian Viscosity
a Parcel Radius
φ Porosity
R Radius
VR Repulsion Energy
γ Shear Rate
τ Shear Stress
η Viscosity
ρs Solid Density
Strain Rate
T Temperature
h Variable Plate Gap
V Velocity
Φ Volume Fraction
τ0 Yield Stress
Zeta Potential

xix
Abbreviations
Ce-20 Ceteareth-20
CMC Critical Micelle Concentration
CP Cone and Plate
cP Centipoise
cSt. Centistokes
DLS Dynamic Light Scattering
GC-MS Gas Chromatography-Mass Spectrometry
i.d. Internal Diameter
LDL Low-Density Lipoprotein
LDV Laser Doppler Velocimetry
LVR Linear Viscoelastic Region
PDI Polydispersity Index
PIT Phase Inversion Temperature
PP Plate and Plate
RO Reverse Osmosis
rpm Revolutions Per Minutes
SAD Surfactant Affinity Difference
S.I. International System
SM Sucrose Myristate
SP Sucrose Palmitate
SS Sucrose Stearate
TX TritonTM
Wt% Weight Percentage

xx
Abbreviations
O/W Oil in Water
O/W/O Oil-in-Water-in-Oil
W/O Water in Oil
W/O/W Water-in-Oil-in-Water

xxi
LITERATURE REVIEW
Cosmetic industry is a fast growing industry that evolves rapidly to fulfil the
demand of human on maintaining and improving physical outlook from using simple
application of cosmetic products on skin surface to the highly complicated corrective
surgery to achieve satisfactory results [1, 2]. Safety of cosmetic products has been a
debate for a long time. Increasing awareness and education in the society has changed
the direction of the cosmetic industries, as more users are optioning for product
produced from natural ingredient as compared to synthetic chemical products.
Cosmetic products are normally being applied topically on skin and leaves skin
with a protective barrier while certain active ingredient penetrates into the skins and
gets into the body system [1, 3]. Semisolid emulsions, oil-free dispersions, lotion and
fluid are used as vehicle to deliver active ingredient such as drugs and cosmetic agents
to the skin as these mobile dispersions enhance the therapeutic of properties topically
applied products on skin [4-7].
Aroma plays a key role in attracting consumers with a pleasant odour and
increases the interest of consumers in products purchasing. Aroma from fragrances is
usually added into cosmetic creams and cosmetic toiletries, but the use of synthetic
fragrance sometimes causes irritation or triggers allergic reaction to users with sensitive
skin [7, 8]. Therefore, natural essential oil has been adapted in cosmetic industry
nowadays as a substitute to fragrances.
Apart from having characteristic odour, essential oil also possesses beneficial
properties such as antimicrobial, antibacterial, antioxidant, anti-ageing and others
resulting from the chemical compound present. Increased in demand and popularity of
essential oil resulted in increased adaptation of essential oil in cosmetic toiletries as
xxii
additives for product such as soap, fragrances, creams and lotions in replacing synthetic
fragrances [8].
Careful selection and understanding of essential oil had to be made before
selecting and using the desired essential oil. Like other chemicals, essential oils were
graded into a few categories where some would cause harm when used. Pure grade
essential oils are safe to be used even in high amount with the condition that they have
been toxicologically certified safe to be used [9, 10]. Some essential oil such as buchu,
mugwood, bitter fennel, star anise, thuja, wormwood and wintergreen are not
recommended for use due to the presence of highly toxic compounds in them [8-10].
High production cost of pure essential oil causes industry to substitute or to add
synthetic chemical compound to refined essential oil as a substitute to the naturally
occurring compound in essential oil. Addition of synthetically produced chemical
compound reduces the price of essential oil giving consumers a choice of purchasing
essential oil at a lower price. Synthetic essential oil is not suitable to be applied directly
on skin as they would most likely to cause sensitivity to users if used in high dose [10].
Therefore, the potential use of high dose essential oil has been hindered due to safety
and suitability of oil used.
Although essential oil has been well known for its beneficial property, its
potential has been hindered to a minute amount usage due to the presence of corrosive
and toxic compounds in some essential oil and its instability in forming emulsion if
used in high concentration [10]. In this project, emulsion containing high composition
of pure essential oil was formulated and studied to increase the potential application of
essential oil in the future.

xxiii
Essential oil such as thyme oil, lavender oil, tea tree oil and citronella oil have
been selected as a subject of study. Food grade natural vegetable oil which is olive oil
has been used as carrier oil and diluent of essential oil where high amount of essential
oil can be introduced into the emulsion system with higher probability of formation.
Food grade olive oil is tested to be safe for consumption [11, 12]. Therefore, ingesting
emulsion produced from this carrier oil would not cause harm to human. Glycolipid
surfactants used in the formulation are of food grade material where they are safe for
consumption in a controlled quantity. As natural ingredients are preferred in the
industries today, selection of chemicals used must be of natural and least harmful to
human.

1
CHAPTER 1: INTRODUCTION

Chapter 1 Introduction
2
1.1 Essential Oil
Essential oil, an essence of a plant which carries distinctive aroma which is
‘essential’ as their name suggested. Essential oil comprise of mixtures of chemical
compounds such as terpenes, terpenoids, alcohols, aldehydes and phenols which bring
about the beneficial properties such as antibacterial and anti-fungi property which acts
as the defensive system of a plant against harmful environment and organism [9, 10].
Apart from that, they also possesses properties such as antioxidant, anti-ageing,
expectorant, carminative and other beneficial properties acting synergistically to give
therapeutic effects [10]. Every essential oil is made up of chemical components which
are distinctively different from each other which bring about the difference in the aroma
and the function each carries. Most essential oils extracted are biologically active [13].
As the pleasant aroma would soothe and relax human mind and body, essential
oil has been widely used in aromatherapy sector as fragrant oil and massage oil.
Essential oil is highly volatile hence evaporates easily in air [10]. Inhaling essential oil
would help to calm and relax exhausted mind and relax cramp muscle which developed
from daily activities while massaging diluted essential oil or cream containing essential
oil would assist the absorption of the essential oil into the skin layer [14, 15].
Essential oil mostly takes effect on the limbic system of human brain by
stimulating olfactory bulb which has close anatomical ties to the limbic system,
responsible for emotional expressions of a person [14]. Aroma from the essential oil
sends signal to the olfactory bulb where then the limbic system would influence the
endocrine and autonomic nerves of the body [15]. Absorption of essential oil through
the skin was an alternative route where small molecules of essential oil permeate
through the skin barrier into the human blood system and exert a measurable
psychological effect [14, 15].

Chapter 1 Introduction
3
Extraction of essential oil was usually carried out by using hydrodistillation and
steam distillation method [16]. These methods are usually being adopted due to their
simplicity in handling and cleaner as compared to solvent extraction method which
usually consumes a great amount of solvent.
Essential oil also shows important applications in culinary sector as they had
been used in culinary in European countries as a taste enhancer and as food
preservatives. Development of technology and lifestyle evolvement does not change the
habit of natives using essential oil in food. This shows the wide applications of essential
oil and their persistency in the industry [17, 18].
Replacement of synthetically produced and harmful material has shown
importance in cosmetic industries as synthetically produced cosmetic ingredient
sometimes would cause skin sensitization and may also trigger allergic reaction. The
use of synthetically produced preservatives such as parabens might be reduced by
adding essential oil as a component of the formulation as the oil possesses antibacterial
and antimicrobial properties which are responsible for the reducing of the degradation
of cosmetic product by these microorganism [18].
Generally, paraben had been used as preservatives to maintain product integrity
in cosmetic industries because they are cheap and can be easily obtained. Study on
antimicrobial properties shows that essential oil such as thyme, lavender, tea tree,
cinnamon, eucalyptus and sandalwood has high potential to be natural preservatives
which can serve as replacement for harmful material such as parabens [18, 19]. Apart
from its beneficial properties, essential oil also carries pleasant aroma which would
counter the need of use of fragrance in cosmetic.

Chapter 1 Introduction
4
1.1.1 Thyme Oil
Thyme which originated from Labiatae family is a small subshrub, low-growing
perennial herbaceous plant which has been used since ancient time as medicinal herbs
and as a culinary. It is cultivated and harvested in countries such as in Spain, Portugal,
France, Greece and India [16]. There is a large variety of thyme that could be found for
example lemon thyme, garden thyme and silver thyme with variation of scent and
application. The chemical component present varied with geographical origin of
production and species of thyme cultivated [16, 20].
Thyme takes its name from Greek word “thymos” which means “to perfume”.
Thyme has long been used by ancient Egyptians for embalming, ancient Greeks in their
baths and ancient Romanians in purifying their room [20]. Thyme herbs has been
ingested and added into food as preservative and seasoning since ancient times and this
culture has remained until today. Fresh or dried thyme leaves are added into cooking as
taste enhancer while it naturally preserves the food quality [21].
Thyme has a very strong, sharp and persistent aroma which is mainly due to the
presence of thymol and carvacrol [16]. Extracts from Thymus vulgaris yield two types
of thyme essential oil where the first extraction produces the crude extract which is red
thyme and white thyme or sweet thyme which is produced from subsequent extraction
of red thyme [22]. Red thyme consists of the major constituent of the thyme extracts of
thymol and other phenolic monoterpenes. It possesses a sharp spicy aroma while white
thyme is a milder type of essential oil produced and possesses a softer sweet smell [23].
White thyme can be applied to elderly people and even children while red thyme cannot
be applied to both categories due to the high content of phenolic compound [19].
Due to the presence of phenolic monoterpenes, thyme oil shows high resistance
to microbial activity [19, 22]. They are highly antiseptic, antimicrobial and anti-
inflammatory therefore, they have been highly used as disinfectant in hospitals and as

Chapter 1 Introduction
5
an active ingredient in antiseptic creams. Thyme has also been used in cough syrup to
act as carminative, expectorant and spasmolytic agent to treat diseases related to bronchi
[21]. Besides that, properties such as antioxidant, anti-inflammatory and anti-ageing it
possesses meets the requirement of cosmetic applications in preserving the youthfulness
of skin, promoting the health and hygiene of skin [9, 24-28].
Figure 1.1: Image of fresh thyme herbs used for culinary purposes.
1.1.2 Lavender Oil
Lavender oil extracted from plants of genus Lavandula comprises of many
different species belonging to Lamiaceae family, namely Lavendula officinalis,
Lavendula angustifolia and Lavendula vera. The name lavender was derived from its
Latin name ‘Lavare’ which means ‘to wash’. These plants were grown in Mediterranean
countries, Middle East, China and India [29] and had been widely used for their
pharmacological properties in medical purposes [30-33]. Essential oil extracted from
these plants consisting mainly mixtures of terpenes and terpenoid [34, 35].
Uses of lavender oil dated back to 2,500 years ago, where the beautifully scented
lavender has been widely used in perfume making industries. Modern aromatherapy
application was introduced when a chemist and perfumer Rene-Maurice Gattefosse
(1881-1950) accidentally plunged his burned hand into neat lavender oil and

Chapter 1 Introduction
6
discovering that his wound healed rapidly without scarring. The discovery of medical
application of essential oil has redirected the research of essential oil, not limiting
merely to perfumery but also extending to development of complementary-alternative
medicinal applications [10].
Lavender oil has been used as an antibacterial, antifungal, sedative, anti-
depressive agent and works effectively for burns and insect bites [36]. It blends readily
with other essential oils such as cedar wood, pine, geranium, nutmeg, thyme and ylang
ylang to give a pleasant smell and to improve therapeutic effect of essential oil acting
synergistically.
Lavender oil serves an important role in the fragrance industries due to its
delightful odour and its psychological effects on human. Increase in relaxation, mood
improvement, sedation [36], anti-conflict [37], and altered motor activities [38] are
shown when exposed to lavender oil. In addition, it also increases the human
concentration and accuracy in completing a task [39]. Several products such as soaps,
colognes, perfumes, skin lotions and other product had been produced by using this
essential oil [40, 41]. Lavender oil also has been used in food manufacturing industry as
beverages, ice creams, candy and confectionaries flavouring [42].
Figure 1.2: Image of contrived lavender plant.

Chapter 1 Introduction
7
1.1.3 Tea Tree Oil
Melaleuca alternifolia with the common name of tea tree is a native plant in
Australia categorized in the Myrtaceae family. It has a feature of tree with needle like
leaves. Early discovery of uses of tea tree are highly linked to aborigines of Australia
which uses it to treat ailment from wound treatment to cold and cough treatment [43].
Tea tree is further introduced by Captain James Cook which landed nearby Sydney,
Australia (1770), who later discovers the uses, benefits and medicinal value of tea tree
from natives of Australia after noticing that the land was filled with massive groves of
trees with thick and aromatic leaves. Thereafter, there was widespread use of tea tree oil
among Australian settlers in the 19th
century and until today. Tea tree oil has still been
extensively used for its therapeutic properties [43-45].
Tea tree has been widely cultivated for commercial purposes in the coastal
region of northen New South Wales and the Atherton Tablelands of Queensland . Tea
tree oil extracted from Melaleuca alternifolia consist mostly terpenes hydrocarbon and
tertiary alcohols. The main component of tea tree comprises of terpinen-4-ol, γ-
terpinene, α-terpinene, 1,8-cineole, p-cymene, α-terpineol, α-pinene, terpinolenes,
limonene and sabinene [43-45]. Researcher found that tea tree act actively in
antimicrobial activity and it treats cutaneous skin infections effectively [47-49].
Therefore, they are used broadly for treating acne and skin related disease. Apart from
that, it has also been used to treat cold sores, dandruff, onychomycosis, oral candidiasis
and tinea pedis by topically applied to the skin surface [50].
Tea tree oil is only safe for topical applications and not for consumption, unlike
thyme oil, lavender oil and citronella oil which can be consumed and be added as one of
the taste enhancer in food [50, 51]. Presence of 1,8-cineole, a skin irritant in tea tree oil
might induced skin sensitization and irritation if used at a high amount [48]. Tea tree
oil would cause intoxication if consumed at a certain high amount supported by the

Chapter 1 Introduction
8
evidence from experiments studied on human and rat [51, 52]. Clinical studies reveal
that ingestion of tea tree oil would cause central nervous system depression causing
ataxia, unconsciousness and unresponsiveness depending on the amount of ingestion
[53]. Therefore, tea tree oil is relatively safe for low concentration of topical application
while not safe to be consumed or used at high dosages [52, 53].
1.1.4 Citronella Oil
Cymbopogon plant is a low growing perennial grass famous for its delightful
lemon like aroma used majorly to ward off insects and mosquito [54]. Fresh plant of
citronella has been traditionally used in culinary as taste enhancer and as folk remedies
for medication purposes (Figure 1.3). The lemon like aroma is due to the presence of
limonene which is identical to those found in lemon extracts [54, 55]. Citronella
essential oil extracted from Cymbopogon genus is graded according to the species of
plant and composition of citronellol and citronellal. Java citronella extracted from
Cymbopogon winterianus contain 16% citronellol and 33% citronellal is graded to be
superior than Ceylon citronella extracted from Cymbopogon nardus which contain 8%
citronellol and 5% citronellal [56]. Citronellal oil comprises fractions of citronellal,
geraniol, citronellol, citronellyl acetate, β-bourbonene, geranyl acetate, elemol, L-
borneol and nerol [56-60].
Citronella is widely distributed in the Mediterranean area [54] and South East
Asia country especially Ceylon and Java. Taiwan, Sri Lanka, India and Mexico are few
countries that contribute to world supply while China and Indonesia are the main
producers of citronella oil [61]. Citronella is cultivated for its fresh fragrance leaves
which are commonly used in preparation of food and beverages. Citronella shows
medicinal properties like bringing back appetite, diuretic and its aqueous extract cures

Chapter 1 Introduction
9
intestinal troubles, food poisoning and helps digestion [55]. Citronella also can be used
to alleviate neurodegenerative disorder [61], treat cough, elephantiasis, malaria,
pneumonia and vascular disorders. Research found that citronellal holds antidepressant,
antioxidant, antiseptic, fungicidal, astringent, antibacterial, sedative and nervine
properties [62].
Figure 1.3: Image of citronella plant captured in Spice Garden Penang, Malaysia.
Table 1.1: Applications of essential oil in industries [9, 24-26, 40, 50, 62].
No Essential Oil Applications
1. Thyme oil Antiseptic, preservatives, expectorant
2. Lavender oil Fragrance, antioxidant, aromatherapy
3. Tea Tree oil Antiseptic, antioxidant, acne treatment
4. Citronella oil Insect repellent, lice treatment
Chapter 1 Introduction
10
1.1.5 Carrier Oil: Olive Oil
Carrier oil is a diluent used to dissolve, reducing concentration of active material
and as a vehicle to aid absorption of essential oil through skin. Due to the corrosive
nature of some essential oil for example thyme oil, diluent must be added to reduce the
concentration of phenolic compound present before applying on skin [10]. Differences
between essential oil and carrier oil are essential oil comprises of volatile aromatic
chemical compounds where they would evaporate easily, would be oxidized but will not
turn rancid.
While carrier oil, a vegetable oil comprises of triglycerides, free fatty acids and
fat soluble vitamins would turn rancid if kept for a long period of time [63]. Blending
essential oil with carrier oil prolong the shelf lives of oil while carrier oil contains
liposoluble vitamins and minerals further enhances the therapeutic effect and benefits of
essential oil delivered through topical applications [10]. Carrier oils are selected from a
range of vegetable oils such as olive oil, grape seed oil, avocado, sweet almonds, jojoba
oil and sunflower oil [63].
Table 1.2: Fatty acids composition of different type of vegetable oils [64-66].
Types of
Oil
Saturated
(mol/mol)
Monounsaturated
(mol/mol)
Polyunsaturated
Omega-6
(mol/mol)
Polyunsaturated
Omega-3
(mol/mol)
Peanut
Olive
Maize
Soya
Sunflower
17-21
8-14
12-28
10-18
5-13
40-70
65-83
32-35
18-30
21-35
13-28
6-15
40-62
35-52
56-66
-
0.2-1.5
0.1-0.5
6.5-9
-

Chapter 1 Introduction
11
Olive oil served as a staple food for most of the countries in Mediterranean
mostly Italy, Spain and Greece [64]. Olive oil contains 98% to 99% triglycerides with
1% to 2% of minor component exerting important values associated with antioxidant
power compared to other vegetables oils (Table 1.2 & Table 1.3). Oleic acid present
abundantly in olive oil as monounsaturated fatty acids act as skin softener agent in
wrinkle prevention [65]. Minor components of olive oil comprises of phenolic
compounds (hydroxytyrosol, oleuropeine, caffeic acid, vanillic acid and ferulic acid),
carotenoids (β-carotene and lutein), α-tocopherol, squalene, phytosterols, and
chlorophyll [66].
Polyunsaturated ω-6 and ω-3 (eicosapetaenoic and docosahexaenoic acids) acts
as local anti-inflammatory and immune-protection against infections such as atopic
dermatitis, acne, eczema, psoriasis and keep skin hydrated by maintaining skin
homeostasis [66, 67]. Squalene, a biochemical precursor of steroids found in olive oil is
a potential chemo-preventive compound that has anti-neoplastic effect which inhibits
the development and spread of neoplastic cells on colon, breast and prostate [67, 68].
These components hold the ability of olive oil in decreasing LDL cholesterol level,
reduces blood pressure, reduce risk of heart disease and tumour, protection from colon
and breast cancer [69-72].
Numerous antioxidants present in olive oil act synergistically as derma-
protection against atmospheric pollution and solar ray typically ultraviolet ray which
causes favouring of cell photo-ageing, lipid peroxidation and development of skin
cancer [73-77]. There is an increasing trend where olive oil has been used as key
ingredient in soap making, creams, lotions and other products such as hair shampoos
and conditioners [78].

Chapter 1 Introduction
12
Figure 1.4: Image of olive leave captured in Secret Garden Bandar Utama Selangor,
Malaysia.
Table 1.3: Composition and types of fatty acid present in olive oil represented in form
of methyl ester [79].
IUPAC Name Common
Name
Composition
Percentage
(mol/mol)
Chemical Structure
Octadec-9-enoic acid Oleic acid 56.0 – 83.0
Hexadecanoic acid Palmitic acid 7.5 – 20.0
9,12-octadecadienoic
acid Linoleic acid 3.5 – 20.0
Octadecanoic acid Stearic acid 0.5 – 3.5
Hexadec-9-enoic
acid
Palmitoleic
acid 0.3 – 3.5
9,12,15-
octadecatrienoic acid Linolenic acid 0.0 – 1.5
Tetradecanoic acid Myristic acid 0.0 – 0.5
Others - Minor

Chapter 1 Introduction
13
1.2 Surfactant
Surface-active agent termed surfactant is a substance having ability to adsorb at
the interface when present at low concentration to form colloidal aggregates altering the
interfacial free energies of interfaces (boundary between any two immiscible phases),
hence reduces the interfacial tension between two phases [80-82]. Interfacial tension
between two phases is measured by determining the interfacial free energy per unit area
which is the minimum amount of work (Wmin) required to create or expand an unit area
of interface; interfacial area. Therefore, when two surfaces with great
dissimilarity meet, the greater the interfacial tension I at the boundary between two
phases [82].
Figure 1.5: Schematic diagram of a surface active molecule.
Surfactant is an amphiphile having a characteristic molecular structure build up
of lyophobic (hydrophobic) hydrocarbon tail having preference to organic solvent and
lyophilic (hydrophilic) polar head group which has a strong attraction to aqueous
solvent (Figure 1.5) [81-83]. Amphiphatic character of surfactant reduces surface
tension dramatically at low concentrations [83]. Lyophobic group distorts the
orientation of solvent to minimize contact between lyophobic group with solvent
increasing the free energy of the system minimizing unfavourable solvophobic (solvent

Chapter 1 Introduction
14
revulsion) interactions [82-84] enabling surfactant to dissolve favourably in both
organic and aqueous solvent.
Interfacial processes such as foaming, detergency and emulsification depends on
the concentration, orientation and packing of surfactant at the interface. Interfacial area
occupied by a surfactant molecule greatly influenced the effectiveness of adsorption of
surfactant at the interface [84-86]. Structural orientation and surfactant head group
determine the effective cross-sectional area at interface of surfactant where the smaller
the effective cross-sectional area of surfactant, the smaller the interfacial area and hence
the greater the effectiveness of adsorption of surfactant at the interface [81-84]. High
speed wetting and spreading determines the rate of adsorption which determines the
performance of surfactant [82-89].
Surfactant plays a major role in the pharmaceutical and cosmetics industries. It
is widely used to stabilize droplet of dispersed phase of emulsion system preventing the
separation of two immiscible phases such as oil and water [84]. Surfactant plays a vital
role in many applications and products including detergent, paint, cosmetics,
pharmaceutical fibres, synthesizing polymer and agrochemical for herbicides and
insecticides [83]. Surfactant has been classified according to the formal charge on
surfactants head groups namely anionic, cationic, non-ionic and zwitterionic surfactant
[88].
(a) Anionic surfactant
The surface-active polar head group bears a negative charge, for example
RCOO-Na
+ (soap) and RC6H4SO3
-Na
+ (alkylbenzene sulfonate). Anionic surfactants are
the largest class of surfactant and generally not compatible with cationic surfactant [83,
84].

Chapter 1 Introduction
15
(b) Cationic surfactant
Cationic surfactant is a molecule with positive charged head groups, for example
primary amine R-NH2, which would ionize to NH3+
ions when dissolve in acid
solutions, RNH3+Cl
- (salt of a long chain amine) and RN(CH3)3
+Cl
- (quaternary
ammonium chloride). The most common cationic surfactants used are quaternary
ammonium compound which is less sensitive to pH change [82-88].
(c) Zwitterionic surfactant
Zwitterionic surfactant is an amphoteric molecule with both positive and
negative charges present on the surface-active portion. For example RN+H2CH2COO
-
(long chain amino acid) and RN+(CH3)2(CH2)2SO3
- (sulfobetaine). Zwitterionic
surfactant is the smallest groups of surfactant and has the highest compatibility with
other classes of surfactants [82-89].
(d) Nonionic surfactant
Nonionic surfactants bear no apparent ionic charge on the surface-active portion.
For example RCOOCH2CHOHCH2OH (monoglyceride of long-chain fatty acid) and
RC6H4(OC2H4)xOH (polyoxyethylenated alkylphenol). Nonionic surfactants are
prepared by addition of ethylene oxide to long chain hydrocarbons with terminal polar
groups like –OH, -COOH. Introduction of ethoxy groups which are polar in nature to
form hydrogen bond with water increases the solubility of non-ionic surfactant in water.
However, the resulting molecule still possesses amphiphilic character for micelle
formation. Nonionic surfactant has lower CMC (critical micelle concentration) value
compared to surfactant from other classes. Sensitivity to temperature changes is a
distinctive feature of non-ionic surfactant [84-88].

Chapter 1 Introduction
16
1.2.1 Glycolipid Surfactant
Use of surfactant causes an impact on environment where the biodegradability
and toxicity to marine organism became an issue of concern [89, 90]. Therefore,
renewable and readily biodegradable surfactant has been opted to replace commercial
surfactant in order to favour environmental sustainability and to reduce toxicity impact
on marine life. Such surfactant comprises of naturally occurring carbohydrates and
amino acids for hydrophilic head groups and natural fats for hydrophobic groups [91].
Figure 1.6: The structure of glycolipid surfactant of sucrose stearate, sucrose palmitate
and sucrose myristate.
HO
HO
O
HO
O
HOOH
OH
OH
O
O O
Sucrose Myristate
C14
HO
HO
O
HO
O
HOOH
OH
OH
O
O O
Sucrose Stearate
C18
HO
HO
O
HO
O
HOOH
OH
OH
O
O O
Sucrose Palmitate
C16

Chapter 1 Introduction
17
Glycolipid surfactants are biosurfactant comprising of a hydrophobic lipid tail
and hydrophilic sugar head group (Figure1.6). These properties enable the surfactant to
form a highly organized structure through self-assembly [92]. Glycolipid surfactant
such as sucrose stearate (SS), sucrose palmitate (SP) and sucrose myristate (SM) has
been used in the formulation of essential oil emulsion. These glycolipid surfactants are
made up of a saccharides head groups and hydrocarbon tail or lipid tail which would
dissolve in oil. The glycolipids property aid reduction in surface tension and promotes
mixing in the emulsion system. Glycolipids are generally nontoxic and biodegradable
[93]. With increasing environmental awareness, bio-based surfactants which are
biodegradable and safe are preferably selected compared to petroleum based synthetic
surfactants [94].
1.2.2 Co-Surfactant: TritonTM
X-100 and TritonTM
X-45
Figure 1.7: Chemical structure of TritonTM
X series surfactant.
TritonTM
X-100 is a nonionic surfactant consisting of hydrophilic polyethylene
oxide group and hydrophobic phenyl group [95]. TritonTM
is an octylphenol ethoxylate
with high compatibility with other anionic surfactants with excellent wetting ability [96,
97]. TritonTM
X series of surfactant vary in molecular weight and number of ethylene
oxide units in the structure; for example TritonTM
X-100 has an 9 to 10 ethylene oxide

Chapter 1 Introduction
18
unit per molecule with average molecular weight of 625 g mol-1
. Therefore, TritonTM
X
series varies with solubility and surface acting property depending on the chain lengths
of surfactant used; TritonTM
X-100 which has a longer chain lights has higher solubility
in water at room temperature while TritonTM
X-45 has borderline oil-water solubility
[97].
1.2.3 Co-Surfactant: Ceteareth-20
Figure 1.8: Chemical structure of ceteareth-20.
Ceteareth-20 is a polyoxyethylene ethers compound composed of a long lipid
tail and ether head group used as emulsifier and thickener to increase viscosity of
colloidal system. Unsaturated lipid tail can be packed closely increasing entanglement
and increases resistance to flow and hence increases viscosity of colloidal system [98,
99]. Addition of thickener improves fragmentation and increases the kinetic stability of
colloidal suspensions consequently slowing down the destabilization process such as
sedimentation and particle aggregation [99].

Chapter 1 Introduction
19
1.3 Emulsion
Emulsification is a process of dispersing immiscible fluids (oil and water) into
each other by creation of an interface forming droplets of diameter generally greater
than 0.1 µm [80, 100]. Emulsions are heterogeneous liquid mixtures comprising of
dispersed medium suspended in a dispersed phase or continuous phase. Emulsion has a
milky white, opaque appearance resulting from light scattering and diffuse reflection
phenomenon at the phase interfaces of emulsions. Light changes in velocity and
refracted when travelled from phases having lower refractive index (water-phase) into
phases having higher refractive index (oil-phase). Therefore, when the difference
between refractive indices is greater, the changes in velocity of light passing through
emulsion would also be greater resulting in higher opacity of emulsion [101, 102].
Emulsions are categorized by phase ratio between oil and water, order of
addition and type of emulsifier used. For example, emulsions with volume fraction of
oil, Φoil 0.3 and smaller is an o/w type emulsion, whereas emulsions with volume
fraction of oil, Φoil 0.7 and larger is a w/o type of emulsion. Generally, emulsions are
sorted to oil-in-water (o/w), water-in-oil (w/o), water-in-oil-in-water (w/o/w) and oil-in-
water-in-oil (o/w/o) emulsions type [103]. Formation of emulsions type are greatly
affected by the nature of surfactant and oil type used, mechanical of formation and
technique used in blending emulsion [100].
Emulsions do not form spontaneously due to the high interfacial tension and
positive free energy which causes them to be thermodynamically unstable [101].
Therefore, external energy input through homogenization, mechanical stirring or
shaking is needed for formation of emulsion. Additives such as emulsifiers, finely
divided solids and polymers are added into the system to promote excellent long-termed

Chapter 1 Introduction
20
stability of emulsions [100-103]. Emulsifier adsorbs at the oil and water interfaces
creating an energy barrier toward destabilization of emulsions [104].
Destabilization process causes separation of emulsions into respective
immiscible phases through mechanisms such as coalescence, flocculation, creaming and
Ostwald ripening [104]. Coalescence is an irreversible process taking place when two
droplets in contact overcome the energy barrier between them to merge forming larger
droplets [104, 105]. Meanwhile, flocculation took place when many droplets combine to
form flocci. Flocculation of emulsion droplet near the surface is known as creaming
process and sedimentation took place when flocci appear to be at the bottom of
emulsions [105]. Ostwald ripening is a process involving diffusion flow of surfactant,
droplet with smaller size would dissolve and decreases in sizes reassembling to form
larger size droplet (Figure 1.9) [103-105]. Industrial manufacturer governs on variables
such as temperature, composition and droplet size distribution to control production of
highly stabilized monodispersed narrow size emulsion minimizing possible
destabilization processes [104].

Chapter 1 Introduction
21
Figure 1.9: Illustration of destabilization mechanism of emulsions adapted from
reference [106].
Dispersed
emulsion
Flocculation Sedimentation Ostwald ripening Creaming
Coalescence ---Initial size
Phase separation

Chapter 1 Introduction
22
1.3.1 Phase Inversion
Phase inversion occurs when structure of emulsion formed inverted from initial
system enclosing the dispersed phase into internal phase of emulsion droplets (Figure
1.10). This process requires low energy input therefore forming emulsions
spontaneously producing usually fine and monodispersed emulsions. Therefore, phase
inversion method frequently being utilized to produce emulsion industrially [106, 107].
Phase Inversion Temperature (PIT) method is the most frequently used method
correlated with spontaneous curvature of surfactant subjected to temperature quench
[107].
(a) (b)
Figure 1.10: Illustration of phase inversion of emulsion structure transition from (a) o/w
emulsion to (b) w/o emulsion and vice versa, adapted from reference [108].
Changes in physiochemical parameter such as temperature, pressure, salinity,
pH of continuous phase, incorporation of co-surfactants, SAD (Surfactant Affinity
Difference) and proportion of oil and water takes effect on the spontaneous curvature of
aggregation of surfactant at interface causing phase inversion of emulsion droplets [108-
113]. SAD is positive for lipophilic surfactant and negative for hydrophilic surfactant
and when the empirical number reaches to zero, the surfactant would has the same
affinity to both aqueous and oil phases [110-113].

Chapter 1 Introduction
23
Formulation-composition map is a qualitative tool to evaluate the phase
transition of emulsion depending on the emulsification protocol taking into account of
surfactant types and the surrounding environment where surfactant is present (Figure
1.11) [114-118]. Central region and transition zones are greatly affected by surfactant
concentration where increase in surfactant concentration enlarges both of these regions
while mechanical stirring give the opposite effect. Increase in oil phase viscosity
favours catastrophic inversion from A+ to C+ region by shrinking A+ region. Whereas,
increase of aqueous phase viscosity decreases the A- region endorsing inversion from
A- to B- regions. Emulsion can be inverted crossing the line from A+ to A- where the
inversion is transitionally governed by dramatic decrease of interfacial tension
involving passage through lamellar liquid crystalline phase [118-124]. Whilst,
emulsions undergoing catastrophic phase inversion (crossing bold line), progressed
through formation of temporary multiple emulsions [114, 125-128].
Figure 1.11: Illustration of proposed mechanism for transitional inversion and
formulation-composition map adapted from reference [109-113].
O/W
SAD<0
W/O
SAD>0
Bicontinuous
SAD=0
Water
Oil
W/O
B-
B+
W/O
A+
W/O
A-
O/W
C-
O/W
C+
O/W
SA
D>
0
SA
D<
0
0
Hyd
rop
hil
i
c
Lip
op
hil
ic
Form
ula
tion
SA
D
0
Oil
1
Composition WOR
∞
Water

Chapter 1 Introduction
24
1.4 Viscosity
Viscosity is a measurement of resistance of flow of material moving through
surfaces. Fluids resist relative motion of layers with differing velocities within them
opposing changes in the initial formation generating internal resistance to flow [129]. A
fluid showing high resistance opposing flow is said to be thick or viscous whereas fluid
having small resistance to flow known as thin or low in viscosity.
Bulk fluid is pictured to consist of a number of thin layers sliding each other
with area A, separated by fluid distance height H, pressed by a force F, resulting in the
movement of plate with velocity, V (Figure 1.12). Newtonian fluid flow is independent
on the shear rate which means the shear stress is proportional to shear strain rate (V/H),
with proportionality constant of dynamic viscosity [130]. Shear stress () is defined as
the amount of force applied to sample per unit area,
. Shear rate γ is defined as
velocity per unit height,
; Viscosity (η) is defined by:
(1)
The viscosity (η) of fluid, is the ratio of shear stress ( ) required to be applied to move
the solution at a resulting strain rate ( ) [130].
Figure 1.12: Illustration of viscosity quantification picturing a piece of liquid moving at
shear rate () under applied shear stress () adapted from reference [130].
D- Displacement
Stress = F/A
Strain =D/H
Strain rate = V/ H
γ
Force
Separation
Height, H
D
Velocity, V
V=D/time

Chapter 1 Introduction
25
1.5 Zeta Potential
Existence of electrical charges comprising of cations (positive charge) and
anions (negative charge) in liquid frequently causes unequal distribution of electrical
charges across interface creating potential gradient known as electrical double layer.
Electrical double layer model is used as a tool to visualize the ionic environment of a
charged colloid and the electrical repulsive force exerted on that system. When a
positively charged particle is suspended in a liquid, ions with opposite charges (counter-
ions) would be attracted to the surface of the charged particle and vice versa [82].
Ions closest to the surface of particle forms a layer of strongly bound inner
region known as Stern layer, further from the core lay layers of loosely bound ions
forming an outer region known as diffuse layer (Figure 1.13). Within the diffuse layer,
there is a notional boundary where particle mobility is related to the dielectric constant
and viscosity of suspending liquid to the electrical potential at the boundary (slip plane)
between moving particle and the liquid [130, 131].
The unequal distribution causes accumulation and formation of net charge at a
particular region balanced by an opposite net charge accumulated at another side
maintaining neutrality of electrical charges in the suspension [131, 132]. Consequently,
electrokinetic potential is generated giving rise to surface potential with voltage
difference in order of millivolts. Magnitude of surface potential decreases rapidly in the
Stern layer and reduces exponentially through diffuse layer and approaches zero at
imaginary boundary of the double layer. The potential at the slipping plane is called zeta
potential [132].

Chapter 1 Introduction
26
Figure 1.13: Illustration of stern model electrical double layer; distribution of counter-
ions in the vicinity of charged surface and variation of electrical potential with
increasing distance from charged surface adapted from reference [131].
(a) (b)
Figure 1.14: Illustration representing particle behaviour when exerted with (a) high zeta
potential and (b) low zeta potential; variation of free energy with particle separation in
suspension adapted from reference [133].
Zeta potential
Stern potential
Surface potential
Diffuse layer
Distance from charged surface 0
mV
-100
Slipping plane
Positive counter-ion
Negative co-ion
Stern layer
Electrical double layer
Particle with negative
surface charge
+ + + +
+
+
+ + +
+ + +
+
+
+ +
+
+ +
+ + + +
-
-
-
-
+
+ +
+ +
+
+

Chapter 1 Introduction
27
Zeta potential magnitude indicates stability and dispersion of the colloidal
system, where particle having large magnitude of zeta potential either large negative or
large positive would have a higher tendency to repel each other from flocculate as
compared to the lower magnitude of zeta potential (Figure 1.14). Generally, suspensions
achieve stability when they achieve zeta potential magnitude of more than ±30 mV
[133].
Electrophorestic mobility is obtained through measuring velocity of particle
moving at a fixed velocity in a voltage field by using Laser Doppler Velocimetry (LDV)
techniques [133]. Using parameters obtained and by knowing the viscosity and
dielectric constant of the sample, zeta potential can be determined by applying Henry
equation:
(2)
Where is zeta potential, UE is the electrophoretic mobility, ε is dielectric constant, η
viscosity and Henry’s function f (a) which is 1.0 or 1.5 [131-133].
Meanwhile, Smoluchowski approximation is used to calculate zeta potential of
suspension having particle larger than 0.2 microns dispersed in moderate electrolyte
concentration (10-3
molar salt) and f (a) of 1.5 [131-133].
Smoluchowski equation:
(3)
Where ζ is zeta potential, μ is the electrophoretic mobility, ε is electric permittivity and
η is the viscosity of liquid [133].

Chapter 1 Introduction
28
1.6 Rheology
The study of material reaction toward applied force is known to be rheology.
Rheology describes the flow of fluids and deformation of solids under stress and strain
[134] plays a significant role in evaluating the ability of material to perform efficiently
at a specific function and temperature in industrial applications [132]. Evolution of
rheometer leads to the invention of more sophisticated rheometers enabling
measurement of forces ranging from less than 1 mNm to more than 1 Nm with
temperature range of -150 °C to 300 °C [134].
Rheological measurement is used to characterize cosmetic products into
categories of creams, lotions and gels determined from the flow behaviour, yield point,
critical shear rate and onset of flow of the product [135]. Emulsion stability is governed
mostly by strength of interparticle interactions, hydrodynamic forces, volume fraction,
electrostatic forces, steric repulsion, Brownian motion, size and shape of interacting
particles in suspensions. By measuring rheology of emulsions, interaction of colloidal
substances undergoing destabilization processes such as flocculation, coalescence
resulting in undesired settling and separation of emulsions can be predicted [136].
(a) (b)
Figure 1.15: Illustration of (a) parallel plate; (b) cone and plate measuring system
adapted from reference [134].
Sample
R
M
PP
H Plate
Plate h
h Sample
CP
M
R
Plate
Cone

Chapter 1 Introduction
29
Cone and plate (CP), Figure 1.15 (b) measuring system is favourably used to
characterise emulsion system attributed to the sample viscosity, while parallel plate (PP)
Figure 1.15 (a) measuring system is applicable to solid and semi-solid system and
cylindrical system is used on sample with low viscosity [137]. Cone geometries are
modelled as a cone with tip pointing towards the bottom plate with cone angle of .
(4)
R is defined as radius, h, a variable plate gap and angular speed in the gap (h). For
small angle of , tan can be adjusted to be equal to resulting constant shear rate at
every point on the surface of the cone in CP model [136, 137].
(5)
Most materials possessed intermediate characteristic of fluid like (viscous) and
solid like (elastic) which is known as viscoelastic material. Solid or fluid material is
subjected to deformation with application of an external force. Deformation caused by
shear stress is permanent while elastic displacement which is the relative displacement
of material without destroying the cohesion of material withholding the ability to return
to its original form with removal of force. Force leading to deformation of sample is
defined by applied torque [137, 138].
Rheology of viscoelastic material can be described by a simple mechanical
model consisting of one dash pot and spring connected in series which is Maxwell
model type fluid flow behaviour (Figure 1.16). Ideal Maxwell like viscoelastic fluids
are characterized by semicircle shaped Cole-Cole plot represented by storage modulus
or elastic modulus, G’ and loss modulus or viscous modulus, G” [138, 139]. Phase
angle, tan δ is equivalent to tan-1
(G’/G”) and ranges from 0° to 90º (Figure 1.17). The
lower the phase angle value the more solid like is the material and vice versa. For phase
angle below 4º, G’ response is dominating G” response at all measured frequency, this

Chapter 1 Introduction
30
suggest that the elastic solid like behaviour dominates over the liquid like viscous
property. The coupling of low phase angle and linear increase in G’ indicates higher
degree of emulsion and longer life storage [139].
Figure 1.16: Maxwell model [10].
Figure 1.17: Plot of complex modulus G* [10].
Geometries rotating continuously in one direction deformed materials in a
steady measurement mode which run at a controlled shear stress or at variable shear
stress. Velocity and preset shear stress or strain obtained from the measurement is used
to calculate the dynamic viscosity. Dynamic measurement or oscillation measurement is
the application of oscillating shear stress or shear strain on sample in a rotational
sinusoidal system [140].
Figure 1.18: Diagram showing real time oscillation measurement of amplitude variation
performed at constant temperature and frequency (f).
Imagin
ary
axis
Real axis G’
G”
G*

Chapter 1 Introduction
31
Amplitude test or strain test would usually be subjected to initial sample testing
essential in determining linear viscoelastic region (LVR) where G’ modulus and G”
modulus are nearly parallel in the lower frequency range (Figure 1.18). Strain test is
conducted in small step increasing amplitude. G’ and G” would give a constant
response with increasing amplitude until a point where G’ would decrease dramatically
giving value lesser than G” indicating sample started to flow [141, 142].
Figure 1.19: Diagram showing real time frequency measurement with frequency
variation performed at constant temperature and strain ( ).
Figure 1.19 shows an example of frequency test conducted with increasing
frequency at a fixed temperature and strain determined from LVR. Frequency test was
performed after determining the LVR of sample, to ensure that the two measurements
are comparable and with the same boundary condition, as amplitude at the non-linear
region would yield different results in analysis producing unreliable results. In addition,
a rheometer has limitation when measured near the torque resolution with error of
100%, while the minimum required accuracy is expected to be less than 10%, therefore,
the frequency range must be limited appropriately to produce reliable results [140-142].

Chapter 1 Introduction
32
1.7 Objective of Studies
To study the stability of essential oil emulsion stabilized by glycolipid surfactants;
To study the particle size and zeta potential of essential oil emulsion;
To investigate the physical properties of essential oil emulsion through
rheological (elastic, viscoelastic and viscous) properties and microscopic analysis.

33
CHAPTER 2: MATERIALS AND METHODS

Chapter 2 Materials and Methods
34
2.1 Materials
Cosmetic grade essential oils, white Thyme oil (W306509), Tea tree oil
(W390208), Lavender oil 40/42% fluers (W262218) and Citronella oil (Java, natural,
85/35%; W230812) purchased from Sigma-Aldrich Sdn. Bhd. were used in emulsion
formulation. Barnstead Diamond Nanopure Water Purification unit connected to
Barnstead DiamondTM
RO unit from Barnstead International, Iowa USA producing
deionized water with resistivity of 18.2 cm-1
was used in water phase preparation of
emulsion system. Food grade Laleli extra virgin olive oil distributed by Thye Huat Chan
Sdn. Bhd. was used as oil base in emulsion formulation. Glycolipid surfactants
categorized as sucrose stearate, sucrose palmitate and sucrose myristate were obtained
from Mitsubishi-Kagaku Food Corporation. TritonTM
X-100 and TritonTM
X-45 used to
stabilise emulsion system were obtained from Sigma-Aldrich Sdn. Bhd. Ceteareth-20
supplied by KC Chemical (M) Sdn. Bhd. was used to increase the viscosity of emulsion
system. Sodium Chloride, NaCl used in zeta potential measurement is obtained from
R&M Chemicals.
2.2 Experimental Technique and Preparation
2.2.1 Emulsion preparation
Aqueous phase was prepared by solubilising 1.00 to 10.0 wt% of glycolipid
surfactants (SS, SP, SM) and 0.01 to 0.10 wt% of ceteareth-20 into 50 wt% of deionized
water per total volume. Vortex mixing and ultrasonication were applied on mixtures for
2 minutes respectively followed by heating at 60 °C in a water bath until a colourless
clear gel phase was obtained. Oil phase was prepared by mixing solution of 12.5 wt% of

Chapter 2 Materials and Methods
35
essential oil, 0.001 to 0.010 wt% TritonTM
X-100 and TritonTM
X-45 per total volume of
emulsion; ratio of TritonTM
X-100 to TritonTM
X-45 used varies according to the type of
essential oil used. Oil phase was transferred into aqueous phase and homogenized at
13,000 rpm for 10 minutes with SilentCrusherM Homogenizer Heidolph Instrument,
Germany. Emulsion formed as then transferred and kept in an incubator of 45.0±0.1 °C
subjected to accelerating ageing process. Stability of emulsion is determined from
observing emulsion’s physical changes for a period of 30 days involving instability and
separation of emulsion into oil and aqueous phases.
2.3 Instrumentation
2.3.1 Viscometer
LAUDA Processor viscosity measuring system PVS connected over a personal
computer as a central control unit managing viscosity measuring autonomous functional
unit was used to measure viscosity of essential oil, carrier oil and mixture of essential
oil. Automated kinematic viscosities determination was carried out using standardised
capillary viscometers with optimum adaptation to the requirement of application with
respect to sample. All measurements were carried out at a regulated temperature of
30.0±0.1 °C.

Chapter 2 Materials and Methods
36
2.3.2 GC-MS
Gas chromatography (GC) coupled with mass spectrometry (MS) instruments
(GC-MS, model QP-2010 Shimadzu, Japan) was used in analysis of compositions of
essential oils. Thyme and tea tree were diluted 1:100 (v/v) with methanol, while
lavender oil and citronella were diluted 1:100 (v/v) with hexane. 1.0 L of diluted
samples was automatically injected in splitless mode to SGE BPX 5 capillary column
(30.0 m, 0.25 mm i.d., 0.25 m film thickness with carrier gas of helium at a flow rate
of 1 mL min-1
). Injector and detector temperatures were set at 250 °C and 280 °C
respectively. Column temperature was set to 60 °C for 5 minutes, then gradually
increased to 160 °C at 4 °C min-1
and finally increased to 270 °C at 15 °C min-1
. GC
peaks were identified by comparing fragmentation pattern of MS with those reported in
the literature and reference compound available [143].
2.3.3 Polarizing Microscope
Light polarizing microscope from Leica model PM RXP by Leica Microsystems
GmbH, Germany was used to observe the emulsion droplets formed. Polarizing
microscope unit was equipped with a high voltage beam, polarizing unit and a JVC
Color Video camera with model KY F550, interfaced with personal computer with
Leica QWin image analysis software. Leica QWin software is a powerful tool used in
digital images capturing with capability of measuring and analysis of droplet size of
sample. Observation of changes in droplet size and appearance of emulsion has been
made for 30 days.

Chapter 2 Materials and Methods
37
2.3.4 Zetasizer
Emulsion samples of 0.001 wt% are dissolved in 25 ml of 0.0001 mol dm-3
NaCl, the solutions was equilibrated at a constant temperature of 30.0±0.1 °C in a water
bath. The sample was then filled up into a cuvette and inserted into the Malvern
Zetasizer Nano Series (Malvern Instruments, UK). Zeta potential measurement was
carried out consecutively on the 1st, 3
rd, 7
th, 14
th and 30
th days of emulsion prepared.
Smoluchowski approximation was applied in the calculation of zeta potential as
emulsion was dispersed in moderate electrolytes concentration of more than 10-3
molar
salt and droplet size greater than 0.2 microns and f(a) is 1.5 [131-133].
2.3.5 Rheometer
Rheological evaluation was carried out on essential oil emulsion prepared for 1st,
3rd
, 7th
, 14th
and 30th
days by using Bohlin CVO-R Rheometer GerminiTM
, Malvern
Instrument UK with temperature regulator of Peltier Plate system (-40 °C to 180 °C,
from Bohlin Instrument Ltd.) [10]. Rheometer system consists of a triple-mode control
which allows strain, stress or shear rate controlled measurement to be performed by
using a single test station. A built-in normal force sensor is used for ranges of
measurement, gap control and sample loading protocols enabling fine measurement of
deformations, speeds and viscoelastic responses of material. Bohlin CVO-R Rheometer
GerminiTM
was optimized for strain controlled and stress controlled operation with
extensive range of temperature control options broadening the applications in product
development [10, 131, 133]. All measurements were conducted at a constant
temperature of 30.0±0.1 °C, using cone and plate (CP 4/40, cone diameter of 40 mm, 4
angle and gap width of 0.150 mm) geometry. Steady dynamic viscosity tests were

Chapter 2 Materials and Methods
38
carried out at a controlled increasing shear rate, ranging from 0.0001 to 70 s-1
to
determine viscosity η, of samples, while the corresponding shear stress were
measured. Amplitude sweep was performed prior to frequency sweep to ensure both test
were in the same boundary condition ensuring reliability of data. Amplitude sweep was
performed at a controlled strain mode ranging from 0.0009 to 0.8 units with a frequency
of 0.5 Hz. As for frequency sweep, storage modulus G’ and loss modulus, G” were
measured as a function of frequency varied from 0.001 to 10 Hz.

39
CHAPTER 3: RESULTS AND DISCUSSIONS

Chapter 3 Results and Discussions
40
3.1 Viscosities and Densities of Oil
Viscosity measurements were carried out on several types of olive oil and
essential oils by using automated LAUDA PVS measuring system at temperature of
30.0±0.1 °C. Viscosity of liquid is a measurement of friction of liquid molecules sliding
past each other, which gives the numerical information of fluids resistance to flow [144,
145]. Dynamic viscosity (absolute viscosity) is a ratio of applied shear stress to
resulting strain rate, implementing the amount of shear stress applied to move liquid at a
particular strain rate expressed in centipoise (cP) or S.I. unit mPa s. Kinematic viscosity
was determined by assessing the flow time of a known volume of fluid flowing through
calibrated capillary tube (Ubbelohde viscometer) at controlled temperature [129].
Kinematic viscosity is the product of measured flow time and calibration constant of the
viscometer expressed in centistokes (cSt.) or S.I. unit mm2 s
-1 [145]. The kinematic and
dynamic viscosities are related as follows:
(6)
where, ν is the kinematic viscosity, η is the dynamic viscosity, and ρ is the density [144,
145].
Table 3.1: Measurements of viscosity and density of olive.
No. Sample
(Olive oil)
Kinematic
Viscosity
102 (±0.005
mm2
s-1
)
Density
(±0.001
g cm-3
)
S.G
(±0.001)
Dynamic
Viscosity
10 (±0.005
mPa s)
1. Olive oil, Fluka (75357) 0.597 0.906 0.910 0.541
2. Olive oil, Highly refined
Sigma-Aldrich, (O1514) 0.599 0.908 0.912 0.544
3. Extra virgin olive oil,
Laleli 0.559 0.906 0.910 0.507
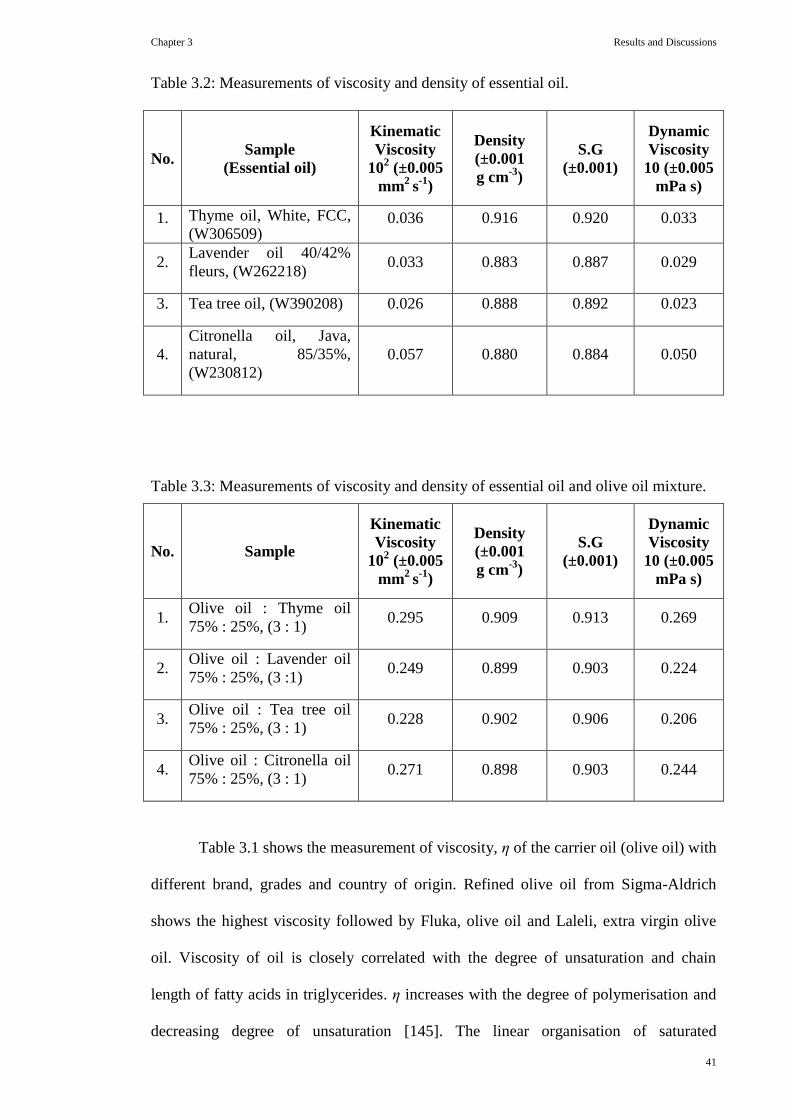
Chapter 3 Results and Discussions
41
Table 3.2: Measurements of viscosity and density of essential oil.
No. Sample
(Essential oil)
Kinematic
Viscosity
102 (±0.005
mm2
s-1
)
Density
(±0.001
g cm-3
)
S.G
(±0.001)
Dynamic
Viscosity
10 (±0.005
mPa s)
1. Thyme oil, White, FCC,
(W306509) 0.036 0.916 0.920 0.033
2. Lavender oil 40/42%
fleurs, (W262218) 0.033 0.883 0.887 0.029
3. Tea tree oil, (W390208) 0.026 0.888 0.892 0.023
4.
Citronella oil, Java,
natural, 85/35%,
(W230812)
0.057 0.880 0.884 0.050
Table 3.3: Measurements of viscosity and density of essential oil and olive oil mixture.
No. Sample
Kinematic
Viscosity
102 (±0.005
mm2
s-1
)
Density
(±0.001
g cm-3
)
S.G
(±0.001)
Dynamic
Viscosity
10 (±0.005
mPa s)
1. Olive oil : Thyme oil
75% : 25%, (3 : 1) 0.295 0.909 0.913 0.269
2. Olive oil : Lavender oil
75% : 25%, (3 :1) 0.249 0.899 0.903 0.224
3. Olive oil : Tea tree oil
75% : 25%, (3 : 1) 0.228 0.902 0.906 0.206
4. Olive oil : Citronella oil
75% : 25%, (3 : 1) 0.271 0.898 0.903 0.244
Table 3.1 shows the measurement of viscosity, η of the carrier oil (olive oil) with
different brand, grades and country of origin. Refined olive oil from Sigma-Aldrich
shows the highest viscosity followed by Fluka, olive oil and Laleli, extra virgin olive
oil. Viscosity of oil is closely correlated with the degree of unsaturation and chain
length of fatty acids in triglycerides. η increases with the degree of polymerisation and
decreasing degree of unsaturation [145]. The linear organisation of saturated

Chapter 3 Results and Discussions
42
hydrocarbon enables the fatty acid chains to be lined up closely having van der Waals
inter-particle interactions and reducing the flowability resulting in high oil η.
Meanwhile, unsaturated fatty acid having a double bond arranged in cis configuration
forming a ‘bent’ structure, preventing packing of lipid chain overall reducing the inter-
particle contacts consequently increases the capability to flow with decreasing η [146].
Extra virgin olive oil has the lowest η, suggesting a lower degree of
polymerisation and presence of higher number of unsaturated fatty acids. Refined oil
was chemically treated and refined from virgin olive oil, therefore possesses higher
number of saturated fatty acid chain causing higher η. Olive oil having intermediate η
was a blend of virgin olive oil and refined oil [147]. Although higher viscosity oil
possessed greater affinity in emulsion formation, but due to safety reason, nutritional
value and environmental issue, food grade extra virgin olive oil categorized as the
highest quality of olive oil was selected as the carrier oil base for this project [11, 12].
Essential oil varies in viscosity and density depending on the chemical
component such as short chain phenolic compound, terpenes, terpenoids esters, ethers
and alcohols which are present in the extract (Table 3.2) [147, 148]. Viscosity of the
essential oils is relatively lower than the viscosity of the olive oil by 10 fold, hence, by
mixing the oil component, the overall η of mixture increases and causes emulsion
formations to be more viable (Table 3.2 and Table 3.3) [148].
By referring to Table 3.3, thyme oil mixtures (0.269±0.005)10 mPa s displays
the highest dynamic viscosity value followed by citronella oil mixture
(0.244±0.005)10 mPa s, lavender oil mixture (0.224±0.005)10 mPa s and tea tree oil
mixture (0.206±0.005)10 mPa s. Since phenol group of molecule is a stronger organic
acid than ketones, esters, ethers and etc., formation of hydrogen bond is more viable and
readily available [148]. Thyme oil consists mainly of phenolic monoterpenes [149],
therefore they possess the highest interaction with fatty acid from carrier oil through

Chapter 3 Results and Discussions
43
formation of hydrogen bonding which eventually increases the resistivity of flow and η
of the mixtures.
Citronella oil consists mostly of short chain hydrocarbon compounds comprises
of monoterpenes, hydrocarbons, ketones, aldehyde and esters (neral and geranial) [19],
suggesting lower resistance compared to thyme oil due to lower entanglement of
compound mixture. Citronella oil contains more oxygen groups and unsaturated
hydrocarbon than tea tree oil which is made up of more than 70% of terpineol-4-ol, γ-
terpinene and α-terpinene [55]. Oxygen groups and unsaturated double bond promotes
formation of hydrogen bonding between carrier oil and essential oil [148]. Therefore, it
possesses higher dynamic viscosity than those of tea tree oil and lavender oil.
3.2 Essential Oil Emulsion System
Using 100% of essential oil in oil phase of emulsion formulation causes
emulsion droplet formed to be inverted as shown in Figure 3.2 (b). Initially, lipid tail of
glycolipid surfactants were being arranged in a manner where they surround an oil core
forming emulsion system with oil droplet suspended in aqueous phase (o/w) as in
illustration Figure 3.2 (a). Short chain, bulky hydrocarbon molecule from essential oils
(eg. p-cymene, -caryophyllene, thymol, and terpinen-4-ol) shows incompatibility with
long chain glycolipid surfactant, as the molecules could not accommodate the long lipid
tail of surfactant causing high steric repulsion between lipid tails in emulsion droplet.
This, forces lipid tail to emerge out to the surrounding reservoir in order to reduce steric
forces resulting in spontaneous rearrangement of glycolipid surfactants, inverting
emulsion droplet forming w/o emulsion when external force was being removed from
the system.

Chapter 3 Results and Discussions
44
Table 3.4: Compositions of essential oils (%) from thyme, lavender, tea tree and
citronella by using GC-MS.
Component Composition (%)
Thyme Lavender Tea Tree Citronella
Hydrocarbons
-pinene 1.64 0.93 3.33 -
-terpinene 0.16 - 3.88 3.71
p-Cymene 25.91 - 1.35 -
-Terpinene 9.41 - 5.27 0.72
-caryophyllene - 5.45 3.63 6.37
-cis ocimene - 5.82 - -
Terpinolene - - 1.09 -
Limonene - - 0.64 7.98
Germancrene- - - - 1.14
Alcohols
Linalool 9.41 31.37 - 2.56
Borneol 2.16 2.69 - 1.33
Terpinen-4-ol 2.24 6.15 59.74 -
-terpineol 2.53 2.53 8.95 0.72
-Citronellol - - - 16.68
Nerol - - - 21.43
ethers and ketones
1,8-cineole - 5.15 2.32 -
Camphor 0.90 - -
Geraniol - 4.04 - 0.88
(R)-(+)- Citronellal - - - 26.08
Phenols
Thymol 38.53 - - -
Carvacrol 1.20 - - -
Esters
Linalyl acetate - 24.56 - -
Lavandulol acetate - 2.96 - -
Geranyl acetate - - - 5.13
Neryl acetate - - - 1.44
Others 5.91 8.35 9.8 4.13
Total 100 100 100 100

Chapter 3 Results and Discussions
45
Figure 3.1: Molecular structures of major chemical compounds present in thyme oil [19,
150, 151].
(a) (b)
Figure 3.2: Illustrations of emulsion droplet formation, (a) initial o/w emulsion system
and (b) inversion of emulsion droplet, w/o emulsion system.
To overcome this problem, a carrier oil which acts as a medium having long
lipid tail compensating the short chain molecule of essential oils was being introduced
into the emulsion system. Carrier oil acts as diluents of essential oils, diluting the
concentration of essential oil and increasing the viscosity of oil mixture and promoting
emulsion formation. Food grade Laleli selection extra virgin cold pressed olive oil has
been selected as the carrier oil for this emulsion system. Extra virgin olive oil was
selected due to the presence of monounsaturated and polyunsaturated fatty acid [152]
Water
Oil
Water
Oil
Thymol p-Cymene Carvacrol -Terpinene

Chapter 3 Results and Discussions
46
with major component constituted of oleic acid [153]. Presence of long chain fatty acids
aids the formation of essential oil emulsion by creating medium in allocating glycolipid
surfactants which overall reduces the steric repulsion between lipid tails. Hence,
stabilizing the emulsion droplet and preventing inversion of emulsion droplets.
Addition of co-surfactant such as TritonTM
X-100 and TritonTM
X-45 possesses
structure compatibility with phenolic group which is present in essential oil giving rise
to greater interaction between the molecules. Having a shorter chain length, TritonTM
X-45 has a higher compatibility with shorter chain terpenes present in essential oil.
Apart from that, ether tails of TritonTM
X-100 envelopes the oil droplet in oil phase
which increases the solubility of the oil phase in water further enhancing the formation
of essential oil emulsion [97].
However, due to the short side chain of essential oil molecule, emulsion formed
appeared to be low in viscosity even though supporting material such as carrier oil,
surfactant and co-surfactant have been added into the system. Hence, ceteareth-20 is
selected as an additive to increase the viscosity of the emulsion formed. Long lipid tail
of ceteareth-20 increases viscosity of emulsion by creating resistance and lowering the
chances of emulsion droplet from sliding through each other [98]. Increased viscosity
induces kinetic stability of suspension by slowing down the rate of sedimentation and
particle aggregation. Presence of ether group provides structural compatibility and
formation of hydrogen bonding between the oil group increases viscosity of the
emulsion [98, 99]. Addition of ceteareth-20 into the emulsion system stabilizes the
emulsion system formed up to 30 days of storage.

Chapter 3 Results and Discussions
47
3.3 Dispersed Phase of Emulsion System
Figure 3.3: Illustration of emulsions droplets dispersed in continuous phase.
Emulsion system dispersed phase was determined by using dye solubility test
[154]. This test was conducted to determine the dispersing medium or continuous phase
of the emulsion and identification of emulsion system which is either o/w or w/o
system. Two types of dyes were selected in this experiments, the dye selected was of
opposite nature; soluble only in aqueous phase or oil phase. Sudan IV, an oil soluble
dye and crystal violet, water soluble dye were selected in the test [155-157].
(a) (b)
Figure 3.4: Molecular structure of (a) Sudan IV and (b) crystal violet [156, 157].
Dispersed Medium
Dispersed Droplet

Chapter 3 Results and Discussions
48
(a) (b)
Figure 3.5: Solubility of Sudan IV in (a) oil medium and, (b) aqueous medium.
(a) (b)
Figure 3.6: Solubility test of crystal violet in (a) oil medium and, (b) aqueous medium.

Chapter 3 Results and Discussions
49
Figure 3.5 proves that Sudan IV was an oil soluble dye as they dissolve in oil
medium to give a red solution. Figure 3.6 shows the diagram of crystal violet observed
to dissolve only in water to give violet solutions. Sudan IV and crystal violet remain as
solid particles undissolved in water and oil medium respectively. Continuous phase of
emulsion was determined by mixing dye into the emulsion, the solubilised dye in
dispersed medium would give information on the nature of emulsion system, either o/w
or w/o emulsion system. Sudan IV and crystal violet were added into the emulsion
system in three different ways; (a) dissolved dye added into emulsion, (b) addition of
solid dye without stirring and (c) addition of solid dye with stirring.
(a) (b) (c)
Figure 3.7: Diagram showing Sudan IV in emulsion with addition of (a) solubilised
Sudan IV in oil (b) solid Sudan IV without stirring and (c) solid Sudan IV with stirring.
(a) (b) (c)
Figure 3.8: Diagram showing crystal violet in emulsion with addition of (a) solubilised
crystal violet in water, (b) solid crystal violet without stirring and (c) solid crystal violet
with stirring.

Chapter 3 Results and Discussions
50
Results show that the drop of Sudan IV dye does not show sign of spreading,
Figure 3.7 (a) suggesting that the dispersed phase of the emulsion is not an oil base.
Further testing is carried out on the emulsion by addition of Sudan IV solid directly to
the emulsion without stirring Figure 3.7 (b), and with stirring Figure 3.7 (c). Both of the
tests show no sign of spreading and solubility of the dye. Hence, the dispersed medium
of the emulsion system is not an oil base system.
Figure 3.8 (a), show the spreading of crystal violet solutions in emulsion
implying that the dye can be dispersed into the continuous phase suggesting that the
dispersing medium was water. Figure 3.8 (b) shows solid crystal violet dyes being
added directly without stirring, Figure 3.8 (c) with the aid of stirring. Crystal violet was
observed to dispersed, distribute and dissolves in the continuous phase of the emulsion
which further validate water to be the dispersed medium of emulsion, concluding
essential oil emulsion is an o/w emulsion system.
3.4 Stability Test
A series of stability test had been carried out on essential oil in emulsion by
varying parameters such as concentration of glycolipid surfactants, oil to water ratio and
concentration of co-surfactants (TritonTM
X-45, TritonTM
X-100 and ceteareth-20).
Essential oil emulsion has been subjected to accelerated ageing process at 45.0±0.1 ºC
and observation on destabilization of emulsion by phase separation has been carried out
for the duration of 30 days, greater phase separation suggests that emulsion system is
prone to destabilization process, having lower integrity and shorter shelf-life.

Chapter 3 Results and Discussions
51
3.4.1 Stability Test of Thyme Essential Oil Emulsion
Figure 3.9: Accelerated test of emulsions at 45.0±0.1 ºC, 12.5 wt% thyme oil, o:w =
1:1; variation of 1-10 wt% sucrose palmitate glycolipid surfactants.
Figure 3.9 is showing phase separation of thyme essential oil emulsion with
varying surfactant concentration. All emulsions show nearly equal phase separation
except for 1 wt% and 2 wt% SP surfactant emulsions. Emulsion formations was greatly
affected by the amount of surfactant blended into the system, insufficient amount of
surfactant used would cause ineffectiveness of emulsion formation. While large amount
of surfactant added would cause wastage and saturation of surfactant. Therefore, a
system with 5 wt% of glycolipid surfactant was selected as optimum for further
formulation.
Figure 3.10: Accelerated test of emulsions at 45.0±0.1 ºC, 12.5 wt% thyme oil, 5 wt%
SP; variation of oil percentage in total volume of emulsions from 10% to 90%.

Chapter 3 Results and Discussions
52
Ease of formation of emulsion increases with increased oil fraction in the
emulsion system until o:w = 8:2 and o:w = 9:1 (Figure 3.10). Emulsion formed from
80 wt% and 90 wt% of oil was not sustainable as emulsion would be reverted to oil and
aqueous phase giving a full phase separation. Therefore, emulsion system which have a
balance of oil to water ratio of 1:1 with 50 wt% oil in total volume of emulsion was
chosen as optimum o:w ratio for essential oil emulsion system. Emulsion with o:w ratio
of 1:1 forms relatively high emulsion fraction compared to those of lower oil percentage
and possessed higher stability over emulsions with high oil fractions.
Figure 3.11: Accelerated test of emulsions at 45.0±0.1 ºC, 12.5 wt% thyme oil, 5 wt%
SP, o:w = 1:1; variation of 0.006-0.0074 wt% TritonTM
X-100.
TritonTM
X-100 which is structurally compatible with essential oil, emulsion
containing 0.007 wt% of TritonTM
X-100 presents the highest emulsion fraction which
was sustainable up to 30 days of storage (Figure 3.11). Figure 3.12 shows stability of
emulsion formed with 0.1-0.5 wt% of ceteareth-20. With the aid of ceteareth-20,
stability has been greatly enhanced with increased in continuous phase viscosity which
results in kinetic stability of emulsion [158]. Formula of thyme essential oil was
determined to be 5 wt% of glycolipid surfactant, 12.5 wt% of thyme oil in total volume
of emulsion, o:w ratio of 1:1, 0.007 wt% of TritonTM
X-100 and 0.2 wt% of ceteareth-
20.

Chapter 3 Results and Discussions
53
(a)
(b)
(c)
Figure 3.12: Accelerated test of emulsions at 45.0±0.1 ºC, 12.5 wt% thyme oil, o:w =
1:1, 0.007 wt% TritonTM
X-100; variation of 0.1-1.0 wt% Ceteareth-20 for 5 wt% (a)
SS, (b) SP, (c) SM.

Chapter 3 Results and Discussions
54
3.4.2 Stability Test of Lavender Essential Oil Emulsion
Figure 3.13: Accelerated test of emulsions at 45.0±0.1 ºC, 12.5 wt% lavender oil, 5 wt%
SP, o:w = 1:1, 0.002 wt% TritonTM
X-100, 0.2 wt% ceteareth-20; variation of 0.005-
0.010 wt% TritonTM
X-45.
Subsequent essential oil formulation was regulated with respect to the thyme
emulsion formula, retaining parameters such as o:w ratio (1:1) and the amount of
glycolipid surfactants (5 wt%). Lavender oil, comprises mostly of terpenes and
terpenoids [34, 35] and they form weaker interactions with fatty acids present in carrier
oil as formation of hydrogen bond was not viable as compared to phenolic compound
found in thyme oil. Therefore, TritonTM
X-45 having a shorter lipid tail was added to
create greater interaction with short chain hydrocarbons of lavender oil, resulting in
greater van der Waals interactions, increasing the viscosity of the oil phase,
consequently forming stable emulsion. Figure 3.13 shows enhanced emulsion formation
with increasing amount of TritonTM
X-45 from 0.005-0.010 wt% with 0.010 wt%
TritonTM
X-45 providing the highest emulsion fractions over 30 days of observation.
Figure 3.14 shows 0.1-0.6 wt% of ceteareth-20 in emulsion which shows a slight
decrease of emulsion fractions starting from 7th
day till 30th
day and 0.7-1.0 wt%
ceteareth-20 in emulsion show improve viscosity and stability of emulsion. Formulation
with 12.5 wt% Lavender oil, o:w = 1:1, 0.010 wt% TritonTM
X-45, 0.002 wt% TritonTM
X-100, and 0.7 wt% ceteareth-20 shows promising emulsion formation sustainable up
to 30 days of storage.

Chapter 3 Results and Discussions
55
(a)
(b)
(c)
Figure 3.14: Accelerated test of emulsions at 45.0±0.1 ºC, 12.5 wt% lavender oil, o:w =
1:1, 0.010 wt% TritonTM
X-45, 0.002 wt% TritonTM
X-100; variation of 0.1-1.0 wt%
ceteareth-20 for 5 wt% (a) SS, (b) SP, (c) SM.

Chapter 3 Results and Discussions
56
3.4.3 Stability Test of Tea Tree Essential Oil Emulsion
Figure 3.15: Accelerated test of emulsions at 45.0±0.1 ºC, 12.5 wt% tea tree oil, 5 wt%
SP, o:w = 1:1, 0.004 wt% TritonTM
X-100, 0.2 wt% ceteareth-20; variation of 0.005-
0.010 wt% TritonTM
X-45.
Tea tree oil shows greater interaction with carrier oil as they consist mostly of
terpenes and tertiary alcohol [43-45] withholding the ability to form hydrogen bonding
displaying higher emulsion fractions with 0.009-0.010 wt% TritonTM
X-45 (Figure 3.15)
requiring 0.004 wt% of TritonTM
X-100 to stabilise the system. Although, 0.010 wt%
TritonTM
X-45 displayed high emulsion fraction for both SS and SP, but SM was
destabilized at 14th
day after formation (Figure 3.16). Overall, emulsion formed from
0.010 wt% TritonTM
X-45 exhibits lower value of emulsion fraction than that of 0.009
wt% TritonTM
X-45.
Emulsion fractions were recorded high for emulsion with 0.009 wt% TritonTM
X-45 for all the glycolipid surfactants used with minor destabilization experienced by
SM emulsion. SM emulsion shows decreasing emulsion fractions from 0.1-0.5 wt%
ceteareth-20 with greatest separation at 0.5 wt% ceteareth-20. Therefore, the most
favourable emulsion formula obtained for tea tree emulsion was 12.5 wt% tea tree oil,
o:w = 1:1, 0.009 wt% TritonTM
X-45, 0.004 wt% TritonTM
X-100 and 0.2 ceteareth-20.

Chapter 3 Results and Discussions
57
(a)
(b)
(c)
Figure 3.16: Accelerated test of emulsions at 45.0±0.1 ºC, 12.5 wt% tea tree oil, o:w =
1:1, 0.010 wt% TritonTM
X-45, 0.004 wt% TritonTM
X-100; variation of 0.1-0.5 wt%
ceteareth-20 for 5 wt% (a) SS (b) SP and (c) SM.

Chapter 3 Results and Discussions
58
(a)
(b)
(c)
Figure 3.17: Accelerated test of emulsions at 45.0±0.1 ºC, 12.5 wt% tea tree oil, o:w =
1:1, 0.009 wt% TritonTM
X-45, 0.004 wt% TritonTM
X-100; variation of 0.1-0.5 wt%
ceteareth-20 for 5 wt% (a) SS (b) SP and (c) SM.
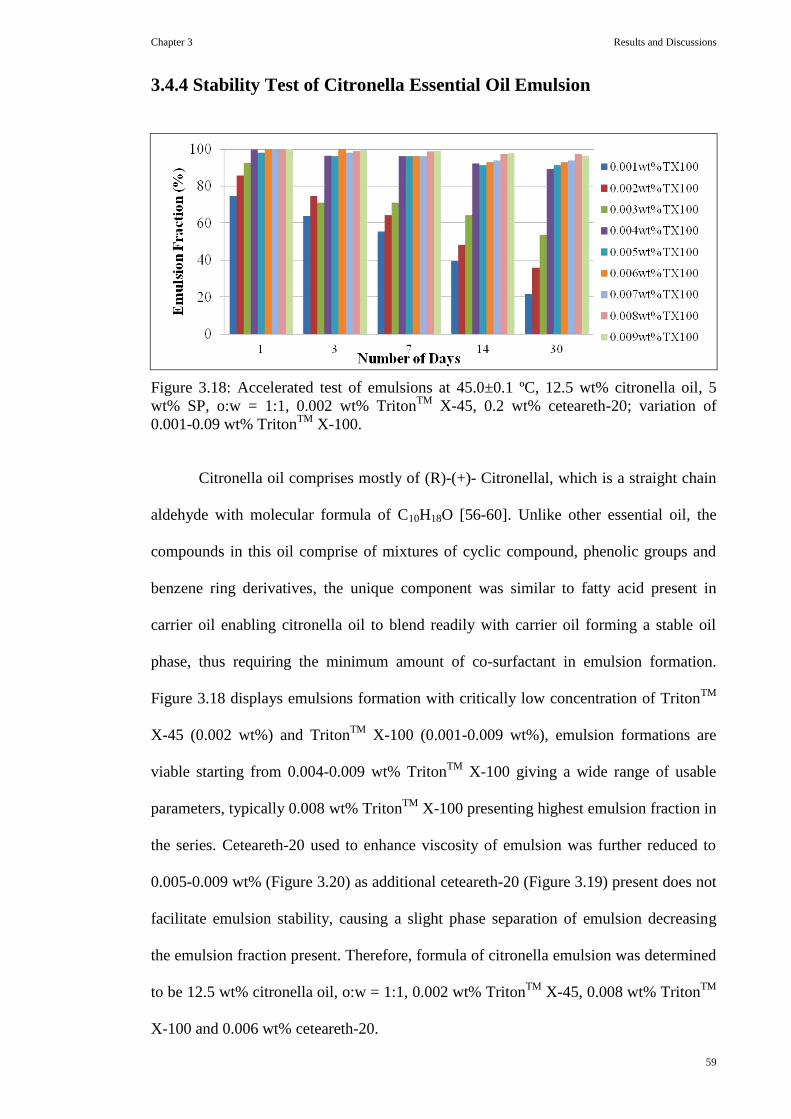
Chapter 3 Results and Discussions
59
3.4.4 Stability Test of Citronella Essential Oil Emulsion
Figure 3.18: Accelerated test of emulsions at 45.0±0.1 ºC, 12.5 wt% citronella oil, 5
wt% SP, o:w = 1:1, 0.002 wt% TritonTM
X-45, 0.2 wt% ceteareth-20; variation of
0.001-0.09 wt% TritonTM
X-100.
Citronella oil comprises mostly of (R)-(+)- Citronellal, which is a straight chain
aldehyde with molecular formula of C10H18O [56-60]. Unlike other essential oil, the
compounds in this oil comprise of mixtures of cyclic compound, phenolic groups and
benzene ring derivatives, the unique component was similar to fatty acid present in
carrier oil enabling citronella oil to blend readily with carrier oil forming a stable oil
phase, thus requiring the minimum amount of co-surfactant in emulsion formation.
Figure 3.18 displays emulsions formation with critically low concentration of TritonTM
X-45 (0.002 wt%) and TritonTM
X-100 (0.001-0.009 wt%), emulsion formations are
viable starting from 0.004-0.009 wt% TritonTM
X-100 giving a wide range of usable
parameters, typically 0.008 wt% TritonTM
X-100 presenting highest emulsion fraction in
the series. Ceteareth-20 used to enhance viscosity of emulsion was further reduced to
0.005-0.009 wt% (Figure 3.20) as additional ceteareth-20 (Figure 3.19) present does not
facilitate emulsion stability, causing a slight phase separation of emulsion decreasing
the emulsion fraction present. Therefore, formula of citronella emulsion was determined
to be 12.5 wt% citronella oil, o:w = 1:1, 0.002 wt% TritonTM
X-45, 0.008 wt% TritonTM
X-100 and 0.006 wt% ceteareth-20.

Chapter 3 Results and Discussions
60
(a)
(b)
(c)
Figure 3.19: Accelerated test of emulsions at 45.0±0.1 ºC, 12.5 wt% citronella oil, o:w =
1:1, 0.002 wt% TritonTM
X-45, 0.008 wt% TritonTM
X-100; variation of 0.1-0.5 wt%
ceteareth-20 for 5 wt% (a) SS (b) SP and (c) SM.
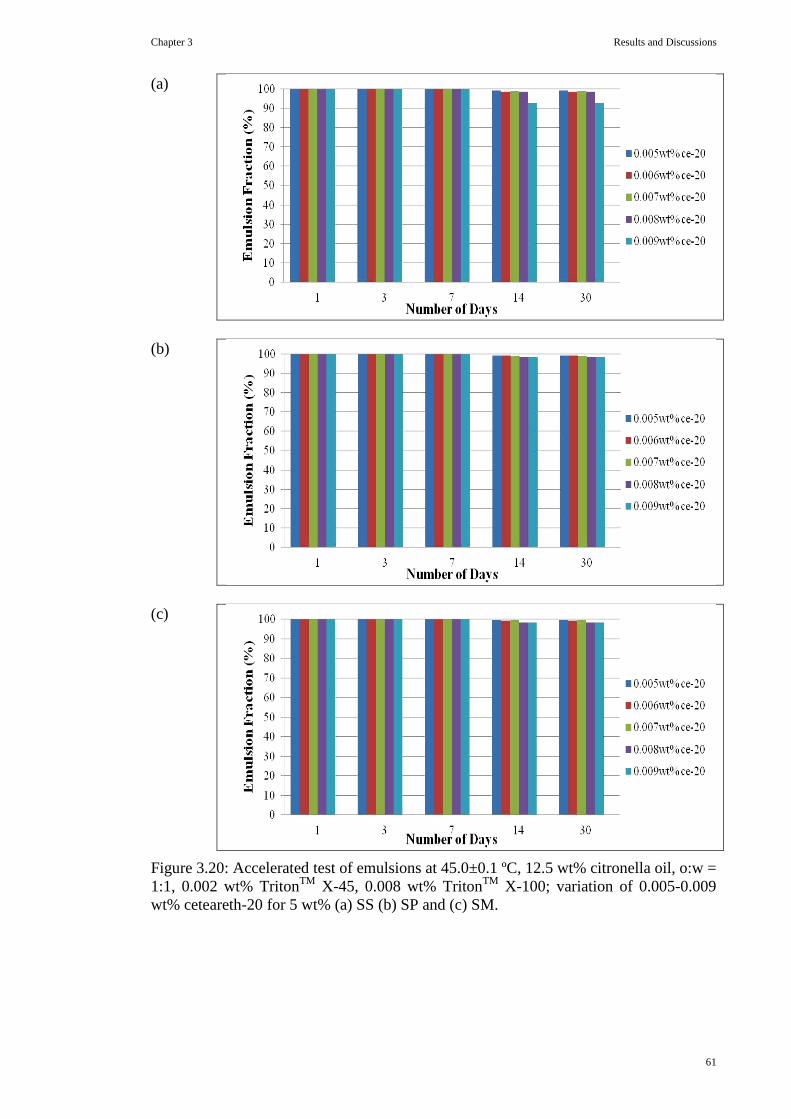
Chapter 3 Results and Discussions
61
(a)
(b)
(c)
Figure 3.20: Accelerated test of emulsions at 45.0±0.1 ºC, 12.5 wt% citronella oil, o:w =
1:1, 0.002 wt% TritonTM
X-45, 0.008 wt% TritonTM
X-100; variation of 0.005-0.009
wt% ceteareth-20 for 5 wt% (a) SS (b) SP and (c) SM.
Chapter 3 Results and Discussions
62
3.5 Light Micrograph, Mean Droplet Size and Zeta Potential
Analysis of Essential Oil Emulsions
Emulsion stability was a major concern as the suspension stability exerted a
great impact on the suspension ability to be practically functional and the capability to
resist destabilization throughout the lifetime of the product. Emulsion systems are
typical thermodynamically unstable system, the colloidal suspension undergoes
separation of dispersed phase from continuous phase over a period of time through
kinetic or thermodynamic destabilization [159] for example, viscosity of continuous
phase govern the kinetic stability while steric and electrostatic stabilization endorsed
stability through particle repulsion [144]. Therefore, a series of measurement of light
micrograph analysis, mean droplet size and zeta potential had been carried out to
evaluate the stability of essential oil emulsions over time.
Visual observation on emulsion morphology has been carried out by using light
polarizing microscope from Leica model DM RXP capturing micrograph of essential oil
emulsions as in Figure 3.21. All captured micrograph show a continuous, small droplet
and polydispersed emulsions formed within essential oil emulsion system. Due to the
minute droplet observed, quantitative measurement of mean droplet size by using
micrograph was not feasible. Therefore, light scattering measurement of droplet size
distributions was carried out [160-162] by using Malvern Zetasizer Nano ZS. The
system determines size by measuring Brownian motion of particles in sample using
Dynamic Light Scattering (DLS) and interpreting size from establish theories [131].
Brownian motion causes emulsion droplets to move randomly and continuously
colliding with each other which increases the chance of aggregation. Since, the density
between dispersed phase and continuous phase was significantly sizable, gravitational
forces play an important role in determining droplet stability. A stable system would be

Chapter 3 Results and Discussions
63
expected if the ratio of equation 7 was less than unity, while sedimentation would occur
if the ratio was greater than unity. Van der Waals attractive forces set additional factor
leading to formation of flocculates with larger droplet size which was greatly influenced
by gravitational force causing settling of emulsion [131].
Ratio of gravitational to Brownian forces:
(7)
Where a, is the parcel radius, is the density difference between dispersed and
continuous phases, g is acceleration due to gravity, is the Boltzmann constant and T
is temperature [132, 163].
Malvern Zetasizer Nano ZS was also used in the measurement of zeta potential
which is the potential at the slipping plane between the particle surface and associated
double layer with surrounding solvent [164, 165]. Anionic glycolipid surfactants were
used in the emulsion therefore producing negatively charged zeta potential value.
Droplets having greater zeta potential value will experience greater repulsion and hence
decreases the tendency of droplet coming close to each other to flocculate which
increases the stability of the emulsions systems [80, 99, 166].

Chapter 3 Results and Discussions
64
3.5.1 Morphology, Particle Size and Zeta Potential Analysis of Thyme
Essential Oil Emulsion
(a)
(b)
(c)
Figure 3.21: Light micrograph of thyme oil emulsions stabilized by glycolipid
surfactants of (a) SS (b) SP, (c) SM. The micrograph was captured after one day of
storage at temperature of 45.0±0.1 ºC.

Chapter 3 Results and Discussions
65
(a)
(b)
(c)
Figure 3.22: The measurements of (a) mean droplet size (b) polydispersity index and (c)
zeta potential of thyme essential oil emulsions stabilized by glycolipid surfactants taken
for duration of 30 days.
0 5 10 15 20 25 30
0
1
2
3
4
5
Mea
n D
rop
let
Siz
e d
,(
m)
Days of Obsevation
SS
SP
SM
0 5 10 15 20 25 30
0.1
0.2
0.3
0.4
0.5
0.6
0.7
0.8
0.9
Po
lyd
isp
ersi
ty I
nd
ex
Days of Obsevation
SS
SP
SM
SS SP SM
-36
-32
-28
-24
-20
-16
Zet
a P
ote
nti
al, (
mV
)
Type of Glycolipid Surfactants
1st
day
3rd
day
7th
day
14th
day
30th
day

Chapter 3 Results and Discussions
66
Figure 3.22 (a) shows graphical representation of mean droplet size of thyme
essential oil emulsions stabilized by glycolipid surfactants with SS emulsions having the
biggest mean droplet size followed by SP and SM emulsions. Due to the unequal chain
length of surfactant and co-surfactant present in the emulsion system, lateral molecular
interactions of van der Waals interactions was weakened as longer lipid tail of
glycolipid surfactants possessed a great tendency to disrupt molecular packing with
increased motion of excess fragment of lipid tail [167-169]. SS having a longer lipid tail
cannot be solubilised perfectly in the oil phase driving the lipid tail proximately close to
the interface and cramping the quarter increasing the inter-particle distance between
surfactant which causes reduction in surface area of emulsion droplet producing a
significantly bigger size droplet of emulsion as compared to shorter chain glycolipid
surfactants. However, emulsion having a smaller droplet size was relatively more stable
than those of larger droplet [170, 171].
As storage duration increases ageing of emulsion was observed as mean droplet
size of emulsion increases with storage duration, the increase was recorded rapid for SS
while SP and SM emulsions shows relatively low and less rapid increment indicating a
more stabilized emulsions system than SS emulsions. Destabilization of emulsions was
greatly attributed to the dynamic property at the surfactant layer, interfacial properties
and colloidal interactions of emulsion [166, 172].
Meanwhile, zeta potential of emulsions stabilized by SS shows greater negative
potential values than SP and SM suggesting a decreasing stability of emulsion formed
according to the decrease in lipid tail length. SS having a biggest droplet size was
stabilized by higher zeta potential value repulsing droplet from emerging opposing
destabilization through flocculation. As for emulsion stabilized by SM, zeta potential
value of emulsion formed was recorded to be the lowest suggesting low inter-particle
repulsion leading to flocculation and destabilization over a long storage period.

Chapter 3 Results and Discussions
67
3.5.2 Morphology, Particle Size and Zeta Potential Analysis of
Lavender Essential Oil Emulsion
(a)
(b)
(c)
Figure 3.23: Light micrograph of lavender oil emulsion stabilized by glycolipid
surfactants of (a) SS (b) SP, (c) SM. The micrograph was captured after one day of
storage at temperature of 45.0±0.1 ºC.

Chapter 3 Results and Discussions
68
(a)
(b)
(c)
Figure 3.24: The measurements of (a) mean droplet size (b) polydispersity index and (c)
zeta potential of lavender essential oil emulsions stabilized by glycolipid surfactant
taken for duration of 30 days.
0 5 10 15 20 25 30
0
1
2
3
Mea
n D
rop
let
Siz
e d
,(
m)
Days of Obsevation
SS
SP
SM
0 5 10 15 20 25 30
0.0
0.2
0.4
0.6
0.8
1.0
1.2
1.4
Po
lyd
isp
ersi
ty I
nd
ex
Days of Obsevation
SS
SP
SM
SS SP SM
-25
-20
-15
-10
-5
Zet
a P
ote
nti
al, (
mV
)
Type of Glycolipid Surfactants
1st
day
3rd
day
7th
day
14th
day
30th
day

Chapter 3 Results and Discussions
69
Essential oil compositions determined the ability of formation of droplet with
association to the inter-particle forces and chemical structures present. Formations of
smaller droplet caused by straight chain terpenes and terpenoids in lavender oil generate
lower steric repulsion in the bulk phase causing shrinking of mean droplet size of
emulsions [135, 163]. Formation of emulsions droplet not abiding to the characteristic
flow with variation of droplet size and uneven distributions were observed for lavender
emulsion. The mean droplet sizes of lavender emulsions stabilized by SP were recorded
bigger than SS and SM emulsions as in Figure 3.24 (a). Distribution of means droplet
size with variation of PDI resulted in increase of viscosity from SS followed by SM and
finally SP emulsions.
As storage duration increases, the mean droplet size of SP and SM emulsion
increases rapidly as ageing took place. Weak inter-particle association corresponding to
decreasing zeta potential and PDI lead to weak integrity between droplets which mark
the dissociation and instability of emulsions system formed for both SP and SM
emulsions after 14th
days of observation. However, SS emulsion with lower fluctuations
of droplet size, steady zeta potential values retains the stability of lavender emulsions
over a period of 30 days.

Chapter 3 Results and Discussions
70
3.5.3 Morphology, Particle Size and Zeta Potential Analysis of Tea
Tree Essential Oil Emulsion
(a)
(b)
(c)
Figure 3.25: Light micrograph of tea tree oil emulsion stabilized by glycolipid
surfactants of (a) SS (b) SP, (c) SM. The micrograph was captured after one day of
storage at temperature of 45.0±0.1 ºC.

Chapter 3 Results and Discussions
71
(a)
(b)
(c)
Figure 3.26: The measurements of (a) mean droplet size (b) polydispersity index and (c)
zeta potential of tea tree essential oil emulsions taken for duration of 30 days.
0 5 10 15 20 25 30
0
1
2
3
Mea
n D
rop
let
Siz
e d
,(
m)
Days of Obsevation
SS
SP
SM
0 5 10 15 20 25 30
0.0
0.2
0.4
0.6
0.8
1.0
1.2
1.4
Po
lyd
isp
ersi
ty I
nd
ex
Days of Obsevation
SS
SP
SM
SS SP SM
-40
-35
-30
-25
-20
-15
-10
Zet
a P
ote
nti
al, (
mV
)
Type of Glycolipid Surfactants
1st
day
3rd
day
7th
day
14th
day
30th
day

Chapter 3 Results and Discussions
72
The mean droplet size of tea tree oil emulsions as displayed in Figure 3.26 (a)
does not obey similar trend of the thyme oil, lavender oil and citronella oil emulsions
mean droplet size profile. The data recorded a bigger mean droplet size of SM
emulsions as compared to the SP and SS emulsions. The ceteareth-20 acting as the
thickening agent has participated in the formations of emulsion droplets stabilizing the
systems and causes a bigger size droplet formed.
The phenomenon observed decreases the concentration of ceteareth-20 in the
exterior reservoir which hinders the formation of weak gel structure withholding the
emulsions droplet and hence causes the extraordinarily low viscosity recorded. In
addition, low zeta potential value of SM emulsions causes the reduce in slip resistance
between emulsions layer results in a low inter-particle repulsions which further reduce
the stability and viscosity of SM emulsions [131].
As storage duration increases, ageing of emulsions were observed as the mean
droplet size of emulsions increases for all the emulsion system tested. The overall
increase was not rapid, but due to the reduced amount of emulsion fractions in SM
emulsions signifying dissociation of emulsions, the emulsions were concluded to be of
the least stable. On the other hand, tea tree emulsions stabilized by SS which displayed
smaller mean droplet size and higher zeta potential values suggested a more stabilized
emulsion system than SP and SM emulsions.

Chapter 3 Results and Discussions
73
3.5.4 Morphology, Particle Size and Zeta Potential Analysis of
Citronella Essential Oil Emulsion
(a)
(b)
(c)
Figure 3.27: Light micrograph of citronella oil emulsion stabilized by glycolipid
surfactants of (a) SS (b) SP, (c) SM. The micrograph was captured after one day of
storage at temperature of 45.0 ± 0.1 ºC.

Chapter 3 Results and Discussions
74
(a)
(b)
(c)
Figure 3.28: The measurements of (a) mean droplet size (b) polydispersity index and (c)
zeta potential of citronella essential oil emulsions stabilized by glycolipid surfactants
taken for duration of 30 days.
0 5 10 15 20 25 30
0
1
2
3
4
Mea
n D
rop
let
Siz
e d
,(
m)
Days of Obsevation
SS
SP
SM
0 5 10 15 20 25 30
0.0
0.2
0.4
0.6
0.8
1.0
1.2
Po
lyd
isp
ersi
ty I
nd
ex
Days of Obsevation
SS
SP
SM
SS SP SM
-35
-30
-25
-20
-15
-10
Zet
a P
ote
nti
al, (
mV
)
Type of Glycolipid Surfactants
1st
day
3rd
day
7th
day
14th
day
30th
day

Chapter 3 Results and Discussions
75
Citronella oil emulsions shows relatively comparable small mean droplet size
for all glycolipid emulsions studied as shown in Figure 3.28 (a). The accelerated ageing
process causes rapid increment of mean droplet size for both SP and SM emulsions,
while SS emulsions recorded minor increase over a period of 30 days. Generally,
changes in droplet size measurably describe the stability conditions of emulsions, where
rapid fluctuations of droplet size associated to dynamic changes in the internal
environment were factors causing dissociations of emulsions. Whereas, zeta potential of
emulsions opposes emulsion droplets from coming close and merge into bigger droplets
[131, 132]. Therefore, SS emulsions with higher zeta potential shows a smaller degree
of increment in the mean droplet size. Whereas, SM emulsion with lower zeta potential
magnitude experiences a rapid increase of mean droplet size caused by the inability to
oppose emergence of droplet due to the low repulsion energy [133].
Clearly, SP and SM emulsions were less stable as compared to SS emulsions.
Two case scenarios took part in the formation of emulsions; firstly, ceteareth-20 acting
as a thickener was suspended in the continuous phase entangling emulsion droplets
opposing deformation. Secondly, ceteareth-20 was displaced into the bulk phase of SP
and SM emulsion droplet, taking part in the formation of droplet due to the incapability
the of shorter lipid tail of SP and SM of forming stabilized droplet with citronella oil.
Hence, viscosity and storage energy of SS emulsions were recorded higher than SP and
SM emulsions. Further addition of ceteareth-20 in formulation of emulsions does not
promote stability of emulsion formed and ironically causes rupturing of emulsion
droplet due to the presence of excessive amount of co-surfactant in the bulk moiety
exerting forces sufficiently high to break emulsion droplets. To overcome this problem,
thickeners such as polysaccharides acting by adsorbing to the surface of emulsion
droplet can be added to increase viscosity and enhance stability of the emulsion formed
[173].

Chapter 3 Results and Discussions
76
3.6 Rheology
Rheological analysis was carried out to elucidate the insight of emulsions
texture, spreading and characterize cosmetic products into respective range such as
creams, lotion and gels [132]. Rheological measurements were conducted by utilizing
Bohlin CVO-R Rheometer GerminiTM
at a regulated temperature of 30.0±0.1 °C.
3.6.1 Rheological Analysis of Thyme Essential Oil Emulsions
Figure 3.29 displays the descending viscosity magnitude in the order from SS,
SP and followed by SM emulsions. All emulsions exhibit shear thinning behaviour with
a specific yield stress value. As shear stress increases with shear rate without any
deformation until attaining a maximum value (yield stress) sufficiently high to
overcome resistance of droplet packing and starts to flow as shear thinning takes an
ellipsoidal shape aligned with the direction of flow causing a sharp decrease in viscosity
of emulsions [174-176].
Viscosity is highly affected by mean droplet size, polydispersity index (PDI) of
emulsion droplets, presences of additives, surfactant concentration, oil concentration
and ageing of emulsion [177-179]. Viscosity also showed dependency on the inter-
particle cohesive force arising from frictions between emulsion droplets.
(8)
Inter-particle interactions can be represented as cohesive force, which can be
estimated using storage modulus, G’ and of emulsion according to equation 8.
Cohesive energy is highly related to structure of emulsion system which correlates with
droplet size and number of contact area between the droplets [180]. Larger cohesive
interaction results in higher viscosity of emulsions.

Chapter 3 Results and Discussions
77
Emulsion system having bigger mean droplet size and low PDI would yield a
higher viscosity due to higher resistance towards motions when larger droplets were
distributed evenly in a system [175]. Since mean droplet size of SS emulsion was
recorded to be the highest, the corresponding viscosity was recorded to be the highest
among emulsion system studied. SP and SM emulsions which possessed nearly equal
mean droplet size were distinguished by the polydispersity distributions of emulsion
droplets [175, 176]. SP emulsion with higher PDI consists of mixtures of droplet with
variable sizes predominantly small size droplets causing them to possess a lower
viscosity than SS emulsions but higher viscosity as compared to SM emulsion.
Emulsion stabilized by SM records the lowest mean droplet size with lowest PDI
illustrating emulsions to be distributed uniformly with small size droplet resulting in
low viscosity emulsion system [175].
Figure 3.29 (b) displays amplitude sweep or strain test, preformed by increasing
amplitude with constant temperature of 30.0±0.1 °C and frequency of 0.5 Hz. G’
(storage modulus) and G” (loss modulus) responses nearly parallel at low strain giving
a LVR until G’ declined and being dominated by G” where sample undergoing
deformation starts to flow [181]. Results show that the G’ value decreases from SS, SP
and finally SM emulsion. SS emulsion was stiff due to high G’ [180], but having lowest
LVR and lowest critical strain of 0.0270 unit suggesting weak emulsion integrity as
they have lowest resistivity towards deformations [174]. Though emulsion stabilized by
SP was less stiff due to lower G’ value, but they retain high structural integrity due to
high critical strain and long LVR. Possessing the lowest G’, emulsion stabilized by SM
was softest and weakest among the emulsion studied.

Chapter 3 Results and Discussions
78
(a)
(b)
(c)
Figure 3.29: Rheological analysis of (a) viscosity as a function of shear rate, (b)
amplitude sweep and (c) frequency sweep of thyme emulsion stabilized by glycolipid
surfactants on first day of observation.
1E-4 1E-3 0.01 0.1 1 10 100
0.1
1
10
100
1000
5wt% SS
5wt% SP
5wt% SM
Vis
cosi
ty,
(P
as)
Shear Rate (s-1
)
1E-3 0.01 0.1
1
10
100
1000
5wt% SS
5wt% SP
5wt% SM
Ela
stic
Mo
du
lus,
G'
(Pa
)
Strain
Critical strain (SM)= 0.0364
Critical strain (SP)= 0.0442
Critical strain (SS)= 0.0270
0.1 1
1
10
100
Vis
cou
s M
od
ulu
s, G
" (
Pa
)
- - G" 5wt% SS
- - G" 5wt% SP
- - G" 5wt% SM
G'
G'
G'
Frequency, f (Hz)
Ela
stic
Mo
du
lus,
G'
(Pa
)
1
10
100

Chapter 3 Results and Discussions
79
Figure 3.29 (c) displays the frequency dependent oscillatory measurements of
essential oil emulsions with G’ predominates G” modulus by a factor of 10 responded
almost parallel throughout the measured frequency (ω) domain implying solid like
behaviour of emulsion [182] signifying great internal strength with high inter-particle
interactions forces between droplets. SS and SP emulsions having a close pack rigid
structure where droplets resist movement with increasing frequency giving relatively
straight G’ response. SM emulsion shows lowest G’ and G” due to smaller interacting
internal forces caused by internal small size droplet distribution which reduces the
packing rigidity [180]. As frequency increases, loss of elasticity was observed for SM
emulsions with decreasing G’ at high frequency. Therefore, SS emulsion endorsed the
most rigid structure representing solid like behaviour followed by SP and SM
emulsions. By considering the flow behaviour, LVR, mean droplet size and stability of
emulsions, essential oil emulsion formed from SP was concluded to be of stable, having
intermediate viscosity and gives a wide range of application with long LVR.
Measurements are repeated at discrete time intervals at 1st, 3
rd, 7
th, 14
th and 30
th
days (Figure 3.30-3.32) with constant temperature and measurement parameters.
Comparison has been made to determine the changes of internal structure to determine
product stability over a long shelf life. Viscosity decreases over the period of test,
emulsions are subjected to internal structure rearrangement and destabilization
processes namely coalescence and flocculation [165]. Mean droplet size and PDI of
emulsions increase with period of test as ageing takes place. PDI increases more rapidly
than the mean droplet size of emulsion signifying a more polydispersed system, which
reduces the packing ability of droplet and lowering structural integrity which reduces G’
of the system resulting in the decline of inter-particle cohesive forces (equation 8)
leading to a decrease in viscosity of emulsion over the period of 30 days. Presence of
inter-particle hydrogen bonding records higher storage energy of thyme emulsion than

Chapter 3 Results and Discussions
80
essential oil held with weaker van der Waals forces [102]. In contradiction, presence of
inter-particle hydrogen bonding increases the merging rate of emulsion droplet causing
formation of droplet with bigger size and more rapidly as compared to other essential
oil emulsions system [109].
Amplitude dependent and frequency dependent oscillatory measurements yield
similar profile to the initial measurements with decreasing gap between G’ and G”
moduli for all thyme emulsions, indicating decreasing structural integrity resulting in
loss of elasticity at high frequency [132]. Both profile and critical strains are in
matching number signifying low structural rearrangement giving a potentially stable
emulsion system resisting internal structure rearrangement with ageing [163]. Overall
decrease does not cause major dissociation of internal structure which would possibly
lead to separations into respective phases. Therefore, thyme emulsions are concluded to
be stable as they withheld the ability to maintain high emulsion fraction over 30 days of
test resisting major changes in the internal structure.

Chapter 3 Results and Discussions
81
(a)
(b)
(c)
Figure 3.30: Rheological analysis of (a) viscosity as a function of shear rate, (b)
amplitude sweep and (c) frequency sweep of thyme emulsion stabilized by sucrose
stearate after 30 days.
1E-4 1E-3 0.01 0.1 1 10 100
0.1
1
10
100
1000
5wt% SS 1st day
5wt% SS 3rd day
5wt% SS 7th day
5wt% SS 14th day
5wt% SS 30th day
Vis
cosi
ty,
(P
as)
Shear Rate (s-1
)
1E-3 0.01 0.1
1
10
100
1000
Ela
stic
Mo
du
lus,
G'
(Pa
)
Strain
5wt% SS 1st day
5wt% SS 3rd day
5wt% SS 7th day
5wt% SS 14th day
5wt% SS 30th day
0.1 1
10
100
Vis
cou
s M
odu
lus,
G"
(P
a)
- - G"; 1st day
- - G"; 3rd day
- - G"; 7th day
- - G"; 14th day
- - G"; 30th day
G'
G'
G'
G'
G'
Frequency, f (Hz)
Ela
stic
Mod
ulu
s, G
' (P
a)
10
100

Chapter 3 Results and Discussions
82
(a)
(b)
(c)
Figure 3.31: Rheological analysis of (a) viscosity as a function of shear rate, (b)
amplitude sweep and (c) frequency sweep of thyme emulsion stabilized by sucrose
palmitate after 30 days.
1E-4 1E-3 0.01 0.1 1 10 100
0.1
1
10
100
1000
5wt% SP 1st day
5wt% SP 3rd day
5wt% SP 7th day
5wt% SP 14th day
5wt% SP 30th day
Vis
cosi
ty,
(P
as)
Shear Rate (s-1
)
1E-3 0.01 0.1
10
100
1000
5wt% SP 1st day
5wt% SP 3rd day
5wt% SP 7th day
5wt% SP 14th day
5wt% SP 30th day
Ela
stic
Mo
du
lus,
G'
(Pa
)
Strain
0.1 1
1
10
100
Vis
cou
s M
odu
lus,
G"
(P
a)
- - G"; 1st day
- - G"; 3rd day
- - G"; 7th day
- - G"; 14th day
- - G"; 30th day
G'
G'
G'
G'
G'
Frequency, f (Hz)
Ela
stic
Mod
ulu
s, G
' (P
a)
1
10
100

Chapter 3 Results and Discussions
83
(a)
(b)
(c)
Figure 3.32: Rheological analysis of (a) viscosity as a function of shear rate, (b)
amplitude sweep and (c) frequency sweep of thyme emulsion stabilized by sucrose
myristate after 30 days.
1E-4 1E-3 0.01 0.1 1 10 100
0.1
1
10
100
1000
5wt% SM 1st day
5wt% SM 3rd day
5wt% SM 7th day
5wt% SM 14th day
5wt% SM 30th day
Vis
cosi
ty,
(P
as)
Shear Rate (s-1
)
1E-3 0.01 0.1
1
10
100
1000
5wt% SM 1st day
5wt% SM 3rd day
5wt% SM 7th day
5wt% SM 14th day
5wt% SM 30th day
Ela
stic
Mo
du
lus,
G'
(Pa
)
Strain
0.1 1
1
10
Vis
cou
s M
odu
lus,
G"
(P
a)
- - G"; 1st day
- - G"; 3rd day
- - G"; 7th day
- - G"; 14th day
- - G"; 30th day
G'
G'
G'
G'
G'
Frequency, f (Hz)
Ela
stic
Mod
ulu
s, G
' (P
a)
1
10

Chapter 3 Results and Discussions
84
3.6.2 Rheological Analysis of Lavender Essential Oil Emulsions
Figure 3.33 (a) showed viscosity profile for lavender oil emulsions stabilized by
glycolipid surfactant with similar viscosity profile for SM and SP emulsions and
slightly lower viscosity recorded for SS emulsions. The smaller size emulsions droplets
of SS emulsions with higher PDI causes the reduction in viscosity of SS emulsions as
compared to SM and SP emulsions. Cohesive forces between droplets were predicted to
be the lowest for SS emulsions due to high polydispersity distribution of droplet causing
low packing ability of emulsions resulting in lower G’.
This was further verified by the frequency dependent oscillation profile that
displays a narrow gap between G’ and G” at low frequency and decreasing G” at high
frequency indicates moderate structural strength withholding the droplet promoting flow
at high frequency. Data presented show a similar profile for amplitude and frequency
sweep for all lavender emulsions, Figure 3.33 (b) and (c). Critical strain values were
recorded as 0.0258, 0.0465 and 0.0415 units for SS, SP and SM emulsion respectively.
Despite having variation of critical strain, magnitude of approximately 100 Pa of G’
was quantified for all lavender emulsions, indicating moderate strength internal network
retaining the ability to oppose sinusoidal deformation [132, 163]. However, due to the
lower G’ magnitude, lavender oil emulsions were expected to possess a weaker inter-
particle integrity and lower storage stability than thyme emulsions [172, 183].
Figure 3.34 (a) displayed the maturity of lavender oil emulsion system with
increasing viscosity of the emulsions from 1st day to 7
th day caused by formation of
bigger emulsion droplet as in Figure 3.34 (a) and 3.35(a) followed by decreasing
viscosity from 14th
day onwards as the integrity holding the emulsions droplet became
weaker with reduced zeta potential.

Chapter 3 Results and Discussions
85
(a)
(b)
(c)
Figure 3.33: Rheological analysis of (a) viscosity as a function of shear rate, (b)
amplitude sweep and (c) frequency sweep of lavender emulsion stabilized by glycolipid
surfactants on first day of observation.
1E-4 1E-3 0.01 0.1 1 10 100
0.1
1
10
100
1000
5wt% SS
5wt% SP
5wt% SM
Vis
cosi
ty,
(P
as)
Shear Rate (s-1
)
1E-3 0.01 0.1
1
10
100
1000
5wt% SS
5wt% SP
5wt% SM
Ela
stic
Mo
du
lus,
G'
(Pa
)
Strain
Critical strain (SM)= 0.0415
Critical strain (SP)= 0.0465
Critical strain (SS)= 0.0258
0.1 1
1
10
100
Vis
cou
s M
odu
lus,
G"
(P
a)
- - G" 5wt% SS
- - G" 5wt% SP
- - G" 5wt% SM
G'
G'
G' Frequency, f (Hz)
Ela
stic
Mod
ulu
s, G
' (P
a)
1
10
100

Chapter 3 Results and Discussions
86
The decrease in structural integrity of the emulsions system causes the reduction
in G’ over the storage period of 30 days as shown in the strain test as in Figure 3.34 (b),
3.35 (b) and 3.36 (b), overall affecting the stability of emulsions which causes slight
separation of SP and SM emulsions in the end of the test. Figure 3.35 (c) and 3.36 (c)
show the double logarithmic plot against frequency for both SP and SM emulsions
presents wide gap near to parallel G’ and G” moduli respond indicating strong
structural integrity of emulsions at the early stage of formations [164]. However, the
network structure of co-surfactant ceterate-20 withholding the emulsion systems were
weaken as storage period increases resulting inability of emulsion to withstand the
applied stress and to deform. The phenomenon was proven by the narrowing of gap
between G’ and G” observed at 14th
days which indicates decrease in structural integrity
of the system [164].
Relatively, lavender oil emulsions possessed weaker rheological properties as
compared to thyme emulsions. In spite of that, lavender oil emulsions stabilized by
glycolipid surfactants were able to retain high emulsions fractions over 30 days
especially emulsions stabilized by sucrose stearate.

Chapter 3 Results and Discussions
87
(a)
(b)
(c)
Figure 3.34: Rheological analysis of (a) viscosity as a function of shear rate, (b)
amplitude sweep and (c) frequency sweep of lavender emulsion stabilized by sucrose
stearate after 30 days.
1E-4 1E-3 0.01 0.1 1 10 100
0.1
1
10
100
1000
5wt% SS 1st day
5wt% SS 3rd day
5wt% SS 7th day
5wt% SS 14th day
5wt% SS 30th day
Vis
cosi
ty,
(P
as)
Shear Rate (s-1
)
1E-3 0.01 0.1
1
10
100
1000
Ela
stic
Mo
du
lus,
G'
(Pa
)
Strain
5wt% SS 1st day
5wt% SS 3rd day
5wt% SS 7th day
5wt% SS 14th day
5wt% SS 30th day
0.1 11
10
100
Vis
cou
s M
odu
lus,
G"
(P
a)
- - G"; 1st day
-- G"; 3rd day
- - G"; 7th day
- - G"; 14th day
- - G"; 30th day
G'
G'
G'
G'
G'
Frequency, f (Hz)
Ela
stic
Mod
ulu
s, G
' (P
a)
1
10
100

Chapter 3 Results and Discussions
88
(a)
(b)
(c)
Figure 3.35: Rheological analysis of (a) viscosity as a function of shear rate, (b)
amplitude sweep and (c) frequency sweep of lavender emulsion stabilized by sucrose
palmitate after 30 days.
1E-4 1E-3 0.01 0.1 1 10 100
0.1
1
10
100
1000
5wt% SP 1st day
5wt% SP 3rd day
5wt% SP 7th day
5wt% SP 14th day
5wt% SP 30th day
Vis
cosi
ty,
(P
as)
Shear Rate (s-1
)
1E-3 0.01 0.1
1
10
100
1000
Ela
stic
Mo
du
lus,
G'
(Pa
)
Strain
5wt% SP 1st day
5wt% SP 3rd day
5wt% SP 7th day
5wt% SP 14th day
5wt% SP 30th day
0.1 1
1
10
100
Vis
cou
s M
odu
lus,
G"
(P
a)
- - G"; 1st day
- - G"; 3rd day
- - G"; 7th day
- - G"; 14th day
- - G"; 30th day
G'
G'
G'
G'
G'
Frequency, f (Hz)
Ela
stic
Mod
ulu
s, G
' (P
a)
1
10
100

Chapter 3 Results and Discussions
89
(a)
(b)
(c)
Figure 3.36: Rheological analysis of (a) viscosity as a function of shear rate, (b)
amplitude sweep and (c) frequency sweep of lavender emulsion stabilized by sucrose
myristate after 30 days.
1E-4 1E-3 0.01 0.1 1 10 100
0.1
1
10
100
1000
5wt% SM 1st day
5wt% SM 3rd day
5wt% SM 7th day
5wt% SM 14th day
5wt% SM 30th day
Vis
cosi
ty,
(P
as)
Shear Rate (s-1
)
1E-3 0.01 0.1
1
10
100
1000
5wt% SM 1st day
5wt% SM 3rd day
5wt% SM 7th day
5wt% SM 14th day
5wt% SM 30th day
Ela
stic
Mod
ulu
s, G
' (P
a)
Strain
0.1 1
1
10
100
Vis
cou
s M
odu
lus,
G"
(P
a)
- - G"; 1st day
- - G"; 3rd day
- - G"; 7th day
- - G"; 14th day
- - G"; 30th day
G'
G'
G'
G'
G'
Frequency, f (Hz)
Ela
stic
Mod
ulu
s, G
' (P
a)
1
10
100
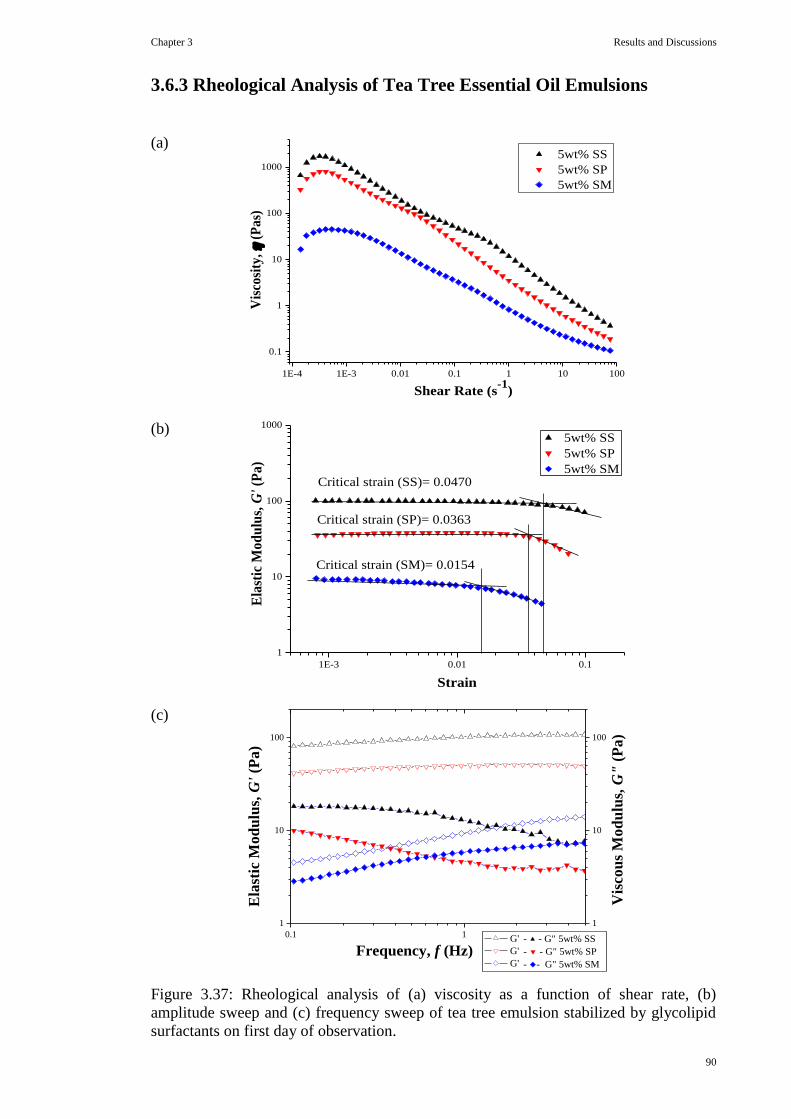
Chapter 3 Results and Discussions
90
3.6.3 Rheological Analysis of Tea Tree Essential Oil Emulsions
(a)
(b)
(c)
Figure 3.37: Rheological analysis of (a) viscosity as a function of shear rate, (b)
amplitude sweep and (c) frequency sweep of tea tree emulsion stabilized by glycolipid
surfactants on first day of observation.
1E-4 1E-3 0.01 0.1 1 10 100
0.1
1
10
100
1000
5wt% SS
5wt% SP
5wt% SM
Vis
cosi
ty,
(P
as)
Shear Rate (s-1
)
1E-3 0.01 0.1
1
10
100
1000
5wt% SS
5wt% SP
5wt% SM
Ela
stic
Mo
du
lus,
G'
(Pa
)
Strain
Critical strain (SM)= 0.0154
Critical strain (SP)= 0.0363
Critical strain (SS)= 0.0470
0.1 1
1
10
100
Vis
cou
s M
od
ulu
s, G
" (
Pa
)
- - G" 5wt% SS
- - G" 5wt% SP
- - G" 5wt% SM
G'
G'
G' Frequency, f (Hz)
Ela
stic
Mo
du
lus,
G'
(Pa
)
1
10
100

Chapter 3 Results and Discussions
91
Tea tree oil emulsions showed significant major differences between essential
oil emulsions by presenting data which do not obey the presumably similar trend of
rheological profiles. Tea tree oil emulsions stabilized by SM showed critically low
viscosities as compared to both SS and SP emulsions. Phenomenon observed was
attributed to the formations and arrangement of tea tree oil chemical structure with co-
surfactant of ceteareth-20 during the phase inversion of emulsions. The ceteareth-20
acting as a thickener in the system does not take part in the entanglement of the droplets
in the dispersed phase causing relatively low viscosity of SM emulsions behaving close
to Newtonian fluid flow.
Overall this affected the stability of emulsions formed, as thickener function in
forming weak gel system in the continuous phase generating pronounced yield stress
preventing movements of droplet from sliding past each other until a sufficient force
was applied [184]. Without this function, emulsions generated were weak, easily
deformed and unsustainable for a long period. On the other hand, SS and SP emulsions
with greater viscosity were predicted to have higher storage stability than SM emulsions
as high interfacial viscosity with low shear thinning rates enhanced stability of
emulsions by delaying droplet coalescence causing higher resistance towards
deformations [185].
The amplitude dependent oscillations test conducted gives an indication that SS
emulsions possessing the highest G’ and longest LVR to be the strongest and resilience
towards deformations followed by SP emulsions. SM emulsion was weakest among all.
Figure 3.37 (b), frequency dependence of SM emulsions illustrated increasing parallel
G’ and G” moduli over sheared frequency denote emulsions system with moderate
structural strength and little network structure [186]. Figure 3.37 (a) exhibits a weak and
brittle emulsion system of SM emulsion recording low G’ and critical strain prone to
destabilization of emulsions.

Chapter 3 Results and Discussions
92
Consecutive study for both SS and SP emulsions yield similar trend of
rheological profile with declining stability characteristic depicted in Figure 3.38 and
Figure 3.39. Viscosity profile portrayed small degree of decrease in viscosity as a
function of shear rate for both SP and SM. Decrease in yield stress of the system
reduces the stress necessary to move droplet, since yield stress is the stress required to
overcome inter-particle attractive forces to initiate flow [187]. These imply minor loss
in cohesive forces and loss of structural integrity of emulsions formed [179, 185].
Acting coherently with frequency sweep denotes decreasing G’ and G” moduli in
magnitude with increase storage duration until 14th
days of storage. Rapid drop of yield
stress and G’ of emulsions systems on 30th
day imply onset of structural disintegration
of emulsion system with increase flow ability of emulsion susceptible to phase
separation exceeding 30 days of storage. Nonetheless, SP and SS emulsions were still
deemed stable compared to SM emulsions.
In the exception of tea tree oil emulsion stabilized by SM glycolipid surfactant (Figure
3.40), sudden increase of storage energy at 30th
day was recorded despite initial
decreasing trend of rheological profiles. Evolving droplet size leads to formation of
droplets with greater size through coalescence slightly increases the viscosity SM
emulsions, with overall increases of the storage energy of emulsions at 30th
days of
observation. Frequency sweep responded in an increasing gap size with increasing
magnitude of G’ and G” moduli specifying stronger structural network development in
SM emulsion with increasing storage period [180]. Stability of emulsion was enhanced
at the end of test, however due to the low storage energy magnitude SM emulsion they
was categorized as least stabilized emulsion system compared to SS and SP emulsion
system. Higher storage energy, G’ implies higher stability of emulsion system formed
[188].

Chapter 3 Results and Discussions
93
(a)
(b)
(c)
Figure 3.38: Rheological analysis of (a) viscosity as a function of shear rate, (b)
amplitude sweep and (c) frequency sweep of tea tree emulsion stabilized by sucrose
stearate after 30 days.
1E-4 1E-3 0.01 0.1 1 10 100
0.1
1
10
100
1000
5wt% SS 1st day
5wt% SS 3rd day
5wt% SS 7th day
5wt% SS 14th day
5wt% SS 30th day
Vis
cosi
ty,
(P
as)
Shear Rate (s-1
)
1E-3 0.01 0.1
1
10
100
1000
Ela
stic
Mo
du
lus,
G'
(Pa
)
Strain
5wt% SS 1st day
5wt% SS 3rd day
5wt% SS 7th day
5wt% SS 14th day
5wt% SS 30th day
0.1 1
1
10
100
Vis
cou
s M
odu
lus,
G"
(P
a)
- - G"; 1st day
- - G"; 3rd day
- - G"; 7th day
- - G"; 14th day
- - G"; 30th day
G'
G'
G'
G'
G'
Frequency, f (Hz)
Ela
stic
Mod
ulu
s, G
' (P
a)
1
10
100

Chapter 3 Results and Discussions
94
(a)
(b)
(c)
Figure 3.39: Rheological analysis of (a) viscosity as a function of shear rate, (b)
amplitude sweep and (c) frequency sweep of tea tree emulsion stabilized by sucrose
palmitate after 30 days.
1E-4 1E-3 0.01 0.1 1 10 100
0.1
1
10
100
1000
5wt% SP 1st day
5wt% SP 3rd day
5wt% SP 7th day
5wt% SP 14th day
5wt% SP 30th day
Vis
cosi
ty,
(P
as)
Shear Rate (s-1
)
1E-3 0.01 0.1
1
10
100
1000
Ela
stic
Mo
du
lus,
G'
(Pa
)
Strain
5wt% SP 1st day
5wt% SP 3rd day
5wt% SP 7th day
5wt% SP 14th day
5wt% SP 30th day
0.1 1
1
10
100
Vis
cou
s M
odu
lus,
G"
(P
a)
- - G"; 1st day
- - G"; 3rd day
- - G"; 7th day
- - G"; 14th day
- - G"; 30th day
G'
G'
G'
G'
G'
Frequency, f (Hz)
Ela
stic
Mod
ulu
s, G
' (P
a)
1
10
100

Chapter 3 Results and Discussions
95
(a)
(b)
(c)
Figure 3.40: Rheological analysis of (a) viscosity as a function of shear rate, (b)
amplitude sweep and (c) frequency sweep of tea tree emulsion stabilized by sucrose
myristate after 30 days.
1E-4 1E-3 0.01 0.1 1 10 100
0.1
1
10
100 5wt% SM 1st day
5wt% SM 3rd day
5wt% SM 7th day
5wt% SM 14th day
5wt% SM 30th day
Vis
cosi
ty,
(P
as)
Shear Rate (s-1
)
1E-3 0.01 0.1
1
10
100
1000
5wt% SM 1st day
5wt% SM 3rd day
5wt% SM 7th day
5wt% SM 14th day
5wt% SM 30th day
Ela
stic
Mo
du
lus,
G'
(Pa
)
Strain
0.1 1
1
10
Vis
cou
s M
odu
lus,
G"
(P
a)
- - G"; 1st day
- - G"; 3rd day
- - G"; 7th day
- - G"; 14th day
- - G"; 30th day
G'
G'
G'
G'
G'
Frequency, f (Hz)
Ela
stic
Mod
ulu
s, G
' (P
a)
1
10
Chapter 3 Results and Discussions
96
3.6.4 Rheological Analysis of Citronella Essential Oil Emulsions
Citronella emulsions present similar traits of emulsion characteristic resembling
those of tea tree oil emulsions with SS emulsion having the strongest and most versatile
emulsions characteristic with long LVR and high G’ magnitude and weak emulsion
characteristic with low G’ and short LVR of SP and SM emulsions. The differences of
storage energy between citronella oil emulsions system were significant with SS
emulsions recorded 10 times higher than SP and SM emulsions systems. The
phenomenon observed was greatly attributed to the dispersions of ceteareth-20 as
thickening agent in the SS emulsions which increases the structural integrity of the
emulsions which increases the viscosity and storage energy of the emulsions system.
On the other hand, having ceteareth-20 taking part in the formations of droplet for both
SP and SM emulsions resulted in minimal structural integrity in the emulsions formed
which causes significantly low storage energy as displayed in Figure 3.41 (b). Although,
SM emulsions displayed higher yield stress than SP emulsions, the interfacial rheology
of SP emulsions reduces the rate of film thinning presenting lower flow-ability of
interfacial element indicating higher viscosity at the course of shear. This reduces the
rate of shear thinning and rate of coalescence of SP emulsions [173, 185, 189]. Due to
these factors SP emulsions demonstrate higher G’ and critical strain than SM.
Citronella emulsion stabilized by SS glycolipid emulsion (Figure 3.42) display
decreasing trend of viscosity and G’ marking the onset of dissociation of linked internal
network structure of emulsion which reduces the ability to withstand deformations
[186]. Inter-particle cohesive energy decline with reduced G’ according to equation 8
inducing destabilization by enabling rapid droplet coalescence [189].

Chapter 3 Results and Discussions
97
(a)
(b)
(c)
Figure 3.41: Rheological analysis of (a) viscosity as a function of shear rate, (b)
amplitude sweep and (c) frequency sweep of citronella emulsion stabilized by
glycolipid surfactants on first day of observation.
1E-4 1E-3 0.01 0.1 1 10 100
0.1
1
10
100
1000
5wt% SS
5wt% SP
5wt% SM
Vis
cosi
ty,
(P
as)
Shear Rate (s-1
)
1E-3 0.01 0.1
1
10
100
1000
5wt% SS
5wt% SP
5wt% SM
Ela
stic
Mo
du
lus,
G'
(Pa
)
Strain
Critical strain (SM)= 0.0199
Critical strain (SP)= 0.0210
Critical strain (SS)= 0.0342
0.1 1
1
10
100
Vis
co
us
Mo
du
lus,
G"
(P
a)
- - G" 5wt% SS
- - G" 5wt% SP
- - G" 5wt% SM
G'
G'
G' Frequency, f (Hz)
Ela
stic
Mo
du
lus,
G'
(Pa
)
1
10
100

Chapter 3 Results and Discussions
98
Frequency dependent oscillation shearing of SS emulsions displays decreasing
energy of G’ and G” moduli indicated by gap narrowing of frequency profile implying
loss of network structure withholding droplets [187]. This indicates that the solid like
behaviour of emulsions decreases with increasing trend of fluidity. In spite of that, SS
emulsion acquiring higher storage energy was categorized as having higher stability
over both SP and SM emulsions [175].
Over the period of 30 days, SP and SM emulsions show gradual increase of
storage energy consistent with increase of mean droplet size of emulsions and lowering
of PDI. Bigger droplet formation with lower PDI promotes packing of emulsion droplet
resisting deformation hence attaining higher storage energy and enhanced viscosity of
emulsion over the storage period [182, 184]. Frequency sweep demonstrates increasing
trend of network structure illustrating less dependent widening gap of G’ and G”
moduli in the frequency measured [186]. SP and SM emulsions were stated to display
kinetic stability by retaining high emulsion fractions over storage period even though
they possessed low storage energy and viscosity.
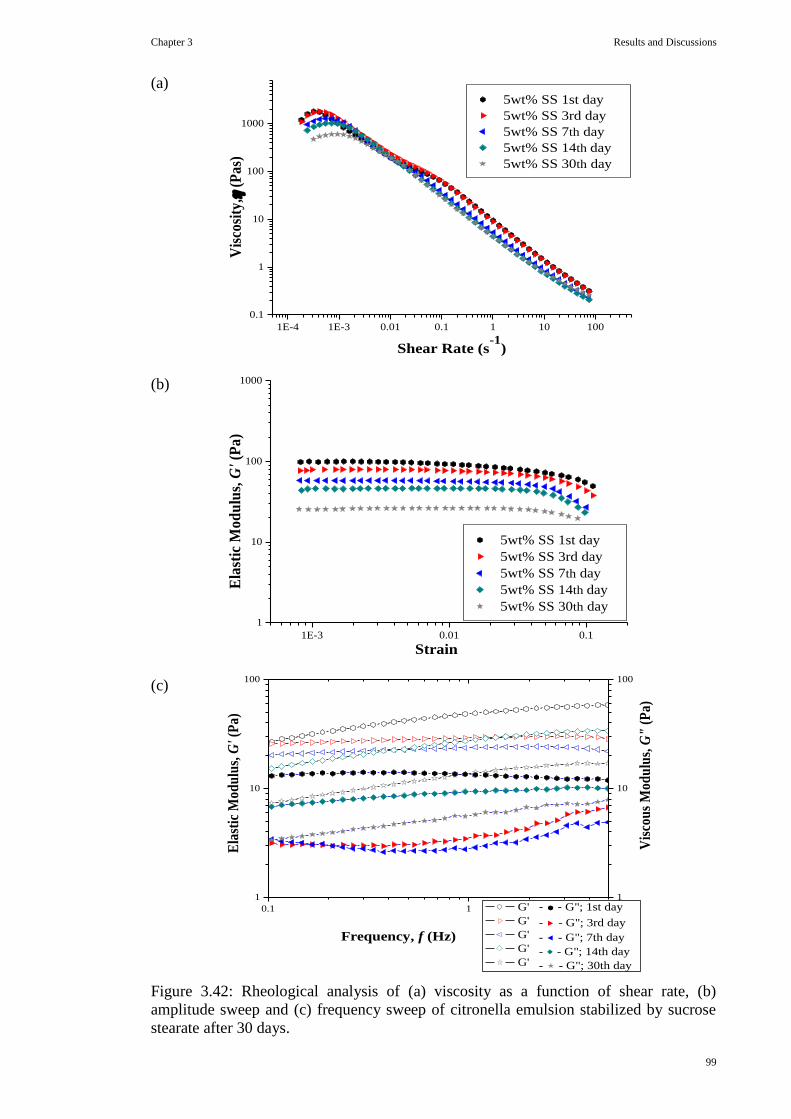
Chapter 3 Results and Discussions
99
(a)
(b)
(c)
Figure 3.42: Rheological analysis of (a) viscosity as a function of shear rate, (b)
amplitude sweep and (c) frequency sweep of citronella emulsion stabilized by sucrose
stearate after 30 days.
1E-4 1E-3 0.01 0.1 1 10 100
0.1
1
10
100
1000
5wt% SS 1st day
5wt% SS 3rd day
5wt% SS 7th day
5wt% SS 14th day
5wt% SS 30th day
Vis
cosi
ty,
(P
as)
Shear Rate (s-1
)
1E-3 0.01 0.1
1
10
100
1000
Ela
stic
Mo
du
lus,
G'
(Pa
)
Strain
5wt% SS 1st day
5wt% SS 3rd day
5wt% SS 7th day
5wt% SS 14th day
5wt% SS 30th day
0.1 1
1
10
100
Vis
cou
s M
odu
lus,
G"
(P
a)
- - G"; 1st day
- - G"; 3rd day
- - G"; 7th day
- - G"; 14th day
- - G"; 30th day
G'
G'
G'
G'
G'
Frequency, f (Hz)
Ela
stic
Mod
ulu
s, G
' (P
a)
1
10
100

Chapter 3 Results and Discussions
100
(a)
(b)
(c)
Figure 3.43: Rheological analysis of (a) viscosity as a function of shear rate, (b)
amplitude sweep and (c) frequency sweep of citronella emulsion stabilized by sucrose
palmitate after 30 days.
1E-4 1E-3 0.01 0.1 1 10 100
0.1
1
10
100
1000
5wt% SP 1st day
5wt% SP 3rd day
5wt% SP 7th day
5wt% SP 14th day
5wt% SP 30th day
Vis
cosi
ty,
(P
as)
Shear Rate (s-1
)
1E-3 0.01 0.1
1
10
100
1000
Ela
stic
Mo
du
lus,
G'
(Pa
)
Strain
5wt% SP 1st day
5wt% SP 3rd day
5wt% SP 7th day
5wt% SP 14th day
5wt% SP 30th day
0.1 1
1
10
100
Vis
cou
s M
odu
lus,
G"
(P
a)
- - G"; 1st day
- - G"; 3rd day
- - G"; 7th day
- - G"; 14th day
- - G"; 30th day
G'
G'
G'
G'
G'
Frequency, f (Hz)
Ela
stic
Mod
ulu
s, G
' (P
a)
1
10
100

Chapter 3 Results and Discussions
101
(a)
(b)
(c)
Figure 3.44: Rheological analysis of (a) viscosity as a function of shear rate, (b)
amplitude sweep and (c) frequency sweep of citronella emulsion stabilized by sucrose
myristate after 30 days.
1E-4 1E-3 0.01 0.1 1 10 100
0.1
1
10
100
1000
5wt% SM 1st day
5wt% SM 3rd day
5wt% SM 7th day
5wt% SM 14th day
5wt% SM 30th day
Vis
cosi
ty,
(P
as)
Shear Rate (s-1
)
1E-3 0.01 0.1
1
10
100
1000
5wt% SM 1st day
5wt% SM 3rd day
5wt% SM 7th day
5wt% SM 14th day
5wt% SM 30th day
Ela
stic
Mo
du
lus,
G'
(Pa
)
Strain
0.1 1
1
10
100
Vis
cou
s M
odu
lus,
G"
(P
a)
- - G"; 1st day
- - G"; 3rd day
- - G"; 7th day
- - G"; 14th day
- - G"; 30th day
G'
G'
G'
G'
G'
Frequency, f (Hz)
Ela
stic
Mod
ulu
s, G
' (P
a)
1
10
100

102
CHAPTER 4: CONCLUSIONS
Chapter 4 Conclusions
103
Emulsions containing high concentration of essential oils were formulated as an
effort to extend its potential applications in cosmetic industry. Formations of highly
concentrated essential oil emulsions proved viable with aid of co-surfactants namely
TritonTM
X-100, TritonTM
X-45 and ceteareth-20. The formula of thyme essential oil
was determined to be 5 wt% of glycolipid surfactant, 12.5 wt% of thyme oil in total
volume of emulsion, o:w ratio of 1:1, 0.007 wt% of TritonTM
X-100 and 0.2 wt% of
ceteareth-20. Lavender essential oil emulsions formula was determined to be 5 wt% of
glycolipid surfactant, 12.5 wt% lavender oil, o:w = 1:1, 0.010 wt% TritonTM
X-45,
0.002 wt% TritonTM
X-100, and 0.7 wt% ceteareth-20. The most favourable emulsion
determined for tea tree oil was 12.5 wt% tea tree oil, o:w = 1:1, 0.009 wt% TritonTM
X-
45, 0.004 wt% TritonTM
X-100 and 0.2 wt% ceteareth-20. Formula of citronella
emulsions was determined to be 12.5 wt% citronella oil, o:w = 1:1, 0.002 wt% TritonTM
X-45, 0.008 wt% TritonTM
X-100 and 0.006 wt% ceteareth-20.
We have found that all emulsions prepared in this work possess a long shelf life,
resisting changes in the internal structure giving a potentially stable emulsion system
over 30 days of storage duration. Thyme and lavender essential oil emulsions have
higher stability over tea tree oil and citronella emulsions retaining high storage energy
and high viscosity of emulsions fractions. In comparison, citronella emulsion present
weaker emulsion characteristic for emulsion system stabilized by sucrose palmitate and
sucrose myristate due to the interactions between co-surfactant in emulsion formation
and participation of the co-surfactant in emulsion droplet resulting in high fluidity low
stability emulsions. The properties of emulsion formed using the same formulation
varied significantly with hydrocarbon chain length of glycolipid surfactant. Interaction
of essential oil’s composition with co-surfactant participating in the formation of
emulsions greatly influence emulsion droplet formation.

Chapter 4 Conclusions
104
Flow characteristic of emulsion studied using rheology profiles at constant
temperature of 30.0±0.1 °C, imply that essential oil emulsions always exhibit shear
thinning behaviour. Essential oil emulsions also implies solid like behaviour with
storage modulus (G’) dominant over loss modulus (G”) over the measured frequency
sweep carried out. The emulsions tested maintain its viscoelasticity even at low
viscosity.
We have successfully produced emulsions containing high concentration of
essentials oil which meets the current trend of consumer demands in reducing synthetic
materials such as fragrances and preservatives in cosmetic products. Essential oil which
possessed the properties of natural preservatives and delightful odour served the best
combination in providing alternative in replacing the used of synthetic materials in
creams and cosmetic products.
Thyme and lavender oil emulsions stabilized by sucrose palmitate give the
widest applications of use as these emulsions possessed sufficiently high storage energy
which indicates long shelf-life and long LVR which opposes deformation upon
shearing. As for tea tree and citronella oil emulsions, sucrose stearate emulsion present
the most stable system with the highest storage energy and longest LVR region. To
serve the new trends of cosmetic demand, a wide range of product is needed to be more
competitive in the industries and for different applications. Therefore, prototype of these
emulsions can be produced by referring to the determined formulae respectively and can
readily be used in cosmetic and pharmaceutical industries.

105
CHAPTER 5: REFERENCES

Chapter 5 References
106
1. Stringer, D.A. and European Chemical Industry Ecology & Toxicology Centre.,
Percutaneous absorption. ECETOC monograph. 1993, Brussels, Belgium:
European Chemical Industry, Ecology & Toxicology Centre. 80 p.
2. Loretz, L.J., et al., Exposure data for cosmetic products: lipstick, body lotion,
and face cream. Food Chem Toxicol, 2005. 43(2): p. 279-91.
3. Exposure Factors Handbook 1997. Consumer products, 1997. 3.
4. Eccleston, G.M., Functions of mixed emulsifiers and emulsifying waxes in
dermatological lotions and creams. Colloids and Surfaces A: Physicochemical
and Engineering Aspects, 1997. 123-124: p. 169-18.
5. Flynn, G.L., Topical drug absorption and topical pharmaceutical systems.
Modern Pharmaceutics, ed. Banker, G.S. and Rhodes, C.T. 1979, New York:
Marcel Dekker Inc.
6. Idson, B., Vehicle effects in percutaneous absorption. Drug Metab Rev, 1983.
14(2): p. 207-22.
7. Barry, B.W., Dermatological formulations : percutaneous absorption. Drugs
and the pharmaceutical sciences. 1983, New York: M. Dekker. viii, 480 p.
8. Iraj, R., Mohammad, B.R., and Abdolamir, A., Ultrastructural studies on
antimicrobial efficacy of thyme essential oils on Listeria monocytogenes.
International Journal of Infectious Diseases, 2006. 10: p. 236-241.
9. Brasseur, T., Botanical, phytochemical and pharmacologic studies of thyme. J
Pharm Belg, 1983. 38(5): p. 261-72.
10. d'Angelo, R., Handbook of Complementary and Alternative Therapies in Mental
Health. Aromatheraphy, ed. Shannon, S. 2002: Academic Press, Inc.
11. Certificate of sufficiency for fabrication, 2001:
http://www.laleli.com.my/images/fabrication.jpg.
12. XIII International recognition award, 2005:
http://www.laleli.com.my/images/recog.jpg.
13. Cowan, M.M., Plant products as antimicrobial agents. Clin Microbiol Rev,
1999. 12(4): p. 564-82.
14. Habanananda, T., Non-pharmacological pain relief in labour. J Med Assoc
Thai, 2004. 87 Suppl 3: p. S194-202.
15. Perry, N. and Perry, E., Aromatherapy in the management of psychiatric
disorders: clinical and neuropharmacological perspectives. CNS Drugs, 2006.
20(4): p. 257-80.
16. Stahl-Biskup, E. and Sáez, F., Thyme : the genus thymus. Medicinal and
aromatic plants--industrial profiles. 2002, London ; New York: Taylor and
Francis. xii, 330 p.
17. Davidson, P.M. and Naidu, A.S., Phyto-phenol. Natural Food Antimicrobial
Systems, ed. Naidu, A.S. 2000, Boca Raton, FL: CRC Press.
18. Teissedre, P.L. and Waterhouse, A.L., Inhibition of oxidation of human low-
density lipoproteins by phenolic substances in different essential oils varieties. J
Agric Food Chem, 2000. 48(9): p. 3801-5.
19. Bagamboula, C.F., Uyttendaele, M., and Debevere, J., Inhibitory effect of thyme
and basil essential oils, carvacrol, thymol, estragol, linalool and p-cymene
towards Shigella sonnei and S. Flexneri. Food Microbiology, 2004. 21: p. 33-42.
20. Chizzola, R., Michitsch, H., and Franz, C., Antioxidative properties of Thymus
vulgaris leaves: comparison of different extracts and essential oil chemotypes. J
Agric Food Chem, 2008. 56(16): p. 6897-904.
21. Zarzuelo, A. and Crespo, E., The medicinal and non-medicinal uses of thyme.
Thyme. The Genus Thymus. Medicinal and Aromatic Plants Industrial Profiles,
ed. Stahl-Biskup, E. and Saez, F. Vol. 24. 2002, New York: Taylor and Francis.

Chapter 5 References
107
22. Ismaili, H., et al., Topical anti-inflammatory activity of extracts and compounds
from Thymus broussonettii. J Pharm Pharmacol, 2002. 54(8): p. 1137-40.
23. Ismaili, H., et al., In vivo topical anti-inflammatory and in vitro antioxidant
activities of two extracts of Thymus satureioides leaves. J Ethnopharmacol,
2004. 91(1): p. 31-6.
24. Wild, R., The complete book of natural and medical cures. 1994, Emmaus,
Pennsylvania: Rodale Press, Inc. 654.
25. Miura, K. and N. Nakatami, Antioxidative activity of flavonoids from thyme
(Thymus vulgaris L.). Agric. Biol. Chem., 1989. 53 p. 3043-5.
26. Ismaili, H., et al., Topical anti-inflammatory activity of Thymus willdenowii. J
Pharm Pharmacol, 2001. 53(12): p. 1645-52.
27. Lee, S.J., et al., Identification of volatile components in basil (Ocimum basilicum
L.) and thyme leaves (Thymus vulgaris L.) and their antioxidant properties.
Food Chemistry, 2004. 91(1): p. 131-137.
28. Pino, J., et al., Chemical and sensory properties of black pepper oil. . Die
Nahrung, 1990. 34(6): p. 555–560.
29. Baytop, T., Therapy with Medicinal Plants in Turkey (Past and Present) 3255.
1984, Istanbul, Turkey: Publications of the Istanbul University.
30. Lis-Balchin, M. and Hart, S., A preliminary study of the effect of essential oils
on skeletal and smooth muscle in vitro. J Ethnopharmacol, 1997. 58(3): p. 183-7.
31. Ghelardini, C., et al., Local anaesthetic activity of the essential oil of Lavandula
angustifolia. Planta Med, 1999. 65(8): p. 700-3.
32. Hosseinzadeh, H., Ramezani, M., and Salmani, G., Antinociceptive, anti-
inflammatory and acute toxicity effects of Zataria multiflora Boiss extracts in
mice and rats. J Ethnopharmacol, 2000. 73(3): p. 379-85.
33. Kovatcheva, A.G., et al., Antioxidant activity of extract from Lavandula vera M.
in cell cultures. Food Chemistry, 2001. 72: p. 295-300.
34. Angioni, A., et al., Chemical composition, seasonal variability, and antifungal
activity of Lavandula stoechas L. ssp. stoechas essential oils from stem/leaves
and flowers. J Agric Food Chem, 2006. 54(12): p. 4364-70.
35. Shellie, R., et al., Characterisation of lavender essential oils by using gas
chromatography-mass spectrometry with correlation of linear retention indices
and comparison with comprehensive two-dimensional gas chromatography. J
Chromatogr A, 2002. 970(1-2): p. 225-34.
36. Cavanagh, H.M. and Wilkinson, J.M., Biological activities of lavender essential
oil. Phytother Res, 2002. 16(4): p. 301-8.
37. Umezu, T., Behavioral effects of plant-derived essential oils in the geller type
conflict test in mice. Jpn J Pharmacol, 2000. 83(2): p. 150-3.
38. Linck, V.M., et al., Inhaled linalool-induced sedation in mice. Phytomedicine,
2009. 16(4): p. 303-7.
39. Diego, M.A., et al., Aromatherapy positively affects mood, EEG patterns of
alertness and math computations. Int J Neurosci, 1998. 96(3-4): p. 217-24.
40. Paul, J.P., et al., Analysis of volatile components of Lavandula canariensis (L.)
Mill., a Canary Islands endemic species, growing in Australia. Biochem. Syst.
Ecol., 2004. 32: p. 55-62.
41. An, M., T. Hai, and Hatfield, P., On-site field sampling and analysis of
fragrance from living lavender (Lavandula angustifolia L.) flowers by solid-
phase microextraction coupled to gas chromatography and ion-trap mass
spectrometry. J Chromatogr A, 2001. 917(1-2): p. 245-50.
42. Kim, N.S. and Lee, D.S., Comparison of different extraction methods for the
analysis of fragrances from Lavandula species by gas chromatography-mass
spectrometry. J Chromatogr A, 2002. 982(1): p. 31-47.

Chapter 5 References
108
43. Leach, D.N., et al., Enantiomeric composition of theprincipal components of the
oil of Melaleuca alternifolia. Journal Agric. Food Chem., 1993. 41: p. 627-32.
44. Johns, M.R., Johns, J.E., and Rudolph, V., Steam distillation of tea tree
(Melaleucaalternifolia) oil. Journal Sci. Food. Agric., 1992. 58: p. 49-53.
45. Brophy, J.J., et al., Gas chromatographicquality control for oil of melaleuca
terpinen-4-ol type (Australian tea tree). Journal Agric. Food Chem., 1989. 37: p.
1330-5.
46. Tea Tree Oil R&D Five Year Plan 2006-2011, 2006, Rural Industries Research
and Development Corporation.
47. Caelli, M., et al., Tea tree oil as an alternative topical decolonization agent for
methicillin-resistant Staphylococcus aureus. J Hosp Infect, 2000. 46(3): p. 236-
7.
48. Carson, C.F., et al., Melaleuca alternifolia (tea tree) oil gel (6%) for the
treatment of recurrent herpes labialis. J Antimicrob Chemother, 2001. 48(3): p.
450-1.
49. Vazquez, J.A. and Zawawi, A.A., Efficacy of alcohol-based and alcohol-free
melaleuca oral solution for the treatment of fluconazole-refractory
oropharyngeal candidiasis in patients with AIDS. HIV Clin Trials, 2002. 3(5): p.
379-85.
50. Carson, C.F., Hammer, K.A., and Riley, T.V., Melaleuca alternifolia (Tea Tree)
oil: a review of antimicrobial and other medicinal properties. Clin Microbiol
Rev, 2006. 19(1): p. 50-62.
51. Hammer, K.A., et al., A review of the toxicity of Melaleuca alternifolia (tea tree)
oil. Food Chem Toxicol, 2006. 44(5): p. 616-25.
52. Russell, M., Toxicology of tea tree oil. Tea Tree: The Genus Melaleuca, ed. I.
Southwell and R. Lowe. 1999, Amsterdam: Harwood Academic Publishers. 191-
201.
53. Morris, M.C., et al., Ingestion of tea tree oil (Melaleuca oil) by a 4-year-old boy.
Pediatr Emerg Care, 2003. 19(3): p. 169-71.
54. Mabberley, D.J., The Plant-Book (A portable dictionary of the higher plants).
1990, Cambridge: Cambridge University Press.
55. Jayaprakasha, G.K., Singh, R.P., and Sakariah, K.K., Antioxidant activity of
grape seed (Vitis vinifera) extracts on peroxidation models in vitro. Food
Chemistry, 2001. 73(3): p. 285-290.
56. Wijesekera, R.O., Jayewardene, A.L., and Fonseka, B.D., Varietal differences in
the constituents of citronella oil. Phytochemistry, 1973. 12: p. 2697-2704.
57. Leung, A.Y., Encyclopedia of Common Natural Ingredients Used in Food,
Drugs, and Cosmetics. 1980, New York: J. Wiley Sons.
58. Windholz, M., Merck Index: 10th ed. 1983, Rahway, NJ: Merck and Co., Inc.
59. Akhila, A., Biosynthesis of monoterpenes in Cymbopogon winterianus.
Phytochemistry, 1986. 25: p. 421-424.
60. Patra, N.K., Singh, H.P., and Kalra, A., Isolation and development of a geraniol
rich cultivar of citronella ( Cymbopogon winterianus ). Journal Med. Aromatic
Plant Sci., 1997. 19: p. 672-676.
61. Khadri, A., et al., Antioxidant and antiacetylcholinesterase activities of essential
oils from Cymbopogon schoenanthus L. Spreng. Determination of chemical
composition by GC–Mass Spectrometry and 13C-NMR. Food Chemistry, 2008.
109(3): p. 630–637.
62. American Herbal Products Association. and M. McGuffin, American Herbal
Products Association's botanical safety handbook : guidelines for the safe use
and labeling for herbs in commerce. 1997, Boca Raton, Fl.: CRC Press. 231 p.

Chapter 5 References
109
63. International Olive Council. Olive products market report summary, 2008,
Market Commentary.
64. Zampounis, V., Olive oil in the world market. Olive oil chemistry and
technology, ed. Boskou. D. 2006: AOCS Press.
65. Kelly, G.S., Squalene and its potential clinical uses. Altern Med Rev, 1999.
4(1): p. 29-36.
66. Publio, V. and Marzia, V., Virgin olive oil as a fundamental nutritional
component and skin protector. Clinics in Dermatology, 2009. 27: p. 159–165.
67. Soiland, E. and Drevon, C.A., The effect of very long-chain n-3 fatty acids on
immune function-related skin disease. Eur. J. Chim. Nutr., 1993. 47: p. 381-8.
68. Bloch, K.E., Sterol structure and membrane function. CRC Crit Rev Biochem,
1983. 14(1): p. 47-92.
69. Bendini, A., et al., Phenolic molecules in virgin olive oils: a survey of their
sensory properties, health effects, antioxidant activity and analytical methods.
An overview of the last decade. Molecules, 2007. 12(8): p. 1679-719.
70. Medeiros, D.M. and Hampton, M., Olive oil and health benefits. Handbook of
nutraceutical and functional foods, ed. Wildman. R.E.C. 2007, Boca Raton, FL:
CRC Press.
71. Servili, M., et al., Health and sensory properties of virgin olive oil hydrophilic
phenols: agronomic and technological aspects of production that affect their
occurrence in the oil. J Chromatogr A, 2004. 1054(1-2): p. 113-27.
72. Trichopoulos, D. and Lagiou, P., Mediterranean diet and overall mortality
differences in the European Union. Public Health Nutrition, 2007. 7(7): p. 949-
951.
73. Arief, B., Nazim, U.A. and An, W., Protective effect of topically applied olive
oil against photo-carcinogenesis following UVB exposure of mice.
Carcinogenesis, 2000. 21: p. 2085-90.
74. Santosa, M., Analysis of sensory and non-sensory factors mitigating consumer
behavior: A case study with extra virgin olive oil., in Food Science2010,
University of California: Davis.
75. Mathews-Roth, M.M., Photoprotection by carotenoids. Fed Proc, 1987. 46(5): p.
1890-3.
76. Kohno, Y., et al., Kinetic study of quenching reaction of singlet oxygen and
scavenging reaction of free radical by squalene in n-butanol. Biochim Biophys
Acta, 1995. 1256(1): p. 52-6.
77. Dennis, K.J. and Shibamoto, T., Production of malonaldehyde from squalene, a
major skin surface lipid, during UV-irradiation. Photochem Photobiol, 1989.
49(5): p. 711-6.
78. Cornelli, U. The antioxidant defence system in skin. in International Congress
on Nutricosmeceutical: A Challenge for the Future. 2002. Rome, Italy.
79. Rod, M., Primefact 227, Chemistry and quality of olive oil. 2006, State of New
South Wales: NSW Department of Primary Industries
80. Drew, M., Surfaces, interfaces, and colloids. Principles and Applications Vol.
2nd ed. 1999, Canada: John Wiley& Sons Inc.
81. Shinoda, K., Colloidal surfactants. some physicochemical properties. 1963,
New York: Academic Press.
82. Rosen, M.J., Surfactant and Interfacial Phenomena. Micelle Formation by
Surfactants. 2004, Hoboken, New Jersey: John Wiley & Sons Inc.
83. Miller, A.C. and Neogi, P. Interfacial phenomena. Equilib- rium and Dynamic
Effects. 1985, New York: Marcel Dekker, Inc.
84. Stokes, R.J. and Evans, D.F., Fundamentals of interfacial engineering. 1997,
New York: Wiley VCH, Inc.

Chapter 5 References
110
85. Bibette, J., Roux, D. and Poulingny, B., Creaming of emulsions: The role of
depletion forces induced by surfactant. J. Phys II, 1992. 44(2): p. 401–424.
86. Tadros, T.F., Surfactants in Agrochemicals. Surfactant Science Series. Vol. 54.
1995, New York: Marcel Dekker.
87. Wasan, D.T., Ginn, M.E. and Shah, D.O., Surfactants in chemical/process
engineering. Surfactant science series. 1988, New York: : M. Dekker. x, 555 p.
88. Rieger, M.M. and Rhein, L.D., Surfactants in Cosmetics. Vol. 2nd ed. 2002,
New York: Marcel Dekker.
89. Rosen, M.J. and National Science Foundation (U.S.), Surfactants in emerging
technologies. Surfactant science series. 1987, New York: : Dekker, M. x, 215 p.
90. Swisher, R.D., Surfactant biodegradation. 2nd ed. Surfactant science series.
1987, New York: : Dekker, M. xxiv, 1085 p.
91. Rosen, M.J., et al., The relationship of the environment effect of surfactant to
their interfacial properties. J. Surfactant Detergent, 1999. 2: p. 343-347.
92. Luk, Y.Y. and Abbott, N.L., Application of functional surfactants. Curr. Opin.
Colloid Interface Sci., 2002. 7: p. 267–75.
93. Lang, S., Biological amphiphiles (microbial surfactants). Curr. Opin. Colloid
Interface Sci., 2002. 7: p. 12–20.
94. Kitamoto, D., Toma, K. and Hato, M., Glycolipid-based nanomaterials.
Handbook of Nanostructured Biomaterials and Their Applications in
Nanobiotechnology, ed. Nalwa, H.S.. Vol. 1. 2005, California: American
Science Publishers.
95. TritonTMX-100 material safety datasheet:
http://www.sigmaaldrich.com/catalog/DisplayMSDSContent.do.
96. TritonTMX-45 material safety datasheet:
http://www.sigmaaldrich.com/catalog/DisplayMSDSContent.do.
97. E., P., Plantz, P. and Weigel, T., Use of Triton X100 Surfactant in Microtrac
Particle Size Instruments, in Particle Size Measuring Instrumentation2006,
Microtrac, Inc.
98. Tomšiˇc, M., et al., Ternary systems of nonionic surfactant Brij 35, water and
various simple alcohols: Structural investigations by small-angle X-ray
scattering and dynamic light scattering. Journal of Colloid and Interface Science
2006. 294: p. 194–211.
99. Suspension Stability; Why particle size, zeta potential and rheology are
important Application note: MRK1537-01.
100. Clayton, M.H. and Borden, R.C., Numerical modeling of emulsified oil
distribution in heterogeneous aquifers. Ground Water, 2009. 47(2): p. 246-58.
101. Kenneth, J., Emulsification and demulsification. Journal of Colloids and
surfaces, 1988. 29(1): p. 1-5.
102. Clayton, W., The theory of emulsions and their technical treatment. Vol. 4th ed.
1943, London: J. & A. Churchill Ltd.
103. Martin, A., Physical Pharmacy. Vol. 4th ed. 1993, Philadelphia: Lea & Febiger.
104. Garidel, P. and Hildebrand, A. Thermodynamic Properties of Association
Colloids. Journal of Thermal Analysis and Calorimetry, 2005. 82: p. 483-489.
105. Becher, P., Encyclopedia of emulsion technology. 1983, New York: Dekker, M.
106. Rang, M.J. and Miller, C.A., Spontaneous Emulsification of Oils Containing
Hydrocarbon, Nonionic Surfactant, and Oleyl Alcohol. J Colloid Interface Sci,
1999. 209(1): p. 179-192.
107. Davies, J.T. and Rideal, E.K. Interfacial phenomena. Disperse Systems and
Adhesion, ed. Willmer, H. 1961, New York: Academic Press. 474 p.

Chapter 5 References
111
108. Shinoda, K. and Arai, H., The Correlation between Phase Inversion
Temperature in Emulsion and Cloud Point in Solution of Nonionic Emulsifier. J.
Phys. Chem., 1964. 68: p. 3485.
109. Shinoda, K. and Saito, H., The Stability of O/W Type Emulsions as a Function of
Temperature and the HLB of Emulsifiers: The Emulsification by PIT Method. J.
Colloid Interface Sci., 1969. 30 p. 258.
110. Shinoda, K. and Kunieda, H., Conditions to Produce So-Called Microemulsions:
Factors to Increase the Mutual Solubility of Oil andWater by Solubilizer. J.
Colloid Interface Sci., 1973. 42: p. 381.
111. Salager, J.L., Phase Transformation and Emulsion Inversion on the Basis of
Catastrophe Theory. Encyclopedia of Emulsion Technology, ed. P. Becher. Vol.
3. 1988, New York: Marcel Dekker.
112. Salager, J.L., Perez-Sanchez, M. and Garcia, Y., Physicochemical Parameters
Influencing the Emulsion Drop Size. Colloid Polym. Sci., 1996. 274: p. 81.
113. Izquierdo, P., et al., Formation and Stability of Nano-Emulsions Prepared Using
the Phase Inversion Method. Langmuir, 2002. 18: p. 26.
114. Zambrano, N., et al., Emulsion Catastrophic Inversion from Abnormal to
Normal Morphology. Ind. Eng. Chem. Res., 2003. 42: p. 50.
115. Salager, J.L., et al., Using emulsion inversion in industrial processes. Adv
Colloid Interface Sci, 2004. 108-109: p. 259-72.
116. Salager, J.L., et al., Surfactant-Oil-Water Systems near the Affinity Inversion.
Part III: The Two Kinds of Emulsion Inversion. J. Dispersion Sci. Technol.,
1983. 4 p. 313.
117. Mira, I., et al., Emulsion Catastrophic Inversion from Abnormal to Normal
Morphology. Ind. Eng. Chem. Res., 2003. 42: p. 57.
118. Sajjadi, S., Jahanzad, F. and Yianneskis, M., Catastrophic Phase Inversion of
Abnormal Emulsions in the Vicinity of the Locus of Transitional Inversion.
Colloid and Surfaces A Physicochem. Eng. Aspects, 2004. 240: p. 149.
119. Förster, T., Schambil, F., and Von Rybinski, W., Production of Fine Dispersion
and Long-Term Stable Oil-in-Water Emulsions by the Phase Inversion
Temperature Method. J. Dispersion Sci. Technol., 1992. 13: p. 183.
120. Wadle, A., Förster, T. and Von Rybinski, W., Influence of the Microemulsion
Phase Structure on the Phase Inversion Temperature Emulsification of Polar
Oils. Colloid and Surfaces A Physicochem. Eng. Aspects, 1993. 76: p. 51.
121. Taisne, L. and Cabane, B., Emulsification and Ripening Following a
Temperature Quench. Langmuir, 1998. 14: p. 4744.
122. Salager, J.L. Macro Emulsions Stabilized by an Ethoxylated Fatty Alcohol and
an Alkyl Quat : Emulsion Type and Stability in View of the Phase Behavior. in
Proceedings of the 3rdWorld Congress on Emulsions 1-F-107. 2001. Lyon,
France.
123. Salager, J.L. Evolution of Emulsion Properties Along a Transitional Inversion
Produced by a Temperature Variation. in Proceedings of the 3rd Word
Congress on Emulsions 1-F-094. 2001. Lyon, France.
124. Izquierdo, P., et al., Phase behavior and nano-emulsion formation by the phase
inversion temperature method. Langmuir, 2004. 20(16): p. 6594-8.
125. Fernandez, P., et al., Nano-Emulsion Formation by Emulsion Phase Inversion.
Colloid and Surfaces A Physicochem. Eng. Aspects, 2004. 251: p. 53.
126. Groeneweg, F., et al., On the Mechanism of the Inversion of Emulsions. Chem.
Eng. Res. Des, 1998. 76: p. 55.
127. Klahn, J.K., et al., On the Escape Process During Phase Inversion of an
Emulsion. Colloid and Surfaces A. Physicochem. Eng. Aspects, 2002. 210: p.
167.

Chapter 5 References
112
128. Salager, J.L. Properties of Emulsions at the Onset of Catastrophic Phase
Inversion in the Normal to Abnormal Inversion. in Proceedings of the 3rd World
Congress on Emulsions 1-F-185. 2001. Lyon, France.
129. Glenn, E. The physics hypertextbook: Viscosity. 1998. 16.
130. Chaplin, M. Water structure and science: Hydrocolloid Rheology. 2008.
131. Zetasizer Nano Series User Manual. MAN0317. Vol. 11. 2004: Malvern
Instruments Ltd.
132. Larson, R.G., The Structure and Rheology of Complex Fluids. 1999, New York:
Oxford University Press.
133. Hunter, R.J., Zeta Potential in Colloid Science: Principles and Applications.
1988, UK: Academic Press.
134. Brümmer, R., Rheology Essentials of Cosmetic and Food Emulsions. 2006,
Verlag: Springer Laboratory.
135. Morrison, F.A., Understanding rheology. Topics in chemical engineering. 2001,
New York ; Oxford: Oxford University Press. xiii, 545 p.
136. Cowie, J.M.G., Polymers : chemistry and physics of modern materials. 2nd ed.
1991, Glasgow, New York: Blackie; Chapman and Hall. xi , 436 p.
137. Sperling, L.H., Introduction to physical polymer science. 1986, New York: :
Wiley. xxi, 439 p.
138. Menrad, K.P., Dynamic Mechanical Analysis. 1999, Florida: CRC Press.
139. Tan, C.K., Misran, M. and Niraula, B., Rheology properties of dodecyl-beta-D-
maltoside stabilized mineral oil-in water emulsion. Colloids and Surfaces A-
Physiochem. and Eng. Asp., 2003. 231(1-3): p. 159-172.
140. Hetzel, F., et al., Dynamic mechanical freezing points of cosmetic o/w emulsions
and their stability at low temperatures. Applied Rheology 2000. 10(3): p. 114-
118.
141. Brümmer, R., et al., Rheological Swing Test to Predict the Temperature Stability
of Cosmetic Emulsions: Verlag für chemische Industrie, H. Ziolkowsky GmbH,
Augsburg, Germany, in Proceedings XXI IFSCC International Congress
20002000: Berlin. p. 476.
142. Brümmer, R. and Godersky, S., Rheological studies to objectify sensations
occurring when cosmetic emulsions are applied to the skin. Colloids and
Surfaces A – Physiochemical and Engineering Aspects, 1999. 152(1,2): p. 89.
143. Adams, R.P., Identification of essential oil component by GC-MS. 1995, Carlo
Stream II: Allured Publication Corp.
144. Merrington, A.C., Viscometry. 1949, London: Arnold.
145. Dinsdale, A. and Moore, F., Viscosity and its measurement. 1962, London:
Chapman and Hall.
146. Klofutar, C., Rudan-Tasič, D. and Romih, K., Densities and thermal expansion
coefficients of some vegetable oil. Acta chim.Slov, 1997. 44: p. 45-55.
147. Abramovič, H. and Klofutar, C., The temperature dependence of dynamic
viscosity for some vegetable oils. Acta Chim. Slov. , 1998. 45(1): p. 69-77.
148. Lawson, H., Food, Oils and Fats. 1995, New York Chapman & Hall. 35.
149. Bauer, K., Garbe, D. and Surburg, H., Ylang–Ylang oil. Common Fragrance and
Flavor Materials: Preparation. Vol. 3rd ed. 1997, Weinheim, Germany:
Properties and Uses Wiley-VCH, Verlag GmbH.
150. Fuselli, S.R., et al., [Inhibition of Paenibacillus larvae employing a mixture of
essential oils and thymol]. Rev Argent Microbiol, 2006. 38(2): p. 89-92.
151. Ferreira, M.S.C. and Fonteles, M.C., Aspectos etnobotânicos e farmacológicos
do Cymbopogon citratus Stapf (capim limão). Rev. Bras. Farm, 1989. 70 (4): p.
94–97.

Chapter 5 References
113
152. Goulet, O., et al., Long-term efficacy and safety of a new olive oil-based
intravenous fat emulsion in pediatric patients: a double-blind randomized study.
Am J Clin Nutr, 1999. 70(3): p. 338-45.
153. Gobel, Y., et al., Parenteral fat emulsions based on olive and soybean oils: a
randomized clinical trial in preterm infants. J Pediatr Gastroenterol Nutr, 2003.
37(2): p. 161-7.
154. Hanna, S.A., Quality Assurance. Pharmaceutical Dosage Forms: Disperse
Systems, ed. Lieberman, H.A., Rieger, M.M. and Banker, G.S. 1998, New York:
Informa Health Care.
155. Orawon, C., et al., Analysis of sudan I, sudan II, sudan III, and sudan IV in food
by HPLC with electrochemical detection: Comparison of glassy carbon
electrode with carbon nanotube-ionic liquid gel modified electrode. Food
Chemistry, 2008. 109: p. 876–882.
156. Senthilkumaar, S., Kalaamani, P. and Subburaam, C.V., Liquid phase
adsorption of Crystal violet onto activated carbons derived from male flowers of
coconut tree. J Hazard Mater, 2006. 136(3): p. 800-8.
157. Au, W., et al., Cytogenetic toxicity of gentian violet and crystal violet on
mammalian cells in vitro. Mutat Res, 1978. 58(2-3): p. 269-76.
158. Leal-Calderon, F., et al., Emulsion science, 2007, Springer,: New York. p. xi,
227 p.
159. Dickinson, E., An introduction to food colloids. 1992, Oxford: Oxford
University Press.
160. Peña, A. and Hirasaki, G.J. Emulsions and Emulsion Stability, ed. Sjöblom, J.
2006, Boca Raton, FL: CRC.
161. Becher, P., Emulsions : theory and practice. 3rd ed. 2001, Washington, DC:
American Chemical Society : Oxford University Press. 513 p.
162. Schramm, L.L., Emulsions, Foams, and Suspensions. Fundamentals and
Applications. 2005, Weinheim Great Britain: Wiley–VCH.
163. Dukhin, A.S., Dukhin, S.S. and Goetz, P.J., Gravity as a factor of aggregative
stability and coagulation. Adv Colloid Interface Sci, 2007. 134-135: p. 35-71.
164. Derjaguin, B. and Landau, L., Theory of the stability of strongly charged
lyophobic sols and of the adhesion of strongly charged particles in solutions of
electrolytes. Acta Physico Chemica URSS, 1941. 14: p. 633.
165. Verwey, E.J.W. and Overbeek, J.T.G., Theory of the stability of lyophobic
colloids. 1948, Amsterdam: Elsevier.
166. McClements, D.J., Kinetics, in Food Emulsions. Principles, Practice, and
Techniques. 1999, Boca Raton: CRC Press LLC.
167. Patist, A., Axelberd, T. and Shah, D.O., Effect of Long Chain Alcohols on
Micellar Relaxation Time and Foaming Properties of Sodium Dodecyl Sulfate
Solutions. J Colloid Interface Sci, 1998. 208(1): p. 259-265.
168. Shiao, S.Y., et al., Chain lenght compatibility effects in mixed surfactant systems
for technological applications. Advances in Colloid and Interface Science, 1998.
74: p. 1-29.
169. Monica, A., et al., Effect of long-chain alcohols on SDS partitioning to the
oil/water interface of emulsions and on droplet size. Journal of Colloid and
Interface Science 2007. 315(1): p. 307-312.
170. Chanamai, R. and McClements, D.J., Dependence of creaming and rheology of
monodisperse oil-in-water emulsions on droplet size and concentration. Colloids
and Surfaces A: Physicochemical and Engineering Aspects, 2000. 172: p. 79-86.
171. Friberg, S. and Larsson, K., Food emulsions. 3rd ed. Food science and
technology. 1997, New York: Marcel Dekker. xii, 582 p.

Chapter 5 References
114
172. Friberg, S.E., Emulsion Stability, in Emulsions. A fundamental and Practical
Approach, ed. Sjöblom, J. 1992, Dordrecht: Kluwer Academic Publishers.
173. Paraskevopoulou, D., Boskou, D., and Paraskevopoulou, A., Oxidative stability
of olive oil-lemon juice salad dressings stabilized with polysaccharides. Food
Chemistry, 2007. 101 p. 1197-1204.
174. Schubert, H., Physikalisch-chemische Grundlagen der Stabilität von o/w
Emulsionen: Hochschulkurs Emulgiertechnik 1996, Germany: Universität
Karlsruhe.
175. Gleissle, W., Stresses in polymer melts at the beginning of flow instabilities
(melt fracture) in cylindrical capillaries. Rheologica Acta, 1982. 21: p. 484-487.
176. Clasen, C. and Kulicke, W.M., A convenient way of interpreting steady shear
rheo-optical data of semi-dilute polymer solutions. Rheologica Acta 2001. 40: p.
74–85.
177. Ekong, E.A., et al., Rheological Additives and Stabilizer. Handbook of Cosmetic
Science and Technology, ed. Barel, A.O., Paye, M. and Maibach, H.I. 2001,
New York: Marcel Dekker.
178. Simeone, M., Alfani, A. and Guido, S., Phase diagram, rheology and interfacial
tension of aqueous mixtures of Na-caseinate and Na-alginate. Food
Hydrocolloids, 2004. 18 p. 463-470.
179. Thaiudom, S. and Goff, H.D., Effect of k-Carrageenan on Milk Protein
Polysaccharide mixtures. International Dairy Journal, 2003. 13: p. 763-771.
180. Tadros, T., Application of Rheology for Assessment and Prediction of Long-
Term Physical Stability of Emulsions. Advances in Colloid and Interface
Science, 2004. 108-109 p. 227-258.
181. Metzger, T., Lohnt sich Rheologie? . 2001, Stuttgart: Physica Messtechnik
GmbH.
182. Kulicke, W.M., Fließverhalten von Stoffen und Stoffgemischen. 1986, Basel:
Hüthig &Wepf Verlag.
183. McClements, D.J., Flocculation, in Food Emulsions. : Principles, Practice, and
Techniques. 1999, Boca Raton: CRC Press LLC.
184. Walstra, P., Food Emulsions and Foams, ed. Dickinson, E. 1987, London: Royal
Society of Chemistry.
185. Arup Nandi, Anurag Mehra, and Khakhar, D.V., Coalescence in a Surfactant-
less Emulsion under Simple Shear Flow. AIChE Journal, 2006. 52(3): p. 885-
894.
186. Pfandl, W. and Schwarzl, F.R., Relationbetween Rheological Properties and the
Molecular Weight Distribution of a Technical Polystyrene. Colloid & Polym.
Sci., 1985. 263: p. 328.
187. Barnes, H.A., A Handbook of Elementary Rheology. 2000: University of Wales,
Institute of Non-Newtonian Fluid Mechanics.
188. Fan, Y., Simon, S. and Sjöblom, J., Interfacial shear rheology of asphaltenes at
oil–water interface and its relation to emulsion stability: Influence of
concentration, solvent aromaticity and nonionic surfactant. Colloids and
Surfaces A: Physicochem. Eng. Aspects, 2010. 366(1): p. 120-128.
189. Paraskevopoulou, A., et al., Small deformation properties of model salad
dressings prepared with reduced cholesterol egg yolk. Journal of Texture
Studies, 1997. 28(2): p. 221-237.