stakeholder presentation stakeholder presentation - 10 mar 2017.pdf · total fixed assets rab ......
TRANSCRIPT

STAKEHOLDER PRESENTATIONMARCH 2017
AIRPORTS COMPANY SOUTH AFRICA 2
CONTENTS
3 OVERVIEW
8 GOVERNANCE
10 ECONOMIC REGULATION
15 FINANCIAL PLAN
24 FUNDING PLAN
28 KEY TAKEOUTS

OVERVIEW
AIRPORTS COMPANY SOUTH AFRICA 4
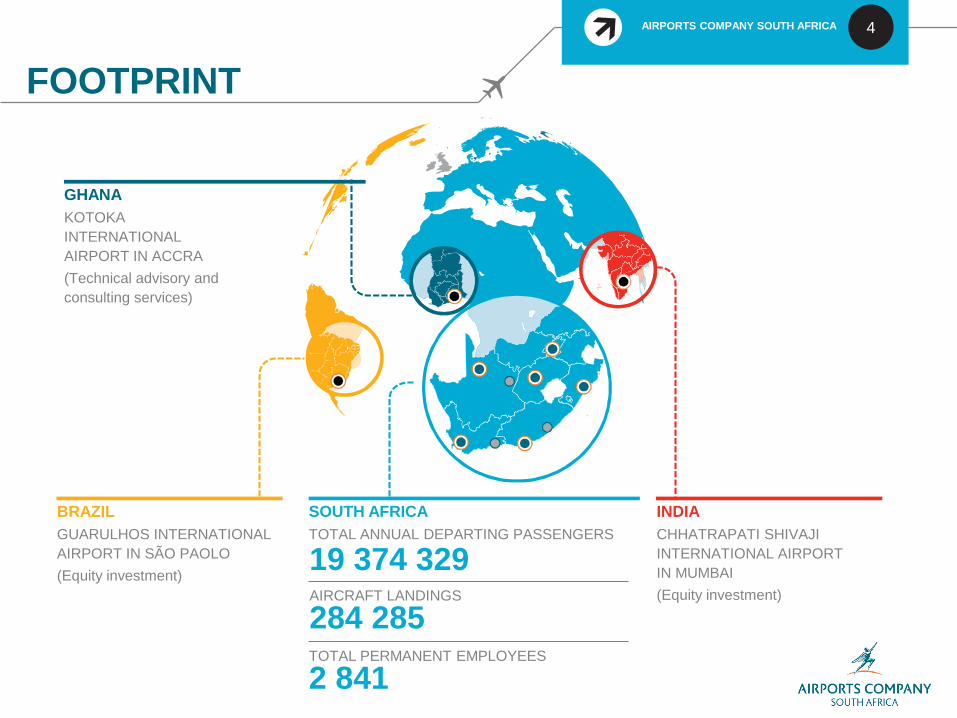
FOOTPRINT
BRAZIL
GUARULHOS INTERNATIONAL
AIRPORT IN SÃO PAOLO
(Equity investment)
INDIA
CHHATRAPATI SHIVAJI
INTERNATIONAL AIRPORT
IN MUMBAI
(Equity investment)
GHANA
KOTOKA
INTERNATIONAL
AIRPORT IN ACCRA
(Technical advisory and
consulting services)
SOUTH AFRICA
TOTAL ANNUAL DEPARTING PASSENGERS
19 374 329AIRCRAFT LANDINGS
284 285TOTAL PERMANENT EMPLOYEES
2 841

AIRPORTS COMPANY SOUTH AFRICA 5
VISION 2025
TO BE THE MOST SOUGHT-AFTER PARTNER IN THE WORLD
FOR THE PROVISION OF SUSTAINABLE AIRPORT MANAGEMENT SOLUTIONS BY 2025
RUN AIRPORTS
DEVELOP AIRPORTS
GROW OUR
FOOTPRINT
AIRPORTS COMPANY SOUTH AFRICA 6
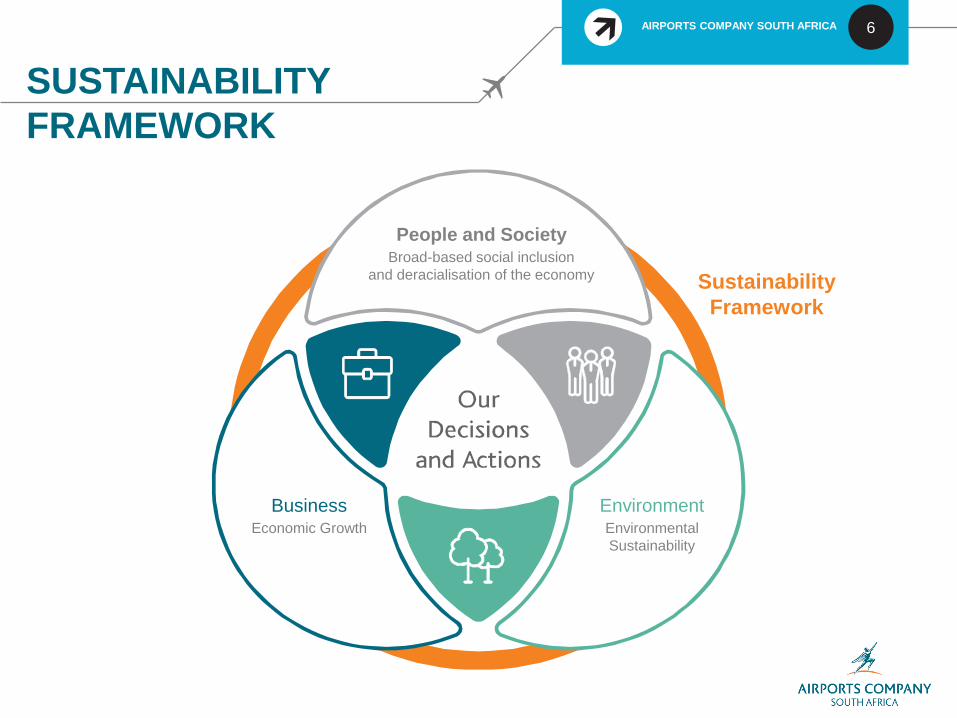
SUSTAINABILITY
FRAMEWORK
Sustainability
Framework
People and SocietyBroad-based social inclusion
and deracialisation of the economy
BusinessEconomic Growth
EnvironmentEnvironmental
Sustainability
AIRPORTS COMPANY SOUTH AFRICA 7
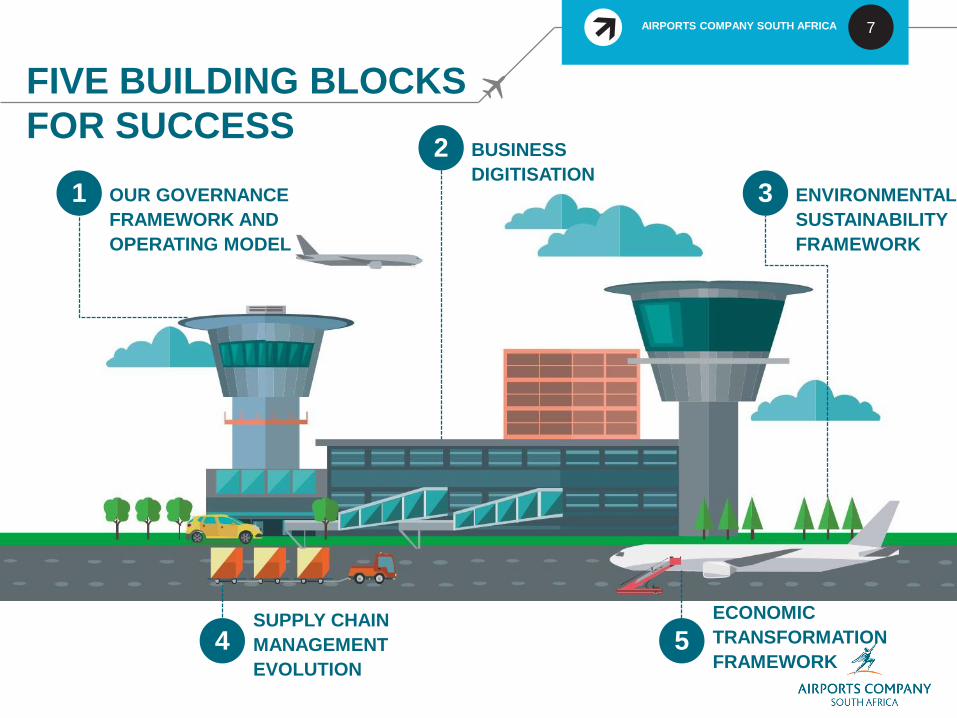
FIVE BUILDING BLOCKS
FOR SUCCESS
1 OUR GOVERNANCE
FRAMEWORK AND
OPERATING MODEL
2 BUSINESS
DIGITISATION
4SUPPLY CHAIN
MANAGEMENT
EVOLUTION
3 ENVIRONMENTAL
SUSTAINABILITY
FRAMEWORK
5ECONOMIC
TRANSFORMATION
FRAMEWORK

GOVERNANCE

AIRPORTS COMPANY SOUTH AFRICA 9
GOVERNANCE
STRUCTURE ACSA Board
Audit & Risk Committee
Chief Audit Executive
Board Investment Committee
Executive Committee
Chief Financial Officer*
Chief Executive Officer*
Chief Strategy and Performance
Officer
Chief Financial Officer
Chief of StaffGroup Manager Transformation
Company Secretary
Remuneration and Nominations
Committee
Social & Ethics Committee
Board Regulation Committee
Chief Operating Officer
Group Executive Business
Development
Group Executive Human Resources
Group Executive Corporate Affairs
Group Executive Governance and
Assurance
Group Executive Airports
Management
Group Executive Infrastructure
Asset Mngt
Group Executive Technical Services
and Solutions
Chief Information Officer
General Manager O.R. Tambo International Airport
General Manager Cape Town International Airport
General Manager King Shaka International Airport
General Manager Regional Airports * Executive Director

ECONOMIC REGULATION
AIRPORTS COMPANY SOUTH AFRICA 11
ECONOMIC
REGULATORY
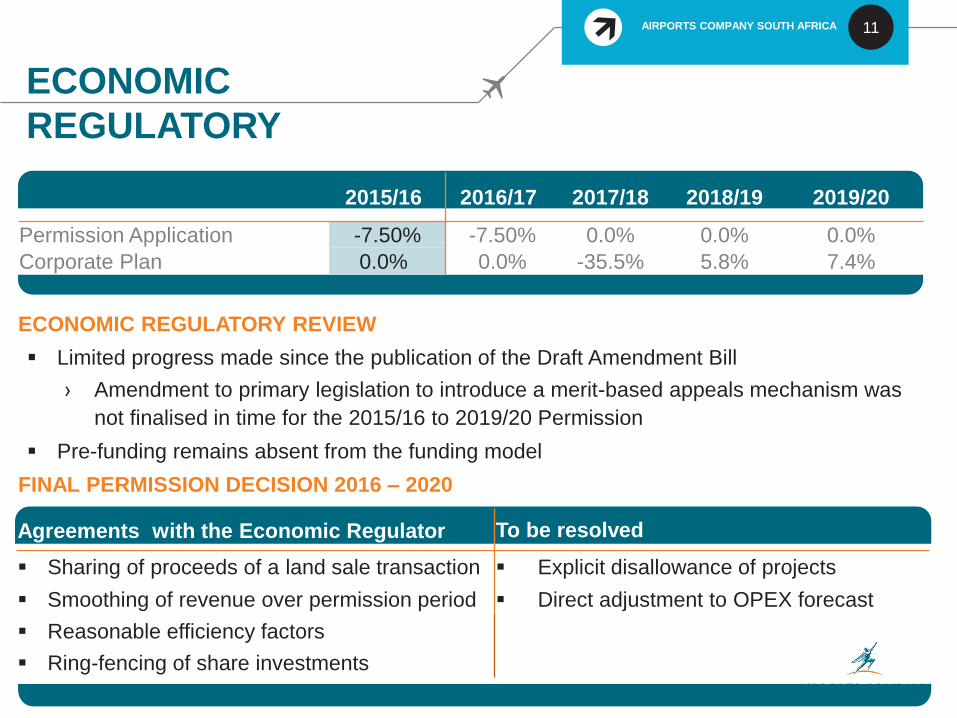
ECONOMIC REGULATORY REVIEW
Limited progress made since the publication of the Draft Amendment Bill
› Amendment to primary legislation to introduce a merit-based appeals mechanism was
not finalised in time for the 2015/16 to 2019/20 Permission
Pre-funding remains absent from the funding model
FINAL PERMISSION DECISION 2016 – 2020
2015/16 2016/17 2017/18 2018/19 2019/20
Permission Application -7.50% -7.50% 0.0% 0.0% 0.0%
Corporate Plan 0.0% 0.0% -35.5% 5.8% 7.4%
Agreements with the Economic Regulator To be resolved
Sharing of proceeds of a land sale transaction Explicit disallowance of projects
Smoothing of revenue over permission period Direct adjustment to OPEX forecast
Reasonable efficiency factors
Ring-fencing of share investments
AIRPORTS COMPANY SOUTH AFRICA 12
RETURNS VS
REGULATORY WACC
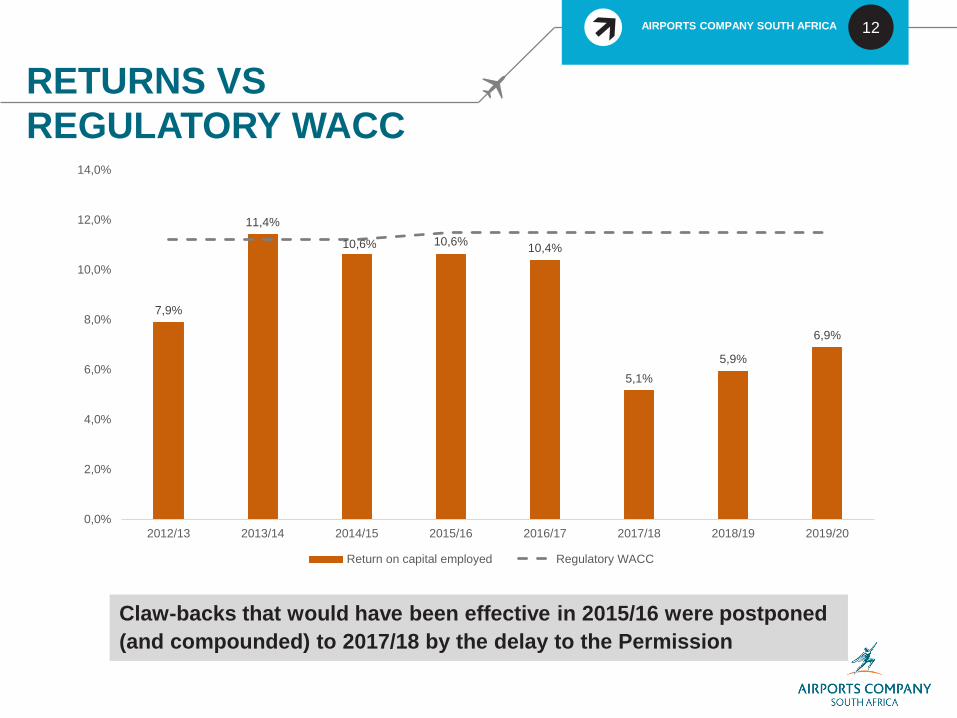
7,9%
11,4%
10,6% 10,6%10,4%
5,1%
5,9%
6,9%
0,0%
2,0%
4,0%
6,0%
8,0%
10,0%
12,0%
14,0%
2012/13 2013/14 2014/15 2015/16 2016/17 2017/18 2018/19 2019/20
Return on capital employed Regulatory WACC
Claw-backs that would have been effective in 2015/16 were postponed
(and compounded) to 2017/18 by the delay to the Permission

AIRPORTS COMPANY SOUTH AFRICA 13
TOTAL ASSETS VS RAB
0
5000
10000
15000
20000
25000
30000
2012/13 2013/14 2014/15 2015/16 2016/17 2017/18 2018/19 2019/20
R m
illio
n
Total Fixed Assets RAB
Difference between RAB & Total Fixed Assets attributable to the following:
› Work in progress
› Assets restatement due to IFRS

FINANCIAL PLAN
AIRPORTS COMPANY SOUTH AFRICA 15
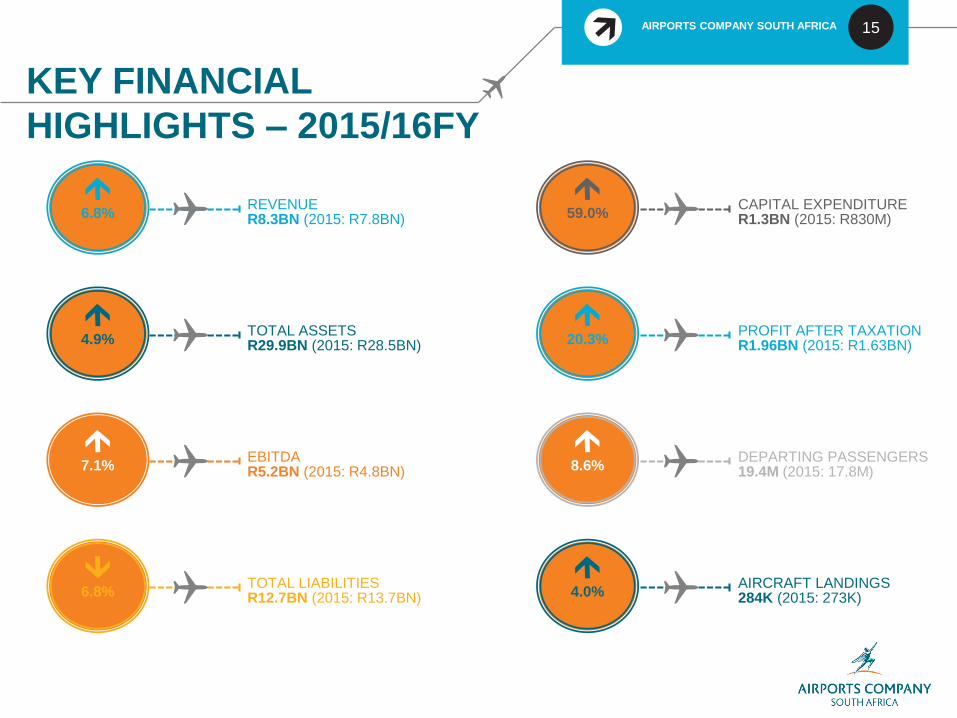
KEY FINANCIAL
HIGHLIGHTS – 2015/16FY
6.8%REVENUER8.3BN (2015: R7.8BN)
4.9%TOTAL ASSETSR29.9BN (2015: R28.5BN)
7.1%EBITDAR5.2BN (2015: R4.8BN)
6.8%TOTAL LIABILITIESR12.7BN (2015: R13.7BN)
59.0%CAPITAL EXPENDITURER1.3BN (2015: R830M)
20.3%PROFIT AFTER TAXATIONR1.96BN (2015: R1.63BN)
4.0%AIRCRAFT LANDINGS284K (2015: 273K)
8.6%DEPARTING PASSENGERS19.4M (2015: 17.8M)
AIRPORTS COMPANY SOUTH AFRICA 16
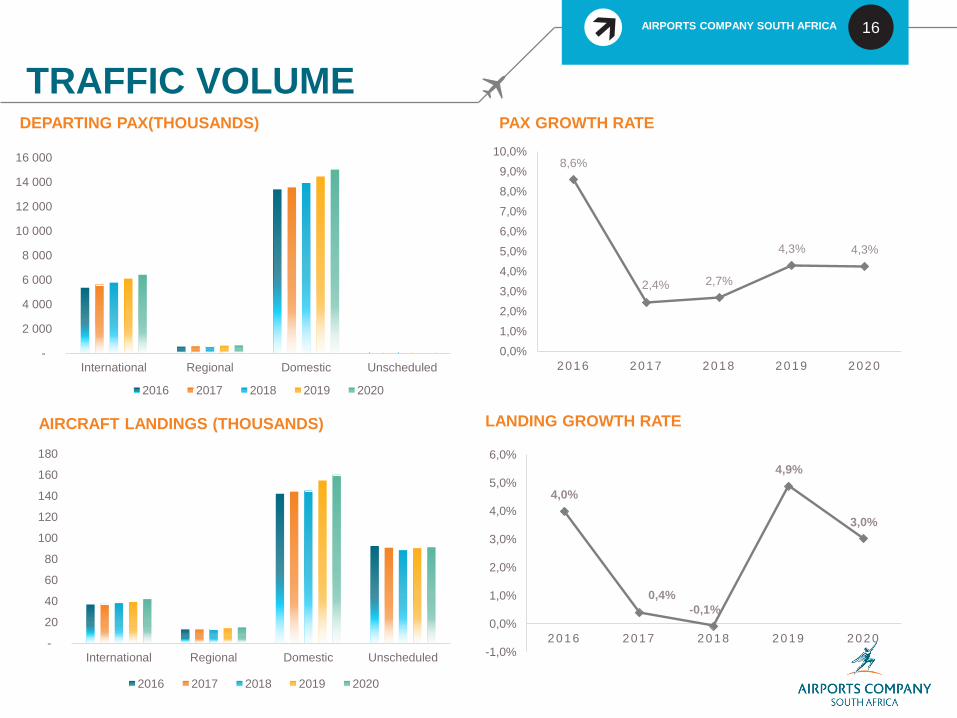
TRAFFIC VOLUME
-
2 000
4 000
6 000
8 000
10 000
12 000
14 000
16 000
International Regional Domestic Unscheduled
2016 2017 2018 2019 2020
-
20
40
60
80
100
120
140
160
180
International Regional Domestic Unscheduled
2016 2017 2018 2019 2020
8,6%
2,4% 2,7%
4,3% 4,3%
0,0%
1,0%
2,0%
3,0%
4,0%
5,0%
6,0%
7,0%
8,0%
9,0%
10,0%
2016 2017 2018 2019 2020
4,0%
0,4%
-0,1%
4,9%
3,0%
-1,0%
0,0%
1,0%
2,0%
3,0%
4,0%
5,0%
6,0%
2016 2017 2018 2019 2020
DEPARTING PAX(THOUSANDS)
AIRCRAFT LANDINGS (THOUSANDS)
PAX GROWTH RATE
LANDING GROWTH RATE

AIRPORTS COMPANY SOUTH AFRICA 17
PROJECTED FINANCIAL
INDICATORS
8 647
7 042
7 703
8 448
4 964
3 062 3 357
3 840
4 262
2 915
3 237 2 835
1 949
815 1 044
1 502
10,4%
4,2%
5,1%
6,8%
5,1%
5,9%
6,9%
-1,0%
1,0%
3,0%
5,0%
7,0%
9,0%
11,0%
13,0%
-
1 000
2 000
3 000
4 000
5 000
6 000
7 000
8 000
9 000
10 000
2017 2018 2019 2020
R m
illio
n
Total revenue EBITDA Cash generated Net profit Return on equity Return on capital employed

AIRPORTS COMPANY SOUTH AFRICA 18
REVENUE ANALYSIS
38% 38%
50% 49% 48%
0%
10%
20%
30%
40%
50%
60%
-
1 000
2 000
3 000
4 000
5 000
6 000
7 000
8 000
9 000
10 000
2016 2017 2018 2019 2020
R m
illio
n
Aeronautical revenue Non-aeronautical revenue Non-aeronautical %
Total revenue is based on the total revenue allowance as permitted by
the economic regulator

AIRPORTS COMPANY SOUTH AFRICA 19
1 111 1 178 1 267 1 386 1 497
226 236255
268287536
549580
612646
188180
190216
208688
729783
864940
27 12
59
65
77
-
500
1 000
1 500
2 000
2 500
3 000
3 500
4 000
Actual Forecast Budget Plan Plan
2016 2017 2018 2019 2020
R m
illio
n
Retail Car rental Car parking Advertising Property Advisory services
NON-AERONAUTICAL
REVENUE
Growth in international passengers at Cape Town International Airport reduced the
yield per passenger for retail revenue in the 2016/17 forecast
AIRPORTS COMPANY SOUTH AFRICA 20
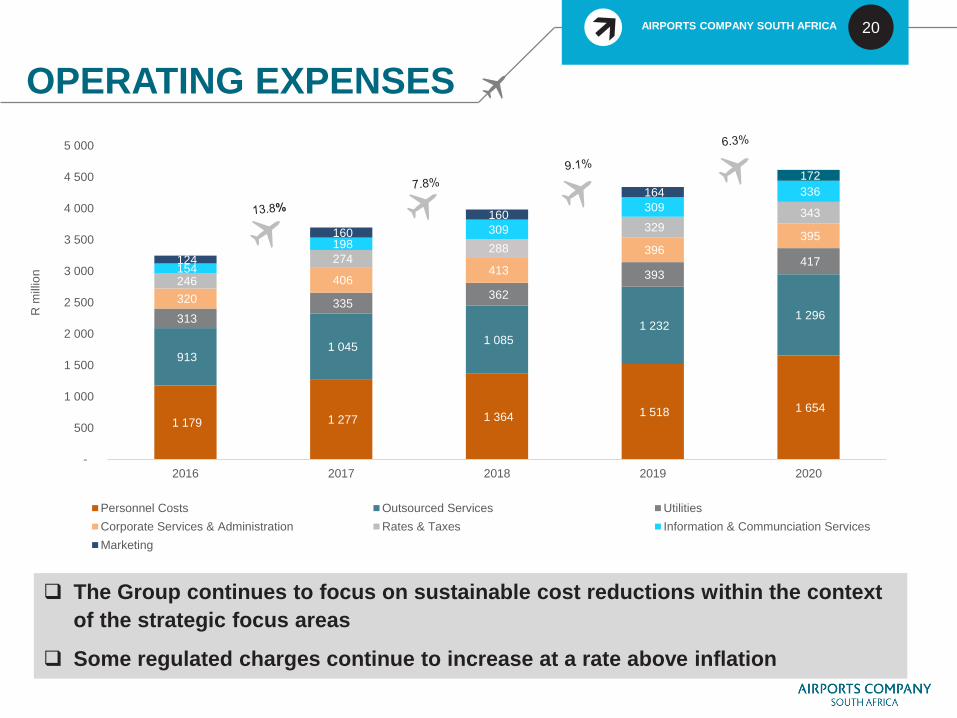
1 179 1 277 1 364 1 518 1 654
913 1 045
1 085
1 232 1 296 313
335 362
393 417
320
406 413
396 395
246
274 288
329
343
154
198
309
309
336
124
160
160
164
172
-
500
1 000
1 500
2 000
2 500
3 000
3 500
4 000
4 500
5 000
2016 2017 2018 2019 2020
R m
illio
n
Personnel Costs Outsourced Services Utilities
Corporate Services & Administration Rates & Taxes Information & Communciation Services
Marketing
OPERATING EXPENSES
The Group continues to focus on sustainable cost reductions within the context
of the strategic focus areas
Some regulated charges continue to increase at a rate above inflation

AIRPORTS COMPANY SOUTH AFRICA 21
CAPITAL EXPENDITURE
156
514
768
30
64
2
189
286
268
315
977
1 060
67
112
133
757
1 953
2 232
-
500
1 000
1 500
2 000
2 500
2018 2019 2020
R m
illio
n
Capacity Commercial
Efficiency & Technology Refurbishment & Replacement
Statutory & Compliance
CAPEX SPENT – 2014 TO 2017 PROJECTED CAPEX – 2018 TO 2020
2018 to 2020
Capex Budget amounts to
R4.9 billion
928
830
1 321
966
-
200
400
600
800
1 000
1 200
1 400
2014 2015 2016 2017F
R m
illio
n
AIRPORTS COMPANY SOUTH AFRICA 22
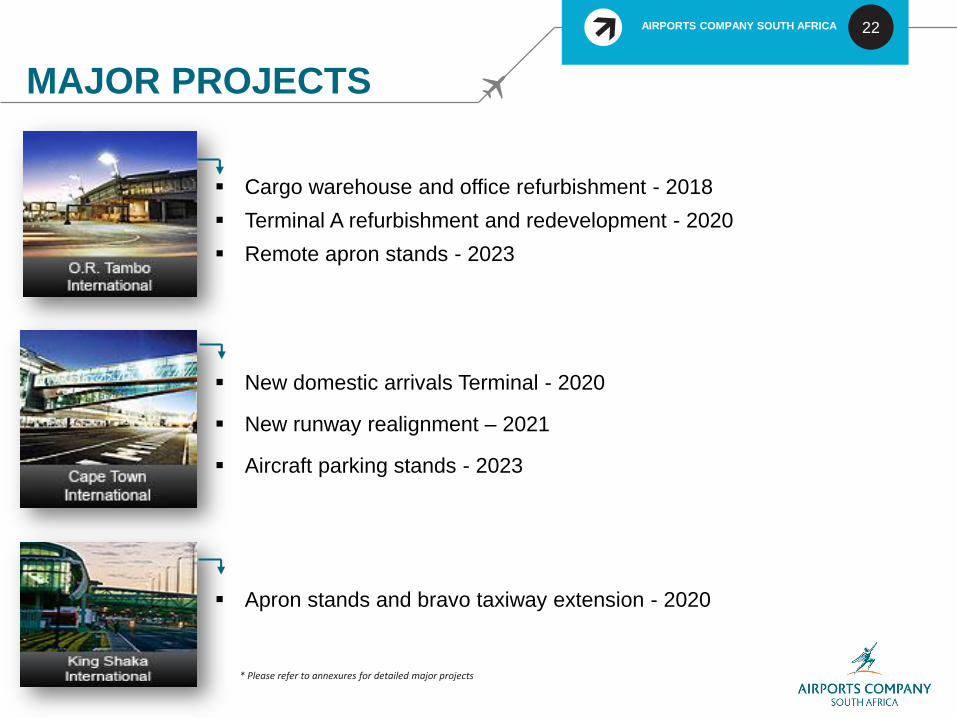
MAJOR PROJECTS
Cargo warehouse and office refurbishment - 2018
Terminal A refurbishment and redevelopment - 2020
Remote apron stands - 2023
New domestic arrivals Terminal - 2020
New runway realignment – 2021
Aircraft parking stands - 2023
KING SHAKA
Apron stands and bravo taxiway extension - 2020
* Please refer to annexures for detailed major projects

FUNDING PLAN

AIRPORTS COMPANY SOUTH AFRICA 24
DEBT EVOLUTION &
MATURITY PROFILE
(5)
0
5
10
15
20
200
3
200
4
200
5
200
6
200
7
200
8
200
9
201
0
201
1
201
2
201
3
201
4
201
5
201
6
YT
D
Change in debt levels Debt levels
Credit rating
agency Date
Long-term national
scale Global scale Outlook
10 May 2016 Aa1.za Baa2 Negative
DEBT MATURITY PROFILE (R’BILLION) EVOLUTION OF DEBT (R’BILLION)
17
10
0,0
0,5
1,0
1,5
2,0
2,5
3,0
3,5
4,0
4,5
2017 2018 2019 2020 2021 2022 2023 2024 2025 2026 2029 2030 2031
Fixed rate bonds Inflation linked bonds
Bank Loans DFI Loans (INCA & AFD)
Inflation linked bond
AIRPORTS COMPANY SOUTH AFRICA 25
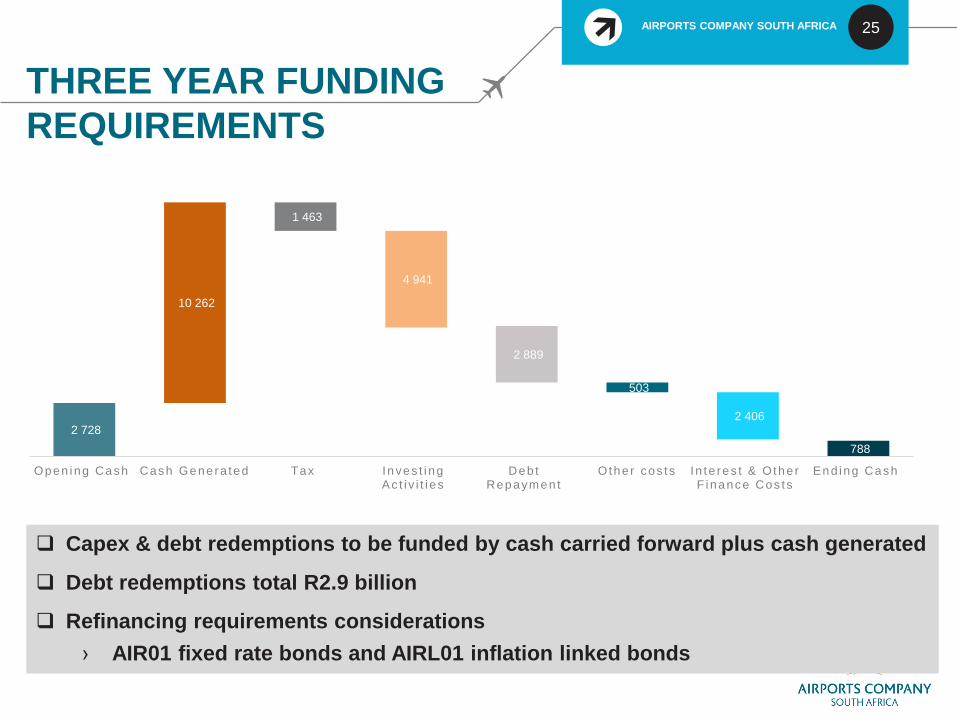
Capex & debt redemptions to be funded by cash carried forward plus cash generated
Debt redemptions total R2.9 billion
Refinancing requirements considerations
› AIR01 fixed rate bonds and AIRL01 inflation linked bonds
THREE YEAR FUNDING
REQUIREMENTS
2 728
10 262
1 463
4 941
2 889
503
2 406
788
Open ing Cash Cash Gene ra ted Tax Inves t i ng Ac t i v i t i es
Deb t Repaymen t
O the r cos t s In te res t & Othe r F i nance Cos ts
End ing Cash
AIRPORTS COMPANY SOUTH AFRICA 26
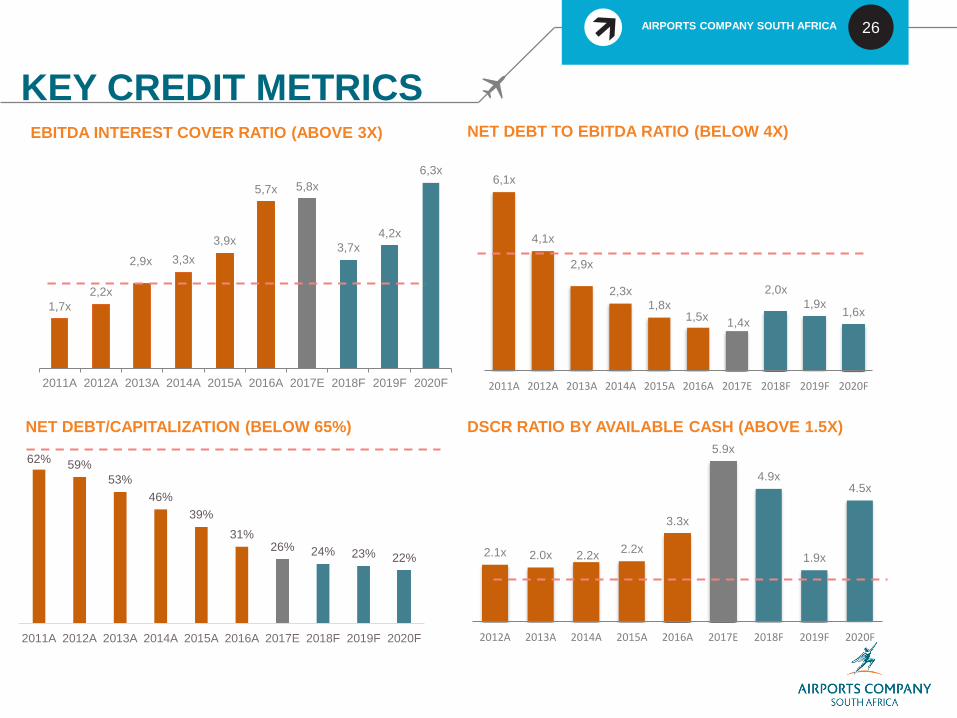
EBITDA INTEREST COVER RATIO (ABOVE 3X) NET DEBT TO EBITDA RATIO (BELOW 4X)
DSCR RATIO BY AVAILABLE CASH (ABOVE 1.5X)
KEY CREDIT METRICS
1,7x
2,2x
2,9x 3,3x
3,9x
5,7x 5,8x
3,7x
4,2x
6,3x
2011A 2012A 2013A 2014A 2015A 2016A 2017E 2018F 2019F 2020F
6,1x
4,1x
2,9x
2,3x1,8x
1,5x1,4x
2,0x
1,9x1,6x
2011A 2012A 2013A 2014A 2015A 2016A 2017E 2018F 2019F 2020F
2.1x 2.0x 2.2x2.2x
3.3x
5.9x
4.9x
1.9x
4.5x
2012A 2013A 2014A 2015A 2016A 2017E 2018F 2019F 2020F
NET DEBT/CAPITALIZATION (BELOW 65%)
62%59%
53%
46%
39%
31%26% 24% 23% 22%
2011A 2012A 2013A 2014A 2015A 2016A 2017E 2018F 2019F 2020F

27KEY TAKEOUTS

AIRPORTS COMPANY SOUTH AFRICA 28
KEY TAKEOUTS
STRATEGY THAT IS AIMED AT LONG TERM SUSTAINABLE VALUE CREATION
CONTINUOUSLY IMPROVING THE PASSENGER EXPERIENCE
IDENTIFYING AND SECURING NEW BUSINESS OPPORTUNITIES
STRENGTHENING REPUTATION AND CONTINUING TO BUILD WIN-WIN
PARTNERSHIPS WITH OUR STAKEHOLDERS
MANAGING AND DEVELOPING A HIGH PERFORMANCE TEAM
MOVING TOWARDS A DIGITIZED BUSINESS
ACCELERATING SUSTAINABILITY AND TRANSFORMATION PROGRAMMES
REDUCING ENVIRONMENTAL IMPACT
29ANNEXURE:
MAJOR PROJECTS

AIRPORTS COMPANY SOUTH AFRICA 30
A. ORTIA
TERMINAL A REFURBISHMENT
BUSSING GATES
ADDITIONAL BAGGAGE CAROUSEL IN TERMINAL A
RAS

AIRPORTS COMPANY SOUTH AFRICA 31
B. CTIA
New
Realigned
Runway
Existing
Runway
CTIA RUNWAY CTIA APRONS
DOMESTIC ARRIVALS
New
Domestic
Arrivals
TERMINAL 2
Terminal 2
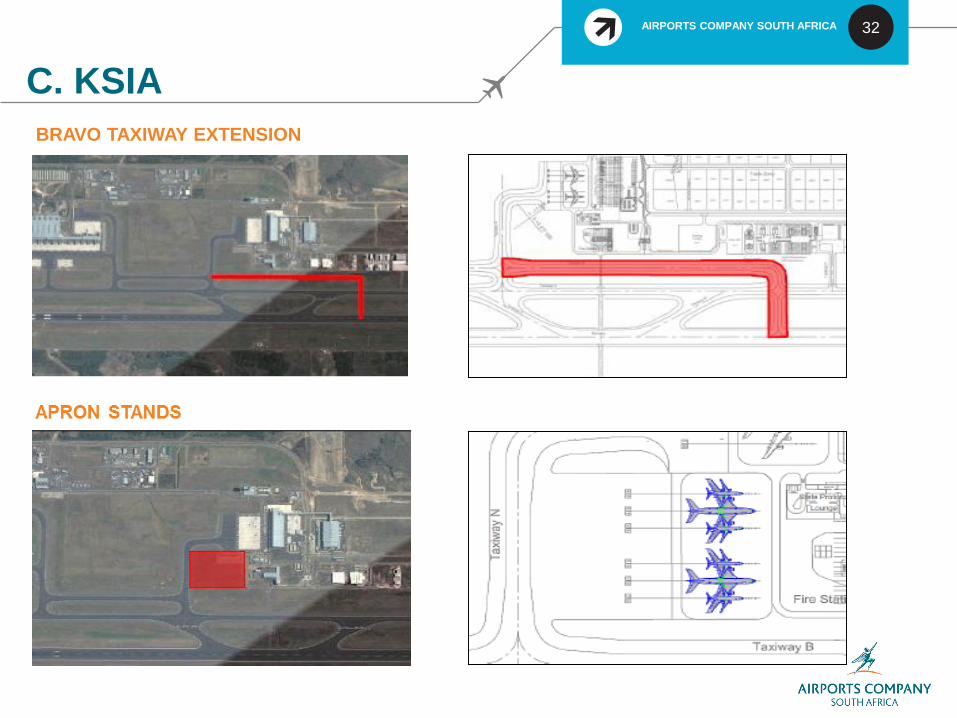
AIRPORTS COMPANY SOUTH AFRICA 32
C. KSIA
BRAVO TAXIWAY EXTENSION

AIRPORTS COMPANY SOUTH AFRICA 33
DISCLAIMER
The information contained in this presentation is confidential, and is intended solely for this presentation.
This presentation may contain information proprietary to the Airports Company South Africa SOC Limited
(“the Company”), and may not be reproduced or disseminated in whole or in part without the Company's
written consent. The Company is not acting as your adviser in any transaction that may be proposed herein,
and this presentation does not constitute a recommendation, guidance or proposal to enter into any
transaction. Any decision to enter into a transaction should be made on the basis of information contained
within an offering circular, programme memorandum or prospectus published in relation to such an offering.
The Company does not guarantee or otherwise assure the expected results of any transaction as envisaged
in this presentation. You shall not be entitled to place any reliance on the information contained in this
presentation for the purposes of entering into any proposed transaction or otherwise.