star korea conference 2015 - siemens · star korea conference 2015 . overview extrusion coating of...
TRANSCRIPT

Multilayer Electrode Coatings
Robert Spotnitz
STAR
KOREA CONFERENCE
2015

Overview
Extrusion Coating of Foils
Coextrusion
– Options
– Benefits
Simulation Studies
– Objective: maximize useable energy for HEV
application
– Effect of segregating particle size
– Effect of electrode thickness
Conclusions
2

Knife
http://www.coatema.de/eng/presse_news/fachartikel/2009_08_06_97595399_fachartikel.php?navanchor=1010010
Comma Reverse
Coating Processes
Trend of Coating Processes
K. Omori, AABC10, Orlando, Fl
(2010)
Slot Die
Use of slot dies enables coextrusion.
4
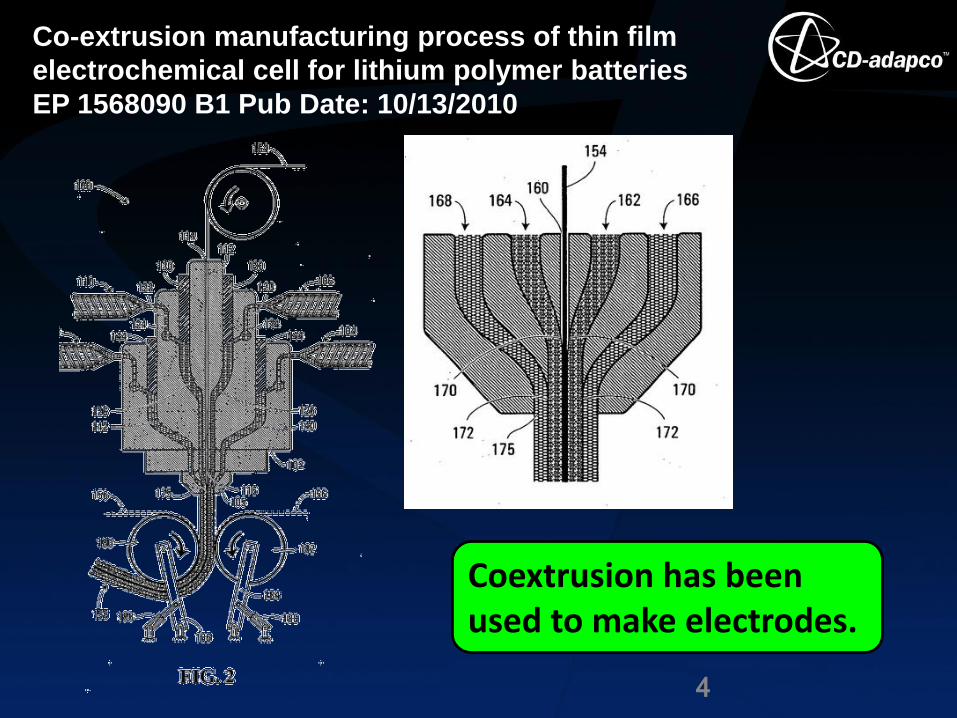
Co-extrusion manufacturing process of thin film
electrochemical cell for lithium polymer batteries
EP 1568090 B1 Pub Date: 10/13/2010
Coextrusion has been used to make electrodes.

Some Options for Multilayer Extrusion
5
Different particle size in each layer
Different materials in each layer
Different materials, particle sizes, and layer thickness
Coextrusion enables multiple layers with different thickness, varying compositions, and particle size distributions.
Mixtures of different materials, particle sizes, and layer thickness
1)
2)
3)
4)

Multilayer Positive Coating: Low-rate material coating high-rate material
6
J.F. Whitacre, K. Zaghib, W.C. West, B.V. Ratnakumar “Dual active material composite cathode structures for Li-ion batteries”, J. Power Sources 177 (2008) 528–536
LiFePO4
Li[Li0.17Mn0.58Ni0.25]O2
“All cell current was forced to pass through the Li[Li0.17Mn0.58Ni0.25]O2
material.”
50:50 wt% Blend
50:50 wt% Layers
Energy above 2 V, mWh/g
C-Rate

Multilayer Positive Coating: High-rate, high-capacity material coating high-rate material
7
J.F. Whitacre, K. Zaghib, W.C. West, B.V. Ratnakumar “Dual active material composite cathode structures for Li-ion batteries”, J. Power Sources 177 (2008) 528–536
LiCoO2/LiFePO4 multilayer
LiFePO4
Energy above 2 V, mWh/g
C-Rate
“If the carbon-coated LiFePO4 was layered with the higher rate LiCoO2, conditions were improved significantly”
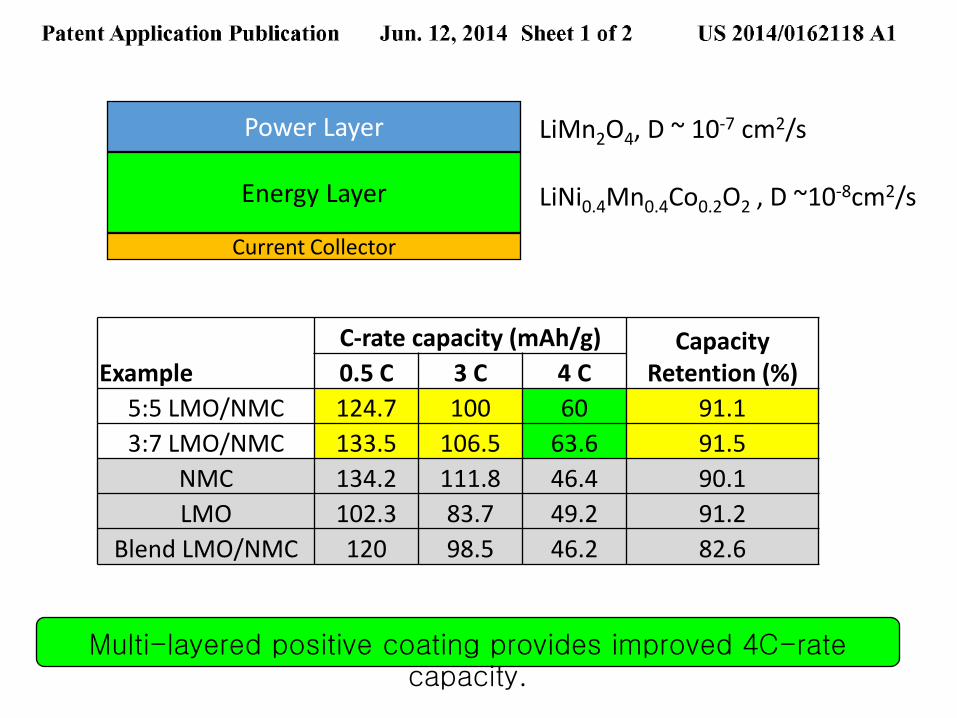
Multi-layered positive coating provides improved 4C-rate capacity.
Example
C-rate capacity (mAh/g) Capacity Retention (%) 0.5 C 3 C 4 C
5:5 LMO/NMC 124.7 100 60 91.1
3:7 LMO/NMC 133.5 106.5 63.6 91.5
NMC 134.2 111.8 46.4 90.1
LMO 102.3 83.7 49.2 91.2
Blend LMO/NMC 120 98.5 46.2 82.6
Power layer - LMO
Energy layer – NMC
LiMn2O4, D ~ 10-7 cm2/s LiNi0.4Mn0.4Co0.2O2 , D ~10-8cm2/s
Power Layer
Energy Layer
Current Collector

Simulation Study: Optimization of Porosity and Particle Size for Discharge Rate
9
S. Golmon, K. Maute, M. Dunn, “A design optimization methodology for Li+ batteries” J. Power Sources 253 (2014) 239-250
e=0.3
r=5
“suggests that functionally grading the electrode can improve the overall battery performance allowing for greater usable energy density in a battery.”
Capacity, Ahm-2
Rate, Am-2
Distance Across Battery, mm

Summary – Previous Work
Focus on discharge behavior
Improve discharge rate without loss of capacity by placing
high power cathode coating on top of high energy coating
Can adjust power/energy curve by varying distribution of
particle size and porosity across electrode
10

Importance of Surface Area on Lithium Loss
Experiments show that
first cycle loss is
proportional to surface
area of graphite
Simulation predicts
lithium loss due to SEI
growth is proportional to
surface area*
11
Irrev.
Cap.
Loss
(Ah/g)
Surface Area (m2/g)
Li/graphite cell
R. Fong, U. von Sacken, and J. R. Dahn,
J. Electrochem. Soc., 137 (7) 1990
* Based on SEI growth model of H. Ploehn et al.
J. Electrochem. Soc., 151 (3) A456-A462 (2004)
Increasing rate capability by increasing surface area may reduce capacity and life.

Surface area determined by particle size distribution
12
Computed surface area of spherical
graphite particles m = 6 mm
s = 3 mm
Surface area of mixture is significantly larger than that corresponding to average particle size.
Restrict radius from 0.5 to 11.5 mm
rSa
3

13
3 Electrode Designs with 3 Particles Sizes (same total particle size distribution)
Single layer Ternary mixture
Two layers Binary mixture Single particle size
Three layers Single size particle in each
Lowest porosity for packing of single size spherical particles is ~25%. Particle mixtures can give higher packing densities, but keep porosity constant at 25%.
Electrode Designs based on Sorting Particle Size into Layers
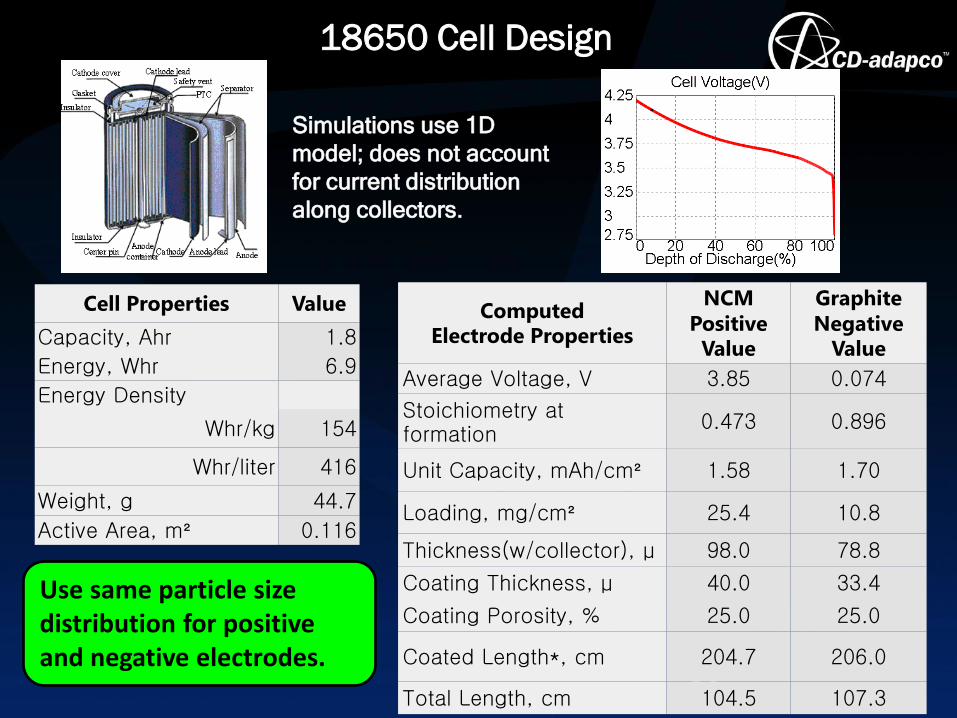
18650 Cell Design
14
Computed
Electrode Properties
NCM
Positive
Value
Graphite
Negative
Value
Average Voltage, V 3.85 0.074
Stoichiometry at formation
0.473 0.896
Unit Capacity, mAh/cm² 1.58 1.70
Loading, mg/cm² 25.4 10.8
Thickness(w/collector), µ 98.0 78.8
Coating Thickness, µ 40.0 33.4
Coating Porosity, % 25.0 25.0
Coated Length*, cm 204.7 206.0
Total Length, cm 104.5 107.3
Cell Properties Value
Capacity, Ahr 1.8
Energy, Whr 6.9
Energy Density
Whr/kg 154
Whr/liter 416
Weight, g 44.7
Active Area, m² 0.116
Simulations use 1D
model; does not account
for current distribution
along collectors.
Use same particle size distribution for positive and negative electrodes.
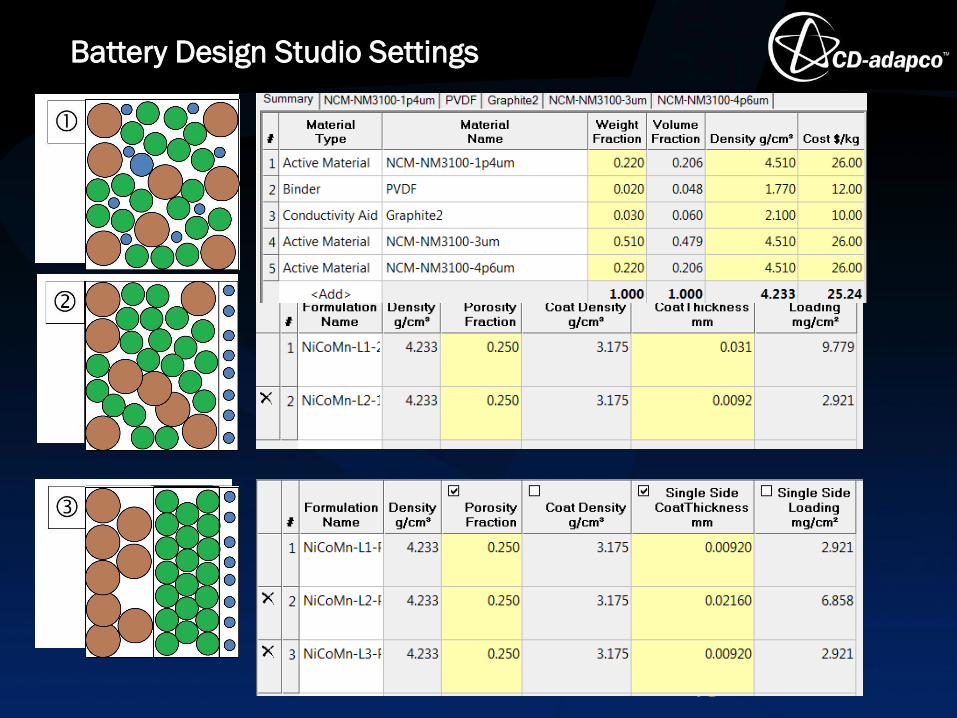
Battery Design Studio Settings
15

Simulation of lithium loss during calendar aging
Aging of all three electrode designs is identical because total particle size distributions are identical.
3% capacity loss after 1 year at 30°C
16

Simulated HPPC Testing with Fresh Cells
~ 13 mV difference
10% SOC
90% SOC
~ 10 mV difference
The difference in voltage drop on discharge between cell with 3 layers and cell with 1 layer is ~10-13 mV during pulses.
17

Polarization Analysis – what causes voltage losses?
Polarization %Difference
Between L1 and L3 Diffusion Electrolyte 48% Ohmic Drop Electrolyte 37% Pos Activation 12% Neg Activation 1% Pos Solid-Phase Diffusion 1%
18
Major difference between one layer and three layers are voltage losses in electrolyte.
Most significant sources of voltage loss are electrolyte diffusion and ohmic drop, and activation overpotentials at negative and positive electrodes.

Profiles at end of first discharge pulse
In multilayer electrodes, liquid-phase current density drops more rapidly in layer near separator so lower current density throughout most of electrode. This lower current density results in lower liquid-phase potential drop and concentration gradient.
3 Layers
3 Layers
1 Layer 1 Layer
Negative Positive Separator Negative Positive Separator
3 Layers
1 Layer Negative Positive Separator
Liquid-Phase Potential
Liquid-Phase Concentration
Liquid-Phase Current Density
19

Hybrid Pulse Power Characterization Test
By putting fine particles on layer near separator, reduce battery size factor compared to single layer case by ~6% Segregating particles further has very minimal impact.
20
Segregating fine particles near
electrode/separator interface reduces # of
cells required to meet goals from 249 to 233.

Simulation of constant current discharge for cells with thin (40 mm) electrodes, 10 C rate, ambient 25°C
Putting small particles near electrode/separator interfaces increases power output slightly initially, but effect is small <1 %.
21

Simulation of constant current discharge for cells with thin (40 mm) electrodes, 20 C rate, ambient 25°C
Putting small particles near electrode/separator interfaces increases power output slightly initially, effect ~2 % at short times.
22

Simulation of constant current discharge for cells with thin (40 mm) electrodes, 30 C rate, ambient 25°C
Putting small particles near electrode/separator interfaces increases power output slightly initially, effect ~4 % and extends time before lower voltage limit reached by ~2 s.
23

Simulation of discharge for cells with thick (80 mm) electrodes
Putting small particles near electrode/separator interfaces increases power output slightly initially, but effect is small < 1 %.
4A rate, 25°C 6A rate, 25°C
24

Putting small particles near electrode/separator interfaces increases power output slightly initially, but effect is small. At very high rate, single layer electrode gives longer discharge because cell temperature is higher.
10A, ambient 25°C 20A, ambient 25°C
Simulation of constant current discharge for cells with thick (80 mm) electrodes
25

Summary/Conclusions
Extrusion coating enables use of multilayer coating.
Thin (40 micron) multilayer coatings provides a small (~5%) advantage over single layers for pulse power applications. For constant current discharges the multilayer electrode is only advantageous at very high rates.
Thick (80 micron) multilayer coatings provide a small benefit in power for short discharge times at very high rates. However for a complete constant current discharge, the multilayer coating may give a shorter runtime due to operating at a lower temperature than a multilayer coatings.
Capability to simulate multilayer coatings available in Battery Design Studio and STAR CCM+/BSM.
26