state of illinois budget overview, projections and ... · chicago, illinois . ... credit rating...
TRANSCRIPT

STATE OF ILLINOIS FY2019 BUDGET ROADMAP:
State of Illinois Budget Overview, Projections and
Recommendations for the Governor and the Illinois General
Assembly
February 9, 2018

The Civic Federation
would like to express its gratitude
to the John D. and Catherine T. MacArthur Foundation,
whose generous grant to fund
the Institute for Illinois’ Fiscal Sustainability at the Civic Federation
made the research and writing of this report possible.
Copyright © 2018
The Civic Federation
Chicago, Illinois

ACKNOWLEDGMENTS
The Institute for Illinois’ Fiscal Sustainability at the Civic Federation would like
to express its appreciation to the Governor’s Office of Management and Budget,
the Illinois Department of Revenue, the State of Illinois Comptroller and the
Illinois Department of Transportation for their assistance with this report.
1
TABLE OF CONTENTS
EXECUTIVE SUMMARY ......................................................................................................................................... 2
CIVIC FEDERATION RECOMMENDATIONS .................................................................................................................. 3 CIVIC FEDERATION FINDINGS .................................................................................................................................... 5
BUDGET OVERVIEW ............................................................................................................................................... 7
REVENUES ................................................................................................................................................................. 7 EXPENDITURES ........................................................................................................................................................ 11
Pensions ............................................................................................................................................................. 13 Education .......................................................................................................................................................... 14 Other Areas ....................................................................................................................................................... 17
BUDGET DEFICIT AND UNPAID BILLS ...................................................................................................................... 18 CREDIT RATINGS AND BOND COSTS ........................................................................................................................ 25
PROJECTIONS ......................................................................................................................................................... 28
Revenues ............................................................................................................................................................ 29 Expenditures ...................................................................................................................................................... 29 Budget Balance and Backlog ............................................................................................................................ 30
CIVIC FEDERATION RECOMMENDATIONS .................................................................................................. 31
COMPREHENSIVE PLAN ........................................................................................................................................... 31 Issue 1: Spending Controls ............................................................................................................................... 34 Issue 2: Interest Penalties on Overdue Bills .................................................................................................... 35 Issue 3: Retirement Income Exclusion ............................................................................................................. 37 Issue 4: Sales Tax on Services .......................................................................................................................... 38 Issue 5: Rainy Day Fund .................................................................................................................................. 40 Issue 6: Constitutional Amendment to Clarify the Pension Protection Clause .............................................. 42 Issue 7: Supplemental Pension Payments ........................................................................................................ 44 Issue 8: Merger of the Chicago and State Teachers’ Pension Funds ............................................................. 46 Issue 9: Restructuring Illinois’ Public University System ............................................................................... 48 Issue 10: Comprehensive Capital Improvement Planning and Funding ........................................................ 51 Issue 11: Consolidating and Streamlining Government Units in Illinois ....................................................... 54
FUTURE TAX AND BUDGET REFORMS ...................................................................................................................... 56
APPENDIX A: SUPPLEMENTAL PENSION PAYMENTS ................................................................................ 58
APPENDIX B: FALL UNDERGRADUATE ENROLLMENT AT ILLINOIS PUBLIC UNIVERSITIES ..... 59

2
EXECUTIVE SUMMARY
The State of Illinois FY2019 Roadmap describes the State of Illinois’ fiscal condition and
presents the Civic Federation’s proposed five-year plan to stabilize the State’s finances. The
report is published annually before the Governor’s annual budget address for consideration by
the Governor and General Assembly during upcoming budget deliberations.1
After enduring two years without a complete budget, the State of Illinois is finally operating with
an annual revenue and spending plan. The budget for fiscal year 2018—passed over the veto of
Governor Bruce Rauner—provided for higher taxes to reduce the structural deficit. The FY2018
budget also authorized the sale of bonds to shrink the massive backlog of unpaid bills and curtail
punishing late-payment fees.
Although the immediate crisis has abated, significant problems remain. Despite a permanent
increase in income tax rates, the FY2018 budget has an estimated operating deficit of at least
$1.5 billion, and deficits are projected to continue for the foreseeable future.2 The State’s unpaid
bills are substantially reduced from $14.7 billion at the end of FY2017, but the backlog is still
expected to stand at $7.5 billion when the current fiscal year ends on June 30, 2018 and is
projected to grow to $13.7 billion by FY2023.
The biggest challenge continues to be staggering public employee pension costs, which are
difficult to reduce due to State constitutional protections as interpreted by the Illinois Supreme
Court. Pension savings were achieved in FY2018 by pushing required contributions down the
road, further delaying adequate funding of the State’s retirement systems. At the end of FY2017,
the five funds had $129.1 billion in unfunded liabilities; only about 40% of promised pension
benefits were covered by pension assets.3
Illinois still has the lowest credit rating of any state. While enactment of an FY2018 budget
prevented further descent to junk status, credit rating firms remain concerned about pension debt,
unpaid bills and the political gridlock that led to the two-year budget impasse.4 Recent Illinois
bond documents included the following warning to potential investors: “There can be no
assurance that a budget will be enacted in future fiscal years.”5
In addition to these financial challenges, Illinois’s public university system faces declining
enrollment and high tuition. Finally, Illinois has not had a comprehensive capital plan since
1 Governor Bruce Rauner is scheduled to present his budget proposal for FY2019 on February 14, 2018. The State of
Illinois’ fiscal year begins on July 1 and ends on June 30. 2 State of Illinois, Governor’s Office of Management and Budget, Financial Walk Down (General Funds), October
11, 2017,
https://www2.illinois.gov/sites/budget/documents/economic%20and%20fiscal%20policy%20reports/fy%202017/ec
onomic_and_fiscal_policy_report_five-year_projection_10.12.17.pdf (last accessed on February 8, 2018). 3 Illinois General Assembly, Commission on Government Forecast and Accountability, Monthly Briefing for the
Month Ended: November 2017, p. 2, http://cgfa.ilga.gov/Upload/1117revenue_special_pension_briefing.pdf (last
accessed on February 8, 2018). The unfunded liability figure is based on the market value of assets; the comparable
number based on the smoothed or actuarial value of assets is $128.9 billion. 4 Fitch Ratings, Fitch Rates $6 Billion Illinois GOs ‘BBB’; Outlook Negative, news release, October 12, 2017. 5 State of Illinois, General Obligation Bonds, Series of December 2017, Official Statement, November 29, 2017, p.8.

3
FY2010, and existing revenues are insufficient to address infrastructure needs throughout the
State.
The Civic Federation’s comprehensive plan would eliminate the operating deficit in FY2019.
The backlog of bills would be cleared by FY2023, allowing the State to begin building the kind
of rainy day fund needed to protect against future financial shocks.
Spending controls are at the center of the Federation’s plan, but more revenue is also needed to
close the FY2019 operating deficit, pay off the State’s accumulated bills and address Illinois’
other pressing challenges. After the tax changes in FY2017, the Federation is aware that further
increases would not be welcomed by many residents and elected officials. The plan presented
here focuses on broadening the tax base in ways that could lead to lower rates in the future.
Civic Federation Recommendations
The Civic Federation offers the following recommendations to begin stabilizing the State of
Illinois’ financial position:
Issue 1: Spending Controls
The Civic Federation recommends that the State of Illinois limit net agency spending growth to
2.1% annually through at least FY2023.
Issue 2: Interest Penalties on Overdue Bills
The Civic Federation recommends that the State reduce the late payment penalty in the Prompt
Payment Act to a rate that reflects lower economy-wide rates of return, such as the five-year
Treasury rate plus one percentage point. The legislature and Governor should also consider a
reduction in the timely payment rate in the Insurance Code.
Issue 3: Retirement Income Exclusion
The Civic Federation recommends that the State of Illinois broaden its income tax base by
eliminating the tax exclusion for all federally taxable retirement income. This will enhance the
State’s fiscal stability by providing access to a faster growing portion of the income tax base,
generating FY2019 revenues of over $2.5 billion.
Issue 4: Sales Tax on Services
The Civic Federation recommends that the State of Illinois expand the sales tax base to include
the fourteen services taxed by the State of Wisconsin.
Issue 5: Rainy Day Fund
The State of Illinois should work toward building a rainy day fund equal to 10% of General
Funds revenues to cushion the budget from the next economic downturn. Legislation must
explicitly indicate when deposits will be made and in what amount and the circumstances under
which withdrawals will be allowed.

4
Issue 6: Constitutional Amendment to Clarify the Pension Protection Clause
The Illinois General Assembly should vote to place a Constitutional amendment on the ballot no
later than the 2020 general election that would clarify the pension protection clause and allow
reasonable, moderate changes to current employee and retiree benefits necessary to secure the
financial sustainability of the State and local governments and the pension systems themselves.
Issue 7: Supplemental Pension Payments
In order to mitigate the underfunding of the State’s pension systems due to inadequate statutory
payments, the Civic Federation recommends requiring annual supplemental payments of $600
million from FY2020 through FY2034 and $481 million in FY2035. The supplemental payments
would replace debt service on maturing pension obligation bonds.
Issue 8: Merger of the Chicago and State Teachers’ Pension Funds
The Civic Federation recommends that the Chicago Teachers’ Pension Fund (CTPF) be
consolidated with the Teachers’ Retirement System (TRS) and that the State assume
responsibility for the unfunded liability of CTPF. The Federation also recommends that the
Chicago Public Schools resume paying for the normal cost of Chicago teachers’ pensions and
that responsibility for the normal cost of pensions for all teachers outside of Chicago be shifted
from the State of Illinois to local school districts over three years.
Issue 9: Restructuring Illinois’ Public University System
The Civic Federation recommends that the Governor create a bipartisan commission to address
the need to eliminate duplicative university programs, more effectively allocate resources across
programs and campuses and study the potential need to close or consolidate campuses. The
Federation also recommends that the nine universities be governed by a single Board of Trustees
to facilitate the establishment of statewide goals and rational allocation of State resources.
Issue 10: Comprehensive Capital Improvement Planning and Funding
The Civic Federation recommends that the State of Illinois initiate a new Capital Improvement
Plan that comprehensively assesses and prioritizes infrastructure needs. The road and transit
portion of the plan should be initially funded by an increase in the motor fuel tax, which has not
been raised since 1990. The State should further consider vehicle miles traveled and congestion
taxes to ensure the long-term sustainability of transportation funding revenues.
Issue 11: Consolidating and Streamlining Government Units in Illinois
In addition to recommending the merger of CTPF with TRS, the Civic Federation supports the
following government consolidation initiatives:
Consolidate local pension funds;
Merge the offices of the Illinois Comptroller and Treasurer;
Authorize any township to be dissolved by referendum;
Consolidate property tax administration roles in Cook County; and
Dissolve the Illinois International Port District.
5
Future Changes
Once the State pays off its unpaid bill backlog and begins to make progress toward building a
rainy day fund, it should pursue the following measures to give the State’s finances more long-
term sustainability:
Return the lapse period to two months from six;
Phase-out Section 25 liabilities and other practices that allow current years’ costs to be
paid from future years’ appropriations;
Shift normal pension costs from the State to public universities and community colleges;
and
Consider a modestly graduated income tax rate structure with a maximum spread of 3.0
percentage points that could generate additional revenues and lower rates for low income
taxpayers, while protecting against excessive disparities and rate increases. Such a
change would require an amendment to the Illinois Constitution.
Civic Federation Findings
Income tax changes enacted in FY2018 are expected to generate about $5.0 billion in
additional General Funds revenues in FY2018. The year-to-year revenue increase appears
artificially low because of changes to the distribution of income taxes to local
governments that affected base revenues.
The FY2018 deficit, projected by the Governor’s Office of Management and Budget at
$1.5 billion, could be higher if the State fails to collect $300 million from the sale of the
James R. Thompson Center or appropriates $445 million for Medicaid that was left out of
the FY2018 appropriations bill. It is unclear to what extent interest penalty payments on
overdue bills have been included in the FY2018 estimate. Other factors, such as speedier
federal Medicaid reimbursement, could lower the deficit.
The sale of backlog reduction bonds cleared $8.7 billion in bills, or about $1.6 billion
more than expected, due to federal Medicaid reimbursements and premiums paid by bond
investors. As a result, the year-end FY2018 backlog could be below the previously
forecasted $7.5 billion, but the outcome will depend on uncertainties involving the
FY2018 operating deficit.
Illinois spent $1.6 billion on late payment interest penalties from FY2008 through
January 2018. Through the first seven months of FY2018, State spending on interest
penalties of $337.9 million has already set a new yearly high and hundreds of millions of
dollars in accrued interest penalties remain unpaid.
General Funds pension costs—including debt payments on pension bonds—rose from
6.8% of expenditures in FY2006 to 22.9% in FY2018. State pension contributions
stabilized in FY2018 because of statutory changes that pushed required payments into the
future but are projected to increase significantly in FY2019.
General Funds non-pension appropriations for elementary and secondary education on an
average annual basis from FY2016 to FY2018 increased by 10.7% compared with the
funding level in FY2015.
Annual non-pension higher education funding from FY2016 through FY2018 averaged
just below 80% of the FY2015 level, with Monetary Award Program tuition grants one of
the few areas receiving funding at the FY2015 level.
6
According to the Illinois Department of Transportation, maintaining Illinois’ existing
highway and transit infrastructure will require approximately $1.7 billion in additional
annual funding. Additionally, the State faces a $7.0 billion backlog of deferred
maintenance at State facilities.

7
BUDGET OVERVIEW
After enduring two years without a complete budget, the State of Illinois is finally operating with
an annual revenue and spending plan. The budget for fiscal year 2018—passed over the veto of
Governor Bruce Rauner—provided for higher taxes to reduce the structural deficit. The FY2018
budget also authorized the sale of bonds to shrink the massive backlog of unpaid bills and curtail
punishing late-payment fees.
Although the immediate crisis has abated, significant problems remain. Despite a permanent
increase in income tax rates, the FY2018 budget has an estimated operating deficit of at least
$1.5 billion.6 The State’s unpaid bills are substantially reduced from $14.7 billion at the end of
FY2017, but the backlog is still expected to stand at $7.5 billion when the current fiscal year
ends on June 30, 2018.
Illinois’ biggest challenge continues to be staggering public employee pension costs, which are
difficult to reduce due to State constitutional protections as interpreted by the Illinois Supreme
Court. Pension savings were achieved in FY2018 by pushing required contributions down the
road, further delaying adequate funding of the State’s retirement systems. At the end of FY2017,
the State’s five funds had $129.1 billion in unfunded liabilities; only about 40% of promised
pension benefits were covered by pension assets.7
Illinois still has the lowest credit rating of any state. While enactment of an FY2018 budget
prevented further descent to junk status, credit rating firms remain concerned about pension debt,
unpaid bills and the political gridlock that led to the two-year budget impasse.8 Recent Illinois
bond documents included the following warning to potential investors: “There can be no
assurance that a budget will be enacted in future fiscal years.”9
Revenues
Illinois’ prolonged budget impasse stemmed from a failure to deal with the drop in revenues
caused by a partial rollback of income tax rates in January 2015. Governor Rauner, a Republican
who took office at the beginning of 2015, has made pro-business reforms a condition for
approving additional revenues, but Democrats who control the General Assembly have not
agreed to those terms.10
6 State of Illinois, Governor’s Office of Management and Budget, Financial Walk Down (General Funds), October
11, 2017,
https://www2.illinois.gov/sites/budget/Documents/Economic%20and%20Fiscal%20Policy%20Reports/FY%202017
/Economic_and_Fiscal_Policy_Report_Five-Year_Projection_10.12.17.pdf (last accessed on February 8, 2018). 7 Illinois General Assembly, Commission on Government Forecast and Accountability, Monthly Briefing for the
Month Ended: November 2017, p. 2, http://cgfa.ilga.gov/Upload/1117revenue_special_pension_briefing.pdf (last
accessed on February 8, 2018). The unfunded liability figure is based on the market value of assets; the comparable
number based on the smoothed or actuarial value of assets is $128.9 billion. 8 Fitch Ratings, Fitch Rates $6 Billion Illinois GOs ‘BBB’; Outlook Negative, news release, October 12, 2017. 9 State of Illinois, General Obligation Bonds, Series of December 2017, Official Statement, November 29, 2017, p.8. 10 Governor Rauner’s policy agenda has varied somewhat over time but has generally included a freeze on property
taxes coupled with restrictions on public union collective bargaining, changes to the workers' compensation system
for employees hurt on the job and term limits for lawmakers.

8
Income tax rates had been raised temporarily to offset a steep decline in economically sensitive
State revenues related to the Great Recession.11 In January 2011, individual income tax rates
were temporarily increased to 5.0% from 3.0% and corporate tax rates were raised to 7.0% from
4.8%.12 Rates automatically declined to 3.75% for individuals and 5.25% for corporations in
January 2015.
Because the revenue loss covered only half the fiscal year in 2015, the State was able to plug that
year’s budget hole by using one-time measures, including transfers to General Funds from
balances built up in other State accounts and advance funding of Medicaid expenses from the
prior year’s revenues.13 The challenge of balancing the budget was greater in FY2016, the year
of Governor Rauner’s first budget proposal, because it was the first full fiscal year with lower
income tax rates.
Tax rates were not raised until the next complete budget—for FY2018—was enacted on July 6,
2017, five days after the start of the current fiscal year.14 Effective on July 1, individual income
tax rates were increased to 4.95% from 3.75% and corporate tax rates to 7.0% from 5.25%. The
permanent increases are expected to bring in nearly $5 billion in additional revenue in FY2018.15
The additional income tax revenue in FY2018 includes $4.5 billion due to higher individual
income tax rates and $514 million due to higher corporate tax rates, according to the legislature’s
Commission on Government Forecasting and Accountability (COGFA).16 The FY2018 budget
also established income limits on certain individual credits and exemptions, which were offset by
increases in the earned income tax credit and instructional materials credit. Various corporate
deductions and exemptions, including the domestic production activities deduction, were
11 The recession began in December 2007 and ended in June 2009, according to the National Bureau of Economic
Research. 12 In addition to these rates, corporations pay a Personal Property Replacement Tax (PPRT) of 2.5%, which was not
affected by the income tax rate changes. The PPRT, which was created by the Illinois General Assembly in 1970 to
replace a tax on the personal property of businesses that was abolished pursuant to the 1970 Illinois Constitution, is
mainly a revenue source for local governments. 13 State of Illinois, General Obligation Bonds, Series of November 2016, Official Statement, November 8, 2016, pp.
17-18. General Funds support the regular operating and administrative expenses of most agencies and are the funds
over which the State has the most control. Prior to FY2018, General Funds consisted of the General Revenue Fund,
Education Assistance Fund, Common School Fund and General Revenue-Common School Special Account Fund.
Three additional accounts—the Fund for the Advancement of Education, Commitment to Human Services Fund and
Budget Stabilization Fund—were added to General Funds in FY2018. In this report, the numbers for prior years
have been adjusted to reflect the change in FY2018. 14 The revenue component of the FY2018 budget legislation was Public Act 100-0022. The budget also included
Public Act 100-0021 (appropriations) and Public Act 100-0023 (statutory changes required for implementation).
Funding for elementary and secondary education also required the enactment of Public Act 100-0065, which revised
the State’s system for funding school districts. 15 Illinois General Assembly, Commission on Government Forecasting and Accountability, State of Illinois Budget
Summary Fiscal Year 2018, Updated September 5, 2017, p. 25,
http://cgfa.ilga.gov/Upload/FY2018BudgetSummary.pdf, (last accessed February 8, 2018). 16 Illinois General Assembly, Commission on Government Forecasting and Accountability, State of Illinois Budget
Summary Fiscal Year 2018, Updated September 5, 2017, p. 25. These amounts are net of deductions to pay for
income tax refunds.

9
eliminated, but the research and development credit, which expired in 2015, was reinstated and
extended through 2021.
The following chart shows General Funds income tax revenues from FY2008 to FY2018.
Income tax revenues dropped by 19.0% from $12.2 billion in FY2008 to $9.9 billion in FY2010
as a result of the recession. After the rate increases in 2011, the revenues more than doubled to
$19.8 billion in FY2014 before declining to $15.0 billion in FY2017 due to the subsequent rate
reductions. Income tax revenues are expected to total $19.5 billion in FY2018 after the recently
enacted changes and account for about 54% of all General Funds resources.
Personal Income Tax : 3.0%Corporate Income Tax : 4.8%**
PIT: 5.0% From 1/1/2011CIT: 7.0%** to 12/31/2014
PIT: 3.75% From 1/1/2015CIT: 5.25%** to 6/30/2017
PIT: 4.95%CIT: 7.0%**
$12,180 $10,933
$9,871
$13,076
$17,973 $19,715 $19,806
$18,603
$15,778 $14,993 $14,540
$4,989
$19,529
$-
$5,000
$10,000
$15,000
$20,000
$25,000
FY2008 FY2009 FY2010 FY2011 FY2012 FY2013 FY2014 FY2015 FY2016 FY2017 FY2018(Est.)***
State of Illinois General Funds* Income Tax Revenues:FY2008-FY2018 (in $ millions)
Base Income Taxes FY2018 Income Tax Changes****
* Includes revenues allocated to Fund for the Advancement of Education and Committment to Human Services Fund beginning in February 2015. Income tax amounts
are net of diversions to the Income Tax Refund Fund. ** Corporations also pay a Personal Property Replacement Tax of 2.5%.***FY2018 base income taxes are reduced by $1.1 billion due to direct deposit of revenues to the Local Government Distributive Fund.****Includes additional revenue due to income tax rate increases and certain other changes.Source: Illinois General Assembly, Commission on Government Forecasting and Accountablity,State of Illinois Budget Summary Fiscal Year 2018, Updated September 5, 2017, pp. 26 and 54.
It should be noted that the FY2018 income tax revenue total is not strictly comparable to prior-
year figures because of a change in the way the State distributes income taxes to local
governments. Municipalities and counties in Illinois receive 10% of income taxes generated
under the rates in effect prior to the 2011 increases; in other words, local governments have not
shared in the revenues resulting from the higher rates. As part of the FY2018 budget, the local
share is now deposited directly into the Local Government Distributive Fund instead of first
being deposited into General Funds and then transferred to that special account. The change,
which was intended to speed up payments to local governments, reduced General Funds

10
revenues by $1.1 billion in FY2018.17 The FY2018 budget also cut the local distribution by 10%
in that year only.
Similarly, sales tax revenues for public transit districts were reduced by 10% in FY2018 and are
now deposited directly into special accounts, decreasing General Funds revenues by about $449
million in FY2018.18 The FY2018 budget also eliminated the 20% per gallon sales tax break on
gasohol, which increased sales tax revenues by an estimated $100 million in that year.19 The
budget extended the sales tax exemption on manufacturing, machinery and equipment to graphic
arts and printing equipment, reducing sales tax revenues by an estimated $10 million.20
The Governor’s Office of Management and Budget (GOMB) estimates total FY2018 General
Funds revenues at $35.9 billion, an increase of $5.6 billion, or 18.3%, from $30.3 billion in
FY2017.21 The FY2018 total includes $300 million from the sale of the James R. Thompson
Center in Chicago, a plan that was also part of the Governor’s proposed FY2018 budget.22
17 Illinois General Assembly, Commission on Government Forecasting and Accountability, State of Illinois Budget
Summary Fiscal Year 2018, Updated September 5, 2017, p. 26. 18 Illinois General Assembly, Commission on Government Forecasting and Accountability, State of Illinois Budget
Summary Fiscal Year 2018, Updated September 5, 2017, p. 24. The special accounts are the Public Transportation
Fund and the Downstate Public Transportation Fund. 19 Illinois General Assembly, Commission on Government Forecasting and Accountability, State of Illinois Budget
Summary Fiscal Year 2018, Updated September 5, 2017, p. 24. 20 Illinois General Assembly, Commission on Government Forecasting and Accountability, State of Illinois Budget
Summary Fiscal Year 2018, Updated September 5, 2017, p. 25. 21 State of Illinois, Governor’s Office of Management and Budget, Financial Walk Down (General Funds), October
11, 2017; Communication between the Civic Federation and the Governor’s Office of Management and Budget,
January 21, 2018. 22 Illinois State FY2018 Budget, pp. 44 and 76,
https://www2.illinois.gov/sites/budget/Documents/Budget%20Book/FY2018%20Budget%20Book/FY2018Operatin
gBudgetBook.pdf (last accessed on February 8, 2018). Net proceeds from the sale after relocation expenses were
estimated at $240 million.

11
The following chart compares General Funds revenues in FY2017 and FY2018. As previously
discussed, the FY2018 numbers for income taxes and sales taxes are reduced due to the direct
deposit of revenues shared with local governments, which is estimated to total $1.6 billion.23
Federal revenues, which consist mainly of federal reimbursements for State Medicaid spending
are expected to increase by more than $1 billion due to improved liquidity and legal payment
requirements related to federal consent decrees.24
FY2017
Preliminary
FY2018
Estimated $ Change % Change
Net Individual Income Taxes 13,661$ 17,250$ 3,589$ 26.3%
Net Corporate Income Taxes 1,332$ 1,882$ 550$ 41.3%
Net Sales Taxes 8,043$ 7,970$ (73)$ -0.9%
All Other State Resources 4,814$ 5,241$ 427$ 8.9%
State Source Revenues 27,850$ 32,343$ 4,493$ 16.1%
Federal Revenues 2,483$ 3,556$ 1,073$ 43.2%
Total Revenues 30,333$ 35,899$ 5,566$ 18.3%
State of Illinois General Funds Estimated Revenues
Includes Fund for the Advancement of Education, Commitment
to Human Services Fund and Budget Stabilization Fund
Source: State of Illinois, Governor's Office of Management and Budget, Financial Walk Down (General Funds) , October 11, 2017;
Communication with Govenor's Office of Management and Budget.
Expenditures
While State tax collections were shrinking due to the Great Recession, statutorily required State
pension contributions were climbing. General Funds pension contributions rose from $1.6 billion
in FY2008 to $4.0 billion in FY2010 and are estimated at about $7.0 billion in FY2018.
Illinois’ five retirement systems—the Teachers’, State Employees’, State Universities, Judges’
and General Assembly Retirement Systems—are on a 50-year funding plan that began in
FY1996 and is intended to achieve 90% funding by FY2045. The plan deferred contributions to
the future, resulting in steeply increasing State payments and an unfunded liability that is not
expected to stop growing until FY2028.25
Illinois sold bonds in 2003, 2010 and 2011 to bolster pension assets and pay for annual pension
contributions. Debt service on previously issued pension bonds rose to $1.6 billion in FY2018
from $467 million in FY2008, increasing total pension-related payments to $8.6 billion in
FY2018 from $2.1 billion in FY2008.
23 State of Illinois, Governor’s Office of Management and Budget, Illinois Economic and Fiscal Policy Report,
October 12, 2017, p. 8,
https://www2.illinois.gov/sites/budget/Documents/Economic%20and%20Fiscal%20Policy%20Reports/FY%202017
/Economic_and_%20Fiscal_%20Policy_%20Report_10.12.17.pdf (last accessed February 8, 2018). 24 State of Illinois, General Obligation Bonds, Series of December 2017, Official Statement, November 29, 2017, p.
29. 25 Illinois General Assembly, Commission on Government Forecast and Accountability, Monthly Briefing for the
Month Ended: November 2017, p. 11.
12
General Funds spending not related to pensions has been relatively flat during the same period, at
an estimated $28.8 billion in FY2018, compared with $28.3 billion in FY2008. The Consumer
Price Index rose 12.7% from June 2008 through December 2017.26
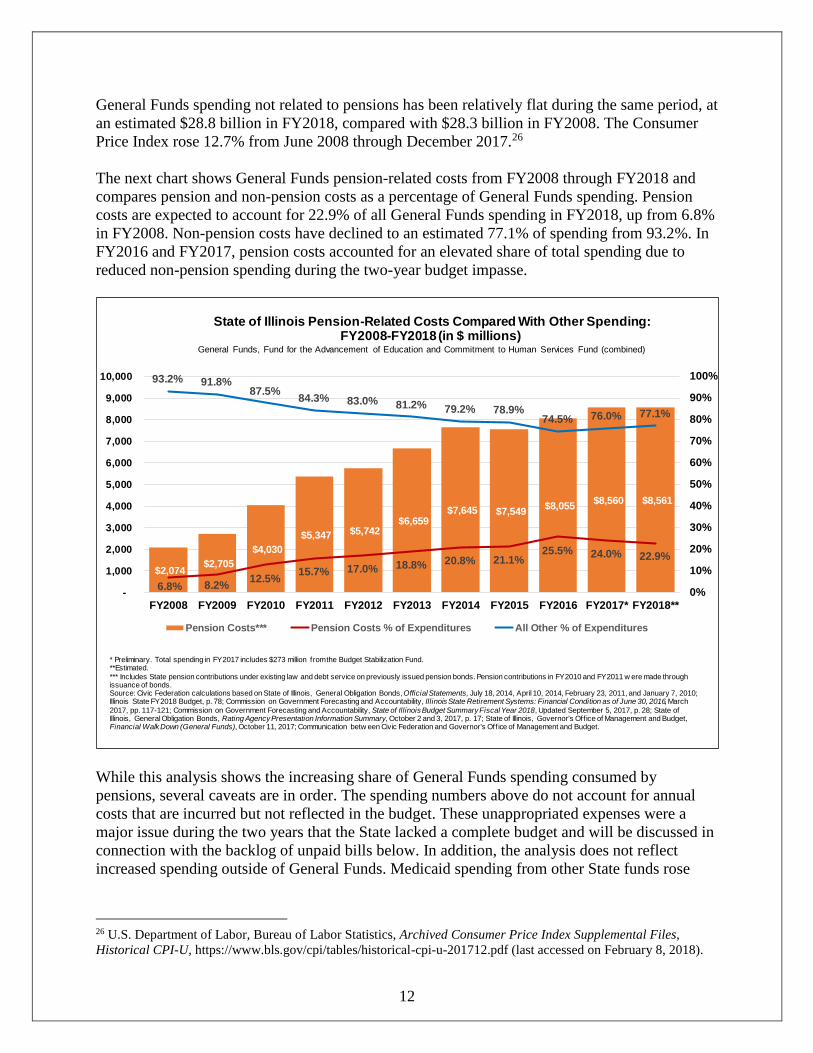
The next chart shows General Funds pension-related costs from FY2008 through FY2018 and
compares pension and non-pension costs as a percentage of General Funds spending. Pension
costs are expected to account for 22.9% of all General Funds spending in FY2018, up from 6.8%
in FY2008. Non-pension costs have declined to an estimated 77.1% of spending from 93.2%. In
FY2016 and FY2017, pension costs accounted for an elevated share of total spending due to
reduced non-pension spending during the two-year budget impasse.
$2,074 $2,705
$4,030
$5,347 $5,742 $6,659
$7,645 $7,549 $8,055
$8,560 $8,561
6.8% 8.2%12.5%
15.7% 17.0% 18.8% 20.8% 21.1%25.5% 24.0% 22.9%
93.2% 91.8%87.5%
84.3% 83.0% 81.2% 79.2% 78.9%74.5% 76.0% 77.1%
0%
10%
20%
30%
40%
50%
60%
70%
80%
90%
100%
-
1,000
2,000
3,000
4,000
5,000
6,000
7,000
8,000
9,000
10,000
FY2008 FY2009 FY2010 FY2011 FY2012 FY2013 FY2014 FY2015 FY2016 FY2017* FY2018**
Pension Costs*** Pension Costs % of Expenditures All Other % of Expenditures
* Preliminary. Total spending in FY2017 includes $273 million from the Budget Stabilization Fund.**Estimated.
*** Includes State pension contributions under existing law and debt service on previously issued pension bonds. Pension contributions in FY2010 and FY2011 w ere made through issuance of bonds.Source: Civic Federation calculations based on State of Illinois, General Obligation Bonds, Official Statements, July 18, 2014, April 10, 2014, February 23, 2011, and January 7, 2010; Illinois State FY2018 Budget, p. 78; Commission on Government Forecasting and Accountability , Illinois State Retirement Systems: Financial Condition as of June 30, 2016, March
2017, pp. 117-121; Commission on Government Forecasting and Accountability, State of Illinois Budget Summary Fiscal Year 2018, Updated September 5, 2017, p. 28; State of Illinois, General Obligation Bonds, Rating Agency Presentation Information Summary, October 2 and 3, 2017, p. 17; State of Illinois, Governor's Office of Management and Budget, Financial Walk Down (General Funds), October 11, 2017; Communication betw een Civic Federation and Governor's Office of Management and Budget.
State of Illinois Pension-Related Costs Compared With Other Spending: FY2008-FY2018 (in $ millions)
General Funds, Fund for the Advancement of Education and Commitment to Human Services Fund (combined)
While this analysis shows the increasing share of General Funds spending consumed by
pensions, several caveats are in order. The spending numbers above do not account for annual
costs that are incurred but not reflected in the budget. These unappropriated expenses were a
major issue during the two years that the State lacked a complete budget and will be discussed in
connection with the backlog of unpaid bills below. In addition, the analysis does not reflect
increased spending outside of General Funds. Medicaid spending from other State funds rose
26 U.S. Department of Labor, Bureau of Labor Statistics, Archived Consumer Price Index Supplemental Files,
Historical CPI-U, https://www.bls.gov/cpi/tables/historical-cpi-u-201712.pdf (last accessed on February 8, 2018).

13
from $2.8 billion in FY2008 to an estimated $3.5 billion in FY2017; these figures do not include
federal reimbursements.27
Total General Funds spending in FY2018 is estimated at $37.4 billion, an increase of $1.7
billion, or 4.8% from $35.7 billion in FY2017.28 As with the revenue numbers discussed above,
FY2018 expenditures are not strictly comparable to prior-year figures because of the direct
deposit of income taxes and sales taxes to special accounts for local governments and transit
districts.
FY2018 Spending: Pensions
State pension contributions stabilized in FY2018 due to statutory changes included in the budget
legislation.29 The main change involved smoothing of State contributions, which is intended to
moderate the budgetary impact of new actuarial assumptions adopted by the retirement systems.
Governor Rauner proposed pension payment smoothing in each of his three recommended
budgets.30
Before the smoothing provisions were enacted, the State’s total FY2018 contributions were
expected to increase by nearly $1 billion from FY2017 because of revised actuarial assumptions
by the Teachers’ fund, known as TRS, and the State Employees’ system. Approximately 89% of
State pension contributions are made from General Funds, with the remainder paid from other
State accounts.
Now any changes in required State contributions due to revised actuarial assumptions are
recognized equally over a five-year period instead of all at once in the year they take effect. The
smoothing also applies retroactively to changes in actuarial assumptions that first affected State
contributions during FY2014 through FY2017, which means that the State will reduce FY2018
and future contributions by the amounts that were previously overpaid.
Revised assumptions, such as lower assumed rates of investment return, increase accrued
liabilities and raise State contribution requirements. Smoothing spreads the contribution increase
over a number of years, reducing State costs in the near-term but increasing costs over time due
to forgone interest on lower contributions. TRS, Illinois’ largest pension fund, said the State will
have to pay three dollars in the future for every dollar in current contribution reductions due to
smoothing.31
The FY2018 budget legislation also shifted certain costs for high-paid employees from the State
to local employers. Individual school districts, universities and community colleges are now
27 National Association of State Budget Officers, 2009 State Expenditure Report, Fall 2010, p. 47; National
Association of State Budget Officers, State Expenditure Report 2016, November 2017, p. 48. 28 State of Illinois, General Obligation Bonds, Series of December 2017, Official Statement, November 29, 2017, p.
29. 29 Public Act 100-0023, enacted on July 6, 2017. 30 Illinois State FY2018 Budget, pp. 177-178; Illinois State FY2017 Budget, p. 188; Illinois State FY2016 Budget, p.
5-3. 31 Teachers’ Retirement System of the State of Illinois, “TRS follows new law and lowers the State’s FY2018
contribution by $531 million,” news release, August 23, 2017.

14
required to pay current service costs for the portion of employees’ salaries in excess of the
Governor’s salary of $177,400.
The next table compares initial FY2018 total contribution amounts with revised amounts due to
the legislative changes. The revisions decreased FY2018 contributions by $908.7 million, or
10.3%, to $7.9 billion from the original $8.8 billion.32 Contributions are expected to resume their
climb in FY2019, rising to $8.5 billion.
Retirement System FY2017
FY2018
Original
Amount
FY2018
Recertified
Amount FY2019
Teachers 3,986,583$ 4,564,952$ 4,095,316$ 4,466,178$
State Employees 2,014,461$ 2,327,649$ 2,029,583$ 2,165,841$
Universities 1,671,426$ 1,753,685$ 1,629,308$ 1,655,154$
Judges 131,334$ 146,766$ 135,622$ 140,469$
General Assembly 21,721$ 26,679$ 21,155$ 23,221$
Total 7,825,525$ 8,819,731$ 7,910,984$ 8,450,863$
State of Illinois Statutorily Required Pension Contributions:
FY2017-FY2019 (in $ thousands)*
*Total State contributions, including General Funds and other State funds. General Funds typically account for
89% of total contributions.
Source: State of Illinois, Office of the Auditor General, State Actuary's Report , December 2015, p.9; State of
Illinois, Office of the Auditor General, State Actuary's Report, December 2017, pp. 11-12.
Another provision of the budget legislation that would shift additional costs to school districts,
universities and community colleges is not expected to take effect until FY2020. The measure
would create a Tier 3 benefit plan for new employees, with costs covered by local employers.
The plan, which was part of Governor Rauner’s proposed FY2018 budget, was intended to save
the State about $500 million annually.33 Actuarial evaluations of the Tier 3 plan that could
support the savings estimate have not been released publicly.
FY2018 Spending: Education
A large portion of elementary and secondary education appropriations in the FY2018 budget was
made contingent on education funding reform. The Governor issued an amendatory veto of the
school funding bill passed by the General Assembly in May 2017,34 but a compromise was
subsequently negotiated and enacted on August 31.35
32 Public Act 100-0340, enacted in August 2017, increased State contributions to the Teachers’ fund by shifting
more of the pension costs of federally funded teachers’ salaries from local school districts to the State. The
legislative change means that school districts’ federal funds will be used only for current service costs of pensions
and not to help pay down unfunded liabilities. 33 Illinois State FY2018 Budget, p. 38. 34 100th Illinois General Assembly, Senate Bill 1, passed on May 31, 2017. The bill was held in the Senate until July
31, 2017, when it was sent to the Governor. 35 Public Act 100-0465, enacted on August 31, 2017.

15
The new school funding formula is an evidence-based model that replaces the old formula,
which provided General State Aid and supplemental block grants and categorical grants to
school districts using an antiquated equalization formula. The old formula was originally
intended to supplement school districts’ local resources but was criticized for inadequately
funding school districts across Illinois.
The new evidence-based model sets a target funding level or adequacy target based on a school
district’s needs and calculates local capacity to fund schools based on the assessed value of
property available to the school district for taxing, rather than setting the same funding level for
every student, as did the previous formula. It also establishes a base funding minimum to hold
current funding levels harmless, and rolls many of the block grants and categorical grants into
the base funding minimum calculation.
Chicago Public Schools (CPS) was expected to gain additional funding of about $293 million
from the new evidence-based formula in FY2018. This includes about $221 million to cover CPS
teacher normal pension costs and approximately $71 million of an additional $350 million
available through the new formula for allocation statewide. The legislation also authorized the
Chicago Board of Education to increase its property tax levy for teachers’ pensions outside of the
property tax cap.
The compromise included a five-year pilot program offering up to $75 million per year in
income tax credits to individuals or businesses that donate to private school scholarships for low
income students. The program does not take effect until the 2018-2019 school year and taxpayers
may not take credits for the donations until the tax year beginning on January 1, 2018.36 Because
those returns are filed in 2019, the State apparently will not be affected by the revenue loss until
FY2019.
Including the additional $221 million for CPS pension costs, General Funds appropriations for
elementary and secondary education increase by $714 million in FY201837 to $8.2 billion from
$7.5 billion in FY2017.38 Public schools remained open during Illinois’ budget impasse because
full-year spending bills were enacted for K-12 education. Not including CPS pension costs,
General Funds appropriations on an average annual basis from FY2016 to FY2018 increased by
10.7% from the FY2015 level.39
In contrast, higher education was one of the areas of State government hit hardest by the budget
deadlock. Higher education includes nine public universities; the Illinois Community College
Board, which distributes funds to 48 community colleges; and the Monetary Award Program
36 Illinois Department of Revenue, http://www.revenue.state.il.us/InvestInKids/Contributor.htm (last accessed on
February 8, 2018). 37 State of Illinois, General Obligation Bonds, Series of December 2017, Official Statement, November 29, 2017, p.
29. 38 Elementary and secondary education funding figures presented here do not include contributions to the Teachers’
Retirement System of the State of Illinois. 39 General Funds appropriations for the Illinois State Board of Education were $6.755 billion in FY2015, $6.953
billion in FY2016, $7.490 billion in FY2017 and $7.983 billion in FY2018 (excluding CPS pension costs).
16
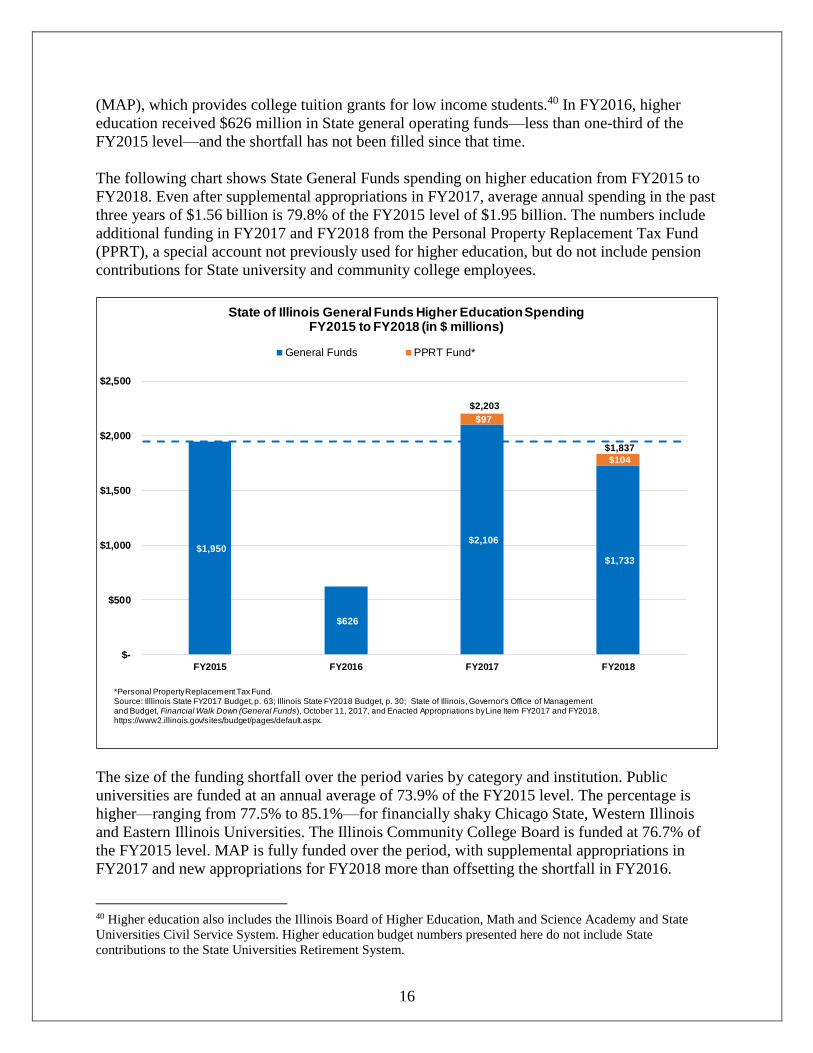
(MAP), which provides college tuition grants for low income students.40 In FY2016, higher
education received $626 million in State general operating funds—less than one-third of the
FY2015 level—and the shortfall has not been filled since that time.
The following chart shows State General Funds spending on higher education from FY2015 to
FY2018. Even after supplemental appropriations in FY2017, average annual spending in the past
three years of $1.56 billion is 79.8% of the FY2015 level of $1.95 billion. The numbers include
additional funding in FY2017 and FY2018 from the Personal Property Replacement Tax Fund
(PPRT), a special account not previously used for higher education, but do not include pension
contributions for State university and community college employees.
$1,950
$626
$2,106
$1,733
$97
$104
$2,203
$1,837
$-
$500
$1,000
$1,500
$2,000
$2,500
FY2015 FY2016 FY2017 FY2018
State of Illinois General Funds Higher Education SpendingFY2015 to FY2018 (in $ millions)
General Funds PPRT Fund*
*Personal Property Replacement Tax Fund.Source: Illlinois State FY2017 Budget, p. 63; Illinois State FY2018 Budget, p. 30; State of Illinois, Governor's Office of Managementand Budget, Financial Walk Down (General Funds), October 11, 2017, and Enacted Appropriations by Line Item FY2017 and FY2018,https://www2.illinois.gov/sites/budget/pages/default.aspx.
The size of the funding shortfall over the period varies by category and institution. Public
universities are funded at an annual average of 73.9% of the FY2015 level. The percentage is
higher—ranging from 77.5% to 85.1%—for financially shaky Chicago State, Western Illinois
and Eastern Illinois Universities. The Illinois Community College Board is funded at 76.7% of
the FY2015 level. MAP is fully funded over the period, with supplemental appropriations in
FY2017 and new appropriations for FY2018 more than offsetting the shortfall in FY2016.
40 Higher education also includes the Illinois Board of Higher Education, Math and Science Academy and State
Universities Civil Service System. Higher education budget numbers presented here do not include State
contributions to the State Universities Retirement System.

17
In FY2018 higher education appropriations of $1.8 billion are down by $113 million, or 5.8%,
from FY2015. Funding for public universities decreases by 9.5% to $1.08 billion, and funding
for community colleges declines by 8.0% to $311.2 million from $338.3 million. MAP funding
increases by 10.2% to $401.3 million from $364.1 million.
FY2018 Spending: Other Areas
Employee group health insurance received no general operating funds during the budget
deadlock, resulting in a backlog of more than $5 billion in unpaid bills in October 2017.41 The
area is fully funded in FY2018 with a General Funds appropriation of almost $1.9 billion.
The budget legislation42 authorized the sale of up to $6 billion in General Obligation bonds to
repay a portion of the total bill backlog, which peaked at $16.7 billion on November 8, 2017.43
Transfers out of General Funds to pay debt service on the backlog bonds is estimated at $534
million in FY2018.
Other statutory transfers decline by $1.8 billion, mainly because of the factors described above
involving direct deposits and one-year reductions in income and sales taxes shared with local
governments and transit districts. In addition, approximately $230 million that had been shown
in the Governor’s proposed FY2018 budget as a transfer from General Funds to pay debt service
on transportation bonds and provide operating funding for the Regional Transportation Authority
was shifted to the Road Fund in the enacted FY2018 budget.44
The Governor’s Office also implemented $156 million in General Funds spending reductions to
curb the FY2018 operating deficit.45 Many human services grant programs that had previously
been targeted for cuts in the Governor’s proposed budgets were reduced or eliminated in
FY2018, including autism services, after school programming and immigrant and refugee
services.46
The largest savings, estimated at $59.4 million, involved the Child Care Assistance Program,
which helps low income families pay for child care so parents can work or go to school. In July
2015 the Rauner administration limited eligibility in the child care program to families with
incomes at 50% of the Federal Poverty Level, down from 185%. The threshold was subsequently
increased to 162% in November 2015, and officials pledged to restore it to the original level
when the State enacted a full budget. Although the FY2018 budget was enacted in July 2017, the
41 State of Illinois, Governor’s Office of Management and Budget, Estimated Bills Outstanding,
https://www2.illinois.gov/sites/budget/Documents/Bill_Backlog_Presentation_December_FY18.pdf (last accessed
on February 8, 2018). 42 Public Act 100-0023, enacted on July 6, 2017. 43 State of Illinois Comptroller, Backlog Voucher Report, http://illinoiscomptroller.gov/, (last accessed on February
8, 2018). 44 Communication between the Civic Federation and the Illinois Department of Transportation, December 4, 2017. 45 State of Illinois, Governor’s Office of Management and Budget, Illinois Economic and Fiscal Policy Report,
October 11, 2017, p. 7; State of Illinois, Governor’s Office of Management and Budget, Financial Walk Down
(General Funds), October 11, 2017. 46 Doug Finke, “Rauner cuts human services, other areas in state budget,” The State Journal-Register, October 17,
2017.

18
eligibility level was not restored until October, which reduced the number of families served.47 In
addition, the administration received a waiver from a new federal requirement that families
renew their eligibility every year. Renewals have continued to be required every six months,
further decreasing the number of participants by making it more difficult to retain services.48
The following table compares General Funds spending in FY2017 and FY2018. The additional
$221 million in State contribution to Chicago teachers’ pensions discussed above is included in
the Government Services category in the table.
FY2017
Preliminary
FY2018
Estimated
$
Change
%
Change
Agency Appropriations*
1. Education 9,597$ 9,716$ 119$ 1.2%
K-12 Education 7,490$ 7,983$ 493$ 6.6%
Higher Education 2,106$ 1,733$ (373)$ -17.7%
2. Economic Development 41$ 79$ 38$ 93.1%
3. Public Safety 1,549$ 1,759$ 210$ 13.6%
4. Human Services 6,719$ 6,073$ (646)$ -9.6%
5. Healthcare 7,169$ 7,119$ (50)$ -0.7%
6. Environment and Culture 61$ 57$ (4)$ -6.0%
7. Government Services 1,385$ 1,331$ (54)$ -3.9%
Unspent Appropriations (2,404)$ (804)$ 1,600$ -66.6%
Agency Expenditures 24,116$ 25,330$ 1,214$ 5.0%
Deficit Spending Reductions -$ (156)$ (156)$ n/a
Net Agency Expenditures 24,116$ 25,173$ 1,057$ 4.4%
Group Insurance Payments -$ 1,858$ 1,858$ n/a
Pension Contributions 6,951$ 6,984$ 33$ 0.5%
Statutory Transfers 2,385$ 573$ (1,812)$ -76.0%
Pension and Capital Bonds Debt Service 2,235$ 2,281$ 46$ 2.1%
Backlog Bonds Debt Service -$ 535$ 535$ n/a
Debt Service** 2,250$ 2,816$ 566$ 25.2%
Total Expenditures 35,702$ 37,403$ 1,701$ 4.8%
FY2017-FY2018 (in $ millions)
Includes Fund for the Advancement of Education, Commitment
to Human Services Fund and Budget Stabilization Fund
Source: State of Illinois, Governor's Office of Management and Budget, Financial Walk Down (General Funds) , October 11, 2017;
Communication with Govenor's Office of Management and Budget.
State of Illinois Estimated General Funds Expenditures:
*Appropriations in FY2017 include spending compelled by court orders, consent decrees and continuing appropriations.
**Includes repayment of $15 million in interfund borrowing in FY2017.
Budget Deficit and Unpaid Bills
For FY2018, estimated General Funds revenues of $35.9 billion and expenditures of $37.4
billion result in an operating deficit of $1.5 billion. That compares with a deficit of $5.4 billion in
FY2017, when the State operated for a second year without a complete budget.
47 Illinois Governor Bruce Rauner, “Governor Rauner Broadens Access to Child Care Assistance Program,” news
release, September 18, 2017. 48 Communication between the Civic Federation and the Governor’s Office of Management and Budget, January 31,
2018.

19
The next table summarizes General Funds results for FY2017 and FY2018, based on recent
estimates by GOMB.
FY2017
Preliminary
FY2018
Estimated
$
Change % Change
State Source Revenues 27,850$ 32,343$ 4,493$ 16.1%
Federal Revenues 2,483$ 3,556$ 1,073$ 43.2%
Total Revenues 30,333$ 35,899$ 5,566$ 18.3%
Net Agency Expenditures 24,116$ 25,173$ 1,057$ 4.4%
Group Insurance Payments -$ 1,858$ 1,858$ n/a
Pension Contributions 6,951$ 6,984$ 33$ 0.5%
Statutory Transfers 2,385$ 573$ (1,812)$ -76.0%
Debt Service* 2,250$ 2,816$ 566$ 25.2%
Total Expenditures 35,702$ 37,403$ 1,701$ 4.8%
Operating Surplus (Deficit) (5,369)$ (1,504)$ 3,865$ -72.0%*Includes repayment of $15 million in interfund borrowing in FY2017.
FY2017-FY2018 (in $ millions)
Includes Fund for the Advancement of Education, Commitment
to Human Services Fund and Budget Stabilization Fund
Source: State of Illinois, Governor's Office of Management and Budget, Financial Walk Down (General Funds) , October 11, 2017;
Communication between Civic Federation and Govenor's Office of Management and Budget.
State of Illinois Estimated General Funds Operating Results
The Illinois Constitution requires that the Governor propose and the General Assembly pass a
balanced budget.49 Governor Rauner’s proposed budget for FY2018, released on February 15,
2017, had an operating deficit of at least $4.6 billion.50 To close the gap, the budget proposal
relied on a bipartisan agreement among legislators that was not achieved.
The General Assembly’s FY2018 budget showed a modest operating surplus of about $360
million that was intended to be used for debt service on the bonds sold to pay down the bill
backlog.51 Although the budget package authorized the sale of up to $6 billion in backlog bonds,
the General Assembly’s plan called for only $3 billion to be issued.
In his veto of the budget legislation, Governor Rauner stated that the financial plan was $2
billion out of balance.52 State budget officials said the deficit estimate covered pension savings
on the Tier 3 plan that would not be realized in FY2018 as well as certain unpaid FY2017 costs,
49 Ill. Const. art. VIII, sec. 2(a) and sec. 2(b). 50 Illinois State FY2018 Budget, p. 78. For more information on the Governor’s FY2018 budget proposal, see the
Institute for Illinois’ Fiscal Sustainability at the Civic Federation, State of Illinois FY2018 Recommended Operating
and Capital Budgets: Analysis and Recommendations, May 9, 2017,
https://www.civicfed.org/iifs/FY18_ILRecommendedBudget (last accessed on February 18, 2018). 51 For more information on the General Assembly’s budget, see the Institute for Illinois’ Fiscal Sustainability at the
Civic Federation blog, “Illinois Ends Two-Year Budget Standoff,” July 7, 2017,
https://www.civicfed.org/iifs/blog/illinois-ends-two-year-budget-standoff (last accessed on February 8, 2018). 52 100th Illinois General Assembly, Senate Bill 9, Governor’s Veto Message, July 4, 2017,
http://www.ilga.gov/legislation/fulltext.asp?DocName=10000SB0009gms&GA=100&SessionId=91&DocTypeId=S
B&LegID=98852&DocNum=9&GAID=14&Session= (last accessed on February 8, 2018).

20
such as day-to-day agency expenses, that had not been accounted for in the legislature’s
budget.53
In October 2017, GOMB estimated the operating deficit at $1.7 billion—reduced to $1.5 billion
after the administratively implemented savings of $156 million.54 That calculation was based
partly on weaker than expected revenues in FY2017, which left the State with a lower revenue
base in FY2018.55 In addition, projected debt service was nearly doubled after the Governor’s
Office decided to issue the full $6 billion authorized by the budget. The deficit estimate also
reflected the failure to launch the Tier 3 pension plan in FY2018.
Even the $1.5 billion deficit estimate depends on assumptions about revenues and expenditures
that may not prove to be accurate. As noted above, the FY2018 budget includes $300 million of
revenues ($240 million net of associated expenses) from the planned sale of the Thompson
Center in Chicago. However, these revenues may not materialize if the transaction cannot be
implemented at that sale price or by the end of FY2018. On the other hand, speedier federal
Medicaid reimbursement could lower the deficit.
With respect to expenditures, the FY2018 budget does not provide for any increased wage costs
for the State’s largest union, the American Federation of State, County and Municipal
Employees (AFSCME). AFSCME’s members, who account for about 77% of the State’s
workforce, have been operating without a contract since the end of FY2015.56 The Illinois Labor
Relations Board ruled in the fall of 2016 that the negotiations had reached an impasse, and
AFSCME is currently seeking review in the appellate courts. Separately, an appeals court ruled
in November 2017 that the State violated the law when it stopped awarding step increases after
the contract expired.57 Step increases are automatic annual increases for newer workers as they
add years of service.
In addition, required Medicaid funding of $445 million in FY2017 was not budgeted in FY2018,
according to GOMB.58 It is also unclear to what extent interest penalty payments on overdue
bills have been accounted for in the FY2018 deficit estimate.
Illinois’ balanced budget requirements do not prevent deficits from being carried from one year
to the next. In recent years, the State has dealt with its deficits by delaying payments to vendors,
53 Communication between the Civic Federation and the Governor’s Office of Management and Budget, February 1,
2018. 54 State of Illinois, Governor’s Office of Management and Budget, Illinois Economic and Fiscal Policy Report,
October 12, 2017, p. 7. 55 For more information, see see the Institute for Illinois’ Fiscal Sustainability at the Civic Federation blog,
“Governor’s Report Shows $1.5 Billion Budget Deficit in FY2018,” October 13, 2017,
https://www.civicfed.org/iifs/blog/governors-report-shows-15-billion-budget-deficit-fy2018 (last accessed on
February 8, 2018). 56 State of Illinois, General Obligation Bonds, Series of December 2017, Official Statement, November 29, 2017, p.
32. 57 Doug Finke, “Rauner administration to appeal AFSCME step pay ruling,” The State Journal-Register, December
19, 2017. 58 State of Illinois, Governor’s Office of Management and Budget, Illinois Economic and Fiscal Policy Report,
October 12, 2017, p. 9. Another $757 million in FY2017 costs were either not budgeted for in FY2017 or not
addressed by the backlog borrowing, but GOMB stated that these were already factored into backlog estimates.

21
school districts, local governments and other State funds, resulting in billions of dollars of unpaid
bills at the end of the fiscal year. Because of the backlog, the State begins each fiscal year in a
hole, using revenues from the current year to pay off previous years’ bills and limiting revenues
available for current spending.
The backlog includes bills based on budgeted expenses, which are supposed to be paid in the
lapse period—the time during which this year’s bills may be paid with next year’s revenues.
Most bills are due to the Comptroller by two months after the end of the fiscal year,59 but the
Comptroller has until December 31 to pay them.60 State vendors still owed money after the end
of the lapse period based on unpaid appropriations may seek compensation in the Illinois Court
of Claims.61
The backlog also includes other costs not yet appropriated but expected to be paid eventually.
Before the budget impasse, these unappropriated costs consisted mainly of so-called Section 25
liabilities, which under State law may be paid from future years’ appropriations.62 The authority
to defer Medicaid bills at the Department of Healthcare and Family Services was sharply
restricted beginning in FY2013; group health insurance bills currently represent the major
Section 25 liability. Group health insurance received no general operating funds during the
deadlock, but the bills must eventually be paid due to State law and union contracts.
Since the end of FY2015, the backlog numbers have also included unappropriated costs that the
State may not be legally required to pay but has historically covered. According to GOMB, the
FY2018 budget does not include about $1.2 billion in expenses from FY2017 that have yet to be
appropriated.63 However, all of those expenses except required Medicaid funding of $445 million
are accounted for in the estimated backlog.
59 This deadline was extended to three months for FY2017. 60 30 ILCS 105/25(b) and (m). The Department of Healthcare and Family Services may submit bills through
December 31 [30 ILCS 105/25(k)(3)]. 61 705 ILCS 505/24. 62 30 ILCS 105/25. 63 State of Illinois, Governor’s Office of Management and Budget, Illinois Economic and Fiscal Policy Report,
October 12, 2017, p. 9.

22
The following chart shows the backlog of unpaid bills from FY2012 to estimated FY2018. The
backlog declined from $8.1 billion in FY2012 to $5.1 billion in FY2015, mainly due to revenue
from the income tax increase and transfers from other State funds. Without a complete general
operating budget in FY2016 and FY2017, spending continued without sufficient revenues,
leading to an estimated $14.7 billion in bills at the end of FY2017. The projected decline to $7.5
billion in FY2018 reflects the October 2017 sale of $6 billion of bonds directed at reducing the
backlog.
$8,059
$6,046 $5,626
$5,119
$6,997
$14,711
$7,500
$-
$2,000
$4,000
$6,000
$8,000
$10,000
$12,000
$14,000
$16,000
FY2012 FY2013 FY2014 FY2015 FY2016 FY2017 FY2018**
State of Illinois Unpaid General Funds Bills:FY2012-FY2018 (in $ millions)*
*General Funds bills and other payables at year-end that must be paid from the next fiscal year's revenues.**Projected.Source: State of Illinois, Governor's Office of Management and Budget, Illinois Economic and Fiscal Policy Report, October 12, 2017, p.11; Illinois State FY2018Budget, p. 79; Illinois State FY2017 Budget, p. 76; Illinois State FY2016 Budget, p.3-7; Illinois State FY2015 Budget, p. 2-23.
The Comptroller’s Office has said that the bond sale immediately reduced the backlog by about
$8.7 billion and was mainly used to pay down group health insurance and Medicaid bills.64 In
addition to the expected proceeds of $6 billion, the State received a premium of $482 million on
the bond price and $2.2 billion in federal Medicaid reimbursements.65
64 State of Illinois Comptroller, Office of the Comptroller’s Backlog Reduction Action, http://illinoiscomptroller.gov/
(last accessed on February 8, 2017). 65 For more information on the bill backlog reduction, see the Institute for Illinois’ Fiscal Sustainability at the Civic
Federation blog, “Illinois Achieves Additional Backlog Reduction from Borrowing,” December 8, 2017,
https://www.civicfed.org/iifs/blog/illinois-achieves-additional-backlog-reduction-borrowing (last accessed on
February 8, 2018).

23
The bond sale resulted in a larger backlog reduction than GOMB initially projected.66 As a
result, the amount of unpaid bills at end of FY2018 could be below the previously forecasted
$7.5 billion, but the outcome will depend on uncertainties involving the FY2018 operating
deficit. In addition to bond-related funds, the GOMB backlog reduction plan included about
$850 million in borrowing and transfers from accounts outside the General Funds, of a total of
$1.5 billion authorized in the FY2018 budget,67 and the use of $990 million in balances in other
funds that are earmarked for specific purposes.
The bond sale lowered the State’s interest cost on most bills that were paid down by the
difference between the bond coupon rate of 3.5% and the penalty rates of 9% to 12% that the
State is required to pay on certain overdue bills. Under the State Prompt Payment Act, interest
accrues at 1% a month, or 12% annually, on proper bills that are not paid within 90 days.68 Other
claims, including those from healthcare providers, accrue interest at 9% a year after 30 days
under the Illinois Insurance Code.69
66 State of Illinois, Governor’s Office of Management and Budget, Illinois Economic and Fiscal Policy Report,
October 12, 2017, p. 9. For more information, see Institute for Illinois’ Fiscal Sustainability at the Civic Federation
blog, “Illinois Achieves Additional Backlog Reduction From Borrowing,” December 8, 2017. 67 Public Act 100-0023, enacted on July 6, 2017. The act authorized up to $1.2 billion in interfund borrowing
through December 31, 2018 that must be paid back within 24 months of the borrowing and $293 million in transfers
from funds outside General Funds in FY2018. 68 30 ILCS 540. Proper bills are defined as those that include the information needed to process the payment. 69 215 ILCS 5/368(a).

24
Illinois spent $1.6 billion on late payment interest penalties from FY2008 through January 2018,
according to data from the Comptroller’s Office.70 As shown in the chart below, most of the
penalties were paid by the Departments of Healthcare and Family Services (HFS) and Central
Management Services (CMS). HFS administers the Medicaid program and was in charge of
employee group health insurance before FY2013, when that program was shifted to CMS.
$30.2 $39.6
$97.8 $90.9
$136.5
$317.9
$160.0
$126.1
$23.6
$226.4
$337.9 **
$-
$50
$100
$150
$200
$250
$300
$350
$400
FY2008 FY2009 FY2010 FY2011 FY2012 FY2013 FY2014 FY2015 FY2016 FY2017FY2018Jul-Jan
CMS $0.5 $0.4 $3.3 $1.8 $0.2 $120.3 $143.2 $110.4 $12.0 $156.8 $331.6
HFS $25.9 $32.4 $68.1 $52.6 $130.6 $190.2 $15.3 $13.0 $6.2 $30.3 $3.9
Other $3.8 $6.8 $26.4 $36.5 $5.7 $7.4 $1.5 $2.7 $5.4 $39.3 $2.4
Total* $30.2 $39.6 $97.8 $90.9 $136.5 $317.9 $160.0 $126.1 $23.6 $226.4 $337.9
State of Illinois Expenditures on Interest Penalties on Late Bills:FY2008-FY2018 (in $ millions)*
CMS
HFS
Other
* Includes prompt payment interest, timely payment interest and other interest. Totals may not sum due to rounding.** The State of Illinois Comtroller has reported that $887 million in interest penalties had accrued by December 2017. This figure suggests the magnitude of accruedinterest but is based on a different method of determining the timing of expenditures and is not directly comparable to the f igures presented here.Source: Civic Federation calculatons based on data from State of Illinois Comptroller.
Through the first seven months of FY2018, State spending on interest penalties of $337.9 million
has already exceeded the previous yearly high of $317.9 million in FY2013. Interest penalties are
paid after the State pays the underlying bills, so spending is expected to climb as the State pays
penalties on bills cleared due to the bond sale. For the first six months of FY2018, the State spent
$92.1 million, but the expenditure in January 2018 rose to $245.8 million.
A recent report showed interest penalties owed on bills already paid and bills held at the
Comptroller’s Office or at State agencies totaled $887 million on December 31, 2017.71 These
numbers suggest the magnitude of accrued interest but are not comparable to the spending totals
in the chart. Although all of the numbers are from the Comptroller’s Office, they are based on
70 Civic Federation calculations based on data from the State of Illinois Comptroller’s website,
https://ledger.illinoiscomptroller.gov/find-an-expense/by-detailed-object/ (last accessed on February 8, 2018). 71 State of Illinois Comptroller, Debt Transparency Report Summary, January 22, 2018, p. 3,
https://ledger.illinoiscomptroller.gov/ledger/assets/file/DTA/current/DTAReport.pdf (last accessed February 8,
2018).
25
different methods of determining the timing of expenditures.72 Moreover, it remains to be seen
when the accrued penalties will be paid.
Credit Ratings and Bond Costs
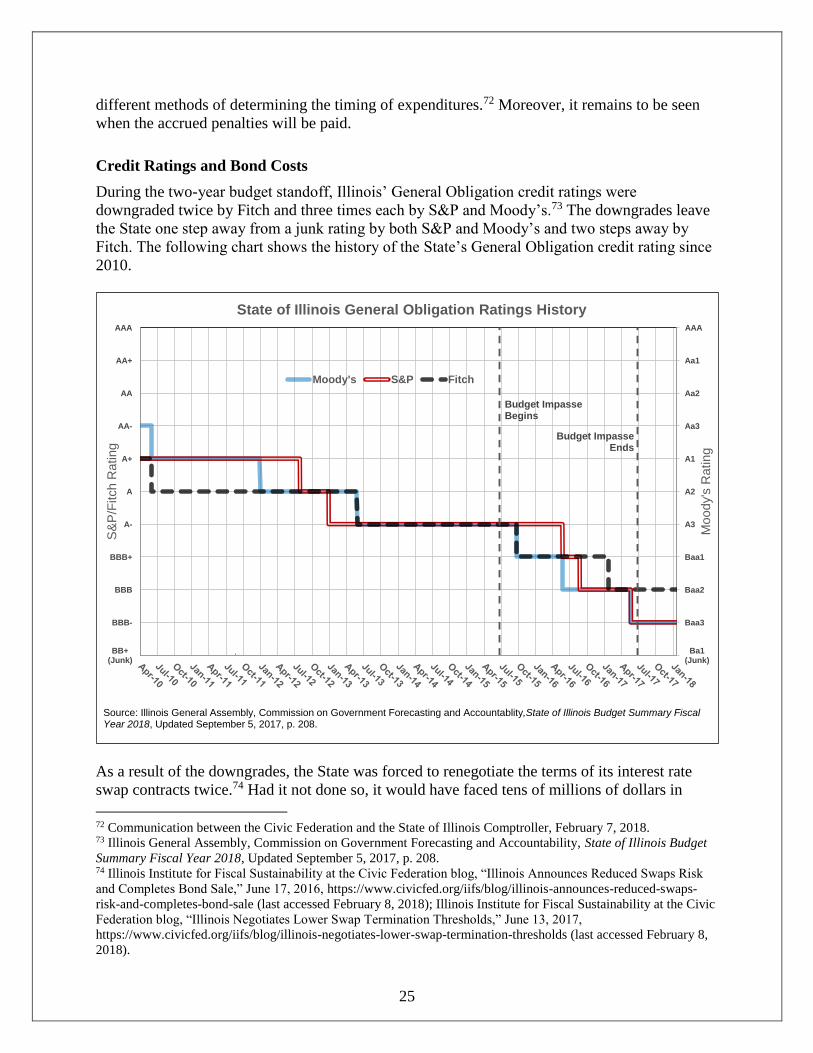
During the two-year budget standoff, Illinois’ General Obligation credit ratings were
downgraded twice by Fitch and three times each by S&P and Moody’s.73 The downgrades leave
the State one step away from a junk rating by both S&P and Moody’s and two steps away by
Fitch. The following chart shows the history of the State’s General Obligation credit rating since
2010.
AAA
AA+
AA
AA-
A+
A
A-
BBB+
BBB
BBB-
BB+(Junk)
AAA
Aa1
Aa2
Aa3
A1
A2
A3
Baa1
Baa2
Baa3
Ba1(Junk)
Budget ImpasseBegins
Budget Impasse Ends
Moody's
Rating
S&
P/F
itch R
ating
State of Illinois General Obligation Ratings History
Moody's S&P Fitch
Source: Illinois General Assembly, Commission on Government Forecasting and Accountablity,State of Illinois Budget Summary Fiscal Year 2018, Updated September 5, 2017, p. 208.
As a result of the downgrades, the State was forced to renegotiate the terms of its interest rate
swap contracts twice.74 Had it not done so, it would have faced tens of millions of dollars in
72 Communication between the Civic Federation and the State of Illinois Comptroller, February 7, 2018. 73 Illinois General Assembly, Commission on Government Forecasting and Accountability, State of Illinois Budget
Summary Fiscal Year 2018, Updated September 5, 2017, p. 208. 74 Illinois Institute for Fiscal Sustainability at the Civic Federation blog, “Illinois Announces Reduced Swaps Risk
and Completes Bond Sale,” June 17, 2016, https://www.civicfed.org/iifs/blog/illinois-announces-reduced-swaps-
risk-and-completes-bond-sale (last accessed February 8, 2018); Illinois Institute for Fiscal Sustainability at the Civic
Federation blog, “Illinois Negotiates Lower Swap Termination Thresholds,” June 13, 2017,
https://www.civicfed.org/iifs/blog/illinois-negotiates-lower-swap-termination-thresholds (last accessed February 8,
2018).

26
termination payments for failing to meet credit thresholds. Under the revised terms of the
contracts the State is currently two credit notches above termination.
Local governments also suffered during the standoff due to investor skepticism about the state of
Illinois’ finances. One asset manager estimated that the “Illinois Penalty” resulted in $930
million in additional annual debt service cost to local governments throughout the State.75
After the two-year anniversary of the budget standoff on July 1, 2017 passed by with no budget
in place, credit ratings companies warned that more downgrades were imminent.76 However,
within two weeks of the General Assembly’s July 6 override of the Governor’s budget veto, all
three ratings companies stated that they would refrain from further downgrades for the time
being.77
75 John Miller, Nuveen Asset Management, Testimony before the Illinois General Assembly, House Committee on
Revenue, May 11, 2017. 76 Fitch Ratings, “Fitch: Illinois Makes Some Progress on Budget Impasse,” news release, July 3, 2017; Moody’s
Investors Service, “Rating Action: Moody's Places Illinois’ GO and Related Ratings Under Review for Possible
Downgrade,” news release, July 5, 2017. 77 Karen Pierog, “Illinois avoids downgrade to junk as S&P affirms BBB-minus rating,” Reuters, July 12, 2017;
Fitch Ratings, “Fitch Affirms Illinois at ‘BBB’; Outlook Negative,” news release, July 17, 2017; Moody’s Investors
Service, “Moody's confirms Illinois’ Baa3 GO and related ratings, affecting $32 billion of debt; outlook negative,”
news release, July 20, 2017.

27
The bond market reacted positively to the budget passage; spreads between the yields on Illinois
bonds traded in the secondary market and a market index dropped precipitously.78 When the
State returned to market in November 2017 to issue $6 billion in backlog bonds and $750 million
in capital bonds, it priced at substantially lower interest rates than it had one year before. The
following chart compares the spreads between Illinois’ yields and a market index for the capital
bonds issued in November 2016 and those issued one year later.79 For example, the spreads for
bonds maturing 25 years from issuance were 0.37 percentage points lower, saving the State
substantial interest cost.
0.0%
0.5%
1.0%
1.5%
2.0%
2.5%
1 2 3 4 5 6 7 8 9 10 11 12 13 14 15 16 17 18 19 20 21 22 23 24 25
Yie
ld S
pre
ad
Years to Maturity*
Comparison of Illinois GO Bond Yield SpreadsSeries of November 2016 and December 2017
November 2016
December 2017
Difference
*Maturities with coupons other than 5.00% are omitted.Source: Thompson Reuters Muncipal Market Data interpolated AAA benchmark rates as of November 8, 2016 and November 29, 2017;State of Illinois, General Obligation Bonds, Series of November 2016, Official Statement, November 8, 2016; State of Illinois, General Obligation Bonds, Series of December 2017, Official Statement, November 29, 2017.
However, the challenges for Illinois’ credit rating and market access are far from over. Recently,
spreads in secondary market trading have begun to rise again, indicating that investors may be
concerned about the potential for another budget impasse.80 Both Fitch and Moody’s maintain a
negative outlook of the State’s ratings.81
78 Elizabeth Campbell, “Illinois Dodges Downgrade to Junk,” Bloomberg, July 20, 2017. 79 Thompson Reuters Municipal Market Data interpolated AAA benchmark rates as of November 8, 2016 and
November 29, 2017; State of Illinois, General Obligation Bonds, Series of November 2016, Official Statement,
November 8, 2016; State of Illinois, General Obligation Bonds, Series of December 2017, Official Statement,
November 29, 2017. 80 Elizabeth Campbell and Zachary Hansen, “Illinois Bond Spread Hits Six-Month High Over Political Discord,”
Bloomberg, January 24, 2018. 81 Karen Pierog, “Illinois avoids downgrade to junk as S&P affirms BBB-minus rating,” Reuters, July 12, 2017;
Fitch Ratings, “Fitch Affirms Illinois at ‘BBB’; Outlook Negative,” news release, July 17, 2017; Moody’s Investors
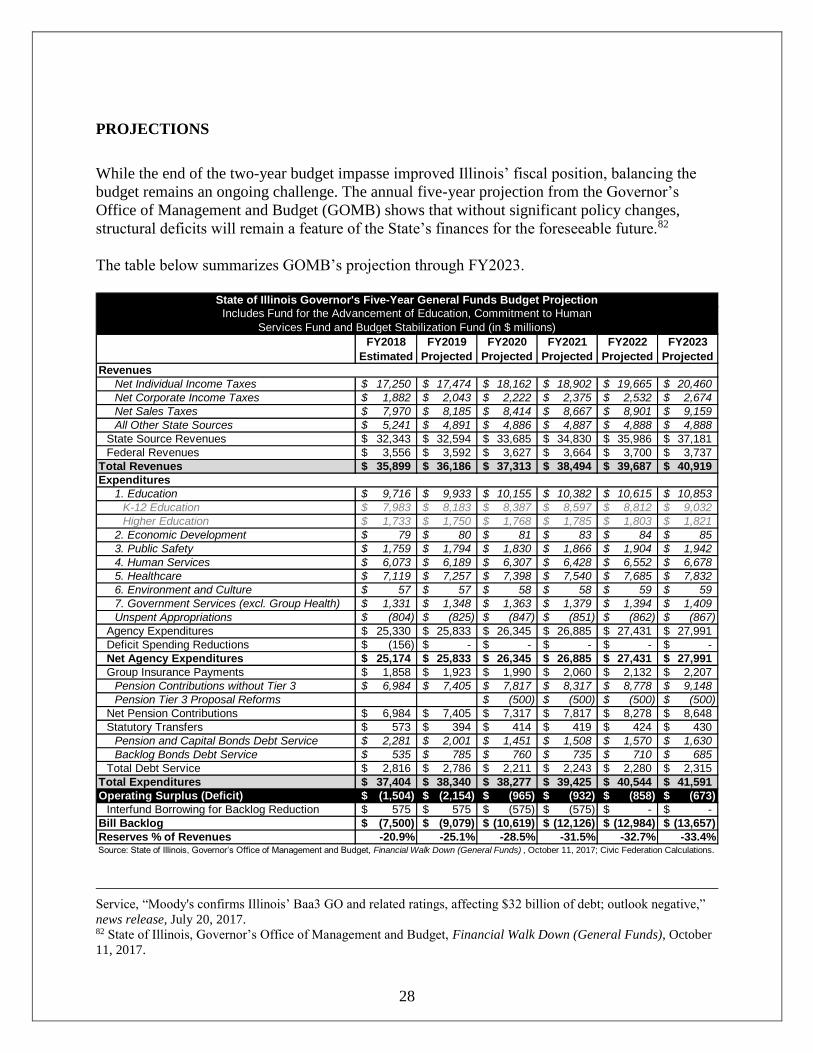
28
PROJECTIONS
While the end of the two-year budget impasse improved Illinois’ fiscal position, balancing the
budget remains an ongoing challenge. The annual five-year projection from the Governor’s
Office of Management and Budget (GOMB) shows that without significant policy changes,
structural deficits will remain a feature of the State’s finances for the foreseeable future.82
The table below summarizes GOMB’s projection through FY2023.
FY2018
Estimated
FY2019
Projected
FY2020
Projected
FY2021
Projected
FY2022
Projected
FY2023
Projected
Net Individual Income Taxes 17,250$ 17,474$ 18,162$ 18,902$ 19,665$ 20,460$
Net Corporate Income Taxes 1,882$ 2,043$ 2,222$ 2,375$ 2,532$ 2,674$
Net Sales Taxes 7,970$ 8,185$ 8,414$ 8,667$ 8,901$ 9,159$
All Other State Sources 5,241$ 4,891$ 4,886$ 4,887$ 4,888$ 4,888$
State Source Revenues 32,343$ 32,594$ 33,685$ 34,830$ 35,986$ 37,181$
Federal Revenues 3,556$ 3,592$ 3,627$ 3,664$ 3,700$ 3,737$
Total Revenues 35,899$ 36,186$ 37,313$ 38,494$ 39,687$ 40,919$
1. Education 9,716$ 9,933$ 10,155$ 10,382$ 10,615$ 10,853$
K-12 Education 7,983$ 8,183$ 8,387$ 8,597$ 8,812$ 9,032$
Higher Education 1,733$ 1,750$ 1,768$ 1,785$ 1,803$ 1,821$
2. Economic Development 79$ 80$ 81$ 83$ 84$ 85$
3. Public Safety 1,759$ 1,794$ 1,830$ 1,866$ 1,904$ 1,942$
4. Human Services 6,073$ 6,189$ 6,307$ 6,428$ 6,552$ 6,678$
5. Healthcare 7,119$ 7,257$ 7,398$ 7,540$ 7,685$ 7,832$
6. Environment and Culture 57$ 57$ 58$ 58$ 59$ 59$
7. Government Services (excl. Group Health) 1,331$ 1,348$ 1,363$ 1,379$ 1,394$ 1,409$
Unspent Appropriations (804)$ (825)$ (847)$ (851)$ (862)$ (867)$
Agency Expenditures 25,330$ 25,833$ 26,345$ 26,885$ 27,431$ 27,991$
Deficit Spending Reductions (156)$ -$ -$ -$ -$ -$
Net Agency Expenditures 25,174$ 25,833$ 26,345$ 26,885$ 27,431$ 27,991$
Group Insurance Payments 1,858$ 1,923$ 1,990$ 2,060$ 2,132$ 2,207$
Pension Contributions without Tier 3 6,984$ 7,405$ 7,817$ 8,317$ 8,778$ 9,148$
Pension Tier 3 Proposal Reforms (500)$ (500)$ (500)$ (500)$
Net Pension Contributions 6,984$ 7,405$ 7,317$ 7,817$ 8,278$ 8,648$
Statutory Transfers 573$ 394$ 414$ 419$ 424$ 430$
Pension and Capital Bonds Debt Service 2,281$ 2,001$ 1,451$ 1,508$ 1,570$ 1,630$
Backlog Bonds Debt Service 535$ 785$ 760$ 735$ 710$ 685$
Total Debt Service 2,816$ 2,786$ 2,211$ 2,243$ 2,280$ 2,315$
Total Expenditures 37,404$ 38,340$ 38,277$ 39,425$ 40,544$ 41,591$
Operating Surplus (Deficit) (1,504)$ (2,154)$ (965)$ (932)$ (858)$ (673)$
Interfund Borrowing for Backlog Reduction 575$ 575$ (575)$ (575)$ -$ -$
Bill Backlog (7,500)$ (9,079)$ (10,619)$ (12,126)$ (12,984)$ (13,657)$
Reserves % of Revenues -20.9% -25.1% -28.5% -31.5% -32.7% -33.4%Source: State of Illinois, Governor’s Office of Management and Budget, Financial Walk Down (General Funds) , October 11, 2017; Civic Federation Calculations.
Includes Fund for the Advancement of Education, Commitment to Human
Services Fund and Budget Stabilization Fund (in $ millions)
Revenues
Expenditures
State of Illinois Governor's Five-Year General Funds Budget Projection
Service, “Moody's confirms Illinois’ Baa3 GO and related ratings, affecting $32 billion of debt; outlook negative,”
news release, July 20, 2017. 82 State of Illinois, Governor’s Office of Management and Budget, Financial Walk Down (General Funds), October
11, 2017.
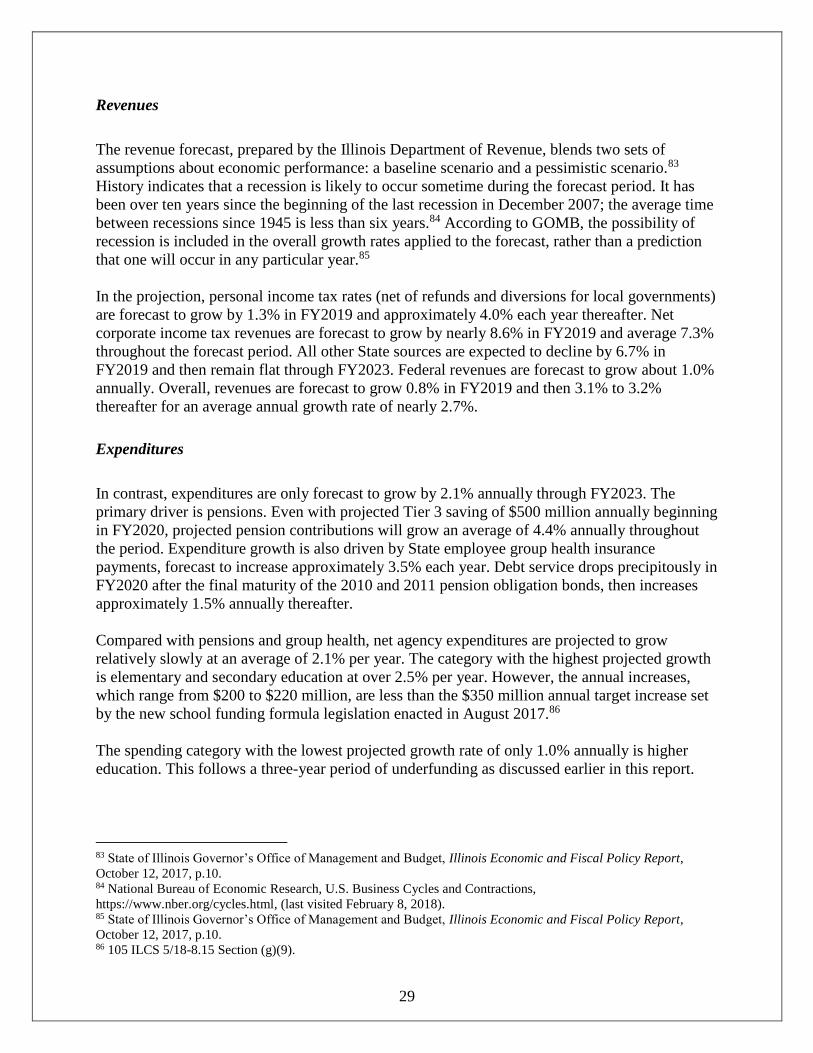
29
Revenues
The revenue forecast, prepared by the Illinois Department of Revenue, blends two sets of
assumptions about economic performance: a baseline scenario and a pessimistic scenario.83
History indicates that a recession is likely to occur sometime during the forecast period. It has
been over ten years since the beginning of the last recession in December 2007; the average time
between recessions since 1945 is less than six years.84 According to GOMB, the possibility of
recession is included in the overall growth rates applied to the forecast, rather than a prediction
that one will occur in any particular year.85
In the projection, personal income tax rates (net of refunds and diversions for local governments)
are forecast to grow by 1.3% in FY2019 and approximately 4.0% each year thereafter. Net
corporate income tax revenues are forecast to grow by nearly 8.6% in FY2019 and average 7.3%
throughout the forecast period. All other State sources are expected to decline by 6.7% in
FY2019 and then remain flat through FY2023. Federal revenues are forecast to grow about 1.0%
annually. Overall, revenues are forecast to grow 0.8% in FY2019 and then 3.1% to 3.2%
thereafter for an average annual growth rate of nearly 2.7%.
Expenditures
In contrast, expenditures are only forecast to grow by 2.1% annually through FY2023. The
primary driver is pensions. Even with projected Tier 3 saving of $500 million annually beginning
in FY2020, projected pension contributions will grow an average of 4.4% annually throughout
the period. Expenditure growth is also driven by State employee group health insurance
payments, forecast to increase approximately 3.5% each year. Debt service drops precipitously in
FY2020 after the final maturity of the 2010 and 2011 pension obligation bonds, then increases
approximately 1.5% annually thereafter.
Compared with pensions and group health, net agency expenditures are projected to grow
relatively slowly at an average of 2.1% per year. The category with the highest projected growth
is elementary and secondary education at over 2.5% per year. However, the annual increases,
which range from $200 to $220 million, are less than the $350 million annual target increase set
by the new school funding formula legislation enacted in August 2017.86
The spending category with the lowest projected growth rate of only 1.0% annually is higher
education. This follows a three-year period of underfunding as discussed earlier in this report.
83 State of Illinois Governor’s Office of Management and Budget, Illinois Economic and Fiscal Policy Report,
October 12, 2017, p.10. 84 National Bureau of Economic Research, U.S. Business Cycles and Contractions,
https://www.nber.org/cycles.html, (last visited February 8, 2018). 85 State of Illinois Governor’s Office of Management and Budget, Illinois Economic and Fiscal Policy Report,
October 12, 2017, p.10. 86 105 ILCS 5/18-8.15 Section (g)(9).

30
The average growth rate for net agency expenditures of 2.1% is a conservative estimate for
several reasons. First, the projections do not include an estimate for interest penalties on the
backlog, even though the backlog grows throughout the period.87 Second, according to GOMB
officials the projections assume zero salary increases or cost of living adjustments throughout the
five-year period. Since these are subject to collective bargaining, the ability to avoid increases is
not entirely in the State’s control. Finally, estimated pension contributions may be too low. There
has been no publicly released actuarial analysis performed on the Tier 3 plan, which shifts the
pension costs of future hires to universities and downstate school districts. It is not clear whether
the plan will achieve the projected $500 million in annual savings to the State beginning in
FY2020, or what effects the plan will have on the unfunded liabilities of the two pension
systems.
Moreover, the pension contribution amounts in the projection were calculated before trustees of
the five State retirement systems signed off on the final payments for FY2019. The amounts
shown for teachers’ pensions are too low; the certified FY2019 contribution for the Teachers’
Retirement System is $4.47 billion,88 $143 million higher than the $4.32 billion in the projection.
For the following four years through FY2023, the projection’s TRS contribution numbers are
below the most recent actuarial estimates by a total of $671 million.89
On the other hand, the projection might overstate the required contribution for the State
Universities Retirement System (SURS). The General Funds payment to SURS is offset by
payments from the State Pensions Fund, which receives proceeds from the sale of unclaimed
property. While the projection assumes annual payments from the fund of $140 million in
FY2019 and beyond, the actual payment in FY2019 is $215 million in FY2018 and was $190
million or higher in the previous three years.90
Budget Balance and Backlog
GOMB’s forecast predicts continued financial difficulty for Illinois. The projections show a
deficit of over $2.1 billion in FY2019 followed by smaller deficits each year thereafter. After an
FY2018 reduction to $7.5 billion achieved through borrowing, the backlog is projected to grow
to over $13 billion in FY2023, almost one-third of annual revenues. Despite the efforts taken by
the State to end the budget impasse, there is much more work to be done to put Illinois on the
path to fiscal sustainability.
87 Communication between the Civic Federation and the Governor’s Office of Management and Budget. 88 State of Illinois, Office of the Auditor General, State Actuary’s Report, December 2017, p. 11. 89 Teachers’ Retirement System of the State of Illinois, Actuarial Valuation and Review of Pension Benefits as of
June 30, 2017, January 8, 2017, pp. 62-63. 90 Illinois State FY2018 Budget, p. 78; Communication between the Civic Federation and the Governor’s Office of
Management and Budget.

31
CIVIC FEDERATION RECOMMENDATIONS
The Governor’s five-year projection illustrates the fiscal reality that despite the recent tax
increases, the State of Illinois’ current revenue and spending structures do not provide a
sustainable basis for funding essential government services and will lead to unacceptable growth
in unpaid bills through FY2023.
Moreover, the Civic Federation does not believe that it is possible to correct the State’s course
through cuts alone. To clear the projected FY2019 operating deficit of $2.1 billion, the State
would have to reduce net agency spending by $1.5 billion from FY2018, a 5.9% cut. After that,
in order to eliminate the backlog by FY2023, net agency spending could grow by only $245
million per year, an annual increase of 1.0%. This would result in annual net agency spending of
$2.4 billion to $3.1 billion lower than the Governor’s baseline forecast.
The Civic Federation does not believe that these spending reductions are sustainable, given the
cuts to most areas except K-12 education in the previous two years. Furthermore, GOMB’s
projected net agency growth rate is already a highly conservative assumption. Finally, while a
cuts-only plan balances the budget and eliminates the bill backlog by FY2023, it does not
address the State’s pension underfunding or allow for the creation of a rainy day fund.
The Civic Federation presents the following comprehensive plan and recommendations to
stabilize the State’s operating budget and establish a balanced path toward a more sustainable
financial future.
Comprehensive Plan
In order to achieve stability in the State’s long-term finances, the Civic Federation proposes that
the comprehensive financial plan should meet the following goals:
Ensure future annual operating budgets are balanced;
Eliminate the backlog of unpaid bills;
Provide achievable spending limits;
Avoid drastic revenue cliffs;
Broaden the tax base to provide sustainable revenue sources;
Include additional assistance for local governments;
Set aside reserves for an adequate rainy day fund; and
Address Illinois’ long term challenges, such as unfunded pension liabilities and
infrastructure needs.
The Civic Federation’s comprehensive plan proposes the following policy changes to improve
the State’s fiscal position:
1. Restrict net agency spending growth to 2.1% annually through FY2023;
2. Reduce late bill interest penalty payments to a market-based rate;
3. Eliminate the exclusion of federally-taxable retirement income from the State’s income
tax;

32
4. Extend the State sales tax to the 14 additional services taxed by the State of Wisconsin;
5. Work toward building a rainy day fund equal to 10% of General Funds revenues;
6. Place a constitutional amendment on the ballot to limit the pension protection clause and
allow reasonable, moderate changes to current employee and retiree benefits necessary to
secure the financial sustainability of the State and local governments and the pension
systems themselves;
7. In the absence of benefit reform, require annual supplemental payments to the State’s
systems of $600 million from FY2020 through FY2034 and $481 million in FY2035;
8. Merge the Chicago Teachers’ Pension Fund (CTPF) with the Teachers’ Retirement
System, with the State shifting the normal costs onto local school districts and assuming
responsibility for unfunded liabilities;
9. Create a bipartisan commission to study the elimination of duplicative higher education
programs, reallocation of resources across programs and campuses and the closure or
consolidation of campuses; Consolidate the governance of State universities into a single,
statewide Board of Trustees;
10. Initiate a new capital plan with a comprehensive analysis and prioritization of the State’s
infrastructure needs, funded by an increase in the motor fuel tax and potentially by
vehicle miles traveled and congestion taxes; and
11. Consolidate and streamline government units in Illinois.
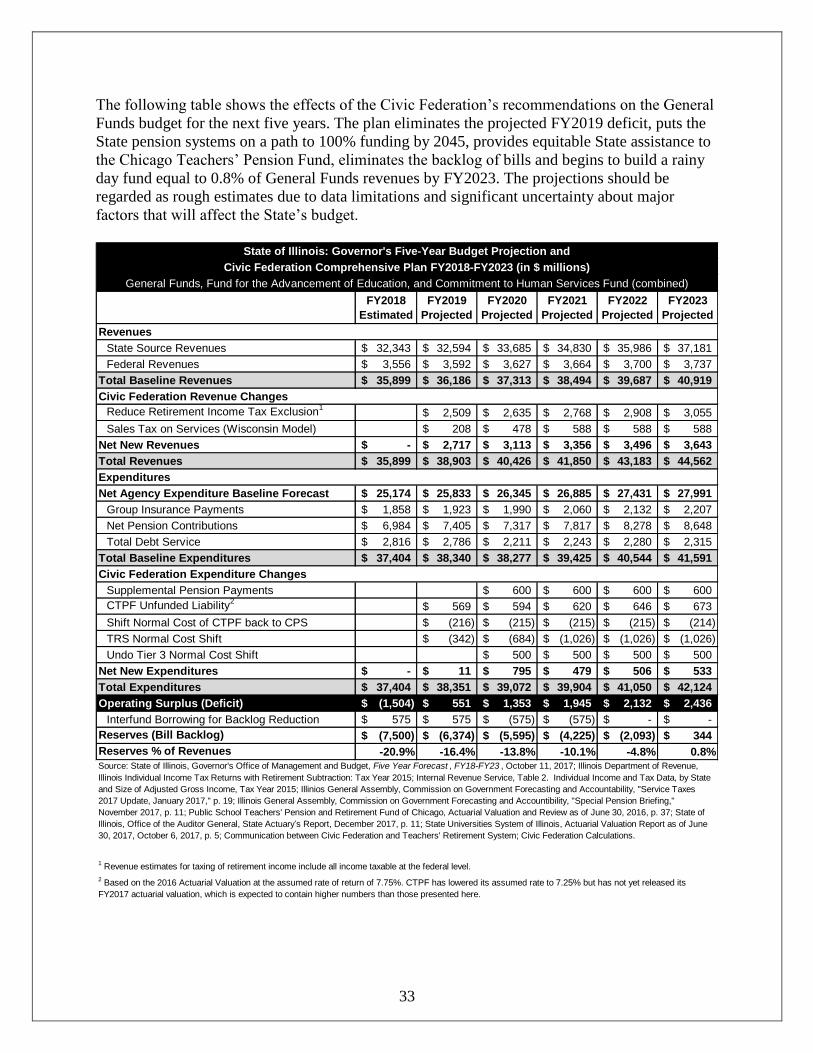
33
The following table shows the effects of the Civic Federation’s recommendations on the General
Funds budget for the next five years. The plan eliminates the projected FY2019 deficit, puts the
State pension systems on a path to 100% funding by 2045, provides equitable State assistance to
the Chicago Teachers’ Pension Fund, eliminates the backlog of bills and begins to build a rainy
day fund equal to 0.8% of General Funds revenues by FY2023. The projections should be
regarded as rough estimates due to data limitations and significant uncertainty about major
factors that will affect the State’s budget.
FY2018
Estimated
FY2019
Projected
FY2020
Projected
FY2021
Projected
FY2022
Projected
FY2023
Projected
State Source Revenues 32,343$ 32,594$ 33,685$ 34,830$ 35,986$ 37,181$
Federal Revenues 3,556$ 3,592$ 3,627$ 3,664$ 3,700$ 3,737$
Total Baseline Revenues 35,899$ 36,186$ 37,313$ 38,494$ 39,687$ 40,919$
Reduce Retirement Income Tax Exclusion1
2,509$ 2,635$ 2,768$ 2,908$ 3,055$
Sales Tax on Services (Wisconsin Model) 208$ 478$ 588$ 588$ 588$
Net New Revenues -$ 2,717$ 3,113$ 3,356$ 3,496$ 3,643$
Total Revenues 35,899$ 38,903$ 40,426$ 41,850$ 43,183$ 44,562$
Net Agency Expenditure Baseline Forecast 25,174$ 25,833$ 26,345$ 26,885$ 27,431$ 27,991$
Group Insurance Payments 1,858$ 1,923$ 1,990$ 2,060$ 2,132$ 2,207$
Net Pension Contributions 6,984$ 7,405$ 7,317$ 7,817$ 8,278$ 8,648$
Total Debt Service 2,816$ 2,786$ 2,211$ 2,243$ 2,280$ 2,315$
Total Baseline Expenditures 37,404$ 38,340$ 38,277$ 39,425$ 40,544$ 41,591$
Supplemental Pension Payments 600$ 600$ 600$ 600$
CTPF Unfunded Liability2
569$ 594$ 620$ 646$ 673$
Shift Normal Cost of CTPF back to CPS (216)$ (215)$ (215)$ (215)$ (214)$
TRS Normal Cost Shift (342)$ (684)$ (1,026)$ (1,026)$ (1,026)$
Undo Tier 3 Normal Cost Shift 500$ 500$ 500$ 500$
Net New Expenditures -$ 11$ 795$ 479$ 506$ 533$
Total Expenditures 37,404$ 38,351$ 39,072$ 39,904$ 41,050$ 42,124$
Operating Surplus (Deficit) (1,504)$ 551$ 1,353$ 1,945$ 2,132$ 2,436$
Interfund Borrowing for Backlog Reduction 575$ 575$ (575)$ (575)$ -$ -$
Reserves (Bill Backlog) (7,500)$ (6,374)$ (5,595)$ (4,225)$ (2,093)$ 344$
Reserves % of Revenues -20.9% -16.4% -13.8% -10.1% -4.8% 0.8%
State of Illinois: Governor's Five-Year Budget Projection and
Civic Federation Comprehensive Plan FY2018-FY2023 (in $ millions)
General Funds, Fund for the Advancement of Education, and Commitment to Human Services Fund (combined)
Revenues
Expenditures
1 Revenue estimates for taxing of retirement income include all income taxable at the federal level.
2 Based on the 2016 Actuarial Valuation at the assumed rate of return of 7.75%. CTPF has lowered its assumed rate to 7.25% but has not yet released its
FY2017 actuarial valuation, which is expected to contain higher numbers than those presented here.
Source: State of Illinois, Governor's Office of Management and Budget, Five Year Forecast , FY18-FY23 , October 11, 2017; Illinois Department of Revenue,
Illinois Individual Income Tax Returns with Retirement Subtraction: Tax Year 2015; Internal Revenue Service, Table 2. Individual Income and Tax Data, by State
and Size of Adjusted Gross Income, Tax Year 2015; Illinios General Assembly, Commission on Government Forecasting and Accountability, "Service Taxes
2017 Update, January 2017," p. 19; Illinois General Assembly, Commission on Government Forecasting and Accountibility, "Special Pension Briefing,"
November 2017, p. 11; Public School Teachers' Pension and Retirement Fund of Chicago, Actuarial Valuation and Review as of June 30, 2016, p. 37; State of
Illinois, Office of the Auditor General, State Actuary’s Report, December 2017, p. 11; State Universities System of Illinois, Actuarial Valuation Report as of June
30, 2017, October 6, 2017, p. 5; Communication between Civic Federation and Teachers' Retirement System; Civic Federation Calculations.
Civic Federation Revenue Changes
Civic Federation Expenditure Changes

34
In addition to stabilizing the State’s finances, the Civic Federation’s two revenue proposals also
provide some assistance to local governments. Taxing retirement income would result in $162
million in FY2019 for the Local Government Distributive Fund.91 Local governments would also
receive the 1.25% share of the State’s sales tax applied to services. The total revenue for local
governments in FY2019 is estimated at $266 million and would rise to $344 million by FY2023
as compliance with the sales tax extension increases. These revenues would help to stabilize
finances of local governments across Illinois and could help mitigate reliance on property taxes
to fund essential services.
The following table shows the new revenues to local governments provided by the Civic
Federation’s plan:
Revenue SourceProjected
FY 2019
Projected
FY 2020
Projected
FY 2021
Projected
FY 2022
Projected
FY 2023Local Government Share of
Retirement Income Tax 162$ 170$ 179$ 188$ 197$
Local Share of Service Sales Tax 104$ 119$ 147$ 147$ 147$
Total Assistance to Local
Government 266$ 289$ 326$ 335$ 344$ Source: Illinois Department of Revenue, "Illinois Individual Income Tax Returns with Retirement Subtraction: Tax Year 2015";
Internal Revenue Service, "Table 2. Individual Income and Tax Data, by State and Size of Adjusted Gross Income, Tax Year
2015"; Illinois General Assembly, Commission on Government Forecasting and Accountability, "Service Taxes 2017 Update,
January 2017," p. 19; Civic Federation Calculations.
Civic Federation Comprehensive Plan FY2018-FY2023 (in $ millions)
Revenue Assistance to Local Governments*
Issue 1: Spending Controls
The Illinois Constitution states that neither the Governor’s proposed budget, nor the
appropriations adopted by the General Assembly, can exceed estimated revenues.92 Nevertheless,
every year since 2001, expenses in the General Funds have exceeded the revenues available to
pay for them.93 During those years, the State has relied on a number of measures to get from one
year to the next, using one-time measures such as sweeps from other funds94 and borrowing for
operations.95
As part of this Roadmap, the Civic Federation proposes a number of new sources of revenue to
eliminate deficits, pay down the large backlog of unpaid bills and enhance the stability of the
91 Since personal income taxes were increased in 2011, LGDF has received 10% of the original 3.0% personal
income tax rate. The Civic Federation’s proposal would distribute the same ratio of the proceeds from extending the
income tax to retirement income. 92 Ill. Const. art. VIII, sec. 2. 93 State of Illinois Comptroller, “General Funds Budgetary Balance,” The Ledger,
http://ledger.illinoiscomptroller.gov/fiscal-condition/general-funds/ (last visited on February 8, 2018). Deficits are
measured as gross outstanding expenditures in excess of fund balance at the end of the fiscal year. 94 Illinois General Assembly, Commission on Government Forecasting and Accountability, State of Illinois Budget
Summary, Fiscal Year 2017, August 10, 2016, pp. 222-224. 95 Institute for Illinois’ Fiscal Sustainability at the Civic Federation, State of Illinois Enacted FY2015 Budget: A
Review of the Operating and Capital Budgets for the Current Fiscal Year, October 19, 2014, p. 54,
https://www.civicfed.org/iifs/publications/FY15_EnactedBudget (last visited on February 8, 2018).

35
pension funds. However, if new revenues are instead redirected to new spending, progress
toward fiscal sustainability will be imperiled. Therefore, it is imperative that spending be
controlled, and the Civic Federation only endorses revenue increases in the context of a
comprehensive multi-year plan that includes limits on spending.
In its five year projection, the Governor’s maintenance budget grows net agency expenditures by
only 2.1% per year.96 This is close to the Federal Reserve’s longstanding inflation target of
2.0%.97 The Civic Federation endorses this constrained level of spending growth until the State’s
fiscal condition can be substantially improved. As discussed above, 2.1% is a conservative
estimate of spending growth as it does not include any assumptions for salary increases, cost of
living adjustments or interest on the bill backlog. Maintaining the 2.1% target while
incorporating the likelihood of these expenses means that government services will grow more
slowly and some may have to be cut.
Civic Federation Recommendation on Spending
The Civic Federation recommends that the State of Illinois limit net agency spending
growth to 2.1% annually through at least FY2023.
Issue 2: Interest Penalties on Overdue Bills
For decades, many states and the federal government have had laws requiring payment of
interest penalties on late bills to private vendors.98 The laws are designed to encourage timely
payment for goods and services and limit bureaucratic delays.
This system has backfired in Illinois due to the State’s practice of deferring bills to manage its
budget deficits. The bill backlog peaked at $16.7 billion on November 8, 2017, following two
years without a complete budget.99 At that point, the State cleared out a significant portion of the
unpaid bills using the proceeds of a $6 billion sale of General Obligation bonds.
The bond sale made financial sense because the State’s coupon rate of 3.5% on the bonds was far
below the steep interest penalties it pays on many overdue bills. Under the State Prompt Payment
Act, interest accrues at 1% a month, or 12% annually, on proper bills that are not paid within 90
days.100 Other claims, including those from healthcare providers, accrue interest at 9% a year
after 30 days under the timely payment provisions of the Illinois Insurance Code.101 Certain
payables, such as transfers to local governments and other State funds, are not eligible for
penalty interest. After prolonged payment delays due to the budget impasse and over the veto of
96 State of Illinois, Governor’s Office of Management and Budget, Financial Walk Down (General Funds), October
11, 2017 97 Federal Open Market Committee of the Board of Governors of the Federal Reserve Bank, news release, February
1, 2017. 98 U.S. General Accounting Office, Prompt Payment: State Laws are Similar to the Federal Act but Less
Comprehensive, March 1989. 99 State of Illinois Comptroller, Backlog Voucher Report. 100 30 ILCS 540. Proper bills are defined as those that include the information needed to process the payment. 101 215 ILCS 5/368(a).

36
Governor Rauner, the General Assembly recently extended eligibility for Prompt Payment
interest to grants to social service agencies.102
Illinois spent $1.6 billion on late payment interest penalties from FY2008 through January 2018,
according to data from the Comptroller’s Office.103 Through the first seven months of FY2018,
State spending on interest penalties of $337.9 million has already exceeded the previous yearly
high of $317.9 million in FY2013. Interest penalties are paid after the State pays the underlying
bills, so spending is expected to climb as the State pays penalties on bills cleared due to the bond
sale. For the first six months of FY2018, the State spent $92.1 million, but the expenditure in
January 2018 rose to $245.8 million.
A recent report showed interest penalties owed on bills already paid and bills held at the
Comptroller’s Office or at State agencies totaled $887 million on December 31, 2017.104 These
numbers suggest the magnitude of accrued interest but are not comparable to the spending totals
in the chart. Although all of the numbers are from the Comptroller’s Office, they are based on
different methods of determining the timing of expenditures.105 Moreover, it remains to be seen
when the accrued penalties will be paid.
Prompt payment penalty interest rates paid by different governments vary widely, but Illinois’
rates appear to be excessive. The federal government’s penalty rate is currently 2.625%,
compounded monthly.106 Texas pays one percentage point over the prime lending rate, which is
currently 4.5%;107 and Missouri pays three percentage points over the prime rate.108 Michigan’s
rate is closer to Illinois’ at 0.75% per month.109
The Civic Federation hopes that the State of Illinois will implement a comprehensive plan to
stabilize its finances and never again allow its bill backlog to grow to such a level that penalty
interest payments become a significant financial liability. However, the rates should still be
reduced to reflect lower economy-wide rates of return.
Governor Rauner has proposed reducing Illinois’ prompt payment penalty rate on future bills
from 12% annually to the five-year U.S. Treasury yield curve rate plus one percentage point.110
102 Public Act 100-0549, enacted on November 9, 2017. 103 Civic Federation calculations based on data from the State of Illinois Comptroller’s website. 104 State of Illinois Comptroller, Debt Transparency Report Summary, January 22, 2018, p. 3. 105 Communication between the Civic Federation and the State of Illinois Comptroller, February 7, 2018. 106 U.S. Department of the Treasury, Bureau of the Fiscal Service, Prompt Payment,
https://www.fiscal.treasury.gov/fsservices/gov/pmt/promptPayment/rates.htm (last accessed on February 8, 2018).
The rate is adjusted every six months. 107 Texas Comptroller of Public Accounts, State Payee Payment Resources,
https://fmx.cpa.texas.gov/fmx/payment/resources/state.php (last accessed on February 8, 2018). 108 Missouri Revised Statutes, Title IV, Section 34.055,
http://revisor.mo.gov/main/OneSection.aspx?section=34.055&bid=904&hl (last accessed on February 8, 2018). 109 Michigan Compiled Laws, Chapter 17, Section 17.54,
http://www.legislature.mi.gov/(S(bojsotpql3vshfyaytl213nn))/mileg.aspx?page=getObject&objectName=mcl-17-54
(last accessed on February 8, 2018). 110 State of Illinois, Governor’s Office of Management and Budget, Illinois Economic and Fiscal Policy Report,
October 12, 2017, p.14; Illinois State FY2016 Budget, p. 2-19.
37
As of February 7, 2018, this penalty rate would have been 3.57%.111 The new reduced penalty
rate should not be applied to outstanding bills, but it remains to be seen whether a change in the
penalty interest rate could be applied to new bills under existing State contracts.
A reduction in the timely payment rate also deserves consideration. This provision of the
Insurance Code is intended to cause insurers to pay doctors and hospitals on time,112 but certain
State medical payments are also covered by the law.
Civic Federation Recommendation on Interest Penalties on Overdue Bills
The Civic Federation recommends that the State reduce the late payment penalty in the
Prompt Payment Act to a rate that reflects lower economy-wide rates of return, such as the
five-year Treasury rate plus one percentage point. The legislature and Governor should
also consider a reduction in the timely payment rate in the Insurance Code.
Issue 3: Retirement Income Exclusion
Unlike the federal government, which taxes certain levels of Social Security benefits and other
retirement income, Illinois excludes all retirement income from the State’s income tax base.113
Out of the 41 states that impose an income tax, Illinois is one of three that exclude all pension
income and one of 27 that exclude all federally taxable Social Security income.114
The Illinois Comptroller reports that this exclusion of federally taxable retirement income
reduced individual income tax revenues by $2.3 billion in FY2015.115 In years when the personal
income tax rate is at or near 5%, this exclusion is the most expensive of all of the State’s tax
breaks and the cost is expected to increase rapidly over time as the population ages.116
Historically, retirement income has grown at a much higher annual rate than regular income.
Between 2007 and 2015, retirement income in Illinois (excluding federally taxable Social
111 U.S. Department of the Treasury, Daily Yield Curve Rates, https://www.treasury.gov/resource-center/data-chart-
center/interest-rates/Pages/TextView.aspx?data=yield (last accessed on February 8, 2018). 112 Illinois Department of Insurance, Illinois Insurance Facts: The Prompt Pay Law,
https://insurance.illinois.gov/healthinsurance/PromptPay.pdf (last accessed on February 8, 2018). 113 35 ILCS 5/203(F). 114 Excludes the District of Columbia. National Conference of State Legislatures, State Personal Income Taxes on
Pensions and Retirement Income: Tax Year 2014, April 3, 2015. At the federal level, between 15% and 100% of
Social Security benefits are excluded from taxation. Generally, Social Security benefits are not taxable if they
represent a taxpayer’s only income. If base income is up to $25,000 for an individual or $32,000 for joint filers, then
no tax is owed. Base income is the sum of half of Social Security benefits plus all other income. Internal Revenue
Service, Publication 915, “Social Security and Equivalent Railroad Retirement Benefits, 2017” January 3, 2018, pp.
2-4. 115 State of Illinois Comptroller, Tax Expenditure Report Fiscal Year 2015, April 2016, p. 4. The personal income
tax rate fell from 5.0% to 3.75% halfway through FY2015. Accordingly, the total revenue reduction in FY2016 was
lower, at only $1.8 billion. State of Illinois Comptroller, Tax Expenditure Report Fiscal Year 2016, August 2017, p.
4. 116 State of Illinois Comptroller, Tax Expenditure Report Fiscal Year 2013, April 2014, p. 7.

38
Security benefits) grew at an average annual rate of about 5.0%, while other personal income
increased on average by only 1.2% per year.117
Including this high-growth component in the income tax base would provide for a more
sustainable revenue source for the State. At the new personal income tax rate of 4.95%, the
additional State revenue from taxing the federally taxable portion of retirement income is
estimated to be $2.5 billion in FY2019 and is projected to grow to $3.1 billion FY2023. The
proposal would also provide local governments with an estimated $162 million in FY2019,
growing to $197 million in FY2023.118
Illinois is an outlier regionally among bordering states in excluding all retirement income.
Although Michigan, Indiana, Wisconsin, Iowa and Missouri all exempt Social Security income,
they tax other retirement income. Indiana has the lowest rate of 3.2%, which is a flat income tax
rate applied to non-Social Security retirement income.119 Iowa charges the highest rate, which is
the top rate on its graduated income tax scale of 8.98% applied to earners above $70,785, but
also exempts specified amounts of retirement income for taxpayers aged 55 or older.
Civic Federation Recommendation on the Retirement Income Exclusion
The Civic Federation recommends that the State of Illinois broaden its income tax base by
eliminating the tax exclusion for all federally taxable retirement income. This will enhance
the State’s fiscal stability by providing access to a faster growing portion of the income tax
base, generating FY2019 revenues of over $2.5 billion.
Issue 4: Sales Tax on Services
One of the basic principles of government finance is that to be stable and efficient a tax should
generally have as broad a base and as low a rate as possible. Unfortunately, Illinois’ sales tax
does not live up to either ideal. According to a revenue study issued by the Commission on
Government Forecasting and Accountability (COGFA), Illinois’ sales tax base is much narrower
than those in other states, leading to greater volatility and higher rates.120
While the statewide sales tax rate is a moderate 6.25%, the combined sales tax rate in the City of
Chicago is highest of any major municipality in the United States at 10.25%.121 The remaining
4.0 percentage points are charged by local taxing authorities. Of the State’s 6.25 percentage
117 Civic Federation calculations based on Internal Revenue Service, SOI Tax Stats-Historic Table 2,
https://www.irs.gov/uac/soi-tax-stats-historic-table-2 (last visited on February 8, 2018). 118 Civic Federation calculations based on Illinois Department of Revenue, Illinois Individual Income Tax Returns
with Retirement Income Subtraction: Tax Year-2015-Final, August 2017,
http://tax.illinois.gov/AboutIdor/TaxStats/2015/2015_Final_IIT_IL_1040_Return.pdf (last visited on February 8,
2018). 119 Federation of Tax Administrators, “State Individual Income Taxes 2017”, November 29, 2017,
https://www.taxadmin.org/assets/docs/Research/Rates/ind_inc.pdf (Last accessed February 8, 2018). Many Indiana
counties charge an additional income tax. 120 Illinois General Assembly, Commission on Government Forecasting and Accountability, Illinois Revenue
Volatility Study, Public Act 98-0682, December 31, 2014, p. 66. 121 Illinois General Assembly, Commission on Government Forecasting and Accountability, Illinois’ National
Rankings – 2016 Update, November 2016, p. 10.

39
points, 1.25 percentage points are distributed to local governments, counties and mass transit
districts.122
One cause of Illinois’ sales tax narrowness is that the State excludes most services from its tax
base. Out of the 168 total services taxed by American states, Illinois currently taxes only 17.123
Most of these are related to the delivery of utility services, such as gas, electricity and
telecommunications. The remaining services are the Retailers Occupation Tax on prepaid phone
cards, photograph processing and canned (as opposed to custom-designed) software; a 5% tax on
hotel operations and automobile renting; and a $30 annual fee on coin-operated amusement
devices.
In addition to narrowing the sales tax base, the exclusion of services exposes Illinois to negative
long-term revenue trends. Nationwide sales tax revenues have grown more slowly than other
state revenues in recent years, in part because of online sales.124 Moreover, goods have declined
relative to services as a proportion of total consumer spending.125 As part of a path to sustainable
state finances, Illinois should contemplate expanding its sales tax to cover consumer services.126
The shift should lead to increased revenue stability and lessen the gradual erosion of one of the
“Big Three” revenues for the State.127
Any taxation of services is expected to be controversial and draw intense opposition from a
variety of special interest groups. During the 2014 gubernatorial campaign, Governor Bruce
Rauner proposed broadening the sales tax base in Illinois to include 32 services that are currently
untaxed, which was estimated to generate an additional $600 million in General Funds
revenue.128 However, this proposal has not been pursued by the Governor’s administration. In the
spring of 2017 early versions of Senate Bill 9, the revenue bill that eventually became part of the
enacted FY2018 budget, would have applied the sales tax to services including dry cleaning,
lawn care, vehicle repair, television and internet streaming services, pest control, private
detective services, tanning, tattooing and various others.129 However, these measures were taken
out of the final bill.130
122 Illinois General Assembly Legislative Research Unit, Illinois Tax Handbook for Legislators, 32nd Ed., March
2016, p. 119. 123 Illinois General Assembly, Commission on Government Forecasting and Accountability, Service Taxes 2017
Update, January 2017, pp. 2-3. 124 Jackson Brainerd, “Taxed and Spent: Does the Sales Tax Have a Future?” State Legislatures Magazine, June 1,
2016. 125 Fred Nicely and Liz Malm, National Conference of State Legislators, Broadening the Sales Tax Base Dos and
Don’ts, http://www.ncsl.org/documents/statefed/Sales_Tax_Base_Expansion_Practices.pdf (last visited on February
8, 2018). 126 Experts generally advise against assessing sales taxes on business-to-business services, as the taxes “pyramid”
into much higher rates as services are delivered through the supply chain. The pyramiding can lead to arbitrary tax
discrepancies depending on which services are vertically integrated within a firm as well as other distortions. Fred
Nicely and Liz Malm, National Conference of State Legislators, Broadening the Sales Tax Base Dos and Don’ts. 127 Illinois General Assembly, Commission on Government Forecasting and Accountability, Illinois Revenue
Volatility Study, December 31, 2014, p. 65. 128 Paul Merrion, “Rauner, the anti-tax candidate, finds a tax he likes: on services,” Crain’s Chicago Business, July
26, 2014. 129 Kiannah Sepeda-Miller, “Illinois Considers Applying Sales Taxes to More Services,” Associated Press, March
12, 2017. 130 Public Act 100-0022, enacted July 6, 2017.
40
In addition to the political challenge, attempts to expand service sales taxes will likely face legal
challenges based on the Illinois Constitution, which states that all objects within a taxation class
must be taxed uniformly.131 At least one Illinois Supreme Court case suggests that the uniformity
clause prohibits adding individual services to the current sales tax laws incrementally.132
The final challenge to expanding service sales taxes is implementation. A broad-based service
sales tax exempting only business-to-business services could take at least 18 to 24 months to
implement fully.133 Even after legislative action is taken to authorize taxing services, the
complexity of collecting the tax may require new rules for sourcing and other administrative
guidelines. Some of the new procedures may require review and approval by the legislature’s
Joint Committee on Administrative Rules. Other delays due to technology acquisition for
businesses that do not currently collect sales taxes and connectivity with the Illinois Department
of Revenue’s existing systems should also be assumed. Finally, there is a one-month lag between
collecting sales taxes and remission to the State.
In light of these challenges, the Civic Federation recommends an initial extension of sales taxes
to only those services currently taxed by the State of Wisconsin but not by Illinois. These
fourteen services include entertainment; cable and internet; landscaping; parking and towing;
repair of personal property; and contracts for the future performance of services.134
While following the Wisconsin model would not broaden the tax base as widely as a more
general service sales tax, it could face less widespread opposition and may be more feasible to
implement on a short timeframe. A recent analysis by COGFA suggests that a sales tax on these
services implemented in January 2019 could generate about $208 million in additional State
revenue in FY2019 at the State’s 5.0% rate, growing to $588 million in FY2023.135 The estimate
assumes only 67% compliance in the first year, 75% in the second year and 90% thereafter.
The Civic Federation Recommendation on Expanding the Sales Tax Base
The Civic Federation recommends that the State of Illinois expand the sales tax base to
include the fourteen services taxed by the State of Wisconsin.
Issue 5: Rainy Day Fund
Building a financial cushion to deal with future economic downturns is a key element in
restoring the State to fiscal stability. The possibility of a recession is factored into the most
recent revenue projections by the Illinois Department of Revenue.136
According to public finance experts, all governments should place a portion of their general
operating revenues in a general fund reserve or “rainy day” fund.137 Rainy day funds are savings
131 Illinois Constitution, Art. IX, Sec. 2. 132 Fiorito v. Jones, 39 Ill.2d 531, 236, N.E. 2d 698 (Ill. 1968). 133 Communication between the Civic Federation and Illinois Department of Revenue, December 9, 2016. 134 Illinois General Assembly, Commission on Government Forecasting and Accountability, Service Taxes 2017
Update, January 2017, p. 19. 135 Illinois General Assembly, Commission on Government Forecasting and Accountability, Service Taxes 2017
Update, January 2017, p. 19. 136 State of Illinois Governor’s Office of Management and Budget, Illinois Economic and Fiscal Policy Report,
October 12, 2017, p.10.

41
accounts that governments can use to address revenue shortfalls or unanticipated expenditures
and to help stabilize tax rates.
Governments that maintain adequate reserves are better positioned to deal with funding issues in
bad times. Putting money into reserves is a more fiscally prudent action than spending surplus
funds on new or expanded programs. The median rainy day fund balance among states in
FY2017 was 5.4% of general funds expenditures, according to a survey by the National
Association of State Budget Officers.138
Illinois has not maintained a functional rainy day fund, although a law was enacted in 2004 to
build such a fund. 139 The law established a goal of maintaining 5% of General Funds revenues in
an existing account called the Budget Stabilization Fund. According to the law, the fund would
be used to reduce the need for future tax increases or short-term borrowing, maintain high credit
ratings and address budgetary shortfalls. In authorizing withdrawals from the fund, priority was
to be given to services for children. Deposits into the fund would be triggered by projected
revenue growth of more than 4% from the prior year.
The fund has never received significant resources, however, apparently because annual revenue
projections have not met the threshold requirement to trigger deposits into the fund.140 The
balance of about $275 million at the end of FY2015 represented less than 1% of General Funds
revenues.
Instead of being used to withstand fiscal emergencies, the fund was used for cash flow problems
resulting from timing variations between receipt and disbursement of funds in a given fiscal
year.141 By law, any cash flow borrowings transferred during a fiscal year from the Budget
Stabilization Fund to the General Funds are to be reimbursed by a transfer back by the end of
that fiscal year.142
Due to the State’s financial crisis, this provision was changed to allow amounts in the Budget
Stabilization Fund to be used to pay expenses and not repaid in FY2017.143 As part of the
stopgap spending plan passed in June 2016, the Fund’s entire balance was appropriated to pay
for State operations in FY2017.144
Budget legislation in FY2018 made the Budget Stabilization Fund one of the State’s General
Funds, which are now used interchangeably.145 The FY2018 budget authorized borrowing and
137 Government Finance Officers Association, Best Practice: Appropriate Level of Unrestricted Fund Balance in the
General Fund, September 2015. 138 National Association of State Budget Officers, The Fiscal Survey of States Fall 2017, p. 62. 139 Public Act 93-660, enacted on February 2, 2004. 140 The law was amended to prohibit any deposits into the fund in FY2008. 141 Commission on Government Forecasting and Accountability, Revenue Volatility Study, Public Act 98-0682,
Updated February 17, 2015, p. 88. 142 30 ILCS 105/6z-51(b). The law was amended to defer cash repayment for FY2011 until July 15, 2011. 143 Public Act 99-0523, signed on June 30, 2016. 144 State of Illinois Governor’s Office of Management and Budget, Illinois Economic and Fiscal Policy Report,
November 15, 2017, p. 11. 145 Illinois General Assembly, Commission on Government Forecasting and Accountability, State of Illinois Budget
Summary Fiscal Year 2018, Updated September 5, 2017, p. 33. Prior to FY2018, General Funds consisted of the

42
transfers from accounts outside of General Funds to help pay down the bill backlog, and the
Budget Stabilization Fund is a repository for those receipts.146
The Civic Federation believes that the State should establish a true rainy day fund with a funding
goal of 10% of General Funds revenues. This goal was suggested by the legislature’s
Commission on Government Forecasting and Accountability (COGFA) in light of recent revenue
volatility.147 COGFA examined two funding strategies—making deposits into the fund only
when revenues are growing rapidly or making regular deposits regardless of revenue growth—
and determined that each presented challenges. While funding mechanisms that depend on
excess revenues can have wide variations in annual funding, regular funding puts annual pressure
on the budget.148
The budget plan presented in this report begins to create a functional rainy day fund in FY2023,
after the State’s backlog of unpaid bills is paid off. The fund ends FY2023 with a balance of
$344 million, or 0.8% of projected revenues.
Civic Federation Recommendation on Rainy Day Fund
The State of Illinois should work toward building a rainy day fund equal to 10% of
General Funds revenues to cushion the budget from the next economic downturn.
Legislation must explicitly indicate when deposits will be made and in what amount and
the circumstances under which withdrawals will be allowed.
Issue 6: Constitutional Amendment to Clarify the Pension Protection Clause
The State of Illinois has unfunded public employee pension liabilities of approximately $130
billion149 and many local governments are either straining under the cost of employee pensions
or facing the possibility that the funds will run out of money to pay retirees.
In May 2015, the Illinois Supreme Court struck down reforms passed by the Illinois General
Assembly in 2013 that reduced pension benefits for some State employees and retirees.150 The
reforms of Public Act 98-0599 for the four State pension funds included an actuarially sound
employer pension contribution schedule, a limitation on the automatic annual annuity increase
for both current employees and retirees, a pensionable salary cap, phased-in increases in the
retirement age and a one percentage point decrease in employee contributions to the plan. These
reforms were ruled a violation of the Illinois Constitution’s pension protection clause.
General Revenue Fund, Education Assistance Fund, Common School Fund and General Revenue-Common School
Special Account Fund. Three additional accounts—the Fund for the Advancement of Education, Commitment to
Human Services Fund and Budget Stabilization Fund—were added to General Funds in FY2018. 146 Public Act 100-0023, enacted on July 6, 2017. 147 Illinois General Assembly, Commission on Government Forecasting and Accountability, Illinois Revenue
Volatility Study Public Act 98-0682, Updated February 17, 2015, p. 99. 148 Illinois General Assembly, Commission on Government Forecasting and Accountability, Illinois Revenue
Volatility Study Public Act 98-0682, Updated February 17, 2015, p. 103. 149 Illinois General Assembly, Commission on Government Forecast and Accountability, Monthly Briefing for the
Month Ended: November 2017, p. 2. 150 Illinois Supreme Court opinion is available at
http://www.illinoiscourts.gov/OPINIONS/SupremeCourt/2015/118585.pdf (last accessed February 8, 2018).

43
In March 2016, pension funding and benefit reforms enacted in 2014 for the City of Chicago’s
Municipal and Laborers’ Pension Funds were struck down by the Illinois Supreme Court as
well.151 Public Act 98-0641 made changes to pension benefit levels for current retirees and
employee members of the two funds and increased employee and employer contributions to the
funds. The Illinois Supreme Court again found the reforms to be in violation of the Illinois
Constitution’s pension protection clause. Of note, the Court ruled that members of the Funds are
entitled to receive the benefits they were promised and “not merely to receive whatever happens
to remain in the Funds.” How the courts could enforce funding if any of the pension funds were
to go insolvent is unclear.
In recent years, the State of Illinois has attempted to accommodate increased pension
contributions by cutting benefits for future employees, increasing income taxes, reducing non-
pension spending, maintaining a large backlog of unpaid bills and, as in FY2018, changing
actuarial assumptions in order to reduce current contributions. However, even these actions could
not generate enough funding to cover the costs of the pensions. The State’s unfunded liabilities
and required contributions have continued to increase even as it made its statutorily required
contributions to the funds. Pension costs are expected to account for 22.9% of all General Funds
spending in FY2018, up from 6.8% in FY2008. Non-pension costs have declined to an estimated
77.1% of spending from 93.2%.
Local governments are also facing burgeoning pension liabilities that have required significant
increases to property taxes in Chicago and a huge one percentage point increase in the Cook
County sales tax rate, and in the case of Chicago its funding schedule will require hundreds of
millions more in yet-to-be-named revenue enhancements in 2020 and 2022.
If pension benefits cannot be changed under the current Illinois Supreme Court’s interpretation
of the Illinois Constitution’s pension protection clause, then large and growing amounts of State
and local revenues will continue to need to be diverted from spending on crucial government
services such as social services and public safety. The Civic Federation does not believe that it is
fiscally sustainable for the State of Illinois to continue to spend such a large portion of its budget
to defray the cost of benefits for workers who have long since ceased to provide services to the
residents of the State of Illinois. However, it is also important to note that many public
employees in Illinois do not have access to Social Security benefits for their time working for
government and therefore their pension is their only source of retirement security.
Therefore, the Civic Federation recommends that the Illinois General Assembly vote to place a
proposed Constitutional amendment on the ballot no later than the 2020 general election that
would clarify the pension protection clause of the Illinois Constitution such that the Illinois
General Assembly would be allowed to statutorily make reasonable and moderate changes to the
pension benefits of current employees and retirees deemed necessary to secure the sustainability
of the State and local governments. The people of Illinois deserve the opportunity to weigh in on
such an important matter that will determine the level of services available in the future to the
State of Illinois’ most vulnerable populations and the sustainability of the pensions themselves.
151 Illinois Supreme Court opinion is available at
http://www.illinoiscourts.gov/Opinions/SupremeCourt/2016/119618.pd (last accessed February 8, 2018).

44
Civic Federation Recommendation on Constitutional Amendment to Clarify the Pension
Protection Clause
The Illinois General Assembly should vote to place a Constitutional amendment on the
ballot no later than the 2020 general election that would clarify the pension protection
clause and allow reasonable, moderate changes to current employee and retiree benefits
necessary to secure the financial sustainability of the State and local governments and the
pension systems themselves.
Issue 7: Supplemental Pension Payments
The likelihood of successfully enacting a constitutional amendment is not guaranteed. Moreover,
the enactment of an amendment and subsequent statutory reforms mean that savings to the State
cannot occur until at least FY2021. In the meantime, the State must make plans to address
inadequate pension funding under current constitutional law.
For many years, the State of Illinois has maintained the official position that a 90% funded ratio
for its pensions is an adequate target.152 Public Act 88-593 enacted a 50-year contribution
schedule that would achieve 90% funding by 2045.153 As part of the Act, the Commission on
Government Forecasting and Accountability is required by law to revisit the adequacy of the
90% target every five years,154 and it affirmed this view most recently in 2006155 and 2011156. As
part of its 2016 review, however, COGFA presented the view of its actuary, Segal, that the 90%
target is insufficient.157 The Civic Federation endorses the view that an actuarially sound pension
payment plan calculates annual contributions to achieve a target of 100% funding within, at
most, 30 years. No well-run pension fund has a funding target level of less than 100%.
Under the pension reform law that was passed in 2013, the State would have moved to an
actuarially based 30-year funding plan and made supplemental contributions to achieve 100%
funding even sooner.158 However, these provisions were overturned when the pension reform law
was ruled unconstitutional in its entirety by the Illinois Supreme Court.159 The State now remains
on its original inadequate 50-year funding plan. According to the five pension systems’ FY2017
actuarial valuations, even after making its full statutory contribution, pension liabilities are
expected to continue to grow annually, not beginning to drop until FY2029.160
152 40 ILCS 1-103.3(b). 153 Enacted August 22, 1994. 154 40 ILCS 1-103.3(c). 155 Illinois General Assembly, Commission on Government Forecasting and Accountability, Report on the 90%
Funding Target of Public Act 88-0593, January 2006. 156 Illinois General Assembly, Commission on Government Forecasting and Accountability, A Report on the
Appropriateness of the 90% Funding Target of Public Act 88-593, June 2011. 157 Illinois General Assembly, Commission on Government Forecasting and Accountability, Monthly Briefing,
November 2016, p. 12. 158 Public Act 98-0599, enacted on December 5, 2013. 159 In re Pension Reform Litigation, 2015 IL 118585, May 8, 2015. 160 Illinois General Assembly, Commission on Government Forecasting and Accountability, Special Pension
Briefing, November 2017, p. 11.

45
Moreover, the retroactive assumption smoothing measure included in Public Act 100-0023,
which lowered the FY2018 contribution by $908.7 million dollars, will exacerbate the unfunded
ratio and increase required payments later on.161 Thus far no system has published an actuarial
evaluation of the Tier 3 normal cost shift, and its effect on the systems’ unfunded liabilities is not
yet known.162
Under Public Act 98-0599, the State would have been required to make supplemental payments
totaling $364 million in FY2019 and $1.0 billion annually thereafter to the Pension Stabilization
Fund until FY2045 or when the systems are all 100% funded. The payments would be
transferred to the Pension Stabilization Fund and distributed among the five State retirement
systems. Under the law, the additional assets from the supplemental payments could be used
when calculating the funding ratios of the various pension funds but not when determining the
annual contributions. The State was also prohibited from using any of the funds transferred into
the Pension Stabilization Fund to offset or replace its actuarially based contribution. These
restrictions were intended to make the supplemental payments a pure add-on to its required
annual contributions.
A supplemental payment plan similar to the one included in the 2013 pension reform law could
still be affordable. General Funds contributions for debt service are currently scheduled to drop
by $575 million from FY2019 to FY2020 due to the maturity of the Series 2011 pension
obligation bonds. Replacing this drop with a supplemental payment would help to put the State
on track to reach 100% funding within the next 30 years.
Based on the FY2017 actuarial estimates,163 if the State made eleven annual supplemental
payments of $600 million, starting in FY2020 and continuing through FY2034, followed by a
payment of $481 million in FY2035, the State’s retirement systems would experience a decline
in unfunded liabilities beginning in FY2026 and would be 100% funded by FY2045. Assuming a
long-term rate of return equal to the current 7.0% used by the Teachers’ Retirement System, the
$9.5 billion in supplemental payments plus their investment earnings would increase the assets of
the retirement systems by $32.7 billion by FY2045.
161 Teachers’ Retirement System of the State of Illinois, “TRS follows new law and lowers the State’s FY2018
contribution by $531 million,” news release, August 23, 2017. 162 See p. 14 of this report for further analysis of the Tier 3 plan. 163 Illinois General Assembly, Commission on Government Forecasting and Accountability, Special Pension
Briefing, November 2017, p. 11.

46
The following chart shows the effect of the proposed supplemental contribution schedule on the
systems’ unfunded liabilities. A table showing the calculations is included in Appendix A.
$146,326
$140,461
$-
$20,000
$40,000
$60,000
$80,000
$100,000
$120,000
$140,000
$160,000
$-
$5,000
$10,000
$15,000
$20,000
$25,000
Un
fun
de
d L
iab
ilit
y
Sta
te C
on
trib
uti
on
s -
All
So
urc
es
Fiscal Year
State of Illinois Projected Pension Contributions and Unfunded LiabilityFY2018 to FY2045 (in $ millions)
Statutorily Required Contributions* Supplemental Contributions Original Unfunded Liability New Unfunded Liability
* Does not include the changes enacted in P.A. 100-0023, including assumption smoothing and Tier 3.Source: Illinois General Assembly, Commission on Government Forecasting and Accountibility, "Special Pension Briefing," November 2017, p. 11; Civic Federation calculations.
Civic Federation Recommendation on Supplemental Pension Payments
In order to mitigate the underfunding of the State’s pension systems due to inadequate
statutory payments, the Civic Federation recommends requiring annual supplemental
payments of $600 million from FY2020 through FY 2034 and $481 million in FY2035.
Issue 8: Merger of the Chicago and State Teachers’ Pension Funds
The Civic Federation recommends that the Chicago Public Schools (CPS) work with the General
Assembly and the Teachers’ Retirement System (TRS) to consolidate the Chicago Teachers’
Pension Fund (CTPF) with TRS.
In conjunction with this change, CPS should resume paying for the normal cost of its plan, which
became the State’s responsibility under education funding reform legislation passed in 2017.164
164 Public Act 100-0465, enacted on August 31, 2017. The legislation’s funding formula effectively contributes a
portion of CPS’ unfunded liability costs by removing the amount that CPS must contribute to these costs from its
local funding capacity. This amount would be eliminated from the funding formula under the Civic Federation’s
merger proposal.

47
Responsibility for paying all of the normal cost of each school district outside of Chicago should
be shifted over three years to that school district.
Consolidating CTPF and TRS would eliminate the current inequitable funding structure under
which Chicago taxpayers pay for most of the unfunded pension liability costs of Chicago
teachers as well as teachers outside the city. It would also achieve some cost efficiencies as
duplicative functions were eliminated.
Under a consolidation plan, the CTPF and TRS systems would be managed by a single pension
board that would have proportional representation for both teachers’ pension funds. However,
the current member plans would be maintained as separate accounts. The State of Illinois would
assume responsibility for the unfunded liability of CTPF, while CPS would resume funding the
pension fund’s normal cost (the annual cost of the pension plan’s benefits). Updated numbers
from the CTPF are not yet available, but in FY2017, the State assumption of the CTPF unfunded
liability would have reduced its FY2017 required contribution by approximately $531.4 million.
The merger proposal would require changes to the new education funding formula and
elimination of a Tier 3 pension plan authorized as part of the FY2018 budget.165 The Tier 3 plan,
which is not expected to be implemented until FY2020, would require school districts to pay
pension costs for new teachers.
The Civic Federation believes that school districts in Illinois should assume funding the full
normal cost of their employee pensions. The responsibility for contributing to a worker’s pension
should rest with the employer who determines the worker’s salary. The shift would help inject
greater fiscal accountability into school district operations and budgeting and would eventually
offset the State’s additional cost of taking on the unfunded liability of Chicago teachers’
pensions.
In FY2019 the State’s statutorily required contribution to TRS is $4.47 billion, with about $1.03
billion going toward the normal cost.166 The shift of the State’s share of normal cost to school
districts could be achieved gradually, over a period of three years, to allow school districts
sufficient time to adjust to the change. To help pay for the normal cost of teachers’ pensions,
school districts could end the practice of paying or “picking up” all or a share of the annual 9.4%
employee pension contribution.
It is reasonable for the State of Illinois to continue to assume financial responsibility for the
unfunded liability of all school districts because:
The State created the current expensive and unsustainable situation that has led to $73.4
billion in unfunded liability and a funded ratio of 40.2% for TRS as of June 30, 2017167
165 Public Act 100-0023, enacted on July 6, 2017. The Civic Federation takes no position on Tier 3’s hybrid defined
benefit/defined contribution plan, which is not expected to affect the State’s contribution amount. This portion of the
Tier 3 plan could be retained even as the cost shift is replaced. 166 Communication between the Civic Federation and the Teachers’ Retirement System of the State of Illinois,
February 2, 2018. 167 Illinois General Assembly, Commission on Government Forecast and Accountability, Monthly Briefing for the
Month Ended: November 2017. These figures are based on asset smoothing.
48
and $9.6 billion in unfunded liability and a funded ratio of 52.4% for CTPF as of June 30,
2016;168 and
Paying these enormous costs is beyond the capability of local school districts to readily
absorb. This is particularly the case because they rely heavily on property taxes to fund
their operations and many are subject to the property tax extension limitation law
(PTELL), which limits levy increases to 5% or the rate of inflation, whichever is less.
To achieve both equity and accountability, the State should assume responsibility for CTPF’s
unfunded liability rather than paying for the District’s normal costs.
Civic Federation Recommendation on CPS and State Teachers’ Pension Funding Reform
The Civic Federation recommends that the Chicago Teachers’ Pension Fund be
consolidated with the Teachers’ Retirement System and that the State assume
responsibility for the unfunded liability of CTPF. The Federation also recommends that the
Chicago Public Schools resume paying for the normal cost of Chicago teachers’ pensions
and that responsibility for the normal cost of pensions for all teachers outside of Chicago
be shifted from the State of Illinois to local school districts over three years.
Issue 9: Restructuring Illinois’ Public University System
Illinois’ nine public universities are a significant asset for residents and businesses, educating
students to reach their full potential and providing the skilled workforce needed for a competitive
and prosperous state. But Illinois has been starving its universities of current operating funding
for years, with no apparent plan for the most effective allocation of severely limited State
resources.
Since FY2002, the peak year for public university operating funding, General Funds
appropriations have declined from $1.50 billion to $1.08 billion in FY2018.169 That represents a
decrease of almost 28% in nominal terms, or about 47% after adjusting for inflation.
Funding was sharply restricted during the State’s budget impasse in FY2016 and FY2017,
resulting in dwindling financial reserves, job cuts and program eliminations.170 The budget crisis
has been blamed for falling enrollments, loss of faculty and declining confidence in Illinois’
public university system.171
Like other areas of the State budget, operating funding for universities has been crowded out by
pension costs, which are mainly related to Illinois’ massive unfunded liability. General Funds
contributions to the pension fund that covers university and community college employees
168 Public School Teachers’ Pension and Retirement Fund of Chicago, Actuarial Valuation and Review as of June
30, 2016, October 27, 2016, p. v. Updated reporting for FY2017 is not yet available from the Chicago Teachers’
Pension Fund. 169 Illinois Board of Higher Education, http://www.ibhe.org/Fiscal%20Affairs/budget.htm (last accessed on February
8, 2018) and http://www.ibhe.org/Data%20Bank/DataBook/default.asp (last accessed on February 8, 2018). 170 For more information about recent funding of higher education, see p. 14 of this report. 171 Rick Seltzer, “Picking up the Pieces in Illinois,” Inside Higher Ed, July 10, 2017.

49
climbed to $1.4 billion in FY2018 from $232.1 million in FY2002.172 The State also pays for
health insurance for university employees and retirees, at a cost of $891.0 million in FY2015.173
As State operating funding for public universities has declined, tuitions have increased to make
up the difference.174 Illinois’ average tuition and fees for in-state students were the fifth highest
in the U.S. in the 2017-2018 school year.175
The share of Illinois high school graduates enrolling in four-year colleges who went to out-of-
state institutions rose to 46% in the fall of 2016 from 29% in 2002.176 Among the other states,
only New Jersey had more graduates enrolling elsewhere. Of the students who left Illinois, 62%
enrolled in out-of-state public universities in 2016, compared with 54% in 2002.
Undergraduate enrollment across the nine universities’ twelve campuses fell by 9.9% from the
fall of 2008 to 2017, based on a preliminary headcount. As shown in the chart below, the
enrollment trends vary significantly by institution, ranging from decreases of 59.8% at Chicago
State University and 45.7% at Eastern Illinois to increases of 24.1% at the University of Illinois
at Chicago and 27.5% at Governors State. The universities with the steepest enrollment declines
during the two-year budget impasse had seen persistent decreases prior to that period.
Institution
% Change
2008-2017
% Change
2015-2017
FY2017 Fall
Enrollment
Governors State University 27.5% -6.8% 3,326
U of I at Chicago 24.1% 10.7% 19,448
U of I at Urbana/Champaign 8.1% 1.8% 33,955
Southern Illinois University Edwardsville 3.9% -3.2% 11,402
U of I at Springfield 1.5% -0.2% 2,932
Illinois State University 1.5% -0.5% 18,330
Northeastern Illinois University -20.9% -12.1% 7,113
Northern Illinois University -27.0% -10.5% 13,454
Western Illinois University -29.2% -16.9% 7,599
Southern Illinois University Carbondale -31.2% -15.7% 10,987
Eastern Illinois University -45.7% -22.7% 5,568
Chicago State University -59.8% -39.5% 2,095
Public Universities Total -9.9% -5.2% 136,209
Source: Illinois Board of Higher Education.
*Enrollment numbers are based on headcount. Numbers for FY2017 are preliminary.
Fall Undergraduate Enrollment at State of Illinois Public Universities: 2008-2017*
172 Illinois General Assembly, Commission on Government Forecasting and Accountability, Illinois State
Retirement Systems Financial Condition as of June 30, 2016, March 2017, p. 118; 173 Strategy Labs at the Lumina Foundation, Illinois Postsecondary Investments, May 2017, p. 12. This figure is net
of university reimbursements to the State of $45.0 million. 174 Strategy Labs at the Lumina Foundation, Illinois Postsecondary Investments, May 2017, p. 14. 175 College Board, Trends in Higher Education: Tuition and Fees by Sector and State Over Time, 2017, p.15. 176 Illinois Board of Higher Education, IBHE Bulletin, January 12, 2018,
http://www.ibhe.org/IBHEBulletin/180112.pdf (last accessed on February 8, 2018).

50
Demographic trends do not look bright for higher education in Illinois. After increasing for 15
years through 2013, the number of U.S. high school graduates is expected to be roughly flat until
2023, grow for three years and then decline through the early 2030s.177 The projected decreases
are mainly in the Midwest and Northeast, with Illinois expected to see its annual high school
graduation numbers decline by 16.1% from 149,000 in 2013 to 125,000 in 2032.178
To address these complicated and far-reaching issues, the Civic Federation supports the creation
of a bipartisan commission to study the restructuring of Illinois’ public universities. The
commission should consider the elimination of duplicative higher education programs,
reallocation of resources across programs and campuses and the closure or consolidation of
campuses. Governor Rauner reportedly plans to establish such a commission.179
A first step toward rationalizing the public university system is to put all of the institutions under
the control of one governing board. Since 1996, each of Illinois’ nine public universities has
been governed by its own board. Before that time, the University of Illinois and Southern Illinois
University had their own boards, while the other institutions were overseen by either the Board
of Regents or the Board of Governors of State Colleges and Universities.
Supporters of the 1996 reorganization maintained that separate boards would save money and
reduce layers of bureaucracy.180 But education experts believe that the current governance
structure has weakened the influence of the Board of Higher Education, making it more difficult
to establish statewide goals and allocate resources strategically. In a recent report, the Lumina
Foundation concluded that the current structure essentially created an environment in which
universities compete against each other for resources.181 The structure has led to limited
accountability and lack of coordination among campuses, according to higher education
stakeholders cited in the report.182
Civic Federation Recommendation on Restructuring Illinois’ Public University System
The Civic Federation recommends that the Governor create a bipartisan commission to
address the need to eliminate duplicative university programs, more effectively allocate
resources across programs and campuses and study the potential need to close or
consolidate campuses. The Federation also recommends that the nine universities be
governed by a single Board of Trustees to facilitate the establishment of statewide goals and
rational allocation of State resources.
177 Peace Bransberger and Demarcee K. Michelau, Knocking at the College Door: Projections of High School
Graduates, December 2016, p. 11. 178 Peace Bransberger and Demarcee K. Michelau, Knocking at the College Door: Projections of High School
Graduates, December 2016, p. 28. 179 Editorial Board, “How to reinvent Illinois higher ed (and reduce the brain drain),” Chicago Tribune, January 5,
2018. 180 Suzy Frisch, “Edgar Oks College Board Reform, Expanded U Of I,” Chicago Tribune, March 1, 1995. 181 Strategy Labs at the Lumina Foundation, Illinois Postsecondary Investments, May 2017, p. 4. 182 Strategy Labs at the Lumina Foundation, Illinois Postsecondary Investments, May 2017, p. 36.

51
Issue 10: Comprehensive Capital Improvement Planning and Funding
Illinois has grappled with a number of financial challenges over the last decade, including
structural deficits, pension underfunding and a two-year standoff without a budget. Now, some
leaders and advocates have begun to demand renewed attention to how the State funds
transportation and other infrastructure. In recent testimony before the Illinois General Assembly
House Transportation Committee, the Chicago Metropolitan Agency for Planning stated that the
State’s transportation funding had “reached a crisis.”183 The Metropolitan Planning Council
accused Illinois of putting transportation on a “starvation diet.”184
Illinois has not had a major capital program since 2009. The Illinois Jobs Now! FY2010 capital
budget included $18.0 billion in new projects as well as $11.0 billion of reappropriations from
previous years.185 Since then, new appropriations have averaged approximately $3.3 billion
annually.
The most recent state report card issued by the American Society of Civil Engineers gave Illinois
a C- for the overall quality of its infrastructure.186 The road and transit categories both received a
D+. The Federal Highway Administration reports 2,243 structurally deficient bridges in Illinois,
8.4% of the State’s total.187 A recent report by the Regional Transportation Authority accuses the
State of chronically underfunding transit and states that capital needs are outpacing uncertain
revenues.188
In addition to transportation infrastructure, the Governor’s FY2018 Capital Budget calls attention
to other infrastructure needs, such as the $7.0 billion backlog in deferred maintenance at State
facilities, modernization of the State’s information technology systems and abating lead
contamination throughout Illinois.189
Addressing Illinois’ infrastructure needs will not be cheap. The Illinois Department of
Transportation (IDOT) estimates that additional revenues of $1.7 billion annually are needed to
keep up with maintenance of existing highway and transit infrastructure.190 Needed
improvements in these systems would cost an additional $2.25 billion each year. These figures
183 Testimony by Chicago Metropolitan Agency for Planning before the Illinois General Assembly, House
Transportation Committee, December 19, 2017. 184 Testimony by Metropolitan Planning Council before the Illinois General Assembly, House Transportation
Committee, December 19, 2017. 185 Illinois General Assembly, Commission on Government Forecasting and Accountability, Capital Plan Analysis
FY2018, April 2017, p. 7. 186 American Society of Civil Engineers, Illinois Section, Report Card for Illinois Infrastructure, 2014,
http://www.isasce.org/report-card (last visited February 8, 2018). 187 Federal Highway Administration, Deficient Bridges by Highway System 2016, December 31, 2016,
https://www.fhwa.dot.gov/bridge/nbi/no10/defbr16.cfm#a (last visited February 8, 2018). 188 Regional Transportation Authority, “Invest in Transit: The 2018-2023 Regional Transit Strategic Plan for
Chicago and Northeastern Illinois,” p. 14. 189 Illinois State FY2018 Capital Budget, pp. 21-26. 190 Communication between the Civic Federation and the Illinois Department of Transportation, December 1, 2017.

52
do not include other important infrastructure, such as airports, freight rail, waterways and non-
transportation infrastructure.
While the need to maintain and expand infrastructure in the State is not in doubt, Illinois must
weigh these priorities against other pressing demands on its fiscal resources. In order to justify
embarking on a new major capital program, the State must satisfy two requirements. The first is
the development of a capital improvement plan that comprehensively assesses and prioritizes the
State’s needs. The Civic Federation opposed the Illinois Jobs Now! program and subsequent
capital budgets for lack of such a plan.191 Taxpayers deserve to understand how money will be
spent before taxes or fees are raised.
The second requirement is to identify a reliable, long-term source of funding. The Illinois Jobs
Now! plan relied on a collection of revenue sources, such as video poker, leasing the state lottery,
liquor taxes, vehicle license fees and expanding the sales tax on candy, sweetened beverages and
some hygiene products.192 However, few of these sources have ever produced as much revenue
as was originally forecast.
In November 2016 voters approved a lockbox amendment to the Illinois Constitution that
restricts some transportation-derived revenue sources to transportation-related expenditures.193
While proponents argued that the amendment would prevent fund sweeps that divert
transportation funds for other uses, the amendment did not result in expanded revenues for those
funds.
Additionally, while the General Assembly’s FY2018 budget held transportation expenditures flat
to FY2017 levels,194 according to IDOT officials it shifted approximately $300 million in
transportation expenses from General Funds to transportation-related funds, effectively reducing
transportation spending by that amount.195
Finally, it is unclear when or if Illinois could receive any assistance under a federal infrastructure
program.196 If the State is to go forward with a capital plan, it must identify a stable revenue
source on its own.
For decades the standard funding source for capital investments in transportation has been the
motor fuel tax (MFT). Although more reliable than video poker, the revenue produced by the
191 Institute for Illinois’ Fiscal Sustainability at the Civic Federation, State of Illinois FY2010 Recommended
Operating and Capital Budgets, Analysis and Recommendations, May 11, 2009, p. 5; Institute for Illinois’ Fiscal
Sustainability at the Civic Federation blog, “Despite Operating Deficit Capital Spending Still Growing,” March 17,
2010, https://civicfed.org/iifs/blog/despite-operating-deficit-capital-spending-still-growing-0 (last accessed February
8, 2018). 192 Illinois General Assembly, Commission on Government Forecasting and Accountability, Capital Plan Analysis
FY2018, April 2017, p. 9. 193 Rummana Hussain, “Illinois voters approve ‘Safe Roads Amendment’,” Chicago Sun-Times¸ November 8, 2016. 194 Chicago Metropolitan Agency for Planning, “FY18 budget impacts on state finances, regional transportation, and
local governments,” http://www.cmap.illinois.gov/updates/all/-/asset_publisher/UIMfSLnFfMB6/content/fy18-
budget-impacts-on-state-finances-regional-transportation-and-local-governments (last accessed February 8, 2018). 195 Communication between the Civic Federation and the Illinois Department of Transportation, December 4, 2017. 196 Jim Tankersley and Julie Hirschfeld Davis, “Trump’s $1.5 Trillion Infrastructure Plan Is Light on Federal Funds,
and Details,” The New York Times, January 31, 2018.

53
MFT has eroded over time. Illinois has not raised the MFT from the flat rate of $0.19 per gallon
in over 28 years.197 Since that time, construction costs have doubled while gas tax revenue has
grown by only 20%.198 Since 2013, 24 states have raised or reformed their gas taxes, including
three that border Illinois.199 The Chicago Metropolitan Agency for Planning suggests that Illinois
may need to increase the tax by $0.10 to $0.15 per gallon to meet its transportation needs.200
Illinois has made the pain of raising the MFT more difficult by being one of only a few states
that also assess a general sales tax on gasoline.201 However, the revenue produced by the sales
tax is not tied to transportation funding. The FY2018 budget also eliminated a 20% sales tax
discount on gasoline blended with ethanol,202 which includes most gasoline sold in the
Midwest.203 The elimination of the discount, which the Civic Federation advocated,204 is
expected to produce approximately $100 million for the State’s General Funds.205
In addition to the State sales tax, Chicago-area drivers pay more for special reformulated
gasoline required by the Environmental Protection Agency.206 The metro area is in “non-
attainment status” due to poor air quality.207 Despite these high costs, further raising the MFT
could encourage alternatives to driving and help improve Chicago air quality.
Despite the relative stability of the MFT, transportation experts have concerns about its long-
term viability. Average fuel efficiency has risen and is expected to continue rising.208
Transportation planners have recommended examining both congestion pricing and a vehicle
197 35 ILCS 505/2(a). 198 Chicago Metropolitan Agency for Planning, “Adequate Transportation Funding: Reforming the Motor Fuel Tax,”
p. 3, http://www.cmap.illinois.gov/documents/10180/17016/FY15-
0061+ADEQUATE+TRANSPORTATION+FUNDING.pdf/60dc6491-b463-436c-b877-ac82e54f0ce3, (last
accessed February 8, 2018). 199 Institute for Taxation and Economic Policy, “How Long Has It Been Since Your State Raised Its Gas Tax?” June
28, 2017, https://itep.org/how-long-has-it-been-since-your-state-raised-its-gas-tax-4 (last accessed February 8,
2018). 200 Testimony by Chicago Metropolitan Agency for Planning before the Illinois General Assembly, House
Transportation Committee, December 19, 2017. 201 National Conference of State Legislatures, “Motor Fuel Sales Taxes and Other Taxes on Fuel Distributors or
Suppliers,” Updated June 2012, http://www.ncsl.org/research/transportation/fuel-sales-taxes-and-other-related-
taxes.aspx (last accessed February 8, 2018). 202 35 ILCS 105/3-10. 203 U.S. Energy Information Administration, “Frequently Asked Questions: How much ethanol is in gasoline, and
how does it affect fuel economy?” March 29, 2017, https://www.eia.gov/tools/faqs/faq.php?id=27&t=4 (last
accessed February 8, 2018). 204 Institute for Illinois’ Fiscal Sustainability at the Civic Federation, State of Illinois FY2018 Budget Roadmap,
February 10, 2017, p. 42. 205 Illinois General Assembly, Commission on Government Forecasting and Accountability, State of Illinois Budget
Summary, Fiscal Year 2018, Updated September 5, 2017, p. 29. 206 Whet Moser, “Why Gas Is So Expensive During the Summer (And Especially in Chicago),” Chicago Magazine,
March 27, 2012, http://www.chicagomag.com/Chicago-Magazine/The-312/March-2012/Why-Gas-Is-So-Expensive-
During-the-Summer-And-Especially-in-Chicago/ (last accessed February 8, 2018). 207 U.S. Environmental Protection Agency, “Illinois Nonattainment/Maintenance Status for Each County by Year for
All Criteria Pollutants,” January 31, 2018, https://www3.epa.gov/airquality/greenbook/anayo_il.html (last accessed
February 8, 2018). 208 U.S. Bureau of Transportation Statistics, “Table 4-23M: Average Fuel Efficiency of U.S. Light Duty Vehicles,”
https://www.bts.gov/content/average-fuel-efficiency-us-light-duty-vehicles-0 (last accessed February 8, 2018).

54
miles traveled (VMT) tax, which would assess drivers based on the distance they drive, ensuring
the reliability of revenues even as cars become more fuel efficient.209 A number of other states
are testing VMT pilot programs to assess the feasibility of implementation and address the
privacy concerns inherent in tracking vehicles.210
The Civic Federation Recommendation on Planning and Funding Capital Infrastructure
The Civic Federation recommends that the State of Illinois initiate a new capital plan that
comprehensively assesses and prioritizes infrastructure needs. The road and transit portion
of the plan should be initially funded by an increase in the motor fuel tax, which has not
been raised since 1990. The State should further consider vehicle miles traveled and
congestion taxes to ensure the long-term sustainability of transportation funding revenues.
Issue 11: Consolidating and Streamlining Government Units in Illinois
The State of Illinois has by far the highest number of local governments in any state, at 6,963,
according to the United States Census Bureau.211 The multiplicity of local units of government,
many of which are funded predominantly by property taxes, is often cited as a reason for high
property tax rates in Illinois.212
In addition to recommending the merger of the Chicago Teachers’ Pension Fund with the
Teachers’ Retirement System, the Civic Federation supports the following government
consolidation initiatives:213
Consolidate local pension funds: There are over 600 local pension funds in the State,
each with its own governing board, most of which are police and fire funds for individual
municipalities. While these funds may enjoy local control over investing and disability
decisions, the Federation believes that overall investment performance and administrative
efficiency generated by economies of scale would greatly improve if funds were
consolidated.
Merge the offices of the Illinois Comptroller and Treasurer: The Illinois Constitution
currently divides the State’s main fiscal operations between two offices: the Illinois
Treasurer is responsible for collecting and investing state revenue while the Illinois
Comptroller is responsible for paying bills from those accounts.214 Several states have
209 Chicago Metropolitan Agency for Planning, “Transportation System Funding Concepts,” August 2016, p. 5,
http://www.cmap.illinois.gov/documents/10180/570463/Transportation+System+Funding+Concepts/a40cfa4a-
4743-4cfb-83c3-44f1d1d0ef02 (last accessed February 8, 2018). 210 Daniel Vock, “With Gas Taxes in Peril, More States Study Alternatives,” Governing, January 16, 2018. 211 United States Census Bureau 2012 Census of Governments, “Government Organization Summary Report: 2012,”
September 26, 2013, p. 1. 212 Illinois ranked seventh among the states in per capita property taxes collected in 2013 and was the highest
ranking states in the Midwest. For more information, see Illinois General Assembly, Commission on Government
Forecasting and Accountability, Illinois’ National Rankings – 2016 Update, November 2016, p. 30. 213 For more information on these proposals, see Civic Federation, The Civic Federation 2018 Legislative Priorities
100th General Assembly of the State of Illinois, November 9, 2017, https://www.civicfed.org/2018priorities (last
accessed on February 8, 2018). 214 Illinois Constitution. Art. V, Sec. 1-18.

55
already combined those operations for greater efficiency including Wisconsin, Michigan
and Minnesota. The Civic Federation supports an amendment to the Illinois Constitution
to merge the offices of the Illinois Comptroller and Treasurer.
Authorize any township to be dissolved by referendum: The Illinois Constitution appears
to permit dissolution of townships by referendum.215 However, because of confusion
surrounding procedures, past efforts have been difficult or delayed. Public Act 100-107,
signed into law in 2017, clarified various rules with regard to township consolidation,
including authorizing dissolution of coterminous townships by referendum. While this is
an important first step, the Civic Federation sees no good public policy reason why the
intent of the Illinois Constitution should not be reflected in Illinois law. As such, the
Federation encourages the Illinois General Assembly to pass legislation to authorize
dissolution of any township via referendum.
Consolidate property tax administration roles in Cook County: Administration of the
Cook County property tax function is primarily handled by three different elected county
officials (Assessor, Clerk and Treasurer), leading to taxpayer confusion about whom to
contact with questions or complaints about the tax. The lines of responsibility are nearly
impossible for ordinary taxpayers to discern and politicians exploit this fact to their
political advantage. Building on the eventual consolidation of the offices of the Cook
County Recorder of Deeds and the Cook County Clerk before December 2020,216 the
Civic Federation recommends that a unified property tax administration office be created.
The new office would merge the Treasurer’s office; the County Clerk’s tax extension, tax
redemption and map divisions; the part of the current-Recorder’s office dealing with
property records; and the Auditor’s property functions. It would be an appointed rather
than an elected office. Other states have moved to allow for consolidation of property tax
administration roles. Minnesota state law allows its counties’ Auditor and Treasurer
positions to be combined and made either an appointed or elected position.217
Additionally, the offices of Assessor and Auditor, Treasurer, or Auditor-Treasurer may
be combined, subject to rules about compatibility of offices and restrictions as to holding
other elected positions. However, according to an opinion of the Cook County State’s
Attorney’s Office, creating a unified Office of Property Tax Administration would
require legislation be passed by the Illinois General Assembly and could not be done
solely via County referendum or administratively.218
Dissolve the Illinois International Port District: The Illinois International Port District
should be dissolved because the District is failing to fulfill its principal mission of
promoting shipping and port operations and is instead focused on its Harborside
International Golf Center. In July 2013, Mayor Emanuel announced plans to privatize the
215 Illinois Constitution, Art. VII, Sec. 5. 216 For more information, please see Civic Federation blog post, Cook County Electorate Approves Ballot Measure
to Merge Recorder of Deeds and County Clerk: https://www.civicfed.org/civic-federation/blog/cook-county-
electorate-approves-ballot-measure-merge-recorder-deeds-and-county (last accessed February 8, 2018). 217 If the position is made appointed, a referendum must be held. Minnesota House of Representatives Research
Department, “County Offices: Combining or Making Appointed,” November 2011. 218 Office of Tax Administration Report, Prepared by Representatives of the County Board President, Cook County
Assessor, Cook County Clerk, Cook County Treasurer and State’s Attorney.

56
Port District. Following the announcement, the only potential bidder withdrew from
negotiations in October 2013. Port District Board Meeting minutes indicate negotiations
for a Master Lease were ongoing through at least November 2016. Recently, the Port
District asked the State of Illinois to pass HB 1797, which would forgive approximately
$15 million in in Port District debt. Governor Rauner vetoed the bill following passage
by both houses of the Illinois General Assembly. However, both houses later voted
successfully to override the Governor’s veto, thereby forgiving the Port District’s debt to
the State. Port District leaders have stated that its debt load must be reduced to improve
its ability to enter into a privatization agreement.219 Due to ongoing serious concerns, the
Civic Federation continues to call for the dissolution of the Illinois International Port
District. After the District has been dissolved, the City of Chicago should consider
transferring the District’s open lands to the Forest Preserve District of Cook County and
its golf courses to the Chicago Park District.
Future Tax and Budget Reforms
The Civic Federation’s comprehensive plan will stabilize the State’s finances by eliminating the
backlog of bills and making progress toward building a rainy day fund to help prevent future
fiscal crises. Achieving these goals must be the highest priority.
Once the State pays off its unpaid bill backlog and begins to make progress toward building a
rainy day fund, it should pursue the following measures to give the State’s finances more long-
term sustainability:
Lapse Period Spending: The lapse period is the period of time after the end of the fiscal
year during which the next year’s revenues can be used to pay for the current year’s bills.
Because of the large amount of payables outstanding at the end of the fiscal year, this
period was extended to December 31 from August 31 beginning in FY2013.220 The
ability to roll bills over into the next year gives the State flexibility during times of
financial crisis, but it also undermines responsible budgeting. Once the State pays off its
bill backlog, the lapse period should be returned to two months, a reasonable period of
time to process and pay bills.
Section 25 Liabilities: The State should phase out the use of Section 25 liabilities and
other practices that allow prior year’s costs to be paid from the current year’s
appropriations.221 An annual budget should reflect that year’s costs. The practice of
moving costs from one year to the next has allowed the State to disguise budget deficits
and avoid development of a structurally balanced budget.
University Pension Normal Costs: The Civic Federation believes that the responsibility
for contributing to a worker’s pension should rest with the employer who determines the
219 Civic Federation Local Government Committee Meeting with Illinois International Port District, September 18,
2017. 220 30 ILCS 105/25(m). 221 For more information on Section 25 liabilities, see p. 21 of this report.

57
worker’s salary.222 Shifting the normal cost of State University Retirement System
contributions to public universities and community colleges could help inject greater
fiscal accountability into operations and budgeting. This shift should be considered by
the bipartisan commission on higher education reform recommended by this report.223
Graduated Personal Income Tax: At the beginning of FY2018 the General Assembly
overrode the Governor’s veto to raise Illinois’ personal income tax from 3.75% to
4.95%.224 A permanent income tax at this level is burdensome for low income taxpayers,
despite the simultaneous increase in the earned income tax credit from 10% to 18% of
the federal credit. The State should consider a modestly graduated rate structure with a
maximum spread between the highest and lowest rates of 3.0 percentage points, which
would generate additional revenue and could lower rates for low income taxpayers and
protect taxpayers from excessive disparities. Moving from a flat tax rate to a graduated
rate structure would require an amendment to the Illinois Constitution.225
222 See p. 46 of this report for the Civic Federation’s recommendation to shift pension normal costs for the Teachers’
Retirement System to downstate school districts. 223 See p. 48. 224 Public Act 100-0022, enacted July 6, 2017. 225 Ill. Const. art. IX, sec. 3(a). Among nearby states, Indiana and Michigan have flat individual income tax rates;
Iowa, Kentucky, Minnesota, Missouri and Wisconsin have graduated rate structures. For more information, see
Federal Tax Administrators, State Individual Income Taxes 2017, updated November 29, 2017.

58
APPENDIX A: SUPPLEMENTAL PENSION PAYMENTS
The following table shows the application of the supplemental payments and the effect on the
funded status of the retirement systems.
Fiscal
Year
Accrued
Liabilities
Actuarial
Value of
Assets
Unfunded
Liabilities
Funded
Ratio
Supp.
Contribution
Accrual of
Supplemental
Contributions
Supplemental
Contribution
Value*
Total
Asssets
with Supp.
Value
Reduced
Unfunded
Liabilities
Increased
Funded
Ratio
2019 227,849$ 92,439$ (135,410)$ 41% -$ 92,439$ (135,410)$ 41%
2020 234,431$ 96,299$ (138,132)$ 41% 600$ -$ 600$ 96,899$ (137,532)$ 41%
2021 240,924$ 101,644$ (139,280)$ 42% 600$ 642$ 1,242$ 102,886$ (138,038)$ 43%
2022 247,291$ 106,411$ (140,880)$ 43% 600$ 1,329$ 1,929$ 108,340$ (138,951)$ 44%
2023 253,511$ 111,151$ (142,360)$ 44% 600$ 2,064$ 2,664$ 113,815$ (139,696)$ 45%
2024 259,568$ 115,908$ (143,660)$ 45% 600$ 2,850$ 3,450$ 119,359$ (140,209)$ 46%
2025 265,443$ 120,690$ (144,753)$ 45% 600$ 3,692$ 4,292$ 124,982$ (140,461)$ 47%
2026 271,112$ 125,531$ (145,580)$ 46% 600$ 4,592$ 5,192$ 130,724$ (140,388)$ 48%
2027 276,540$ 130,432$ (146,108)$ 47% 600$ 5,556$ 6,156$ 136,588$ (139,952)$ 49%
2028 281,728$ 135,403$ (146,326)$ 48% 600$ 6,587$ 7,187$ 142,590$ (139,139)$ 51%
2029 286,665$ 140,476$ (146,189)$ 49% 600$ 7,690$ 8,290$ 148,766$ (137,899)$ 52%
2030 291,328$ 145,647$ (145,681)$ 50% 600$ 8,870$ 9,470$ 155,117$ (136,211)$ 53%
2031 295,697$ 150,945$ (144,752)$ 51% 600$ 10,133$ 10,733$ 161,678$ (134,019)$ 55%
2032 299,753$ 156,430$ (143,322)$ 52% 600$ 11,484$ 12,084$ 168,515$ (131,238)$ 56%
2033 303,549$ 162,236$ (141,313)$ 53% 600$ 12,930$ 13,530$ 175,766$ (127,783)$ 58%
2034 307,026$ 169,261$ (137,765)$ 55% 600$ 14,477$ 15,077$ 184,339$ (122,688)$ 60%
2035 310,176$ 176,705$ (133,471)$ 57% 481$ 16,133$ 16,614$ 193,318$ (116,857)$ 62%
2036 312,998$ 184,634$ (128,364)$ 59% 17,777$ 17,777$ 202,410$ (110,588)$ 65%
2037 315,504$ 193,132$ (122,372)$ 61% 19,021$ 19,021$ 212,153$ (103,351)$ 67%
2038 317,807$ 202,292$ (115,515)$ 64% 20,352$ 20,352$ 222,645$ (95,163)$ 70%
2039 319,607$ 212,194$ (107,412)$ 66% 21,777$ 21,777$ 233,971$ (85,635)$ 73%
2040 321,225$ 222,946$ (98,279)$ 69% 23,301$ 23,301$ 246,248$ (74,978)$ 77%
2041 323,604$ 234,669$ (88,935)$ 73% 24,933$ 24,933$ 259,601$ (64,002)$ 80%
2042 323,792$ 247,498$ (76,294)$ 76% 26,678$ 26,678$ 274,176$ (49,616)$ 85%
2043 324,842$ 261,579$ (63,264)$ 81% 28,545$ 28,545$ 290,124$ (34,719)$ 89%
2044 325,824$ 277,071$ (48,753)$ 85% 30,543$ 30,543$ 307,614$ (18,209)$ 94%
2045 326,816$ 294,135$ (32,682)$ 90% 32,682$ 32,682$ 326,816$ -$ 100%
State of Illinois Pension Funding Projections:
Supplemental Annual Contribution FY2019 to FY2045 (in $ million)
*Assumes supplemental contributions of $600 million annually from FY2020 through FY2034 and $410 million in FY2035. Earnings on these contributions, with a 7.0% long-term rate of
return, will be sufficient to lower the unfunded liabilities of the funds to zero by FY2045.
Source: Illinois General Assembly, Commission on Government Forecasting and Accountibility, "Special Pension Briefing ," November 2017, p. 11; Civic Federation calculations.

59
APPENDIX B: FALL UNDERGRADUATE ENROLLMENT AT ILLINOIS PUBLIC
UNIVERSITIES
The following chart shows fall undergraduate enrollment at the 12 campuses of Illinois’ nine
public universities, as measured by headcount, from 2008 to 2017. The 2017 number is
preliminary and data were not available for 2013.
Institution 2008 2009 2010 2011 2012 2014 2015 2016 2017*
Chicago State University 5,211 5,398 5,675 5,280 4,618 3,912 3,462 2,352 2,095
Eastern Illinois University 10,261 10,225 9,970 9,657 8,975 7,640 7,202 5,957 5,568
Governors State University 2,608 2,791 2,993 2,943 3,178 3,585 3,570 3,517 3,326
Illinois State University 18,065 18,389 18,314 18,594 18,257 18,155 18,427 18,643 18,330
Northeastern Illinois University 8,987 9,191 9,498 9,421 9,140 8,412 8,095 7,665 7,113
Northern Illinois University 18,431 18,277 17,886 17,306 16,552 15,435 15,027 14,079 13,454
Southern Illinois University
Carbondale 15,980 15,551 15,137 15,000 14,130 13,461 13,031 12,182 10,987
Southern Illinois University
Edwardsville 10,977 11,144 11,305 11,428 11,341 11,421 11,781 11,720 11,402
U of I at Chicago 15,665 16,044 16,806 16,925 16,678 16,718 17,575 17,959 19,448
U of I at Springfield 2,889 3,027 3,197 3,112 3,054 3,038 2,937 2,959 2,932
U of I at Urbana/Champaign 31,417 31,477 31,540 32,256 32,281 32,959 33,368 33,932 33,955
Western Illinois University 10,735 10,553 10,474 10,520 10,263 9,645 9,141 8,543 7,599
Public Universities Total 151,226 152,067 152,795 152,442 148,467 144,381 143,616 139,508 136,209
Source: Illinois Board of Higher Education, Enrollment Trend Data, Fall Headcount Enrollments , http://www.ibhe.org/IBHEDatabook/ChapterI/Table%20I-14.aspx, and Preliminary Fall 2017
Enrollments in Illinois Higher Education, http://www.ibhe.org/Board/agendas/2017/December/PreliminaryFall2017Enrollments.pdf.
** Preliminary.
*Enrollment numbers are based on headcount. Data for FY2013 were not available.
Fall Undergraduate Enrollment at State of Illinois Public Universities: 2008-2017