state of the automotive finance market - experian€¦ · • new and used financing • lender and...
TRANSCRIPT
© 2018 Experian Information Solutions, Inc. All rights reserved. Experian and the marks used herein are service marks or registered trademarks of Experian Information Solutions, Inc. Other product and company names mentioned herein are the trademarks of their respective owners. No part of this copyrighted work may be reproduced, modified, or distributed in any form or manner without the prior written permission of Experian. Experian Public.
www.experian.com/automotive
State of the Automotive Finance Market
A look at loans and leases in Q4 2017Presented by: Melinda Zabritski | Sr. Director, Financial Solutions
2 © Experian
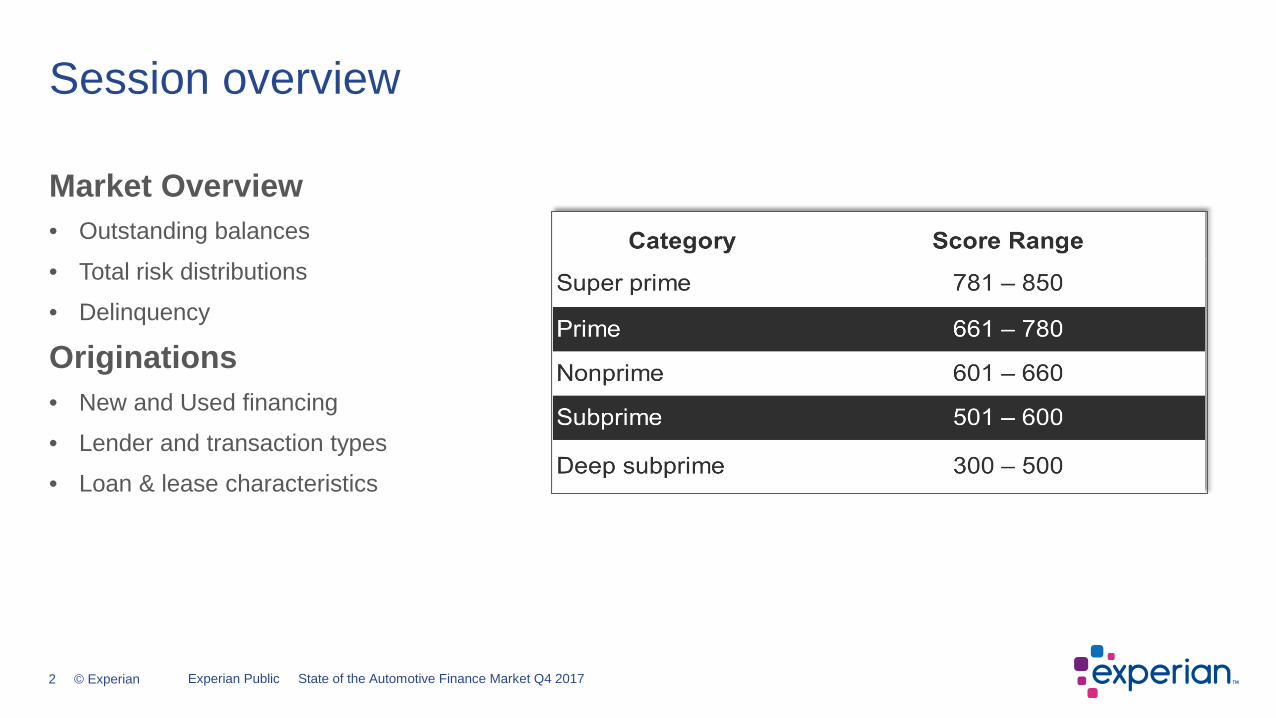
Market Overview• Outstanding balances
• Total risk distributions
• Delinquency
Originations• New and Used financing
• Lender and transaction types
• Loan & lease characteristics
Session overview
Experian Public State of the Automotive Finance Market Q4 2017
3 © Experian
A review of all open automotive loans & leases
Overall Automotive Finance Market
Experian Public State of the Automotive Finance Market Q4 2017
4 © Experian
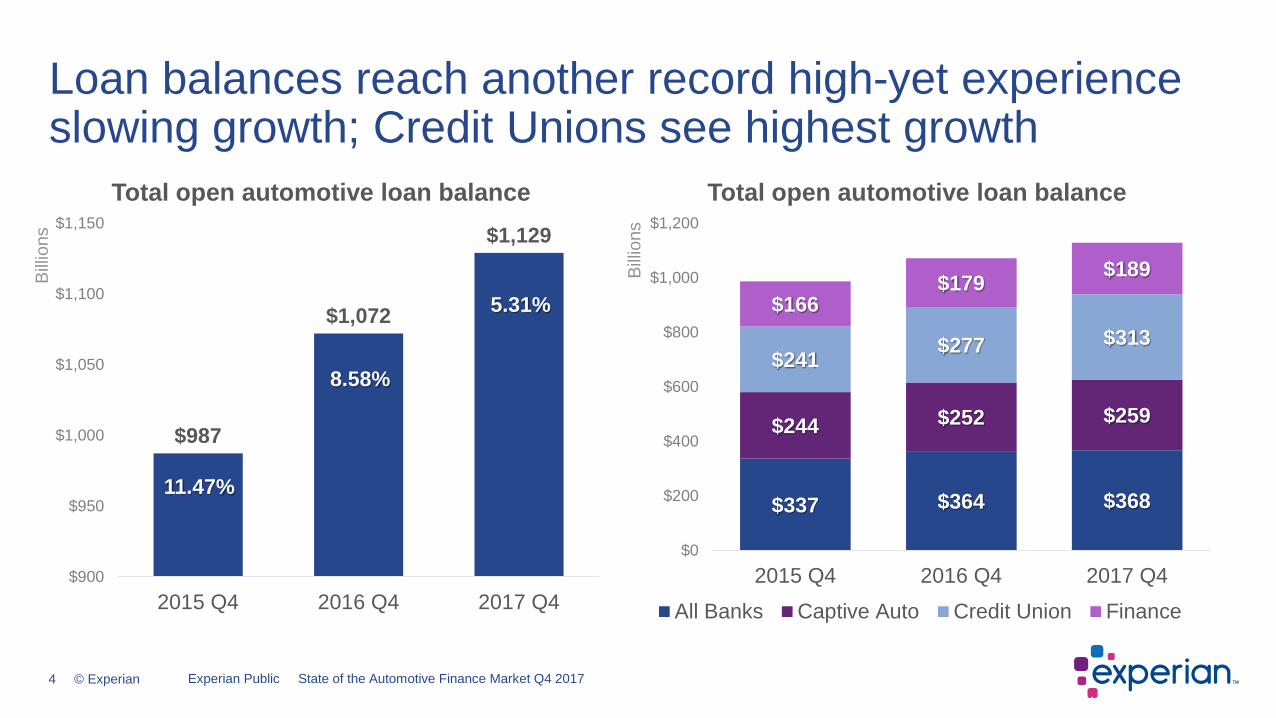
$987
$1,072
$1,129
$900
$950
$1,000
$1,050
$1,100
$1,150
2015 Q4 2016 Q4 2017 Q4
Bill
ions
Total open automotive loan balance
Loan balances reach another record high-yet experience slowing growth; Credit Unions see highest growth
Source: Experian-Oliver Wyman Market Intelligence Reports
$337 $364 $368
$244 $252 $259
$241 $277 $313$166
$179 $189
$0
$200
$400
$600
$800
$1,000
$1,200
2015 Q4 2016 Q4 2017 Q4
Bill
ions
Total open automotive loan balance
All Banks Captive Auto Credit Union Finance
Experian Public State of the Automotive Finance Market Q4 2017
11.47%
8.58%
5.31%
5 © Experian
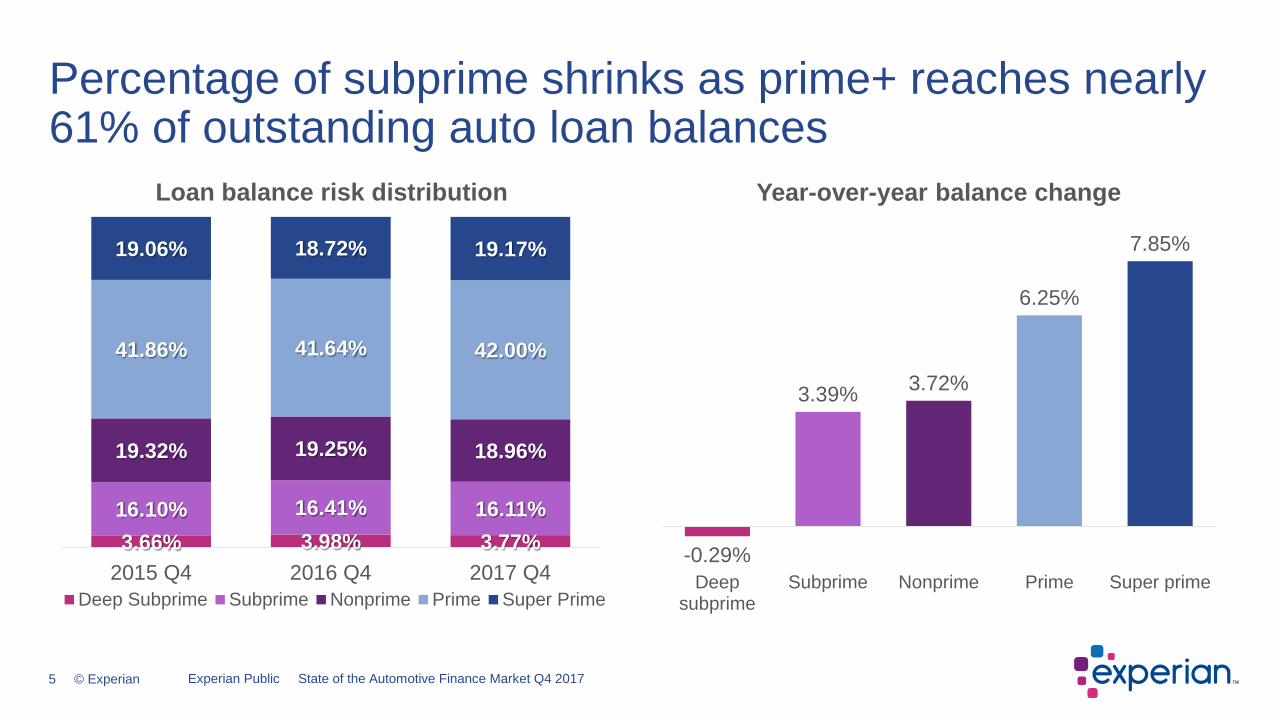
3.66% 3.98% 3.77%16.10% 16.41% 16.11%
19.32% 19.25% 18.96%
41.86% 41.64% 42.00%
19.06% 18.72% 19.17%
2015 Q4 2016 Q4 2017 Q4
Loan balance risk distribution
Deep Subprime Subprime Nonprime Prime Super Prime
Percentage of subprime shrinks as prime+ reaches nearly 61% of outstanding auto loan balances
-0.29%
3.39% 3.72%
6.25%
7.85%
Deepsubprime
Subprime Nonprime Prime Super prime
Year-over-year balance change
Experian Public State of the Automotive Finance Market Q4 2017
6 © Experian
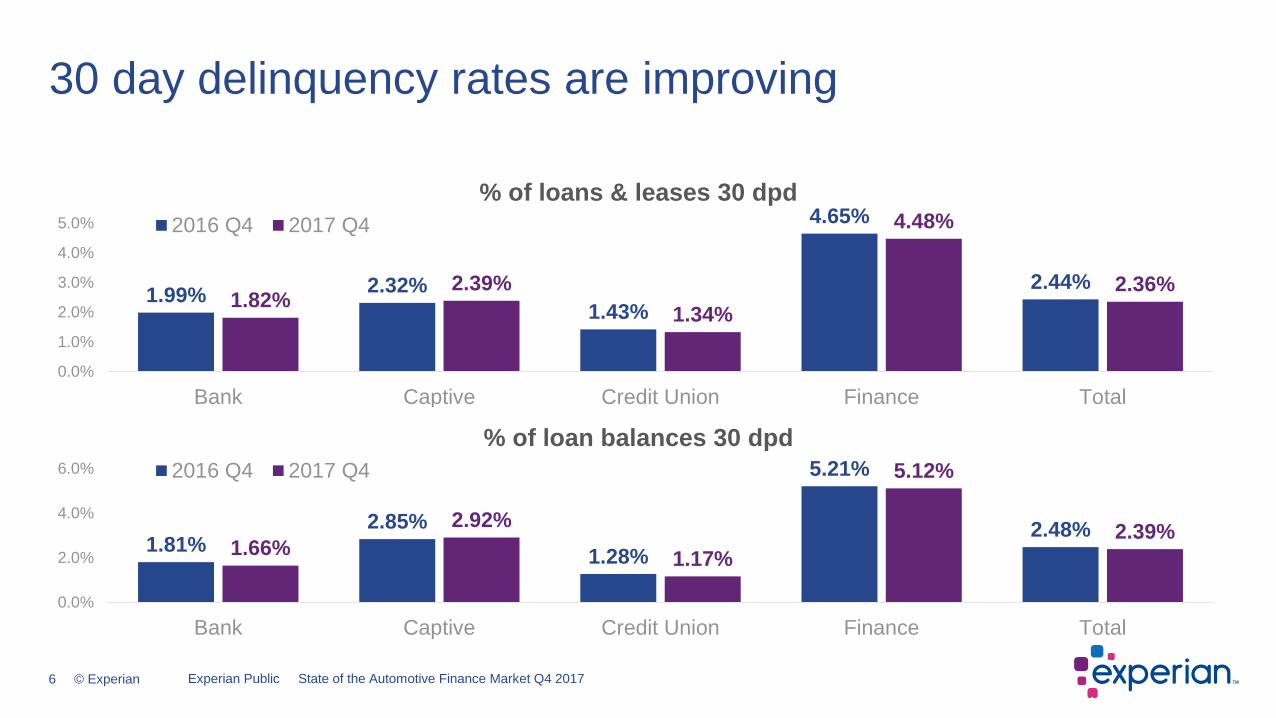
1.99% 2.32%1.43%
4.65%
2.44%1.82%
2.39%1.34%
4.48%
2.36%
0.0%
1.0%
2.0%
3.0%
4.0%
5.0%
Bank Captive Credit Union Finance Total
% of loans & leases 30 dpd2016 Q4 2017 Q4
30 day delinquency rates are improving
Source: Experian-Oliver Wyman Market Intelligence Reports
1.81%2.85%
1.28%
5.21%
2.48%1.66%
2.92%
1.17%
5.12%
2.39%
0.0%
2.0%
4.0%
6.0%
Bank Captive Credit Union Finance Total
% of loan balances 30 dpd2016 Q4 2017 Q4
Experian Public State of the Automotive Finance Market Q4 2017
7 © Experian
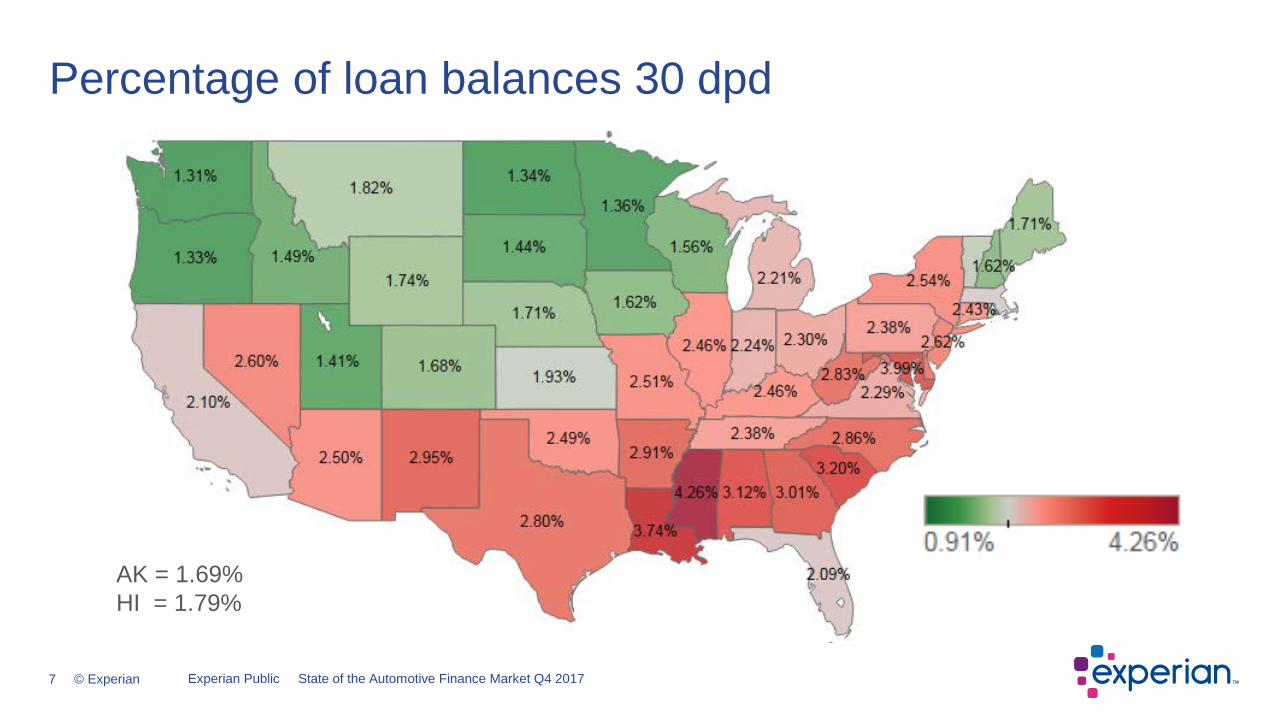
Percentage of loan balances 30 dpd
Experian Public State of the Automotive Finance Market Q4 2017
AK = 1.69%HI = 1.79%
8 © Experian
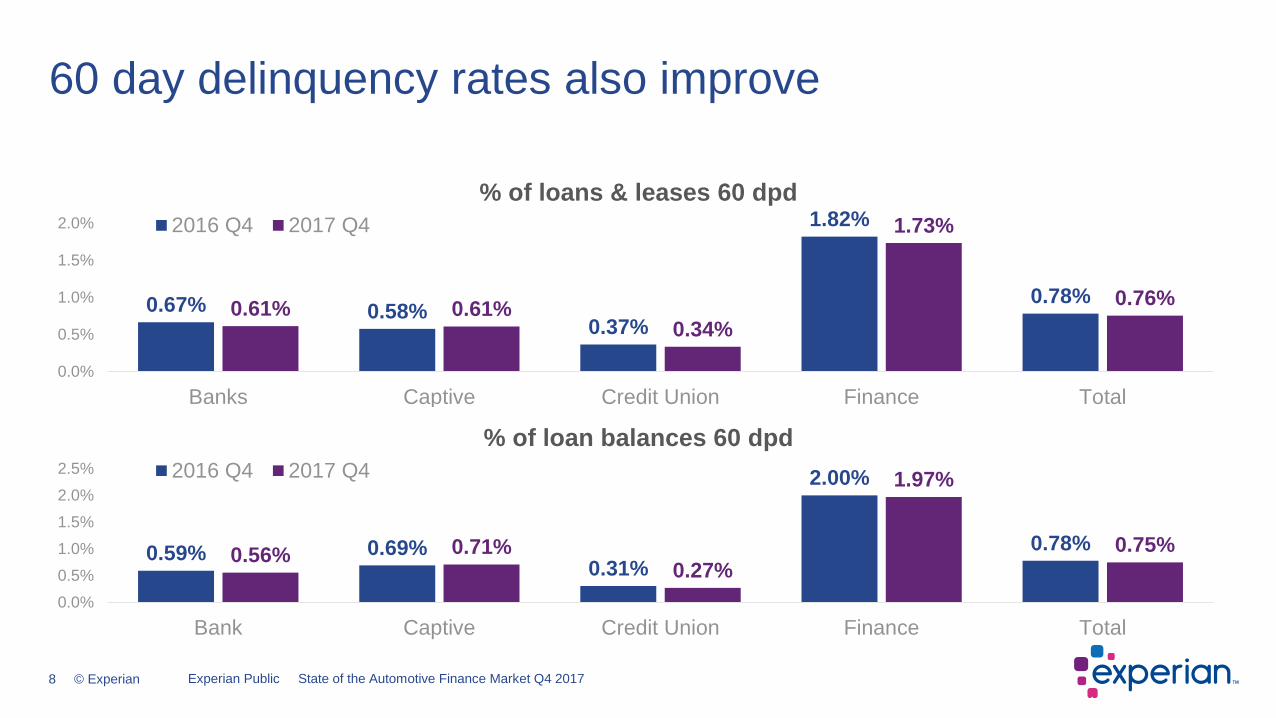
0.67% 0.58%0.37%
1.82%
0.78%0.61% 0.61%0.34%
1.73%
0.76%
0.0%
0.5%
1.0%
1.5%
2.0%
Banks Captive Credit Union Finance Total
% of loans & leases 60 dpd2016 Q4 2017 Q4
60 day delinquency rates also improve
Source: Experian-Oliver Wyman Market Intelligence Reports
0.59% 0.69%0.31%
2.00%
0.78%0.56% 0.71%0.27%
1.97%
0.75%
0.0%
0.5%
1.0%
1.5%
2.0%
2.5%
Bank Captive Credit Union Finance Total
% of loan balances 60 dpd2016 Q4 2017 Q4
Experian Public State of the Automotive Finance Market Q4 2017
9 © Experian
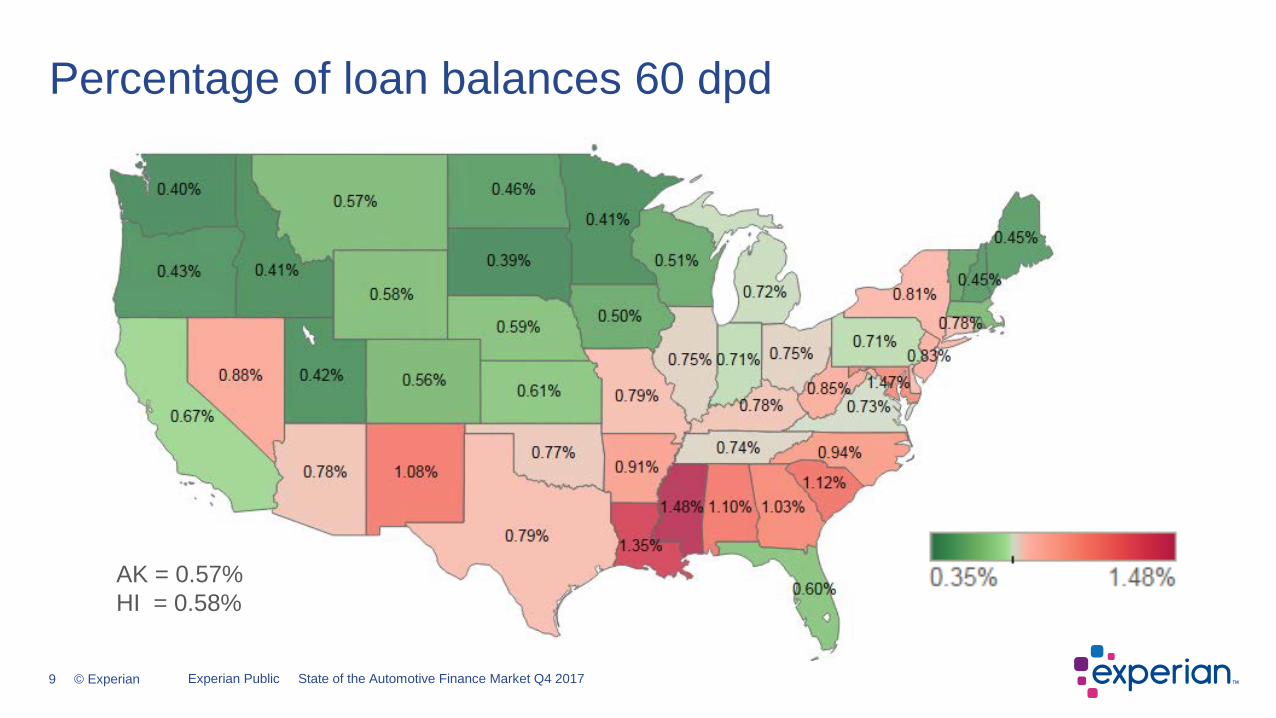
Percentage of loan balances 60 dpd
Experian Public State of the Automotive Finance Market Q4 2017
AK = 0.57%HI = 0.58%
10 © Experian
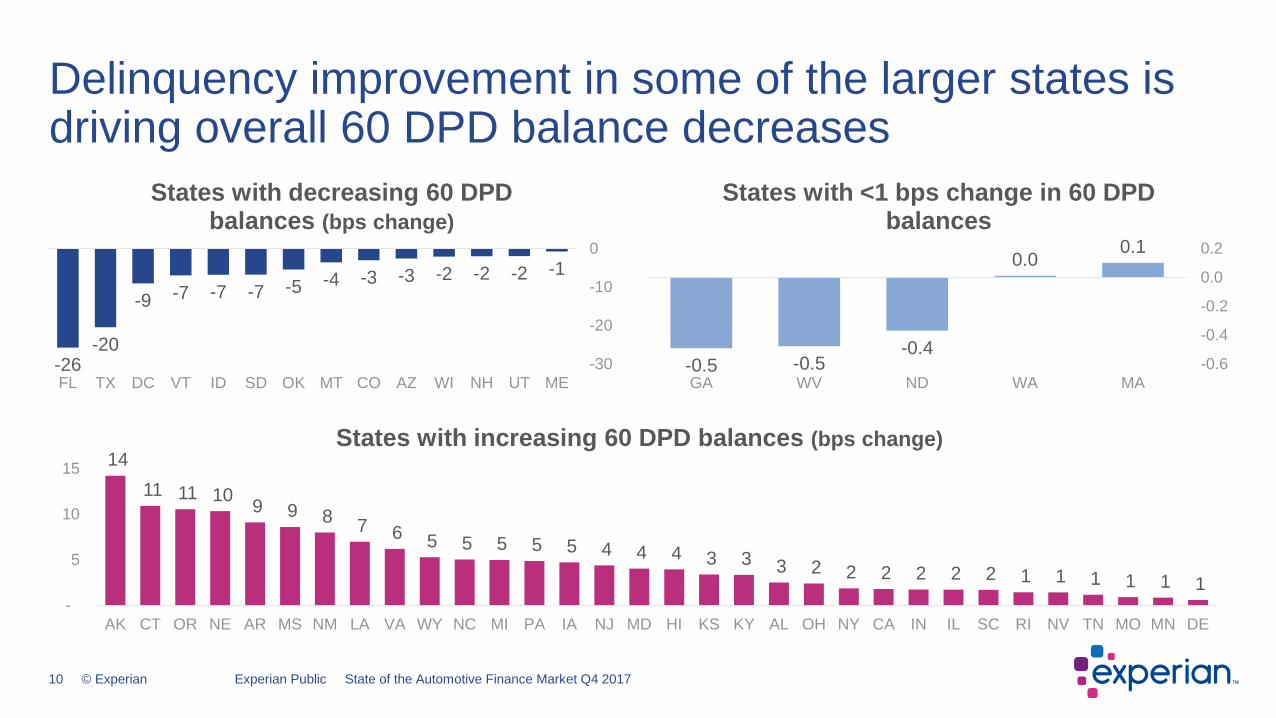
Delinquency improvement in some of the larger states is driving overall 60 DPD balance decreases
Experian Public State of the Automotive Finance Market Q4 2017
14 11 11 10 9 9 8 7 6 5 5 5 5 5 4 4 4 3 3 3 2 2 2 2 2 2 1 1 1 1 1 1
-
5
10
15
AK CT OR NE AR MS NM LA VA WY NC MI PA IA NJ MD HI KS KY AL OH NY CA IN IL SC RI NV TN MO MN DE
States with increasing 60 DPD balances (bps change)
-1-2-2-2-3-3-4-5-7-7-7-9
-20-26 -30
-20
-10
0
MEUTNHWIAZCOMTOKSDIDVTDCTXFL
States with decreasing 60 DPD balances (bps change)
0.10.0
-0.4-0.5-0.5 -0.6
-0.4
-0.2
0.0
0.2
MAWANDWVGA
States with <1 bps change in 60 DPD balances
11 © Experian
Trends in automotive loan and lease originations
Originations in Q4 2017
Experian Public State of the Automotive Finance Market Q4 2017
12 © Experian
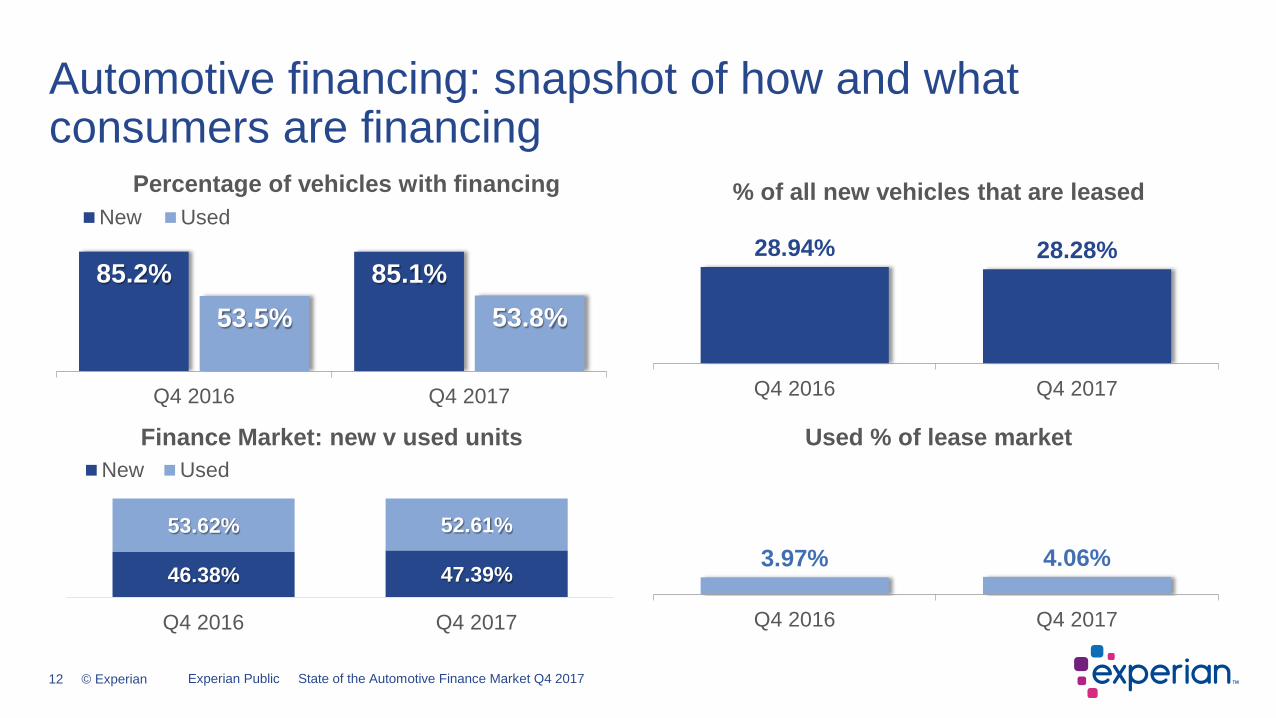
85.2% 85.1%53.5% 53.8%
Q4 2016 Q4 2017
Percentage of vehicles with financingNew Used
Automotive financing: snapshot of how and what consumers are financing
28.94% 28.28%
Q4 2016 Q4 2017
% of all new vehicles that are leased
46.38% 47.39%
53.62% 52.61%
Q4 2016 Q4 2017
Finance Market: new v used units New Used
3.97% 4.06%
Q4 2016 Q4 2017
Used % of lease market
Experian Public State of the Automotive Finance Market Q4 2017
13 © Experian
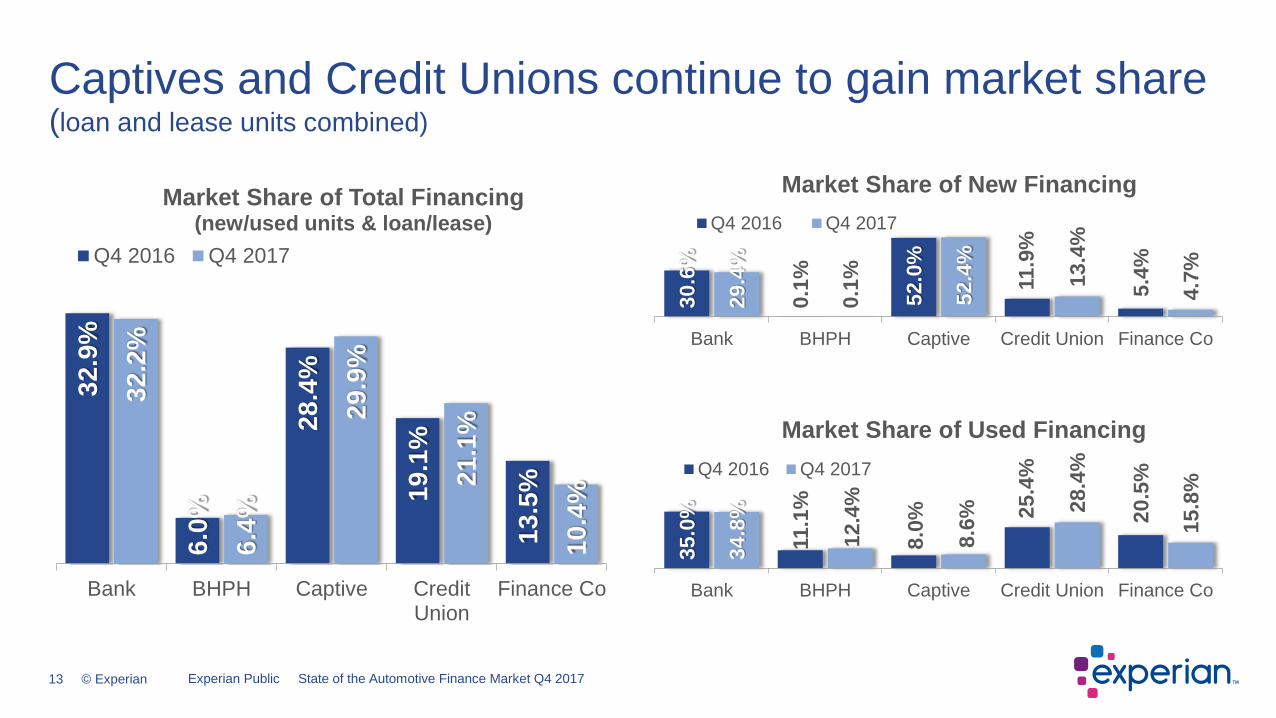
32.9
%
6.0%
28.4
%
19.1
%
13.5
%
32.2
%
6.4%
29.9
%
21.1
%
10.4
%Bank BHPH Captive Credit
UnionFinance Co
Market Share of Total Financing(new/used units & loan/lease)
Q4 2016 Q4 2017
Captives and Credit Unions continue to gain market share (loan and lease units combined)
30.6
%
0.1%
52.0
%
11.9
%
5.4%
29.4
%
0.1% 52.4
%
13.4
%
4.7%
Bank BHPH Captive Credit Union Finance Co
Market Share of New FinancingQ4 2016 Q4 2017
35.0
%
11.1
%
8.0% 25
.4%
20.5
%
34.8
%
12.4
%
8.6%
28.4
%
15.8
%
Bank BHPH Captive Credit Union Finance Co
Market Share of Used FinancingQ4 2016 Q4 2017
Experian Public State of the Automotive Finance Market Q4 2017
14 © Experian
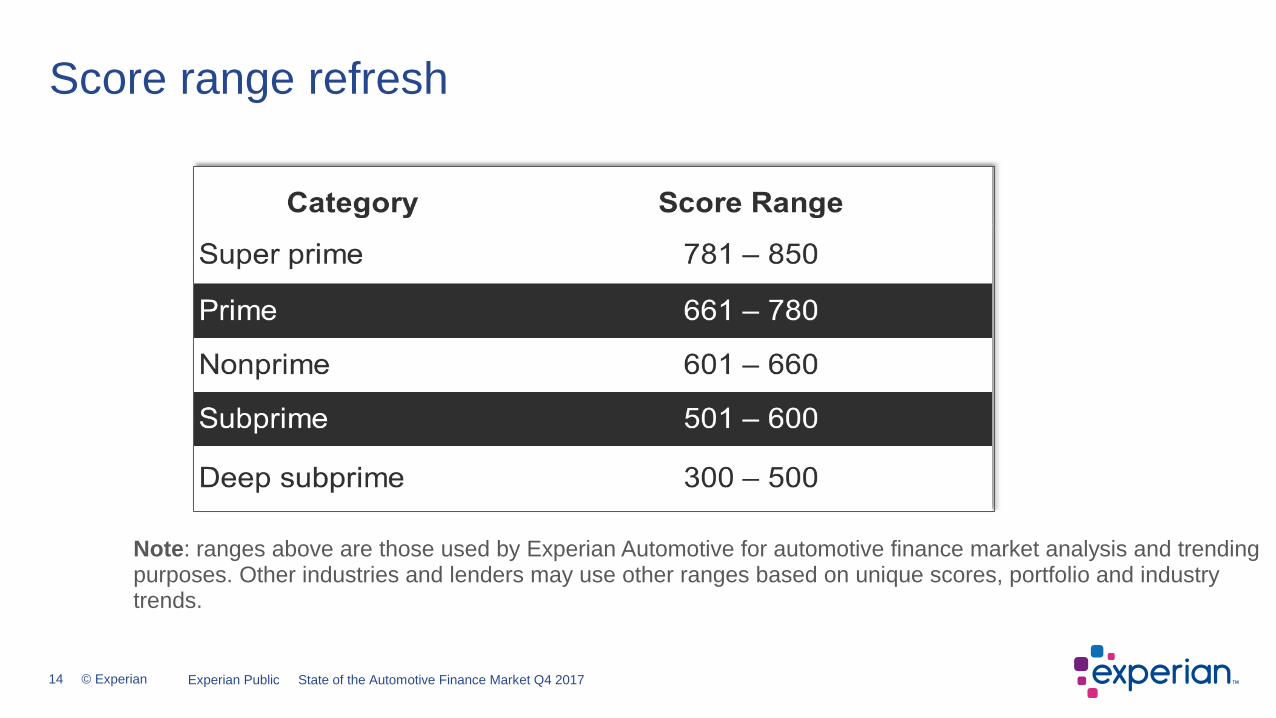
Score range refresh
Note: ranges above are those used by Experian Automotive for automotive finance market analysis and trending purposes. Other industries and lenders may use other ranges based on unique scores, portfolio and industry trends.
Experian Public State of the Automotive Finance Market Q4 2017
15 © Experian
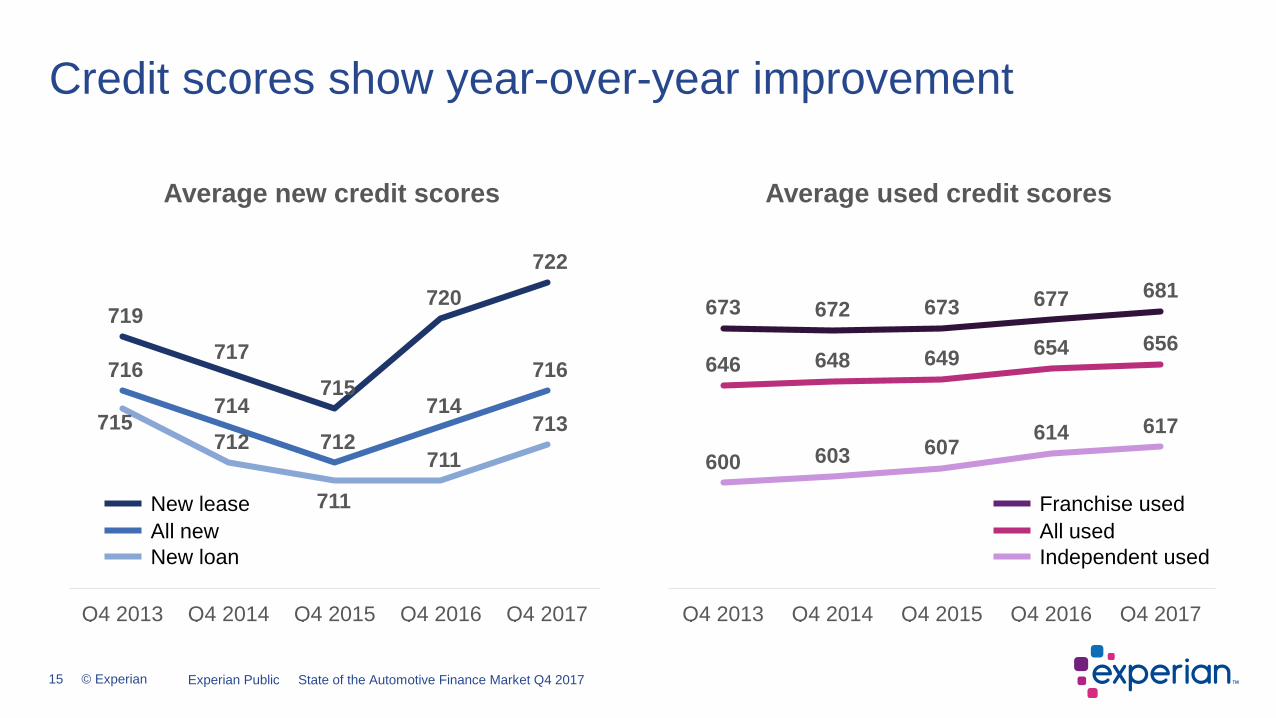
Credit scores show year-over-year improvement
646 648 649 654 656673 672 673 677 681
600 603 607614 617
Q4 2013 Q4 2014 Q4 2015 Q4 2016 Q4 2017
Average used credit scores
Franchise usedAll usedIndependent used
New leaseAll newNew loan
Experian Public State of the Automotive Finance Market Q4 2017
715 712
711
711 713
716 714
712 714
716
719 717
715
720 722
Q4 2013 Q4 2014 Q4 2015 Q4 2016 Q4 2017
Average new credit scores
16 © Experian
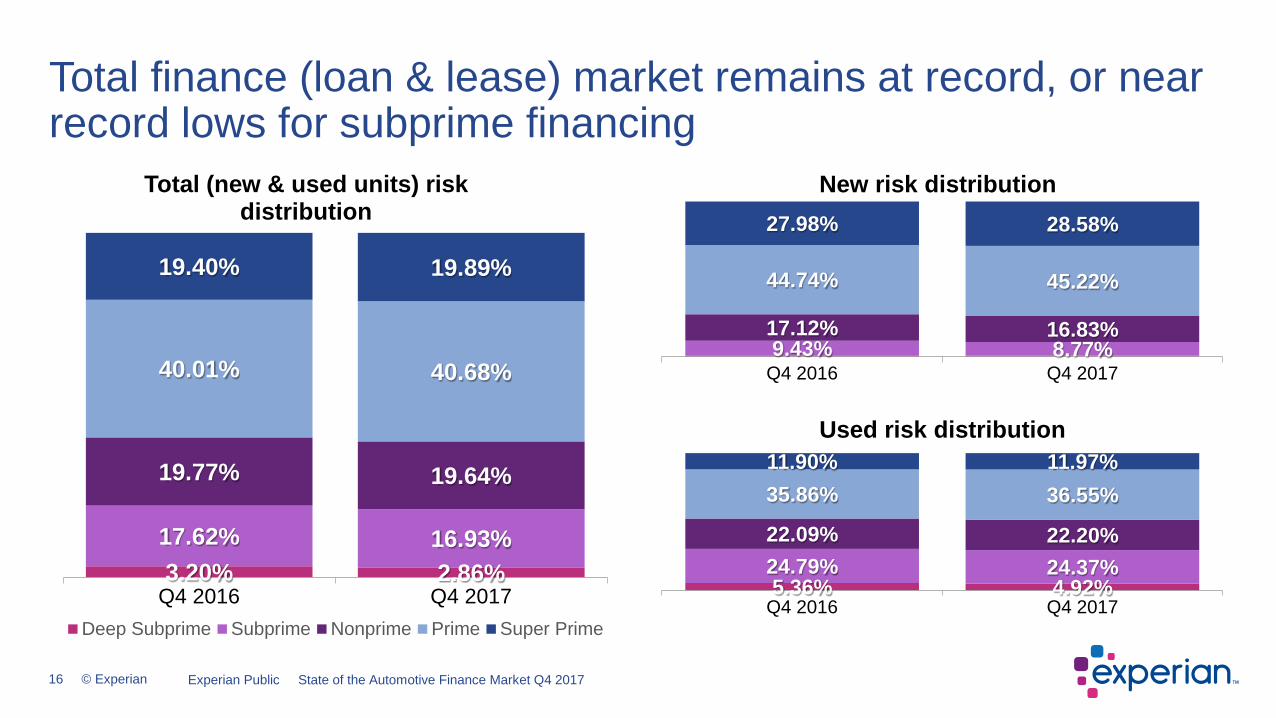
Total finance (loan & lease) market remains at record, or near record lows for subprime financing
9.43% 8.77%17.12% 16.83%
44.74% 45.22%
27.98% 28.58%
Q4 2016 Q4 2017
New risk distribution
5.36% 4.92%24.79% 24.37%22.09% 22.20%
35.86% 36.55%11.90% 11.97%
Q4 2016 Q4 2017
Used risk distribution
Experian Public State of the Automotive Finance Market Q4 2017
3.20% 2.86%17.62% 16.93%
19.77% 19.64%
40.01% 40.68%
19.40% 19.89%
Q4 2016 Q4 2017
Total (new & used units) risk distribution
Deep Subprime Subprime Nonprime Prime Super Prime
17 © Experian
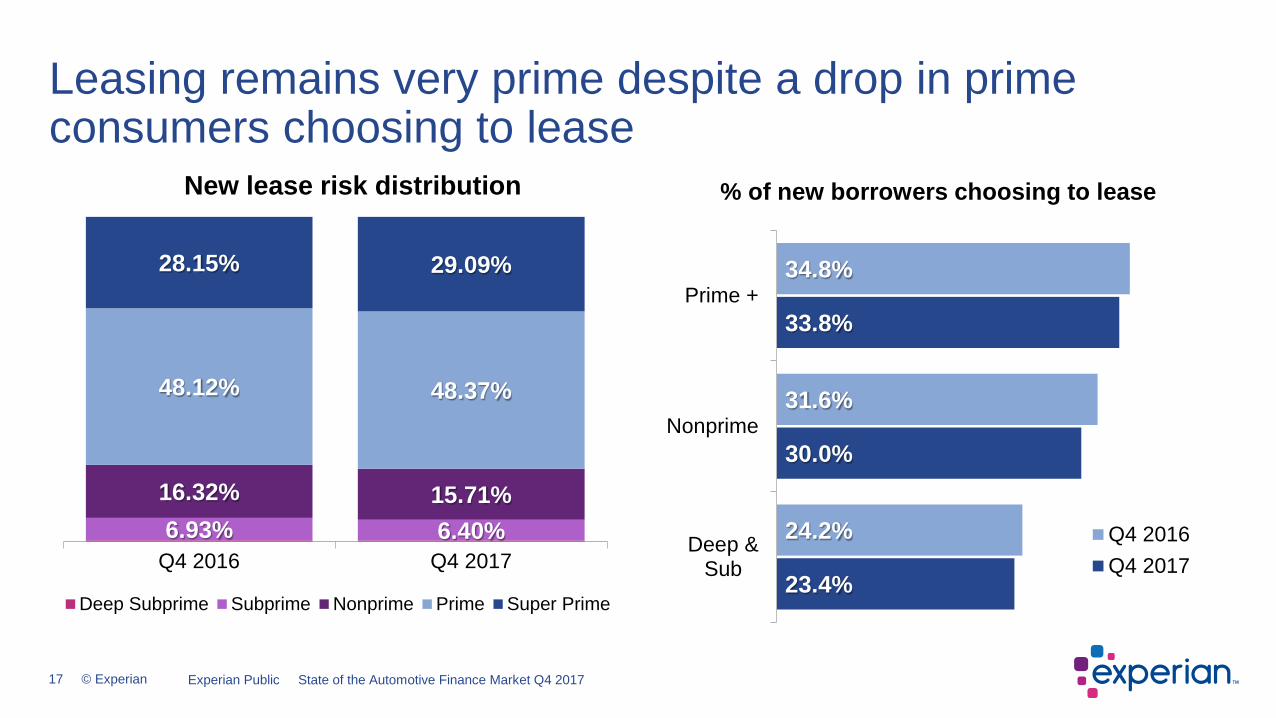
6.93% 6.40%16.32% 15.71%
48.12% 48.37%
28.15% 29.09%
Q4 2016 Q4 2017
New lease risk distribution
Deep Subprime Subprime Nonprime Prime Super Prime
Leasing remains very prime despite a drop in prime consumers choosing to lease
23.4%
30.0%
33.8%
24.2%
31.6%
34.8%
Deep &Sub
Nonprime
Prime +
% of new borrowers choosing to lease
Q4 2016Q4 2017
Experian Public State of the Automotive Finance Market Q4 2017
18 © Experian
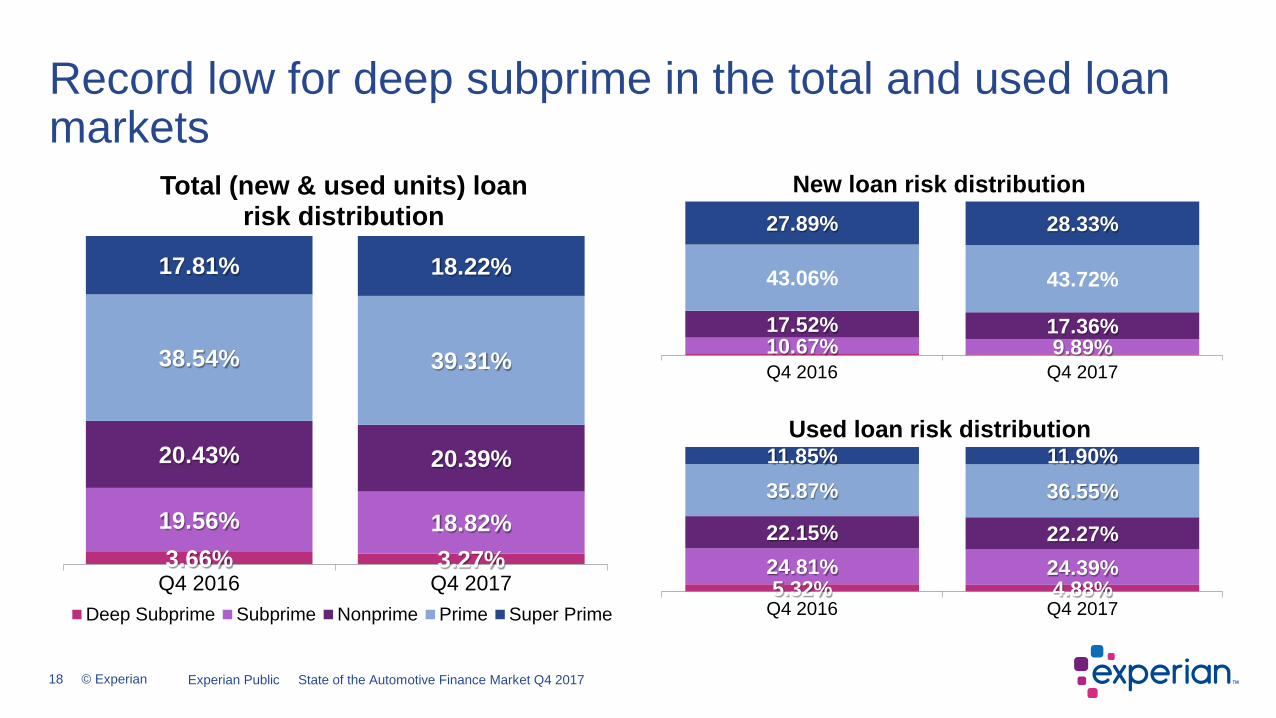
3.66% 3.27%19.56% 18.82%
20.43% 20.39%
38.54% 39.31%
17.81% 18.22%
Q4 2016 Q4 2017
Total (new & used units) loan risk distribution
Deep Subprime Subprime Nonprime Prime Super Prime
Record low for deep subprime in the total and used loan markets
10.67% 9.89%17.52% 17.36%
43.06% 43.72%
27.89% 28.33%
Q4 2016 Q4 2017
New loan risk distribution
5.32% 4.88%24.81% 24.39%22.15% 22.27%
35.87% 36.55%11.85% 11.90%
Q4 2016 Q4 2017
Used loan risk distribution
Experian Public State of the Automotive Finance Market Q4 2017
19 © Experian
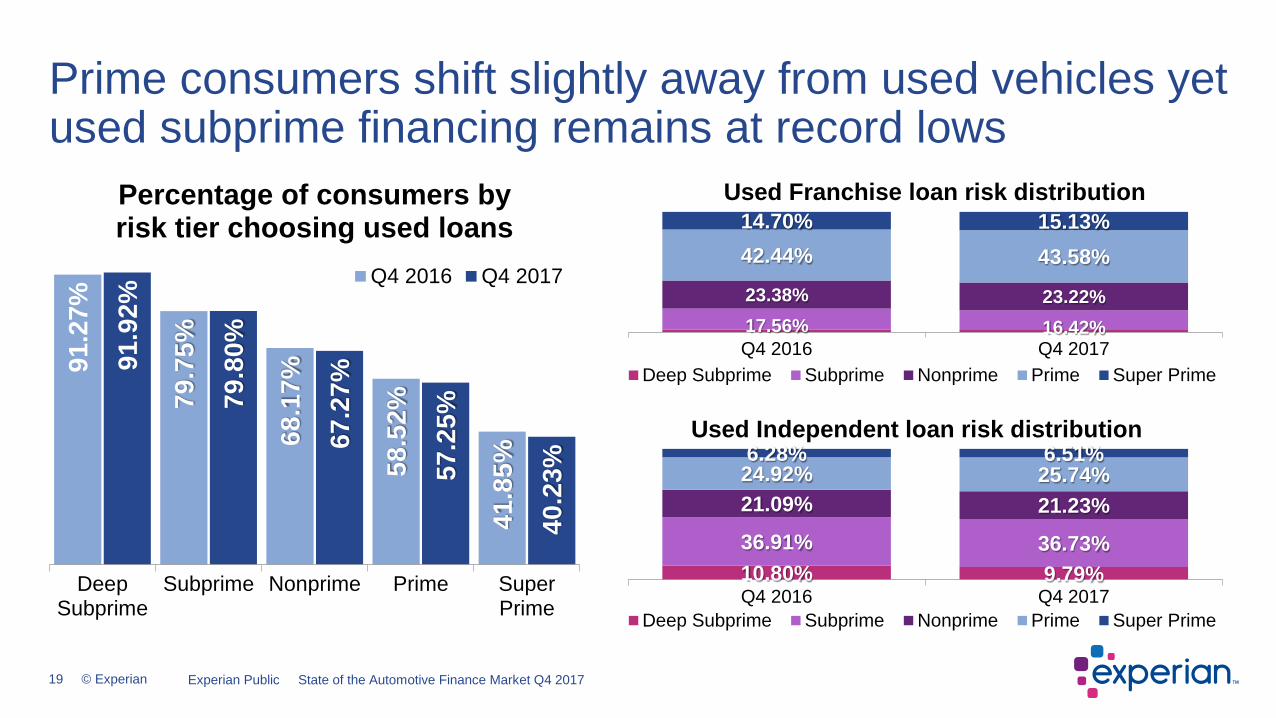
91.2
7%
79.7
5%
68.1
7%
58.5
2%
41.8
5%
91.9
2%
79.8
0%
67.2
7%
57.2
5%
40.2
3%Deep
SubprimeSubprime Nonprime Prime Super
Prime
Percentage of consumers by risk tier choosing used loans
Q4 2016 Q4 2017
Prime consumers shift slightly away from used vehicles yet used subprime financing remains at record lows
17.56% 16.42%23.38% 23.22%
42.44% 43.58%14.70% 15.13%
Q4 2016 Q4 2017
Used Franchise loan risk distribution
Deep Subprime Subprime Nonprime Prime Super Prime
10.80% 9.79%36.91% 36.73%
21.09% 21.23%24.92% 25.74%6.28% 6.51%
Q4 2016 Q4 2017
Used Independent loan risk distribution
Deep Subprime Subprime Nonprime Prime Super Prime
Experian Public State of the Automotive Finance Market Q4 2017
20 © Experian
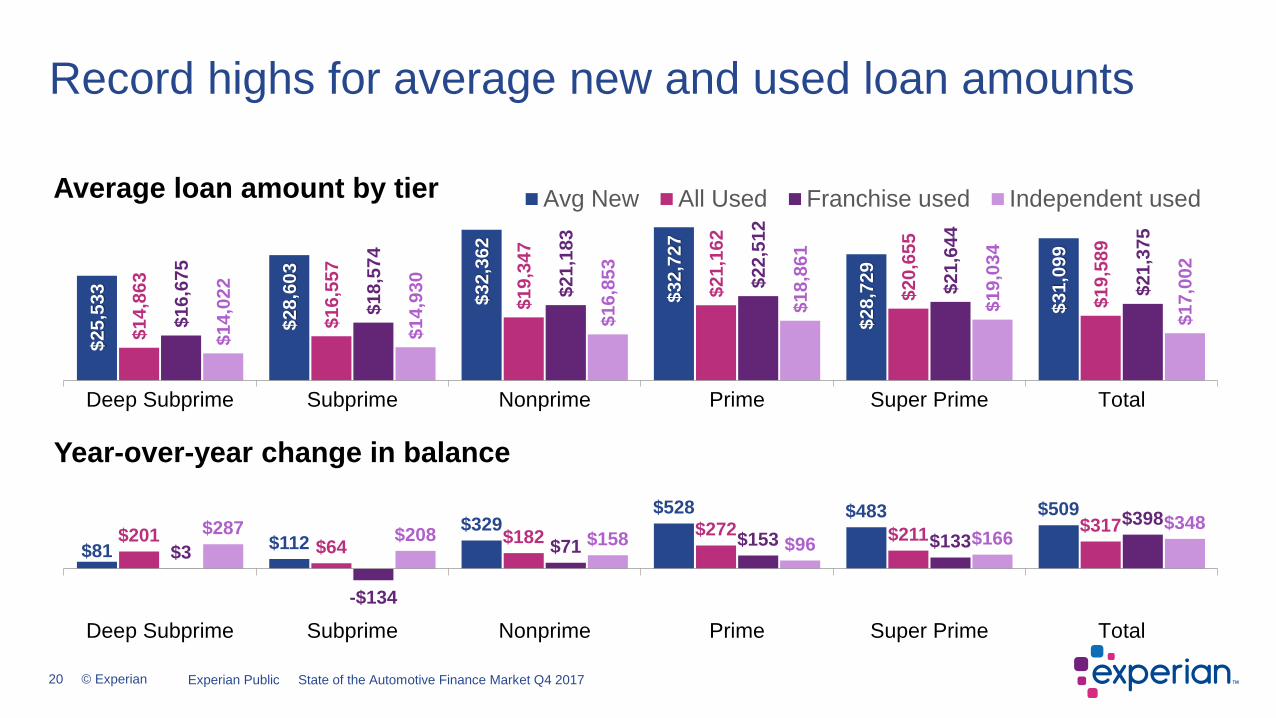
Record highs for average new and used loan amounts
$81 $112$329
$528 $483 $509$201 $64 $182 $272 $211 $317
$3
-$134
$71 $153 $133$398$287 $208 $158 $96 $166
$348
Deep Subprime Subprime Nonprime Prime Super Prime Total
Year-over-year change in balance
$25,
533
$28,
603
$32,
362
$32,
727
$28,
729
$31,
099
$14,
863
$16,
557
$19,
347
$21,
162
$20,
655
$19,
589
$16,
675
$18,
574
$21,
183
$22,
512
$21,
644
$21,
375
$14,
022
$14,
930
$16,
853
$18,
861
$19,
034
$17,
002
Deep Subprime Subprime Nonprime Prime Super Prime Total
Average loan amount by tier Avg New All Used Franchise used Independent used
Experian Public State of the Automotive Finance Market Q4 2017
21 © Experian
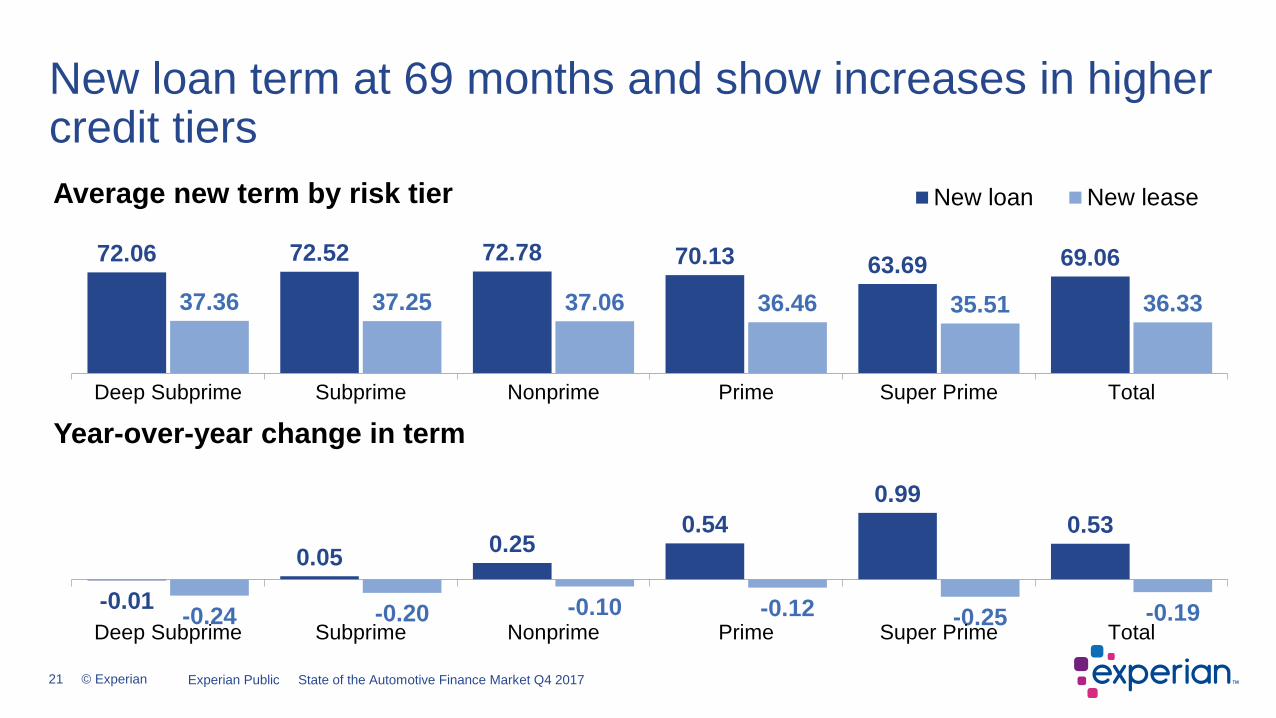
72.06 72.52 72.78 70.13 63.69 69.06
37.36 37.25 37.06 36.46 35.51 36.33
Deep Subprime Subprime Nonprime Prime Super Prime Total
Average new term by risk tier New loan New lease
New loan term at 69 months and show increases in higher credit tiers
-0.01
0.05 0.250.54
0.990.53
-0.24 -0.20 -0.10 -0.12 -0.25 -0.19Deep Subprime Subprime Nonprime Prime Super Prime Total
Year-over-year change in term
Experian Public State of the Automotive Finance Market Q4 2017
22 © Experian
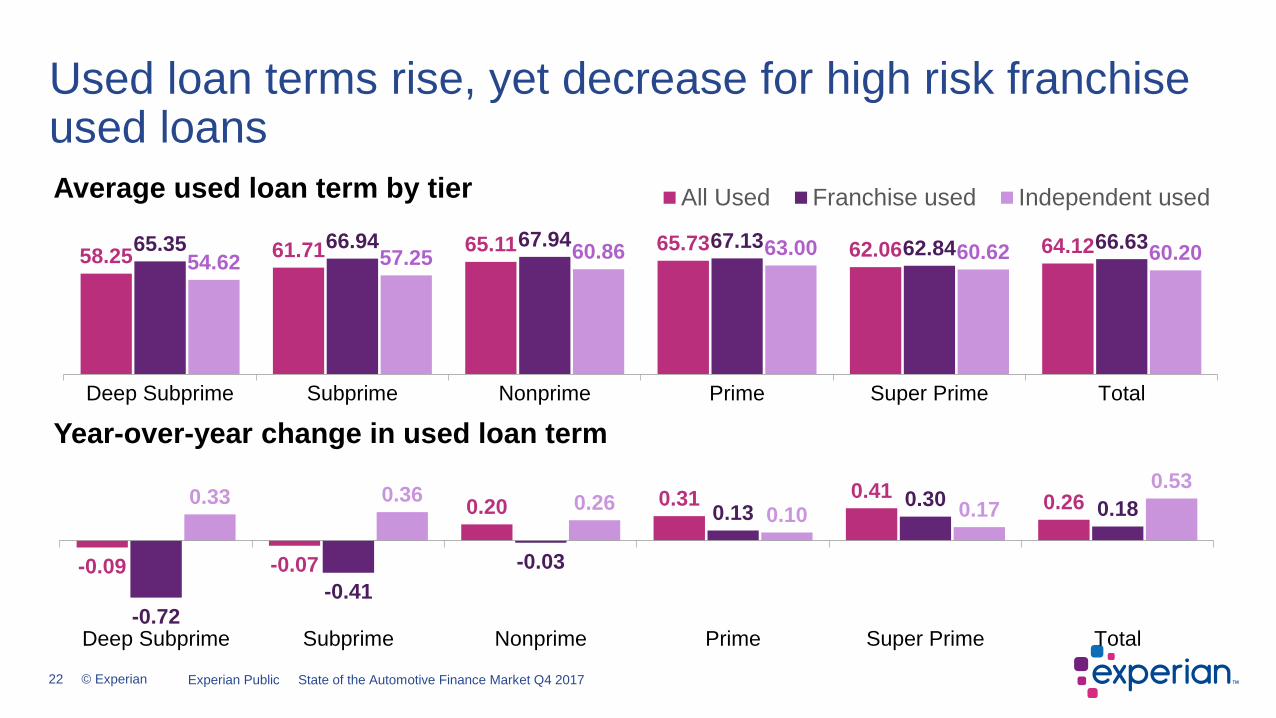
Used loan terms rise, yet decrease for high risk franchise used loans
58.25 61.71 65.11 65.73 62.06 64.1265.35 66.94 67.94 67.13 62.84 66.6354.62 57.25 60.86 63.00 60.62 60.20
Deep Subprime Subprime Nonprime Prime Super Prime Total
Average used loan term by tier All Used Franchise used Independent used
-0.09 -0.07
0.20 0.31 0.41 0.26
-0.72-0.41
-0.03
0.13 0.30 0.180.33 0.36 0.26 0.10 0.170.53
Deep Subprime Subprime Nonprime Prime Super Prime Total
Year-over-year change in used loan term
Experian Public State of the Automotive Finance Market Q4 2017
23 © Experian
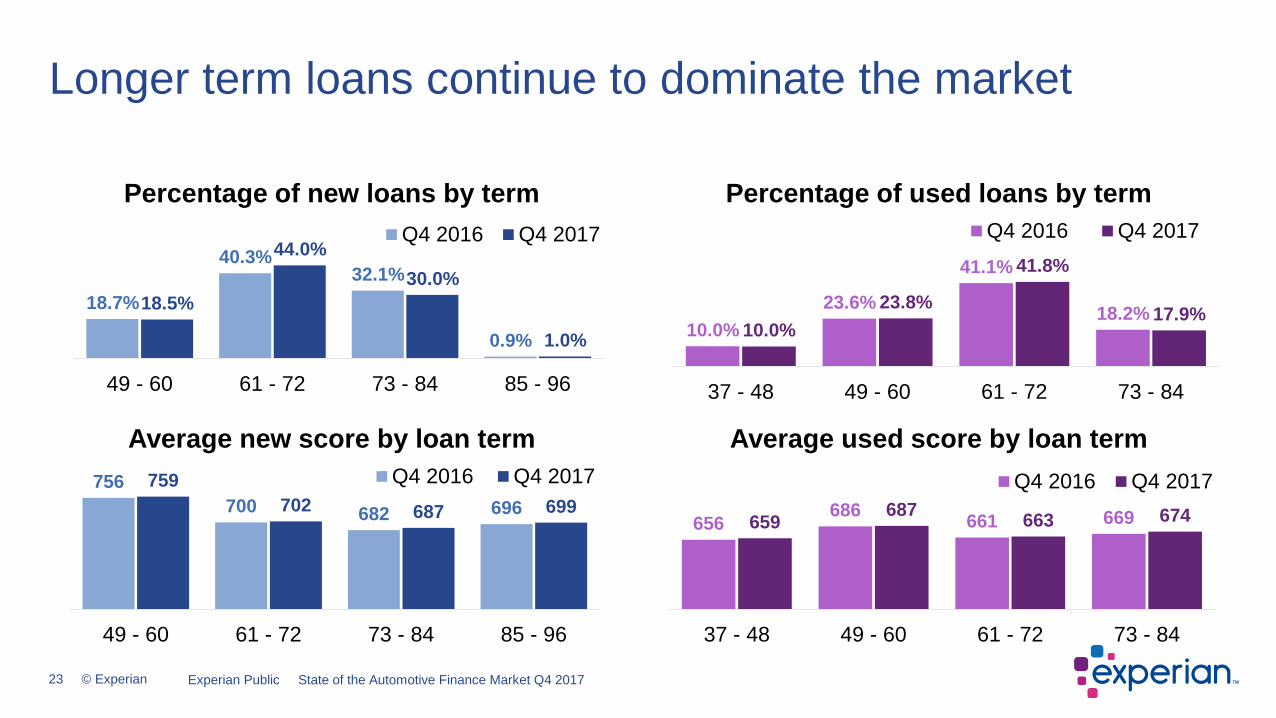
18.7%
40.3%32.1%
0.9%
18.5%
44.0%30.0%
1.0%
49 - 60 61 - 72 73 - 84 85 - 96
Percentage of new loans by termQ4 2016 Q4 2017
Longer term loans continue to dominate the market
10.0%23.6%
41.1%
18.2%10.0%
23.8%
41.8%
17.9%
37 - 48 49 - 60 61 - 72 73 - 84
Percentage of used loans by termQ4 2016 Q4 2017
756700 682 696
759702 687 699
49 - 60 61 - 72 73 - 84 85 - 96
Average new score by loan termQ4 2016 Q4 2017
656686 661 669659 687 663 674
37 - 48 49 - 60 61 - 72 73 - 84
Average used score by loan termQ4 2016 Q4 2017
Experian Public State of the Automotive Finance Market Q4 2017
24 © Experian
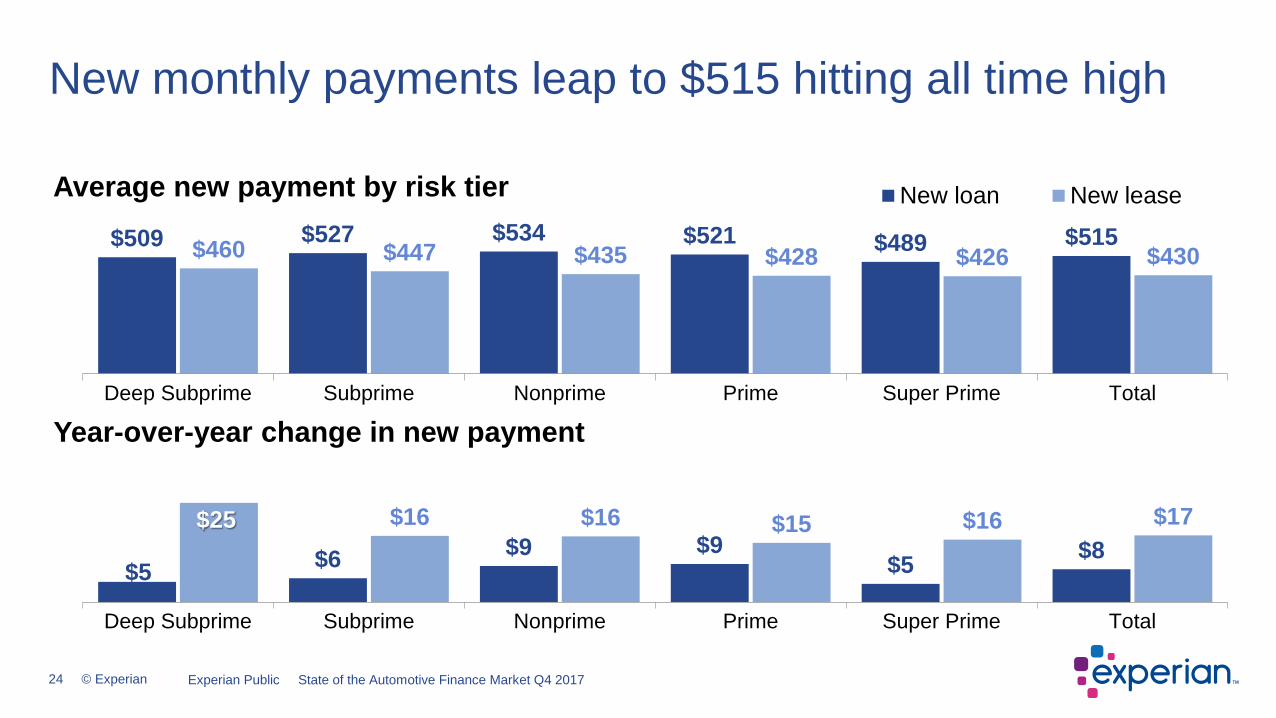
$509 $527 $534 $521 $489 $515$460 $447 $435 $428 $426 $430
Deep Subprime Subprime Nonprime Prime Super Prime Total
Average new payment by risk tier New loan New lease
New monthly payments leap to $515 hitting all time high
$5 $6 $9 $9$5 $8
$25 $16 $16 $15 $16 $17
Deep Subprime Subprime Nonprime Prime Super Prime Total
Year-over-year change in new payment
Experian Public State of the Automotive Finance Market Q4 2017
25 © Experian
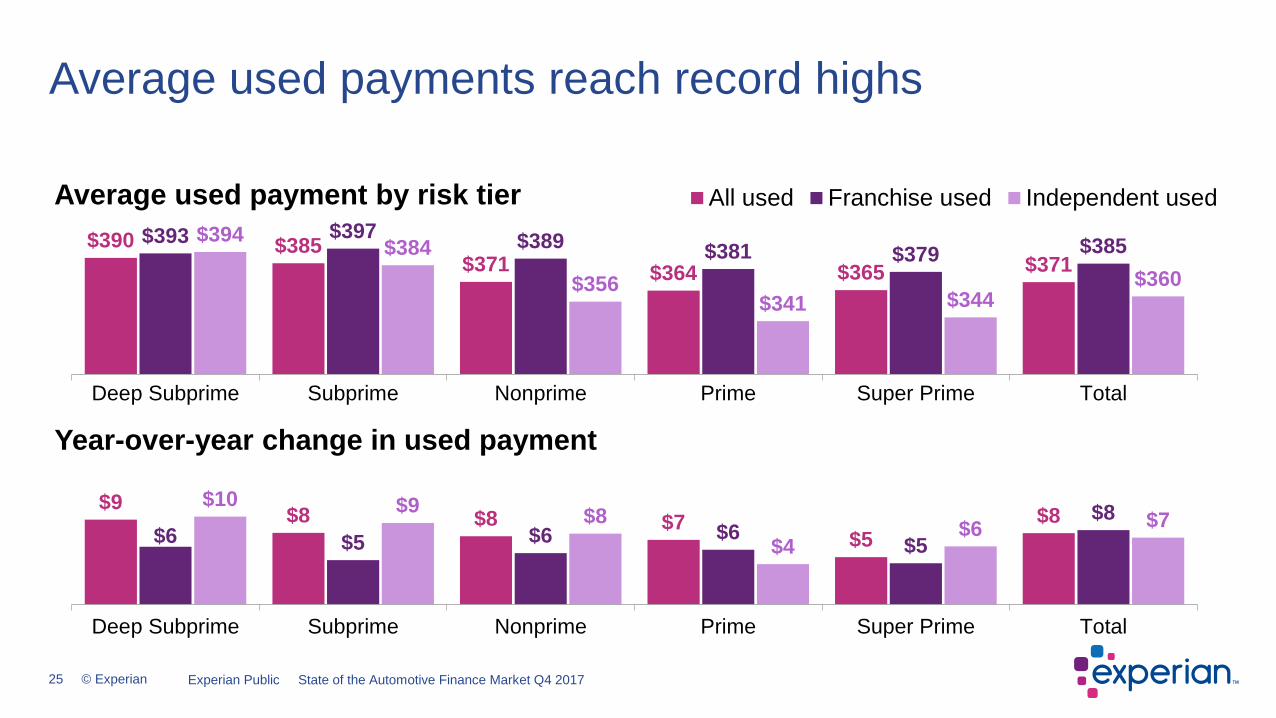
$390 $385$371 $364 $365 $371
$393 $397 $389 $381 $379 $385$394 $384$356
$341 $344$360
Deep Subprime Subprime Nonprime Prime Super Prime Total
Average used payment by risk tier All used Franchise used Independent used
Average used payments reach record highs
$9 $8 $8 $7$5
$8$6 $5 $6 $6 $5
$8$10 $9 $8$4
$6 $7
Deep Subprime Subprime Nonprime Prime Super Prime Total
Year-over-year change in used payment
Experian Public State of the Automotive Finance Market Q4 2017

26 © Experian
Rates rise across the entire automotive loan market13
.76%
10.9
8% 6.79
%
4.03
%
3.17
%
5.11
%
19.3
2%
16.2
7% 10.0
1%
5.48
%
3.80
% 8.84
%
18.1
0%
14.8
4% 9.24
%
5.28
%
3.76
% 7.68
%
20.2
8%
18.0
2% 11.8
3%
6.14
%
3.90
% 11.4
8%
Deep Subprime Subprime Nonprime Prime Super Prime Total
Average loan rates by tier Avg New All Used Franchise used Independent used
1728 36 43
543729
58 5239 41
3048
6646 40 41
1811
4257
37 46
11
Deep Subprime Subprime Nonprime Prime Super Prime Total
Year-over-year change (bps) in loan rate
Experian Public State of the Automotive Finance Market Q4 2017
27 © Experian
• Outstanding loan balances continue to set record highs
• Delinquency rates beginning to improve
• Leasing remains strong with over 28% of all new consumer vehicle sales
• Credit scores improve as lending continues to shift into more prime segments
• Deep subprime reaches record lows in used lending
• Loan amounts and payments reach record highs for both new and used vehicle financing
• While longer term loan remain the norm, there’s a decrease in 72-84 month loans in both new and used financing; while new sees slight growth in 85+
Summary
Experian Public State of the Automotive Finance Market Q4 2017