state of the vitiviniculture world market april 2018 · 3 1. viticultural production potential the...
TRANSCRIPT

1
STATE OF THE VITIVINICULTURE WORLD MARKET
April 2018

2
Table of contents
1. VITICULTURAL PRODUCTION POTENTIAL 3
2. WINE PRODUCTION 5
3. WINE CONSUMPTION 7
4. INTERNATIONAL TRADE 9
Abbreviations: kha: thousands of hectares mha: millions of hectares khl: thousands of hectolitres mhl: millions of hectolitres bn: billion m: million EUR: euros

3
1. Viticultural production potential
The 2017 total world area under vines (corresponding to the total surface area planted with vines, including that not yet in production or not yet harvested) is estimated to be almost equivalent to that of 2016 (-22,000 ha), reaching 7.6 mha.
7.0
7.2
7.4
7.6
7.8
8.0
8.2
mha Development of the world area under vines
1.1 The areas under vines in European vineyards Since the end of the European Union programme (2011/2012 harvest) to regulate viticultural production potential in the EU1, the rate of decline of EU vineyards has significantly slowed. It is estimated that EU vineyards cover 3.3 mha2, a reduction of 5.6 kha compared with 2016. The implementation of the new system regarding the management of viticultural production potential3, including the possibility of annual growth being limited to 1% of the planted vineyards per Member State, and the management methods for old rights held in portfolios, have led – within this context of regulatory transition – to contrasting developments for the area under vines in different EU countries. 1 Regulation (EC) No. 479/2008 of 29 April 2008 on the common organisation of the market in wine. 2 Area under vines destined for the production of wine grapes, table grapes or dried grapes, in production or awaiting production. 3 Regulation (EU) No. 1308/2013 introduced, as of 1 January 2016, a new tool for the management of viticultural production potential at
the European level, based on a system of planting authorisations that replaces the old planting-rights system.

4
The latest available data shows a trend towards the stabilisation of the overall area under vines in France (787 kha), Romania (191 kha) and Germany (102 kha), and more recently in Greece. In contrast, vineyards in Spain (967 kha) are estimated to have decreased by about 8 kha between 2016 and 2017, while those in Italy (695 kha) are estimated to have grown by 5 kha.
1.2 Outside Europe
Vineyards outside Europe appear to have remained stable between 2016 and 2017, reaching an estimated 3.6 mha. This apparent stability is the result of contrasting developments.
In Asia, the expansion of Chinese vineyards (870 kha) slowed after 10 years of strong growth, while Turkey (448 kha) saw its vineyards decline at a sustained pace, falling by 19.7 kha between 2016 and 2017. And so it seems that after having been the main centre of global vineyard growth, Asia is now experiencing a moderate decline in its area under vines.
North and South America did not record any significant variations in the size of their vineyard surface
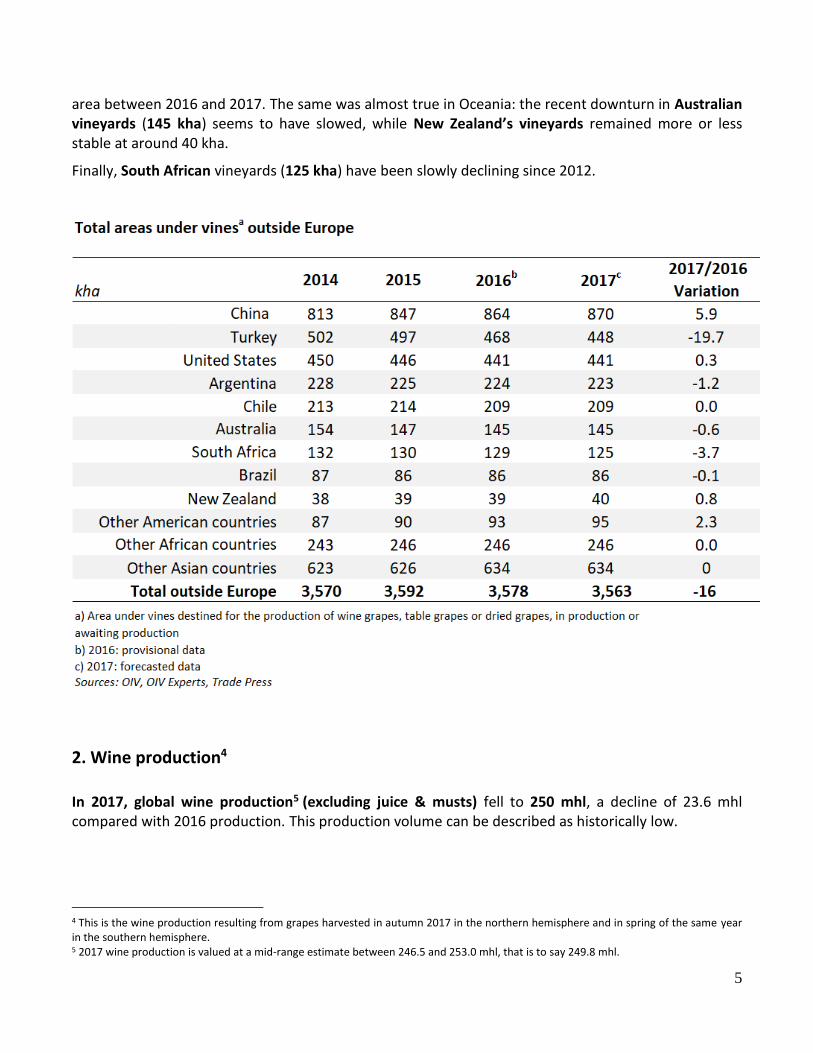
5
area between 2016 and 2017. The same was almost true in Oceania: the recent downturn in Australian vineyards (145 kha) seems to have slowed, while New Zealand’s vineyards remained more or less stable at around 40 kha.
Finally, South African vineyards (125 kha) have been slowly declining since 2012.
2. Wine production4
In 2017, global wine production5 (excluding juice & musts) fell to 250 mhl, a decline of 23.6 mhl compared with 2016 production. This production volume can be described as historically low.
4 This is the wine production resulting from grapes harvested in autumn 2017 in the northern hemisphere and in spring of the same year in the southern hemisphere. 5 2017 wine production is valued at a mid-range estimate between 246.5 and 253.0 mhl, that is to say 249.8 mhl.

6
265257
264
298
278 283
268 269 273264 268
258
290
269 275 273
250
180
200
220
240
260
280
300
320
2001 2002 2003 2004 2005 2006 2007 2008 2009 2010 2011 2012 2013 2014 2015 2016 Prov.
2017 Forecast
mhlWorld wine production
(excluding juice & musts)
2.1 Within the European Union 2017 EU vinified production is estimated at 141 mhl, a 14.6% drop compared with 2016. This situation is the result of adverse weather conditions in the main wine-producing countries in Europe. This production figure is 4.5% lower still than the very low volumes produced in 2012 (147 mhl). When compared with 2016, production in Italy (42.5 mhl), France (36.7 mhl), Spain (32.1 mhl) and Germany (7.7 mhl) declined by 17%, 19%, 20% and 15% respectively. Moderate production in 2017 in Portugal, Romania and Austria was still an increase relative to the modest levels of 2016. 2.2 Outside the European Union
There were contrasting developments in these regions:
Estimated at 23.3 mhl excluding juice and musts, 2017 wine production in the United States remained very high (almost as high as that of 2016, estimated at 23.6 mhl, and of 2013 at 24.4 mhl).
After the significant impact of El Niño on 2016 production, wine production in South America has evolved differently in different countries. Wine production in Argentina, at 11.8 mhl, grew in relation to the low levels of 2016, but failed to return to production levels generally achieved at the start of the decade. Following the catastrophic 2016 production, in 2017 it was more than a return to normal for Brazilian production (3.4 mhl), which rose to the same level as for the productive harvest of 2011. However, 2017 production in Chile declined once more after the low levels of 2016, reaching only 9.5 mhl.
South African production excluding juice and musts reached 10.8 mhl in 2017.

7
At 13.7 mhl, Australian wine production continued to grow in volume to return to levels from around 2005, in the context of a vineyard area that remains virtually unchanged. New Zealand’s production reached 2.9 mhl, close to the 2012–2016 five-year average (2.6 mhl).
3. Wine consumption

8
World wine consumption in 2017 is estimated at 2436 mhl, an increase of 1.8 mhl compared with 2016.
228230
237 237 239243
250 250244 244 243 244 243
240 241 242 243
200
210
220
230
240
250
260
270
2001 2002 2003 2004 2005 2006 2007 2008 2009 2010 2011 2012 2013 2014 2015 2016 Prov.
2017 Forecast
mhlWorld wine consumption
The United States, with consumption estimated at 32.6 mhl, confirmed its position as the top global consumer since 2011, and saw domestic demand grow compared with the previous year (+2.9%/2016). There was a break in the declining consumption of traditional producer and consumer countries in Europe. There was a very moderate decrease in France to 27 mhl, and increases in Italy to 22.6 mhl, in Spain to 10.3 mhl and in Germany to 20.2 mhl. In 2017, the United Kingdom returned to its 2015 level of 12.7 mhl, after a slight increase in consumption in 2016. As regards China, 2017 consumption – determined using production, import and export data7 – is estimated at 18 mhl, a positive variation of 3.5% compared with 2016. In Oceania, overall consumption in the Australian and New Zealand markets stabilised in 2017, as a result of a slight decline in New Zealand’s consumption (0.9 mhl) offset by continued growth in Australian consumption to 5.8 mhl. South African consumption rose again between 2016 and 2017 to reach 4.5 mhl. In South America, 2017 domestic consumption was lower than in 2016, especially in Argentina (8.9 mhl: -5%/2016) and in Chile (2.2 mhl: -10%/2016). In Brazil, however, 2017 consumption rose to reach 2015 levels close to 3.3 mhl. In Hungary and Romania, domestic consumption increased between 2016 and 2017, although it is difficult to monitor self-consumption.
6 Using the same analysis method as for wine production, the 2017 world wine consumption level is estimated to be between 240.2 mhl and 246.4 mhl, which corresponds to a mid-range estimate of 243.3 mhl. 7 The development in consumption between year n-1 and year n is considered here to be half determined by the apparent consumption for the current year (calculated by "Production + Imports - Exports") and half by the consumption for the previous year.

9
4. International trade
In 2017, the global market – considered here as the total exports of all countries – is estimated at

10
107.9 mhl in terms of volume (an increase of 3.4% compared with 2016), and 30.4bn EUR in terms of value8 (a rise of 4.8% compared with 2016). Exports in terms of volume:
Spain remained the biggest exporter with 22.1 mhl and a global market share of 20.5%.
Exports from New Zealand, Chile, Portugal, France, Italy and South Africa all increased by more than 3% in relation to 2016.
There was a marked decline in exports for Argentina, the United States and Spain.
Exports in terms of value:
World total: 30.4bn EUR.
Rise of +4.8%/2016 (29.0bn EUR), with substantial increases in Australia, France, Spain, Italy, Portugal and New Zealand. The most significant decreases relate to the United States, Argentina and South Africa.
France was the biggest world exporter in terms of value, with 9.0bn EUR of exports in 2017. In the medium term, these developments correspond to an expansion of the world market, in terms of both volume and value.
Development of the world wine trade
In terms of product type, the main trends in the world market were as follows:
In the international wine trade in terms of volume, the share of bottled still wine sales is estimated to have increased from 54% to 57% between 2016 and 2017. This development is a departure from the trend observed over several years; between 2000 and 2016, the bottled export share fell from 65% to 54%. In 2017, the bottled (< 2L) export share by volume was very
8 Based on the tracking of 83 countries via the GTA (Global Trade Atlas).

11
high in Germany, Portugal, Argentina and France. In terms of export value, bottled wine represented 72% of the total value of wine exported in 2017.
Sparkling wines (8.6 mhl exported in 2017) once again saw the biggest growth, both in terms of volume and total value (+11.2% and +8.9%/2016 respectively). In terms of volume, a significant share of Italy and France’s wine exports relate to sparkling wine (18% and 13% respectively). Sparkling wine exports are also on the increase in Spain and South Africa. By value, sparkling wines account for 19% of the global market (although they only represent 8% of the total volume exported).
The volume of bulk wine exports fell sharply in 2017 compared with 2016. The 2017 bulk export share in terms of volume continues to be significant in Spain, South Africa, Chile, Australia and the United States. By volume, bulk exports fell sharply in Germany, Argentina and Portugal, but rose in New Zealand. In 2017, bulk wines (or wines in containers of 2 litres or more) accounted for 8% of the total value of wine exports, while they represented 35% of the global market in terms of volume.
4.1 Main exporters
An analysis by country shows that the wine trade was largely dominated by Spain, Italy and France, which together accounted for 54.6% (58.9 mhl) of global market volumes in 2017, and 58.2% (17.7bn EUR) of exports in terms of value9.
In terms of volume, there was an increase in exports from Italy and France, largely to the detriment of Spain. Similar to last year, Chile and New Zealand recorded relatively significant increases, as did Australia between 2016 and 2017. In 2017, their respective global market shares reached 9%, 2% and 7%. Argentina and the United States recorded the most significant decreases in relative terms (respectively -14.0% and -13.5%/2016), followed by Spain (-9.7%).
9 Based on the tracking of 83 countries via the GTA (Global Trade Atlas).

12
In terms of value, Italy and France continued to dominate the market with shares of 29.6% and 19.3% respectively.
Despite the high volume of Spanish exports, the significant share of bulk wines (55% in 2017 in terms of volume but 20% in terms of overall value) resulted in a lower overall weighted average price for its total exports than that which was observed in Italy and France (whose respective bulk shares are 26% and 12% in terms of volume and 6% and 2% in terms of value). As a consequence, Spain accounts for only 9.3% of the world trade value (but 20.5 % of the volume, as mentioned above).
Main wine exporters (excluding juice and musts)
2016 2017 2016 2017
Sources: OIV, GTA
Volume (mhl) Value (m EUR)
Spain 24.4 22.1 2,649 2,814
Italy 20.6 21.4 5,582 5,873
France 14.4 15.4 8,263 8,989
9.1 9.8 1,668 1,741 Chile
Australia 7.5 8.0 1,543 1,727
Argentina 2.6 2.2 739 713
United States 3.8 3.3 1,415 1,280
Portugal 2.8 3.0 723 752
New Zealand 2.1 2.5 1,017 1,054
South Africa 4.3 4.5 602 583
Germany 3.8 3.8 936 926
4.2 The main importers
The five main importing countries – Germany, the United Kingdom, the United States, France and China – that typically represent more than half of all imports imported a total of 55.3 mhl at a value of 14.4bn EUR in 2017.

13
The top importer by volume in 2017 is still Germany, which recorded a slight decrease in its imports (-0.1%/2016). The trend towards importing entry-level wines resumed, with a decrease in the value of imports (-1.6%/2016).
The United Kingdom remains the second biggest global importer by volume, with 13.2 mhl, and by value, with 3.5bn EUR (-1.3%/2016), bearing in mind that it is difficult to know what the long-term consequences of Brexit on the wine industry might be.
After a very significant increase in the value of its imports in 2015, followed by a pause in growth in 2016, the United States saw its imports pick up again in 2017, in terms of volume and value (+5.7%/2016 in volume, +3.6%/2016 in value). As a consequence, it consolidates its position as top importer by value (5.2bn EUR in 2017), while by volume it still occupies third place, after Germany and the United Kingdom, with 11.8 mhl of imports.

14
In 2017, France once again saw a high import volume with 7.6 mhl (+0.4%/2016). This is a sign of its structural deficit in relation to entry-level wines, and the situation was exacerbated at the end of the year when indicators pointed to an exceptionally low production. This context of strained supply along with increased starting prices pushed up the overall value of French imports (+9.6/2016).
China saw another significant rise in its imports in terms of volume (+17%/2016: 7.5 mhl in 2017). The share of bottled wine imports (+15%/2016) helped China hold on to fourth position by value (2.46bn EUR in 2017; +14.7%/2016) and close in on Germany (2.47bn EUR). Domestic demand in China was still the biggest contributory factor, in terms of volume, to global trade growth in 2017.
In Russia, following the embargo and the economic difficulties it caused, the sharp reduction in the volume and in the value of imports noted in the two previous years seems to have come to a halt for the second consecutive year: there was an increase in terms of volume (+10.4%/2016) and also 32.6% (878m EUR) growth in terms of value in 2017.
It is also worth noting the significant increase in imports to the Netherlands; compared with 2016, they went up by 10.9% in terms of volume and 16.2% in terms of value.