state of world vitiviniculture situation
TRANSCRIPT

O.I.V.2014
State of World Vitiviniculture situation
37th World Congress of Vine and Wine
Mendoza, 10th November 2014
Jean-Marie AURAND
Director General
1

O.I.V.2014
State of the vitiviniculture world market
Surface area
Grape o Global grape production o Grape for fresh consumption o Dried Grape
Wine o Production: 2014 first estimation o Consumption of wine o Wine trade
The Sparkling wine market
2

O.I.V.2014
Surface area of vineyards
O.I.V.2014
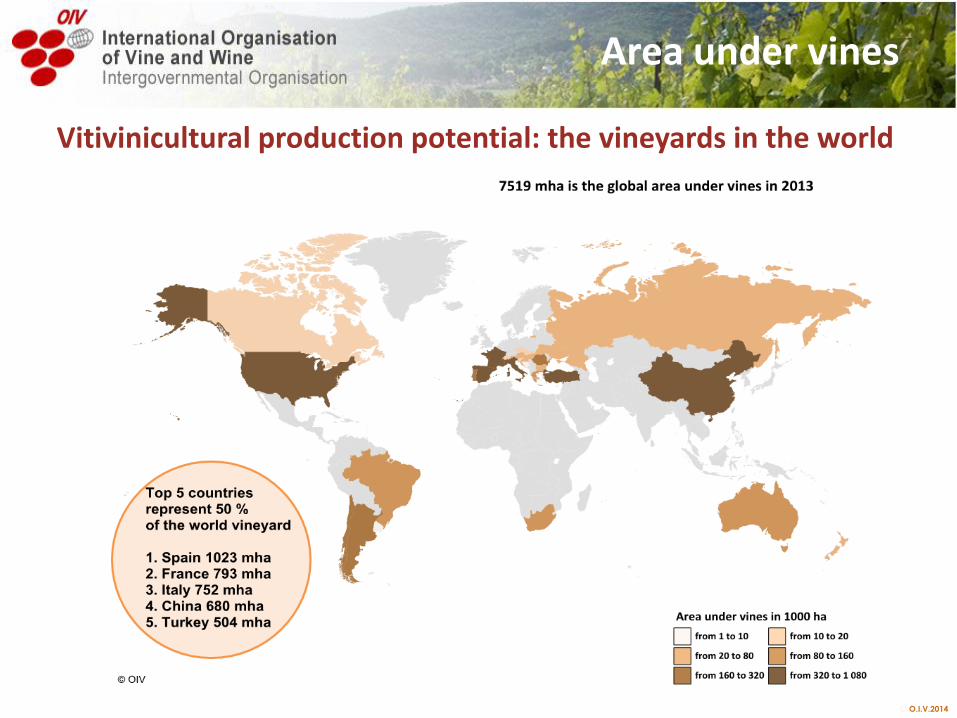
Vitivinicultural production potential: the vineyards in the world
Area under vines

O.I.V.2014
Surface area of vineyards worldwide
Source: OIV
7 300
7 500
7 700
7 900
8 100
8 300
1000 ha in 2013 the total worldwide area under
vines represents 7519 mha
Area under vines
The total area under vines : the world’s total vineyard surface area, is decreasing mainly due to the reduction of European vineyards. This reduction has been partially offset by the increase in the planted surface areas in the rest of the world:
Europe’s share of the world’ vineyards has declined from about 62% of the total in 2000 to 55% in 2013. the share of all other regions is increasing, in particular in Asia, which now accounts for 24% of the world’s vineyards.
62.5%
55%
19.4%
24%
12%14%
4.3%5%
2.0% 3%
2000 2013
Evolution share of global vineyard in %2000-2013
Europe
OceaniaAfrica
America
Asia

O.I.V.2014
Recent developments of the leading vineyards
0
200
400
600
800
1000
1200
1400
1000 ha Area under vine from 2000 to 2013
2000 2013Spain 15.7% 13.6%
France 11.6% 10.5%
Italy 11.6% 10.0%
China 3.8% 9.0%
Turkey 7.3% 6.7%
USA 5.2% 5.4%
% world total
Since 2000 area under vine has fallen considerably: Spain (-17% ), France (-13%), Italy (-17%) While vineyards and plantations are reducing in Turkey (-12%) and Iran (-23%), they are increasing in China (+127%) and India (+177%), while New Zealand (+179%) and Australia have remained more or less stable in the USA and in South Africa.
Area under vines
O.I.V.2014
Grape
Global grape production
– Grape for fresh consumption
– Dried Grapes

O.I.V.2014
Global grape production

O.I.V.2014
Global grape production
In 2013 the world production of grapes (751 Mql) increased by 8% compared to 2012. While the area under vine decrease, grape production has been increasing since 2000 (+17%) : this partly due to an increase in yields.
Grape
200
400
600
800
1 000
2000 2002 2004 2006 2008 2010 2012
MqlWorld grapes production52.9%
40.9%
20.3%
29.8%
20%21%
5.0%5.8%
2.1% 2.9%
2000 2013
Continental evolution as % of global production
2000-2013
Europe
OceaniaAfrica
America
Asia

O.I.V.2014
Major grapes producers: all use
Grape
0
20 000
40 000
60 000
80 000
100 000
120 000
140 000
China Italy USA France Spain Turkey Chile India Argentina Iran
1000 ql Trends, 2000-2013
-100% 0% 100% 200% 300%
France
Iran
Argentina
Italy
Turkey
Chile
World production
USA
Spain
India
China
% change 2000-13
With 115 Mql, China produces 15% of the world grapes, followed by Italy (79 Mql, 10% of the world production) and USA (about 75 Mql, 10% of the world production). Growth in grapes production is particularly significant in China, India and Chile.

O.I.V.2014
Grapes for fresh consumption

O.I.V.2014
Fresh grapes production
Production reachead 249 Mql in 2013: a remarkable increase compared to 2010 (+21%)
Asia is by far the largest producer, accounting for 62% of the world’s production
0
50
100
150
200
250
300
350
2000 2001 2002 2003 2004 2005 2006 2007 2008 2009 2010 2011 2012 2013
Mql World fresh grape production

O.I.V.2014
The world human consumption of fresh grapes reached about 241 Mql in 2013: the highest level reported since 2000.
Fresh grapes consumption
0
50
100
150
200
250
300
2000 2001 2002 2003 2004 2005 2006 2007 2008 2009 2010 2011 2012 2013
Mql Human consumption of fresh grapes
60% of fresh grapes are consumed in 5 countries.
Asia is first grape consumer, China alone accounting for the 36% of the world consumption
0
20
40
60
80
100
China India Turkey Iran Egypt
Mql Major consumers

O.I.V.2014
Dried grapes

O.I.V.2014
65% of world production is exported
Dried grapes
Who produce? Who consume?
1000 ql
USA 2 268 18%
Turkey 1 419 12%
UK 1117 9%
Germany 700 6%
Netherlands 435 4%
Australia 324 3%
Japon 304 2%
Iran 293 2%
Canada 264 2%
Brazil 234 2%
Greece 230 2%
France 229 2%
Italy 206 2%
Iraq 183 1%
China 165 1%
Consumption 2013 % world
consumption
1000 ql
USA 3715 29%
Turkey 3559 31%
Iran 1600 12%
Chile 1230 6%
South Africa 460 4%
India 336 0%
Greece 267 4%
Argentina 252 2%
Uzbekistan 170 4%
Australia 100 1%
% world
production
Production 2013
O.I.V.2014
Wine Production of wine
• World production • Major producers
Consumption of wine
• World consumption • Major consumers
Wine trade • World wine trade: value & volume • Top world Exporters • Top world Importers

O.I.V.2014
Wine production
• 2014 first estimation
• Trends in production

O.I.V.2014
Trends in world wine production
World wine production
The global wine production, excluding juice and musts, is likely to reach 271 millions hectolitres in 2014 – a decrease of 6% compared to 2013
271 Mhl
100
150
200
250
300
350
400
Mhl
World wine production(excluding juice & musts)

O.I.V.2014
2014 wine production in the 10 main producing countries
Wine production

O.I.V.2014
Table 1: Wine production (excluding juice and musts) (1)
1000 hl 2010 2011 2012
2013
Provisional
2014
Forecast
2014/2013
Variation in
volume
2014/2013
Variation
in %
Ranking
France 44 381 50 757 41 548 42 004 46 151 4147 10% 1Italy 48 525 42 772 45 616 52 429 44 424 -8005 -15% 2Spain 35 353 33 397 31 123 45 650 37 000 -8650 -19% 3United States (2) 20 890 19 140 21 740 23 500 22 500 -1000 -4% 4Argentina 16 250 15 473 11 780 14 984 15 200 216 1% 5Australia 11 420 11 180 12 260 12 310 12 560 250 2% 6China (3) 13000 13200 13810 11780 11780 0 0% 7South Africa 9 327 9 725 10 568 10 980 11 420 440 4% 8Chile 8844 10464 12554 12 846 10 029 -2817 -22% 9Germany 6 906 9 132 9 012 8 409 9 725 1316 16% 10Portugal 7 148 5 622 6 327 6 238 5886 -352 -6% 11Romania 3 287 4 058 3 311 5 113 4 093 -1020 -20% 12New Zealand 1 900 2 350 1 940 2 480 3 200 720 29% 13Greece 2 950 2 750 3 115 3 343 2 900 -443 -13% 14Brazil 2 459 3 460 2 967 2 710 2810 100 4% 15Hungary 1 762 2 750 1 776 2 666 2 734 68 3% 16Austria 1 737 2 814 2 125 2 392 2 250 -142 -6% 17Bulgaria 1 224 1 237 1 442 1 755 1 229 -526 -30% 18Switzerland 1 030 1 120 1 000 840 900 60 7% 19Croatia 1 433 1 409 1 293 1 249 874 -375 -30% 20
OIV World Total(4) 264 372 267 243 256 222 287 600 270 864 -16736 -6%
(1): Countries for which information has been provided with a wine production of more than 1 mhl
(3): Report for the year 2013, 2014 figures not yet available (2): OIV estimate (USDA basis)
(4) Range used for 2014 world production: 266.2 mhl to 275.5 mhl
Wine production
O.I.V.2014
How is the 2014 wine production compared with the last 15 years?

O.I.V.2014
Countries with a decreasing trend
In 2014, compared to the last 15 years’ trend:
France, Spain and Germany’s production seem to recover and reverse the decreasing
trend
Italy and Romania confirmed the decrease or stagnation of their production
Trends in wine production
0
10
20
30
40
50
60
France Italy Spain Germany Portugal Romania
Mhl2014 & trends in productions
00-04
05-09
10-14
Forecast 2014

O.I.V.2014
0
5
10
15
20
25
USA Argentina Australia China South Africa
Chile New Zealand
Brazil
Mhl2014 & trends in production
00-04
05-09
10-14
Forecast 2014
Countries with an increasing trend
*Report for the year 2013, 2014 figures not yet available
*
In 2014, compared to the last 15 years’ trend:
almost all countries confirm their increase in vine production
Trends in wine production
O.I.V.2014
Consumption’s trend • World consumption • Major consumers

O.I.V.2014
200
210
220
230
240
250
260
270
280
MhlWorld wine consumption
Wine consumption forecast
At this time of the year, no reliable information is available on the level of consumption in the different markets for 2014. The data available show a consolidation of the global consumption, at around 243 Mhl.
Moving towards consolidation of consumption
25

O.I.V.2014
0
5 000
10 000
15 000
20 000
25 000
30 000
35 000
40 000
USA France Italy Germany China United Kingdom
Russian Federation
Argentina Spain Australia
1000 hlTrends, 2000-2013
Major wine consumers
Wine consumption seems to be decreasing in the traditional wine countries of southern Europe
New consumers have entered the scene, due to increasing incomes and changes in eating habits
26

O.I.V.2014
The increased global in trade over the past 20 years has resulted in a shift in the wine consumption patterns. The 2000-2013 period has been characterized by a transfer of the wine consumption : today about 39% of the wine is consumed outside European countries, compared to 31% in 2000.
Shift in wine consumption geography
Wine consumption
27
Africa 3%
America20%
Asia 6%Europa
69%
Oceania2%2000
Africa3%
America23%
Asia10%
Europa 61%
Oceania 3%2013
O.I.V.2014
*in collaboration with the Spanish Observatory of Wine Markets (OeMv)
Wine trade*
• World wine trade: value & volume
• Top world Exporters
• Top world Importers
NOTE: data for world trade are taken from GTA, which, in turn, take them from official administration bodies in more than 80 countries of the world. Not all countries are, therefore, included.

O.I.V.2014
2.28 2.31 2.14 2.22 2.15 2.16 2.17 2.22 2.31 2.09 2.25 2.34 2.532.62
60 6170 69
73 7681
90 87 8593
100 100 9814 14
15 15 1616
18
20 20
18
21
23
25 26
2000 2001 2002 2003 2004 2005 2006 2007 2008 2009 2010 2011 2012 2013
Bill €
Mhl
World wine exports in Euros and Litres€/l
Mhl.
Bill €
In 2013 the trade in wine decreased by 2.2% in volume, representing
98 million of hl, even though the growing prices allowed an increase in
total revenues of 1.5% up to 25.7 billion Euros.
World wine Export

O.I.V.2014
In the 2000-2013 period, the composition of exports significantly changed : the share of bottled wines reduced by 2.5 points in value and 6 points in volume, while bulk wines increased.
By type of product
32%28% 30%
34% 35% 32% 35% 36% 36% 36% 37% 38% 37% 38%
5%5%
5%6% 5%
5%5% 6% 6% 6% 6%
6% 6% 7%
63%67% 65%
61% 60% 62% 60% 58% 58% 58% 57% 55% 56% 55%
0
10
20
30
40
50
60
0%
10%
20%
30%
40%
50%
60%
70%
80%
90%
100%
2000 2001 2002 2003 2004 2005 2006 2007 2008 2009 2010 2011 2012 2013
Mhl
By type of wine in volume terms Bulk &> 2l Sparkling Bottled Bulk &> 2l Sparkling Bottled
30

O.I.V.2014
Top world Exporters
31

O.I.V.2014
Since the beginning of the Century, all the top 10 exporters increased their value.
France remains clearly the leader. After the 2009 world crisis in wine consumption, Italy
and to a lesser extent Spain, performed particularly well in the last 4 years ; Chile also
increased its value.
Top 10 world exporters of wine
32
6.9
3.7
2.01.4
0.9 0.8 0.70.4 0.6 0.4 0.5
7.8
5.0
2.5
1.3 1.41.0 1.2
0.8 0.7 0.7 0.6
0
1
2
3
4
5
6
7
8
9
France Italy Spain Australia Chile Germany United States
New Zealand
Portugal Argentina South Africa
Billion of Euro Trends exports in value : 2008 to 2013

O.I.V.2014
In volume, Italy and Spain are the leaders, although suffering from a low crop in 2012 in the
Northern Hemisphere. In 2013, Chile overpassed Australia, and South Africa took advantage
of lower inventories in the North.
Top 10 world exporters of wine
33
13.8
18.116.9
7.0
5.9
3.74.6
1.0
3.04.3 4.4
14.6
20.3
17.7
7.1
8.8
4.0 4.1
1.83.1 3.2
5.6
0
5
10
15
20
25
France Italy Spain Australia Chile Germany United
States
New
Zealand
Portugal Argentina South
Africa
Mhl
Trends exports in volume: 2008 to 2013
O.I.V.2014
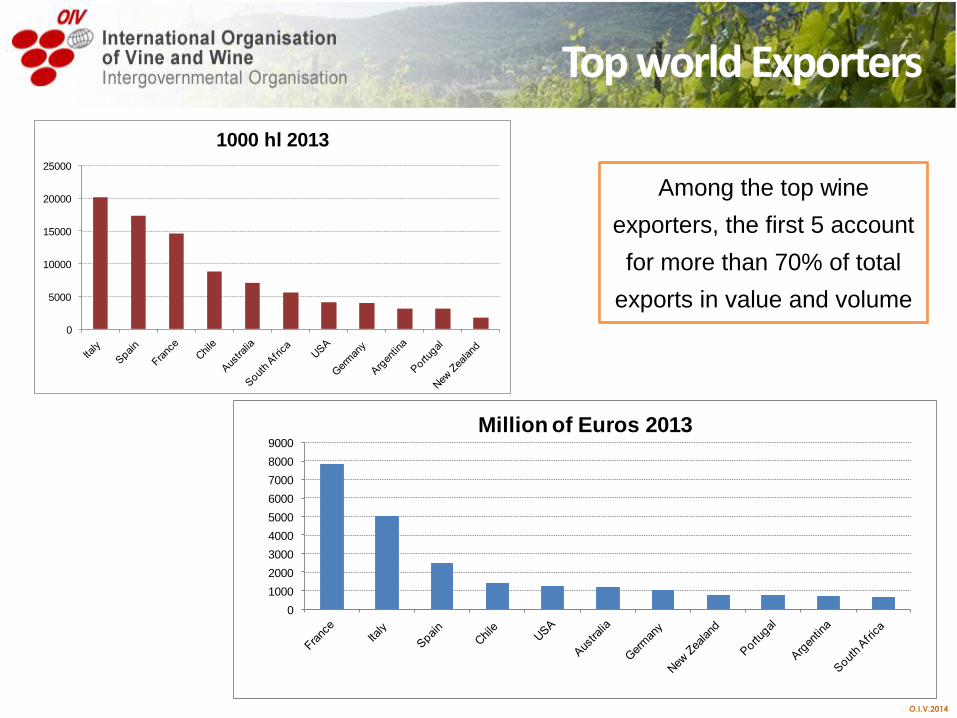
Top world Exporters
Among the top wine
exporters, the first 5 account
for more than 70% of total
exports in value and volume 0
5000
10000
15000
20000
25000
1000 hl 2013
0
1000
2000
3000
4000
5000
6000
7000
8000
9000
Million of Euros 2013

O.I.V.2014
Top world Exporters
Chile, South Africa and New Zealand registered the biggest increase, both in volume
and value.
USA decreased in volume, but increased in value
All the major European countries have been stable in level of wine traded but
increased in value.
-50%
-30%
-10%
10%
30%
50%
70%
90%F
ran
ce
Ita
ly
Sp
ain
Au
str
alia
Ch
ile
Ge
rma
ny
Un
ite
d S
tate
s
Ne
w Z
ea
lan
d
Po
rtu
ga
l
Arg
en
tin
a
So
uth
Afr
ica
Fra
nce
Ita
ly
Sp
ain
Au
str
alia
Ch
ile
Ge
rma
ny
US
A
Ne
w Z
ea
lan
d
Po
rtu
ga
l
Arg
en
tin
a
So
uth
Afr
ica
Volume Value
Evolution 2008-13 in %
O.I.V.2014
Top world Importers
36

O.I.V.2014
6 countries import for more than 1 billion euros of wine each : USA overpassed UK as top world
importer, Germany and Canada grows slowly, and China reached Japan’s level although declining in
2013.
Top 6 world Importers of wine
3.2
3.6
2.2
1.10.9
0.3
3.93.7
2.6
1.5
1.2 1.2
0
1
1
2
2
3
3
4
4
5
USA UK Germany Canada Japan China
Billion Euro Trends imports in value: 2008 to 2013

O.I.V.2014
In terms of volume, France and Russia are among the top 6 Importers, while Germany, UK and the USA
import above 10 million Hl of wine.
38
14.1
12.7
8.3
5.8 5.8
1.6
15.4
13.1
11.7
5.94.9
3.9
0
2
4
6
8
10
12
14
16
18
Germany UK USA France Russia China
Mhl Trends imports in volume: 2008 to 2013
Top 6 world Importers of wine
O.I.V.2014
Top world Importers
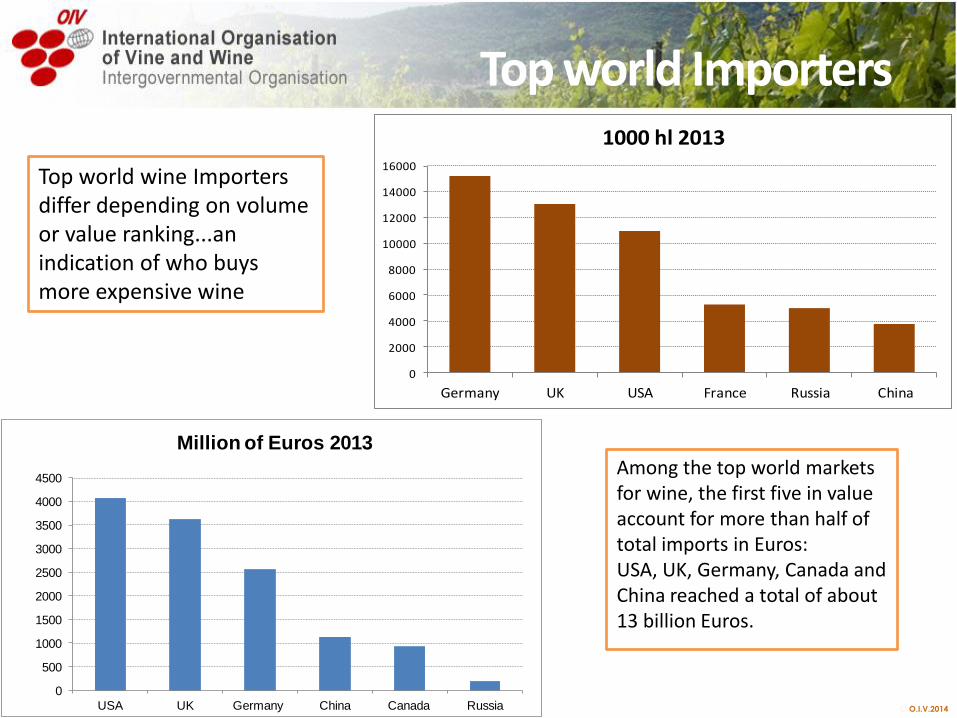
Among the top world markets for wine, the first five in value account for more than half of total imports in Euros: USA, UK, Germany, Canada and China reached a total of about 13 billion Euros.
Top world wine Importers differ depending on volume or value ranking...an indication of who buys more expensive wine
0
500
1000
1500
2000
2500
3000
3500
4000
4500
USA UK Germany China Canada Russia
Million of Euros 2013
0
2000
4000
6000
8000
10000
12000
14000
16000
Germany UK USA France Russia China
1000 hl 2013
O.I.V.2014
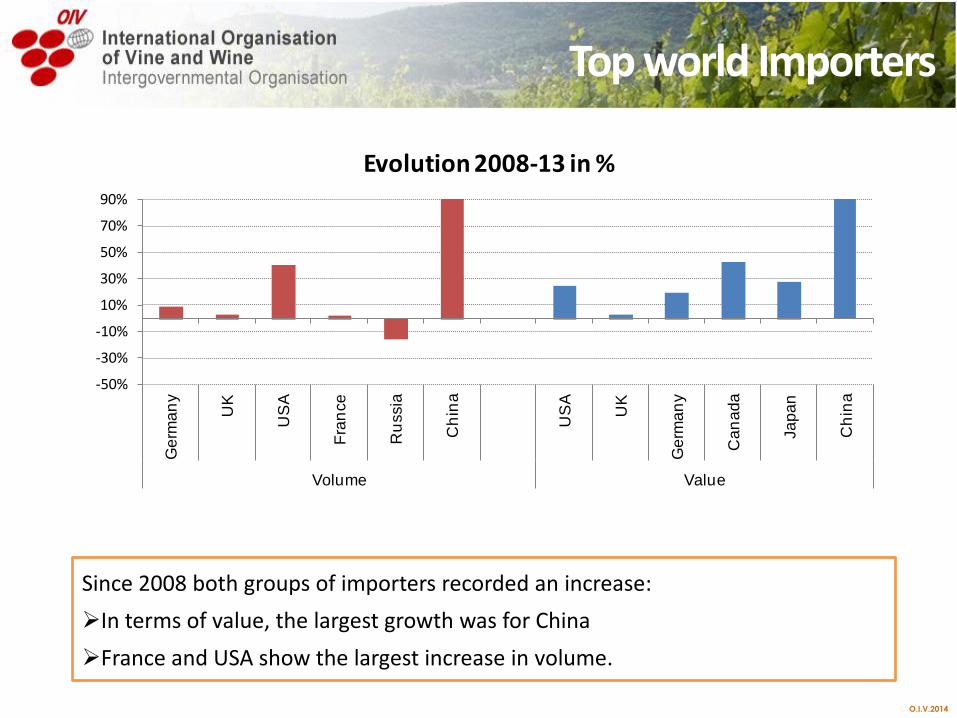
Top world Importers
Since 2008 both groups of importers recorded an increase:
In terms of value, the largest growth was for China
France and USA show the largest increase in volume.
-50%
-30%
-10%
10%
30%
50%
70%
90%
Ge
rma
ny
UK
US
A
Fra
nce
Ru
ssia
Ch
ina
US
A
UK
Ge
rma
ny
Ca
na
da
Ja
pa
n
Ch
ina
Volume Value
Evolution 2008-13 in %

O.I.V.2014
The Sparkling wine Market …has expanded in recent years, boosted by
high global demand
41

O.I.V.2014
Production
42
Production has increased significantly: + 40% in 10 years
About 18 Mhl of sparkling wine was produced in 2013- accounting for 7% of the world wine production
12,7 Mhl 17,6 Mhl

O.I.V.2014
Consumption
43
The German and French markets remain the largest, with about 3 and 2 Mhl consumed in 2013 A growing interest in these wines outside the EU, particularly in the United States, Australia, Russia and Eastern European countries, whose consumption has significantly increased over the past 10 years.
Sparkling wine consumption by country
0
1
2
3
4
5
Germany France Russia United States Italy United Kingdom
Other countries
Mhl
11,8 Mhl
15,4 Mhl

O.I.V.2014
44
Foreign trade
The sparkling wine trade has increased steadily over the past 10 years
Since 2000, world exports of sparkling wines have more than doubled, with an average growth of 9% per year, from 3.11 Mhl to 8.7 Mhl in 2013 and reaching the 4.3 billion euros in 2013
0
1
2
3
4
5
6
0
2
4
6
8
10
2000 2001 2002 2003 2004 2005 2006 2007 2008 2009 2010 2011 2012 2013
Billions of euros Mhl
Millions of hectolitres Billions of euros

O.I.V.2014
45
Trade flows in value: 2013

O.I.V.2014
Thank you for your attention
Vielen Dank für Ihre Aufmerksamkeit
Grazie per la Loro attenzione
Gracias por su atención
Merci de votre attention