statistical methods in longitudinal studies jouko miettunen, phd department of psychiatry university...
Post on 19-Dec-2015
214 views
TRANSCRIPT

Statistical methods in longitudinal studies
Jouko Miettunen, PhD
Department of Psychiatry
University of Oulu
e-mail: [email protected]
2
Topics of this presentation
Logistic regression analysis Survival analysis Analysis of variance Random regression analysis Structural equation modeling Latent class analysis Imputing missing data

3
Logistic regression analysis (1)
Most common modeling method to analyze confounders in epidemiology, especially in longitudinal studies
Outcome variable should be dichotomized (no/yes, healthy/sick)
Exposure variables can be both dichotomized or continuous

4
Variables in logistic regression
Include sociodemographic variables, e.g. sex, social class
Include previous known risk factors Especially if statistically significant in
the model Do not include too many variables
Depends on data size and distribution of variables
Do not include intercorrelating variables

5
Example data set
Northern Finland 1966 Birth Cohort
Women who were living in the provinces of Oulu and Lapland and were due to deliver during 1966
N = 12,058 live births N = 10,934 living 1997 in Finland Data on biological, socio-economic and health
conditions collected prospectively from pregnancy up to the age of 35 years
Data from several registers and e.g. from large follow-ups at 14 and 31 years
6
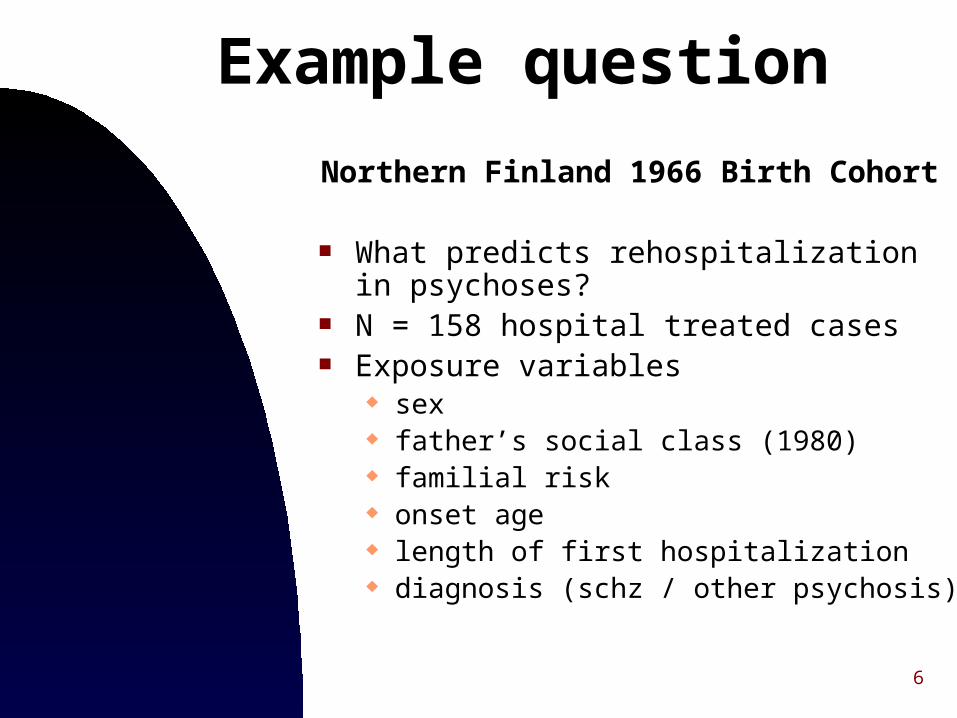
Example question
Northern Finland 1966 Birth Cohort
What predicts rehospitalization in psychoses? N = 158 hospital treated cases Exposure variables
sex father’s social class (1980) familial risk onset age length of first hospitalization diagnosis (schz / other psychosis)

7
SPSS Output (1)
Categorical Variables Codings
48 ,000 ,000
96 1,000 ,000
14 ,000 1,000
133 ,000
25 1,000
93 1,000
65 ,000
108 1,000
50 ,000
94 1,000
64 ,000
I,II
III,IV
V
Fathers social class 1980
no
yes
Parent has psychotic dg 1972-2000
male
female
Sex
schizophrenia
other psych
Diagnosis
< 1 month
> 1 month
Length of first hospitalization
Frequency (1) (2)
Parameter coding

8
SPSS Output (2)
Variables in the Equation
1,048 ,375 7,805 1 ,005 2,852 1,367 5,948
-,559 ,366 2,331 1 ,127 ,572 ,279 1,172
-,047 ,043 1,199 1 ,274 ,954 ,876 1,038
,839 ,385 4,740 1 ,029 2,314 1,087 4,926
,651 2 ,722
,309 ,392 ,622 1 ,430 1,362 ,632 2,934
,109 ,647 ,028 1 ,866 1,115 ,314 3,960
,612 ,513 1,423 1 ,233 1,845 ,675 5,045
,488 1,100 ,197 1 ,657 1,629
Length of 1st hospital.(1)Sex(1)
Onset age
Diagnosis(1)
FSC 1980
FSC 1980(1)
FSC 1980(2)
Parental psych(1)
Constant
B S.E. Wald df Sig. Exp(B) Lower Upper
95,0% C.I.for EXP(B)

9
Survival analysis (1) Examines time between two events, e.g.
from birth to illness onset from illness onset to death from end of treatment to
rehospitalization
Kaplan-Meier model estimates probability of events in each time point

10
Survival analysis (2)
Required information Event (0,1) Time to event (days, months,…) or to
censoring Data is censored due to
End of follow-up time Loss of contact Or e.g. other dead than that of interest

11
Example questionNorthern Finland 1966 Birth Cohort
What predicts age of suicide? People alive and living in Finland at 16 years (N=10,934) Data till end of 2001
58 (0.5%) suicides 140 (1.3%) other deaths 10,736 (98.2%) alive
Predictor variable: family type at birth (full, single)

12log rank test, p=0.002
Test Statistics for Equality of Survival Distributions
Survival Functions
age (years)
3530252015
Cum
Sur
viva
l
1,000
,999
,998
,997
,996
,995
,994
,993
,992
,991
,990
,989
family type 1966
full
full-censored
single
single-censored
SPSS Output (1)

13
Survival analysis (3) Difference or trend in difference
between groups should be about the same across time, at least curves shouldn’t cross (if statistically tested)
Can be done also with small samples Curve can be presented as survival or
as hazard function
References, e.g. Parmar & Machin: Survival analysis. A practical approach. John Wiley & Sons, 1995.

14
SPSS Output (2)Hazard Function
age (years)
3530252015
Cum
Haz
ard
,012
,010
,008
,006
,004
,002
0,000
family type 1966
full
full-censored
single
single-censored

15
Example question (2)
Age of suicide and family type Possible confounding variables
sex social class 1966 (I-II,III-IV,V) average school mark at 14 psychiatric diagnosis (no, yes) crime (no, violent, non-violent)
Cox regression analysis

16
Cox regression analysis
SPSS Output (3)
Categorical Variable Codings
5425 1
5222 0
10197 0
450 1
783 0 0
7823 1 0
2041 0 1
1975 1
8672 0
10019 0 0
200 1 0
428 0 1
1=male
2=female
Sex
0=healthy
1=any dg
Psych dg
1=I,II
2=III,IV
3=V
Fathers SocialClass 1966
1=single
2=full
Family type1966
0=no crimes
1=violent
2=nonviolent
Criminality
Frequency (1) (2)
17
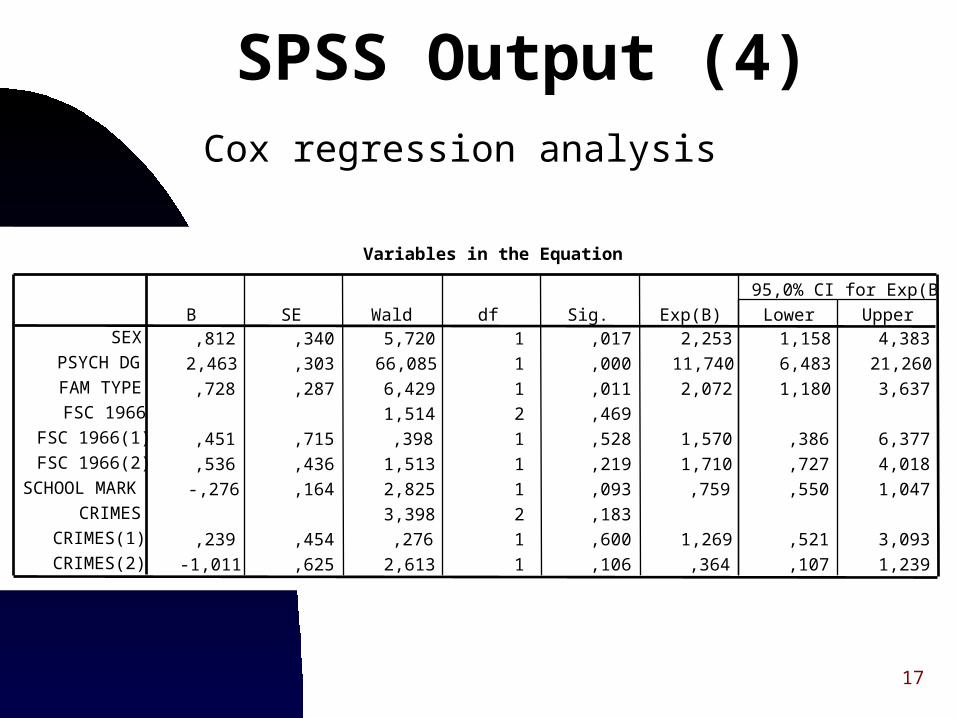
Cox regression analysis
SPSS Output (4)
Variables in the Equation
,812 ,340 5,720 1 ,017 2,253 1,158 4,383
2,463 ,303 66,085 1 ,000 11,740 6,483 21,260
,728 ,287 6,429 1 ,011 2,072 1,180 3,637
1,514 2 ,469
,451 ,715 ,398 1 ,528 1,570 ,386 6,377
,536 ,436 1,513 1 ,219 1,710 ,727 4,018
-,276 ,164 2,825 1 ,093 ,759 ,550 1,047
3,398 2 ,183
,239 ,454 ,276 1 ,600 1,269 ,521 3,093
-1,011 ,625 2,613 1 ,106 ,364 ,107 1,239
SEX
PSYCH DG
FAM TYPE
FSC 1966
FSC 1966(1)
FSC 1966(2)
SCHOOL MARK
CRIMES
CRIMES(1)
CRIMES(2)
B SE Wald df Sig. Exp(B) Lower Upper
95,0% CI for Exp(B)

18
Analysis of variance
ANOVA One continuous outcome (dependent) variable
MANOVA Several continuous outcome variables
Repeated measurements ANOVA Same measurements are made several times on
each subject ANOVA, MANOVA and rANOVA
Only categorical predictors ANCOVA, MANCOVA, rANCOVA
Also continuous predictors
19
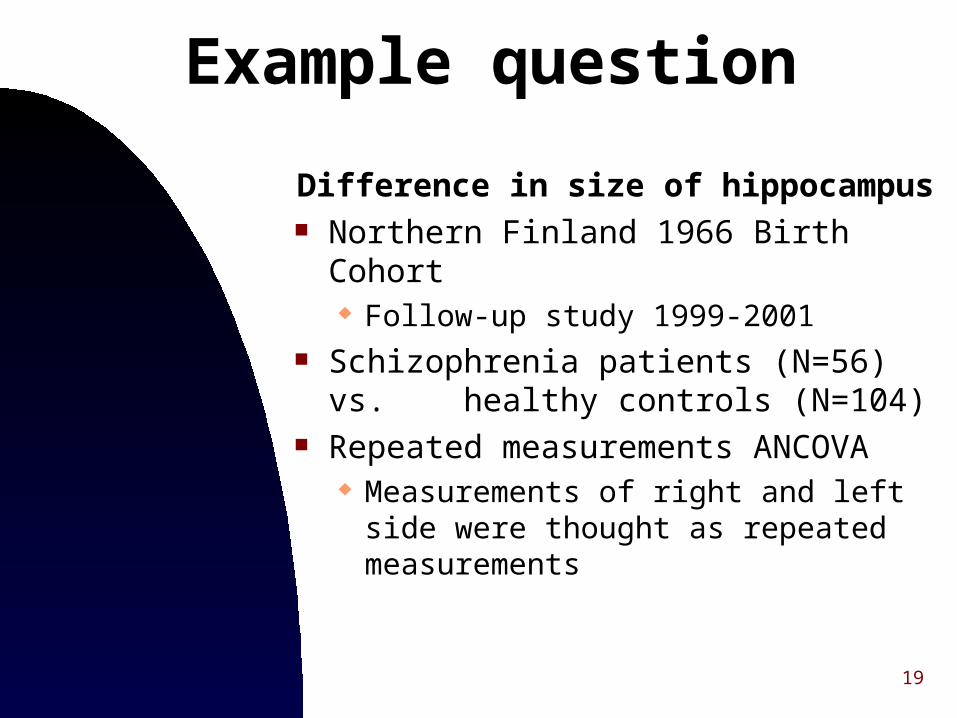
Example question
Difference in size of hippocampus Northern Finland 1966 Birth Cohort
Follow-up study 1999-2001 Schizophrenia patients (N=56) vs.
healthy controls (N=104) Repeated measurements ANCOVA
Measurements of right and left side were thought as repeated measurements

20
Example tableSchizophrenia and Comparison subjectsHippocampus volumes
F Sig.
Model 1Within effect: side 20.3 < 0.001Diagnosis 1.2 0.28Gender 6.5 0.01Model 2Within effect: side 0.81 0.37Covariate: brain vol. 35.0 < 0.001Diagnosis < 0.01 0.89Gender 0.7 0.41Familial psychosis 1.9 0.17Perinatal risk 0.8 0.38Handedness 0.3 0.61
Tanskanen et al. Schizophrenia Research (in press)

21
Random regression analysis Random regression analysis = Random-effects (multilevel) models = …
Allow presence of missing data Allow time-varying covariates Allow subjects measured at different
timepoints Takes into account several levels of
subjects (multilevel analysis)

22
Random regression analysis Available software
SAS Proc Mixed Stata (GLLAMM) Specific multilevel modeling software
MLWin• http://multilevel.ioe.ac.uk/index.html
HLM• http://www.ssicentral.com/hlm/hlm.htm
23
Random regression analysis References
Goldstein et al. Tutorial in biostatistics. Multilevel modelling of medical data. Stat Med, 21, 3291-315, 2002.
Hedeker & Mermelstein. Application of random-effects regression models in relapse research, Addiction, 91, S211-30, 1996.
Sharma et al. A longitudinal study of plasma cortisol and depressive symptomatology by random regression analysis. Biol Psychiatry 31, 304-14, 1992.
Tilling et al. A new method for predicting recovery after stroke. Stroke 32, 2867-73, 2001.
Homepage of Don Hedeker: http://tigger.uic.edu/~hedeker/
Homepage of Sophia Rabe-Hesketh (GLLAMM) http://www.gllamm.org/sophia.html

24
Structural Equation Modeling
Combination of factor analysis and regression
Continuous and discrete predictors and outcomes
Relationships among measured or latent variables
25
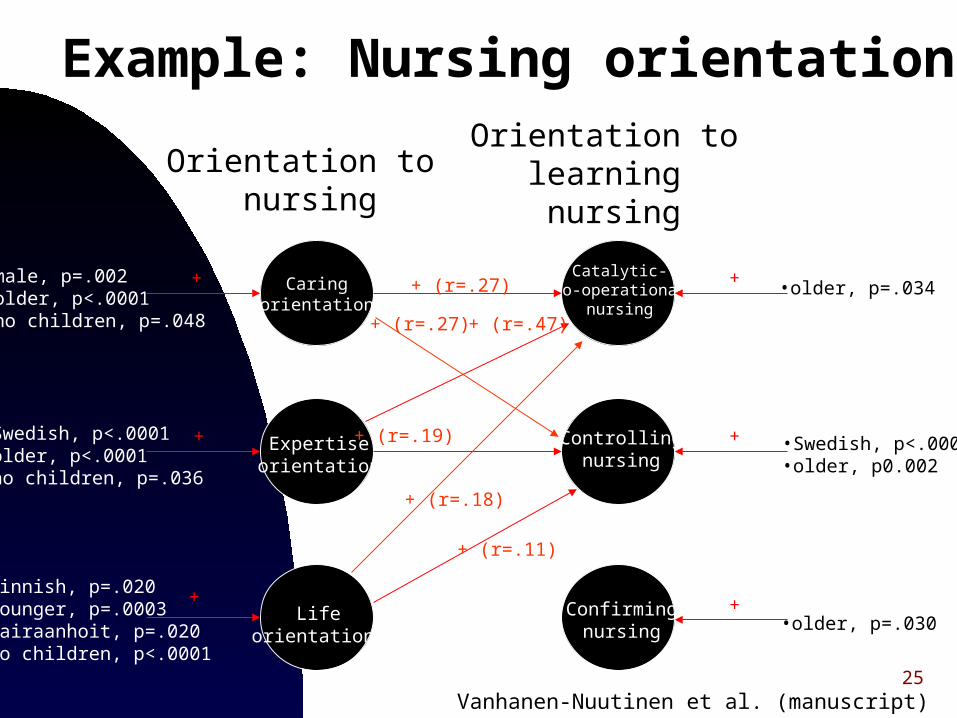
Caringorientation
Expertiseorientation
Lifeorientation
Catalytic-co-operational
nursing
Controllingnursing
Confirmingnursing
•male, p=.002•older, p<.0001•no children, p=.048
•Swedish, p<.0001•older, p<.0001•no children, p=.036
•Finnish, p=.020•younger, p=.0003•sairaanhoit, p=.020•no children, p<.0001
•older, p=.034
•Swedish, p<.0001•older, p0.002
•older, p=.030
+ (r=.64)
+ (r=.11)
+ (r=.27)
+ (r=.27)
+ (r=.47)
+
+
+
+
+
+
+ (r=.22)
+ (r=.44)
+ (r=.18)
+ (r=.19)
Orientation to nursing
Orientation to learning nursing
Example: Nursing orientation
Vanhanen-Nuutinen et al. (manuscript)

26
Structural Equation Modeling
References Bentler & Stein. Structural equation models in
medical research. Stat Methods Med Res 1: 159–181, 1992.
Bollen. Structural equations with latent variables. John Wiley & Sons, Inc, New York, 1989.
Finch & West. The investigation of personality structure: statistical models. J Res Pers 31: 439–485, 1997.
MacCallum & Austin. Applications of structural equation modeling in psychological research. Annu Rev Psychol 51: 201–226, 2000.

27
Latent class analysis
Specific statistical method developed to group subjects according to selected characteristics
Classifies subjects to groups Identifies characteristics that indicate
groups
28
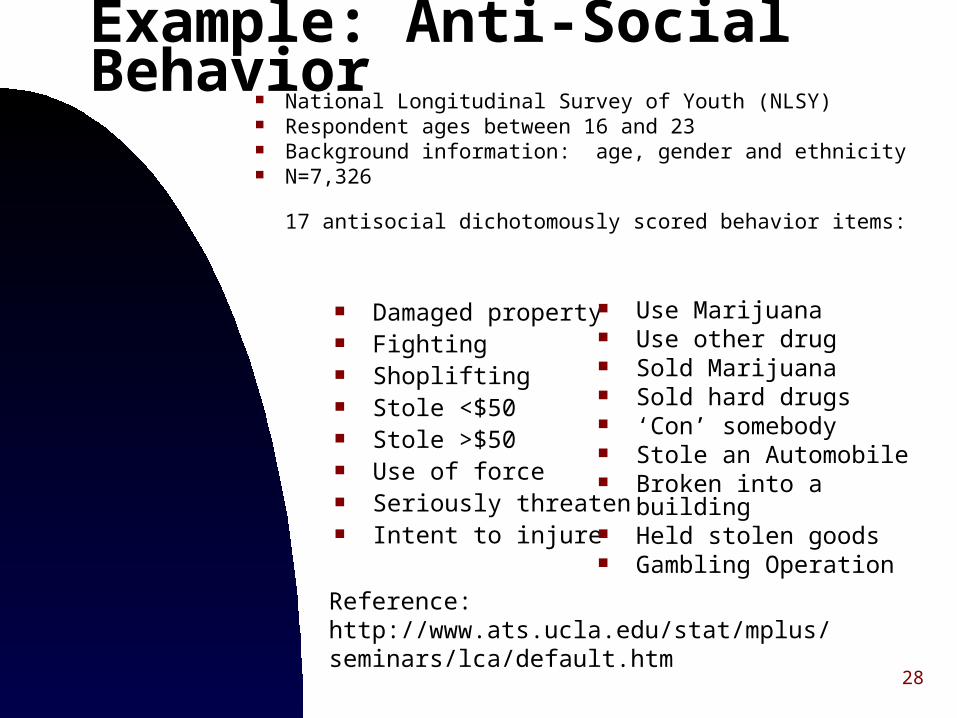
Example: Anti-Social Behavior
Damaged property Fighting Shoplifting Stole <$50 Stole >$50 Use of force Seriously threaten Intent to injure
Use Marijuana Use other drug Sold Marijuana Sold hard drugs ‘Con’ somebody Stole an Automobile Broken into a building Held stolen goods Gambling Operation
National Longitudinal Survey of Youth (NLSY) Respondent ages between 16 and 23 Background information: age, gender and ethnicity N=7,326
17 antisocial dichotomously scored behavior items:
Reference:http://www.ats.ucla.edu/stat/mplus/seminars/lca/default.htm

29
Example: Anti-Social Behavior
Damage Property
Fighting Shoplifting Stole <$50 Gambling. . .
Male
Race
Age
C

30
Example: Anti-Social Behavior probabilities
31
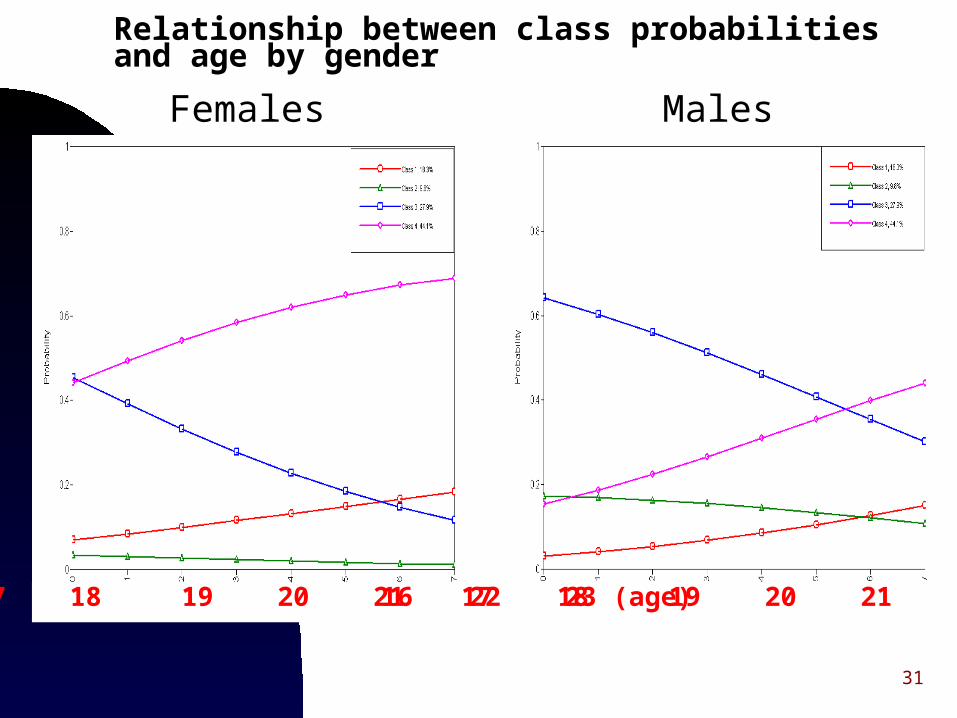
Relationship between class probabilities and age by gender
Females Males
16 17 18 19 20 21 22 23 (age) 16 17 18 19 20 21 22 23

32
Summary of four classes: Property Offense Class (9.8%) Substance Involvement Class (18.3%) Person Offenses Class (27.9%) Normative Class (44.1%)
Classification Table:
1 2 3 4
1 0.854 0.031 0.070 0.040
2 0.041 0.917 0.040 0
3 0.058 0.021 0.820 0.100
4 0.038 0 0.080 0.880
Example: Anti-Social Behavior
Rows:Average latent class probability for most likely latent class membership
Columns: Latent class

33
Latent class analysis
References Muthén & Muthén. Integrating person-centered
and variable-centered analyses: Growth mixture modeling with latent trajectory classes. Alcohol Clin Exp Res, 24, 882-91, 2000.
http://www.ats.ucla.edu/stat/mplus/seminars/lca/default.htm
More references and examples Homepage of Mplus software:
www.statmodel.com

34
Missing data Major problem in longitudinal studies Usually data is not missing at random One “solution”
Compare included and excluded cases Not very good! Smaller sample size give less power
(change to get low p-values)

35
Imputing single missing data With mean of sample (or subsample)
Gives less variability to data
Nearest neighbour imputation Gives less variability to data
Use regression techniques to predict missing data
Mean of variables of same subject measuring
appr. same thing e.g. in psychological scales
Now “missing value analysis” also in SPSS
36
Multiple imputation Requires special software
SAS/STAT (PROC MI & PROC MIANALYZE) S-PLUS (MICE) SOLAS for Missing Data Analysis 3.0
References Kmetic et al. Multiple imputation to account for
missing data in a survey: estimating the prevalence of osteoporosis. Epidemiology, 13, 437-44, 2002.
McCleary. Using multiple imputation for analysis of incomplete data in clinical research. Nurs Res, 51, 339-43, 2002.
Streiner. The case of the missing data: methods of dealing with dropouts and other research vagaries. Can J Psychiatry, 47, 68-75, 2002.

37
General references in Finnish
Metsämuuronen. Tutkimuksen tekemisen perusteet ihmistieteissä (2003)
Nummenmaa et al. Tutkimusaineiston analyysi (1997)
Uhari & Nieminen. Epidemiologia & Biostatistiikka (2001)
SPSS, SAS, etc. manuals