status of native freshwater mussels in copper creek, … · status of native freshwater mussels in...
TRANSCRIPT

SOUTHEASTERN NATURALIST2009 8(1):1–18
Status of Native Freshwater Mussels in Copper Creek, Virginia
Shane D. Hanlon1,*, Melissa A. Petty2,3, and Richard J. Neves4
Abstract - Previous freshwater mussel surveys conducted in Copper Creek showed a decline in the fauna from 1980 to 1998. In 2004 and 2005, we sampled 47 sites acquiring relative abundance estimates (measured in catch-per-unit-effort) to assess the current status of the mussel fauna relative to previous surveys. We also obtained absolute density estimates for 4 select sites for comparison with future and past surveys. Of the 25 mussel species reported from this and previous surveys, 16 were represented by living specimens, 5 are extant but may soon be extirpated, and 8 are likely extirpated from the creek. Presence-absence analysis showed a signifi cant decline in species per site since 1980. Absolute density estimates (at Copper Creek river km 3.1) decreased signifi cantly from 4.07 mussels/m2 in 1981 to 0.63 mussels/m2 in 2005. The cause of this faunal decline is likely due to several factors, including, most notably, the loss of riparian buffers. Nearly half of the stream banks in Copper Creek have inadequate riparian vegetation to provide even minimal sediment control. Precipitous declines of the Clinch River fauna (a likely source population for several species) may be another signifi cant factor infl uencing the faunal decline in Copper Creek. Despite these declines, populations of several species may be in a state of recovery. Based on 18 comparable sites, average catch-per-unit-effort in 2005 was 25.16 mussels/hr, signifi cantly higher than the 1998 survey (12.92 mussels/hr).
Introduction
Ahlstedt (1981, 1986) conducted the fi rst comprehensive freshwater mussel survey in Copper Creek in 1980, documenting 19 living species, including 5 federally protected species (Table 1). Like many southwestern Virginia streams, Copper Creek has been severely impacted by sedimen-tation mainly, from stream-side livestock activity, and the elimination of riparian vegetation. As a result, mussels have undergone a dramatic decline in species richness and abundance. A 1998 survey documented only 11 spe-cies, including 2 of the 5 previously reported federally listed species (Fraley and Ahlstedt 2000). Because of the important mussel diversity, low level of development, and lack of mining activity in the Copper Creek watershed, resource manag-ers increasingly recognize the importance of the creek as an area on which
1US Fish and Wildlife Service, Southwestern Virginia Ecological Services Field Offi ce, 330 Cummings Street, Abingdon, VA 24210. 2Department of Fisheries and Wildlife Sciences, Virginia Polytechnic Institute and State University, Blacksburg, VA 24061-0321. 3Current address - Conservation Fisheries, Inc., 3424 Division Street, Knoxville, TN 37919. 4US Geological Survey, Virginia Cooperative Fish and Wildlife Research Unit, Department of Fisheries and Wildlife Sciences, Virginia Polytechnic Institute and State University, Blacksburg, VA 24061-0321. *Corre-sponding author - [email protected].

Southeastern Naturalist Vol. 8, No. 12
to focus aquatic conservation efforts. Initial efforts to augment mussel populations and restore riparian habitat within the watershed are currently underway. A quantitative assessment of the stream’s mussel fauna and habi-tat conditions is needed to identify and prioritize conservation actions and to provide a baseline for detection of future changes in the fauna. We assess the current status of mussel populations in Copper Creek and compare the results with previous mussel surveys to evaluate changes in the fauna over the last 25 years. In addition, we present density estimates of 4 selected sites to provide baseline data for future assessments of the fauna, and we compare data from one of these sites with absolute estimates reported by Barr et al. (1993–1994), survey work that was conducted in 1981. We also conducted an inventory of forested riparian habitat to assess watershed condition and quantify stream-side impacts.
Study Area
Copper Creek is located in the Ridge and Valley physiographic province of southwestern Virginia (Fig. 1). The creek’s confl uence with the Clinch
Table 1. Living specimens recorded (X) for Copper Creek in 1980, 1998, and 2005. Fresh dead (FD), relic specimen (R), and federal protection (*) are indicated.
1980 1998 2005Actinonaias ligamentina Lamarck (Mucket) R Actinonaias pectorosa Conrad (Pheasantshell) X R XAlasmidonta viridis Rafi nesque (Slippershell) X XAmblema plicata plicata Say (Three Ridge) X R RElliptio dilatata Rafi nesque (Spike) X X XEpioblasma brevidens Lea (Cumberland Combshell) REpioblasma capsaeformis Lea (Oyster Mussel)* X Fusconaia barnesiana Lea (Tennessee Pigtoe) X X XFusconaia cor Conrad (Shiny Pigtoe)* X FD XFusconaia cuneolus Lea (Fine-rayed Pigtoe)* X X XFusconaia subrotunda Lea (Long-solid) R Lampsilis fasciola Rafi nesque (Wavy-rayed Lampmussel) X X XLampsilis ovata Say (Pocketbook) X RLasmigona costata Rafi nesque (Fluted-shell) X XLasmigona holstonia Lea (Tennessee Heelsplitter) R FDLigumia recta Lamarck (Black Sandshell) RMedionidus conradicus Lea (Cumberland Moccasinshell) X X XPegius fabula Lea (Little-wing Pearlymussel)* RPleurobema oviforme Conrad (Tennessee Clubshell) X X XPtychobranchus fasciolaris Rafi nesque (Kidneyshell) X XPtychobranchus subtentum Say (Fluted Kidneyshell)* X X XQuadrula cylindrica strigillata Say (Rough Rabbitsfoot)* X R XVillosa iris Lea (Rainbow) X X XVillosa perpurpurea Lea (Purple Bean)* X X XVillosa vanuxemensis Lea (Mountain Creekshell) X X XTotal** 19 11 16**While this study’s (2005) data does not assume fresh dead specimens represent an extant popu-
lation, the total number of extant species for 1998 has been fi gured in a manner consistent with the original sources of the data (Fraley and Ahlsedt 2000) and includes the fresh dead F. cor.

S.D. Hanlon, M.A. Petty, and R. J. Neves2009 3
River is at Clinch River kilometer 340.5, near Speers Ferry, Scott County. The stream is roughly 97 km long and fl ows in a southwesterly direction through Russell and Scott counties, draining the valley between Copper Ridge and Moccasin Ridge, ≈345 km2. Hubbard (2001) showed the entire watershed to be underlain by karst topography, formed on soluble limestone bedrock and characterized by sinkholes, sinking streams, caves, and large springs where water returns to the surface. According to 1996 classifi ed Landsat Thematic Maper imagery, land use within the watershed in 1996 consisted primarily of pasture (40.9%) and highly fragmented forest (57.7%) (USEPA 2002).
Methods
Timed searches We surveyed 47 sites along 93 km of Copper Creek between February 2004 and April 2005 (Fig. 1, Table 2). For simplifi cation, we refer to this study as the 2005 survey. We sampled 29 sites sampled by previous sur-veys (Ahlstedt 1986, Fraley and Ahlstedt 2000) as well as 18 new sites. We determined the distance from the mouth of Copper Creek to each site and numbered sites accordingly in an upstream direction (Table 2, Appendix 1). We conducted timed searches using snorkeling and view-buckets. Sur-vey efforts were timed searches and were expressed as catch-per-unit-effort (CPUE) in person-hours. Catch-per-unit-effort values were calculated as the total number of living mussels observed divided by the total effort in
Figure 1. Sites surveyed for freshwater mussels in 2005 (solid circles) in Copper Creek, Russell and Scott counties, VA.
Southeastern Naturalist Vol. 8, No. 14
hours. A variety of habitats including gravel and cobble riffl es and runs, gravel bars, and shallow pools are favored by species previously collected
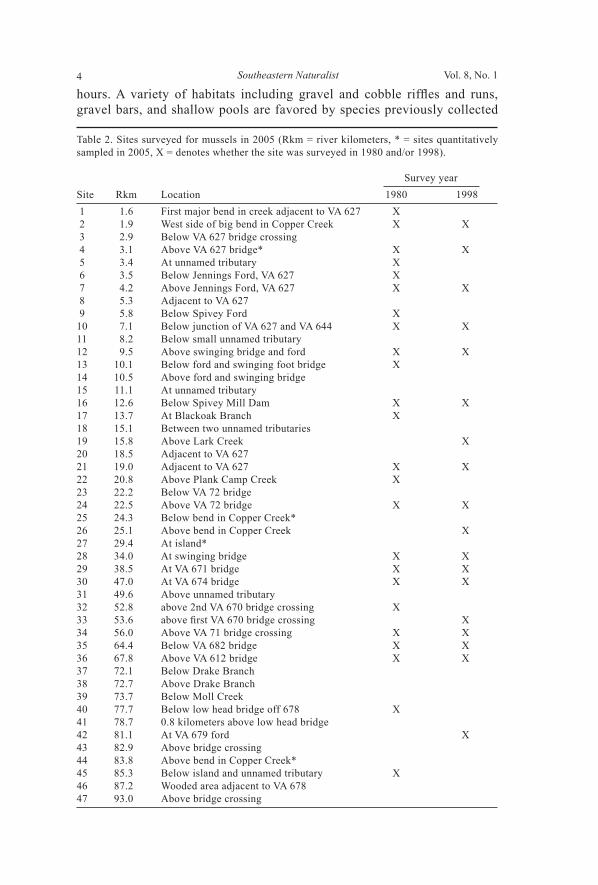
Table 2. Sites surveyed for mussels in 2005 (Rkm = river kilometers, * = sites quantitatively sampled in 2005, X = denotes whether the site was surveyed in 1980 and/or 1998).
Survey yearSite Rkm Location 1980 1998 1 1.6 First major bend in creek adjacent to VA 627 X 2 1.9 West side of big bend in Copper Creek X X 3 2.9 Below VA 627 bridge crossing 4 3.1 Above VA 627 bridge* X X 5 3.4 At unnamed tributary X 6 3.5 Below Jennings Ford, VA 627 X 7 4.2 Above Jennings Ford, VA 627 X X 8 5.3 Adjacent to VA 627 9 5.8 Below Spivey Ford X 10 7.1 Below junction of VA 627 and VA 644 X X11 8.2 Below small unnamed tributary 12 9.5 Above swinging bridge and ford X X13 10.1 Below ford and swinging foot bridge X 14 10.5 Above ford and swinging bridge 15 11.1 At unnamed tributary 16 12.6 Below Spivey Mill Dam X X17 13.7 At Blackoak Branch X 18 15.1 Between two unnamed tributaries 19 15.8 Above Lark Creek X20 18.5 Adjacent to VA 627 21 19.0 Adjacent to VA 627 X X22 20.8 Above Plank Camp Creek X 23 22.2 Below VA 72 bridge 24 22.5 Above VA 72 bridge X X25 24.3 Below bend in Copper Creek* 26 25.1 Above bend in Copper Creek X27 29.4 At island* 28 34.0 At swinging bridge X X29 38.5 At VA 671 bridge X X30 47.0 At VA 674 bridge X X31 49.6 Above unnamed tributary 32 52.8 above 2nd VA 670 bridge crossing X 33 53.6 above fi rst VA 670 bridge crossing X34 56.0 Above VA 71 bridge crossing X X35 64.4 Below VA 682 bridge X X36 67.8 Above VA 612 bridge X X37 72.1 Below Drake Branch 38 72.7 Above Drake Branch 39 73.7 Below Moll Creek 40 77.7 Below low head bridge off 678 X 41 78.7 0.8 kilometers above low head bridge 42 81.1 At VA 679 ford X43 82.9 Above bridge crossing 44 83.8 Above bend in Copper Creek* 45 85.3 Below island and unnamed tributary X 46 87.2 Wooded area adjacent to VA 678 47 93.0 Above bridge crossing

S.D. Hanlon, M.A. Petty, and R. J. Neves2009 5
in Copper Creek (Fraley and Ahlstedt 2000) and were intensively searched. Beyond timed searches, stream margins were checked for shell remains and muskrat middens. Species and number of individuals were recorded to evaluate species richness and relative abundance. Each observed specimen was recorded as living, fresh dead, or relic. The presence of tissue remains, or lustrous nacre were used to defi ne specimens as fresh dead; all other shells were considered relic. Mussels were removed from the substrate, identifi ed, and returned to the exact location of collection. We tested for overall differences across sites in the number of extant spe-cies between 1980 and 2005 and between 1998 and 2005 using a Wilcoxon Signed Rank Test (α = 0.05) (e.g., Pilarczyk et al. 2006). We also tested for differences in overall and per species CPUE across sites between 1998 and 2005 using the Wilcoxon Signed Rank Test (α = 0.05).
Estimation of mussel density We estimated total mussel density (densities of all species combined) at 4 sites (Table 2). We chose sites with the highest mussel abundance and species richness, as identifi ed in timed searches. We used a random ex-perimental sampling design (Strayer and Smith 2003) and followed methods similar to those reported by Henley et al. (1999). Survey fl ags were placed along both stream banks to partition transect lanes across the stream. The number of transects and distance between transects varied among survey sites to accommodate mussel aggregations. Four to six transects were placed 20 m apart except at rkm 24.3, where an additional transect was sampled at 10 m. Ten 0.25-m2 quadrats, made of 12-mm rebar, were randomly assigned along each transect line using a random numbers table. We estimated a req-uisite number of quadrats to sample each site for population density (mean mussels/m2) using the following formula (Downing and Downing 1992): n = 1 x (P / [10,000 / A])-0.5 x D-2,where P = provisional estimate of mussel density (per m2), A = area (cm2) covered by each replicate sample (0.25-m2 quadrat = 2500 cm2), and D = the desired degree of precision of density estimates. Based on provisional densities obtained from 20 initial quadrat samples at each site, we calculated requisite sample numbers based on a 20% degree of precision. Using mask and snorkel gear, we visually searched each quadrat for mussels by fanning and excavated the substrate down to the hardened and embedded layer, typically 10–20 cm in depth. Species, shell length, and es-timated age were recorded for each specimen found. Age was estimated by counting external growth arrests. Shell length was measured using calipers. Mussels and substratum were returned to their original location once data were collected. Density estimates at the site located at rkm 3.1 were compared with those documented by Barr et al. (1993–1994). We note that density estimates for Copper Creek reported in Barr et al. (1993–1994) appear to be densities estimates within 0.25-m2 quadrat units and not per m2 as presented. Density data used in our comparison were obtained from quadrat data presented in the Appendices, Figure A-15, p. 202 of Barr et. al (1993–1994).

Southeastern Naturalist Vol. 8, No. 16
Riparian buffer analysis Fraley and Ahlstedt (2000) identifi ed livestock activity and loss of ripar-ian vegetation as major contributors to the destabilization and siltation of Copper Creek. We conducted an inventory of riparian buffer width on the main stem of Copper Creek to provide a quantitative measure of the extent of this problem. Using ArcGIS (ESRI®ArcMapTM 9.1), we visually exam-ined 2002 aerial imagery (Commonwealth of Virginia 2002) and quantifi ed riparian coverage for left and right ascending stream banks along the main channel, using 4 categories of riparian buffer width. Categories of the buf-fer width are as follows: 1) no riparian vegetation, 2) a single row of trees, 3) wider than a single row of trees up to10 m, and 4) >10 m. These categories were chosen to defi ne the absolute minimum in riparian benefi ts that have been quantifi ed in the literature (Wenger 1999).
Results
Timed searches Sixteen native mussel species were observed alive, and 6 additional spe-cies were represented by relic shells among all sites (Table 1). Overall, 111.5 person-hours of effort resulted in 4106 living mussels collected, with an overall CPUE of 36.8 living mussels/hour. The mussel assemblage was dominated by Villosa iris, representing 71.5% of the fauna. With the exception of the furthest upstream site surveyed, living V. iris were present at all sites. Pleurobema oviforme, Medionidus conradicus, and Fusconaia barnesiana were relatively abundant, composing 12.5%, 7. 9%, and 3.5% of the fauna occurring at 38, 25, and 23 sites, respectively. Lampsilis fasciola, Ptychobranchus subtentum, and Elliptio dilatata were uncommon, representing 0.9%, 1.6%, and 1.2% of the fauna and occurring at 15, 6, and 9 sites, respectively. Of the federally listed species, Villosa perpurpurea was encountered most frequently, occurring at 7 sites and constituting 0.4% of the fauna. The other federally listed species, Fusconaia cuneolus, Fusconaia cor, and Quadrula cylindrica strigillata, were very rare––present only at 3, 1, and 1 sites, respectively. Actinonaias pectorosa, Ptychobranchus fasciolaris, Villosa vanuxemensis, Alasmidonta viridis, Las-migona costata were also rare, occurring at 1–4 sites. Amblema plicata plicata, Epioblasma brevidens, Lampsilis ovata, Lasmigona holstonia, Ligumia recta, and Pegius fabula were represented by relic shells in this survey. The number of extant species decreased from 1980–2005 across 24 com-parable sites (Z = -2.255, P = 0.023; Table 3, Fig. 2). We could not compare CPUE between the 1980 and 2005 surveys because search time was not docu-mented in 1980. Although we found 16 species in 2005 vs. 11 in 1998, there was no signifi cant difference in the number of extant species from 1998–2005 across 18 comparable sites (Z = 1.663, P = 0.100; Table 3). However, total mussel abundance (CPUE) increased from 1998–2005 (Z = 2.847, P = 0.004; Table 3). This increase was attributed to increases in CPUE for 11 out of 14 species including A. pectorosa, E. dilatata, F. cor, L. fasciola, M. conradicus, P. oviforme, P. fasciolaris, P. subtentum, Q. c. strigillata, V. iris, and V. per-purpurea. Among species, only of V. iris had a CPUE that was signifi cantly

S.D. Hanlon, M.A. Petty, and R. J. Neves2009 7
greater in the 2005 survey compared to the 1998 survey (n = 18, Z = -2.46, P = 0.013). No signifi cant changes in abundance were evident among other species between the 1998 and 2005 surveys (P-values ranged from 0.138 to1.000).
Figure 2. Change in the number of freshwater mussel species reported at 24 sites from 1980 (zero line; Ahlstedt 1986) to 2005; * = no change. Site numbers correspond to site identifi cations in the 2005 survey.
Table 3. Comparison of 18 sites surveyed on Copper Creek, VA in 1998 (Fraley and Ahlstedt 2000) and 2005. Site number corresponds to site identifi cations in the 2005 survey. CPUE = catch per unit effort expressed as number of living mussels observed per person hour.
Number of species found alive CPUE (no/h)Site # 1998 2005 Difference 1998 2005 Difference 2 4 7 3 1.25 32.40 31.15 4 2 10 8 1.25 10.43 9.18 7 3 3 0 3.67 3.85 0.1810 5 2 -3 5.00 15.00 10.0012 1 2 1 0.50 9.33 8.8315 0 2 2 0.00 1.52 1.5218 2 3 1 10.50 18.00 7.5020 3 2 -1 3.25 13.33 10.0823 3 6 3 6.25 53.33 47.0825 5 6 1 14.25 30.67 16.4227 2 2 0 5.50 8.00 2.5028 3 5 2 35.50 28.00 -7.5029 3 4 1 21.33 17.20 -4.1332 4 4 0 49.00 50.00 1.0033 5 4 -1 20.25 15.11 -5.1434 3 1 -2 29.00 35.00 6.0035 3 4 1 21.50 67.00 45.5041 2 4 2 4.50 44.67 40.17Mean 2.94 3.94 1.00 12.92 25.16 12.24± SE ± 0.32 ± 0.53 ± 0.56 ± 3.27 ± 4.41 ± 4.04

Southeastern Naturalist Vol. 8, No. 18
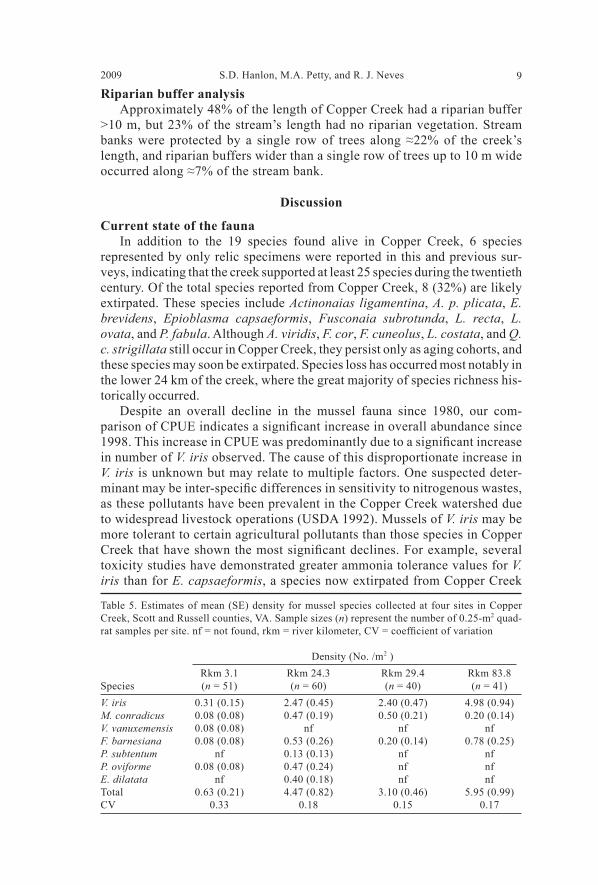
Estimation of mussel density Overall, we observed a wide range of age classes, including young and mature specimens, for 6 species (Table 4). Villosa iris was the most abundant species and was represented by young specimens at all 4 sites. Mussel density was relatively high at the 3 sites located in the middle and upper reaches of Copper Creek, ranging from 3.10–5.95 mussels/m2, but density was low at rkm 3.1 (Table 5). It should be noted that the coeffi cient of variation at the rkm 3.1 sampling site did not meet the 20% precision tar-get. This was attributed to assumption error associated with higher mussel densities in the provisional sample set than the remaining quadrat samples. Among the 51 quadrats we sampled at rkm 3.1, we found 5 species and an overall mussel density of 0.63/m2 (SE ± 0.21/m2). In 1981, Barr et al. (1993–1994) reported 10 species at an overall density of 4.07/m2 (n = 58, SE ± 1.32/m2) at this site. Density estimates among the species found at rkm 3.1 decreased signifi cantly (Z = -2.016, P = 0.007) from 1981 to 2005.
Table 4. Shell length (mm ± SE) and estimated age (years ± SE) of mussels collected within 0.25-m2 quadrats during a quantitative survey in Copper Creek, VA. E.d. = Elliptio dilatata, F.b. = Fusconaia barnesiana, M.c. = Medionidus conradicus, P.o. = Pleurobema oviforme, P.s. = Ptychobranchus subtentum, V.i. = Villosa iris, V.v. = Villosa vanuxemensis, n = number of mussels collected.
Mean length Mean age Species n mm (± SE) Range (mm) years (± SE) Range (years)Overall E.d. 6 51.17 (4.66) 33–61 9.00 (1.15) 5–12 F.b. 18 32.11 (2.98) 10–53 5.72 (0.80) 2–13 M.c. 15 34.07 (1.36) 25–47 6.77 (0.86) 4–14 P.o. 6 44.92 (7.28) 10–61 10.67 (2.36) 2–20 P.s. 3 57.30 (20.0) 18–83 9.00 (3.51) 2–13 V.i. 113 37.69 (0.69) 17–54 5.72 (0.24) 2–18 V.v. 1 47.00 - 10.00 -Rkm 3.1 F.b. 1 51.00 - 13.00 - M.c. 1 39.00 - 10.00 - V.i. 4 37.00 (6.07) 36–48 5.75 (1.38) 3–9 V.v. 1 47.00 - 10.00 -Rkm 24.3 E.d. 6 51.17 (4.66) 33–61 9.00 (1.15) 5–12 F.b. 7 40.57 (3.87) 28–53 7.71(1.13) 5–13 M.c. 6 32.50 (1.89) 25–38 5.33 (0.99) 4–10 P.o. 6 44.92 (7.28) 10–61 10.67 (2.36) 2–20 P.s. 3 57.30 (20.0) 18–83 9.00 (3.51) 2–13 V.i. 35 36.46 (1.02) 17–48 5.50 (0.29) 2–10Rkm 29.4 F.b. 2 14.50 (4.50) 10–19 2.50 (0.50) 2–3 M.c. 5 37.00 (2.77) 30–47 10.00 (2.00) 8–14 V.i. 24 37.67 (1.69) 22–54 7.33 (0.82) 2–18Rkm 83.8 F.b. 8 26.75 (2.44) 19–41 3.88 (0.55) 2–7 M.c. 3 30.67 (1.45) 28–33 5.33 (0.67) 4–6 V.i. 50 38.62 (1.05) 18–54 5.10 (0.21) 2–8
S.D. Hanlon, M.A. Petty, and R. J. Neves2009 9
Riparian buffer analysis Approximately 48% of the length of Copper Creek had a riparian buffer >10 m, but 23% of the stream’s length had no riparian vegetation. Stream banks were protected by a single row of trees along ≈22% of the creek’s length, and riparian buffers wider than a single row of trees up to 10 m wide occurred along ≈7% of the stream bank.
Discussion
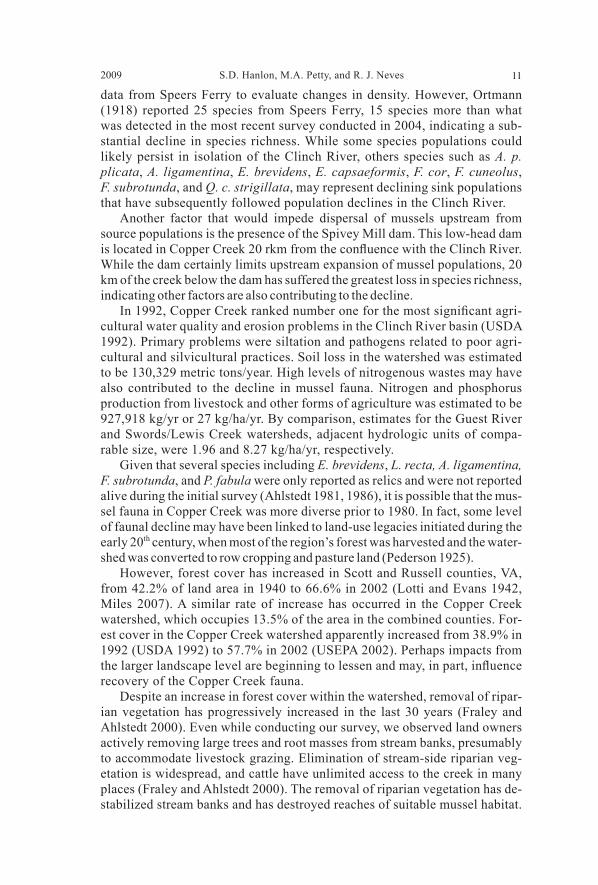
Current state of the fauna In addition to the 19 species found alive in Copper Creek, 6 species represented by only relic specimens were reported in this and previous sur-veys, indicating that the creek supported at least 25 species during the twentieth century. Of the total species reported from Copper Creek, 8 (32%) are likely extirpated. These species include Actinonaias ligamentina, A. p. plicata, E. brevidens, Epioblasma capsaeformis, Fusconaia subrotunda, L. recta, L. ovata, and P. fabula. Although A. viridis, F. cor, F. cuneolus, L. costata, and Q. c. strigillata still occur in Copper Creek, they persist only as aging cohorts, and these species may soon be extirpated. Species loss has occurred most notably in the lower 24 km of the creek, where the great majority of species richness his-torically occurred. Despite an overall decline in the mussel fauna since 1980, our com-parison of CPUE indicates a signifi cant increase in overall abundance since 1998. This increase in CPUE was predominantly due to a signifi cant increase in number of V. iris observed. The cause of this disproportionate increase in V. iris is unknown but may relate to multiple factors. One suspected deter-minant may be inter-specifi c differences in sensitivity to nitrogenous wastes, as these pollutants have been prevalent in the Copper Creek watershed due to widespread livestock operations (USDA 1992). Mussels of V. iris may be more tolerant to certain agricultural pollutants than those species in Copper Creek that have shown the most signifi cant declines. For example, several toxicity studies have demonstrated greater ammonia tolerance values for V. iris than for E. capsaeformis, a species now extirpated from Copper Creek
Table 5. Estimates of mean (SE) density for mussel species collected at four sites in Copper Creek, Scott and Russell counties, VA. Sample sizes (n) represent the number of 0.25-m2 quad-rat samples per site. nf = not found, rkm = river kilometer, CV = coeffi cient of variation
Density (No. /m2 ) Rkm 3.1 Rkm 24.3 Rkm 29.4 Rkm 83.8Species (n = 51) (n = 60) (n = 40) (n = 41)V. iris 0.31 (0.15) 2.47 (0.45) 2.40 (0.47) 4.98 (0.94)M. conradicus 0.08 (0.08) 0.47 (0.19) 0.50 (0.21) 0.20 (0.14)V. vanuxemensis 0.08 (0.08) nf nf nfF. barnesiana 0.08 (0.08) 0.53 (0.26) 0.20 (0.14) 0.78 (0.25)P. subtentum nf 0.13 (0.13) nf nfP. oviforme 0.08 (0.08) 0.47 (0.24) nf nfE. dilatata nf 0.40 (0.18) nf nfTotal 0.63 (0.21) 4.47 (0.82) 3.10 (0.46) 5.95 (0.99)CV 0.33 0.18 0.15 0.17
Southeastern Naturalist Vol. 8, No. 110
(Augspurger et al. 2003; Wang et al. 2007a, b). Similarly, the ammonia sen-sitivity level reported for M. conradicus, a species maintaining population abundance in Copper Creek, is similar to that reported for V. iris (Augspurger et al. 2003). Perhaps other species that have been extirpated or had signifi -cant reductions in abundance in Copper Creek have higher sensitivities to agricultural pollutants such as ammonia. The emerging discipline of eco-toxicology and mussels is still in its infancy (Farris and Van Hassel 2007), but chemical toxicity and the variety of exposure routes for contaminants to affect mussels may help to explain both the chronic and acute decline of populations throughout many river systems. Another factor that may explain the recent increase in V. iris is its pre-de-cline population size. This pattern of persistence was documented in the Little South Fork Cumberland River, where 65% of the mussel fauna was seemingly extirpated due to surface mining and oil extraction (Warren and Haag 2005). If Copper Creek is entering into some state of recovery, then species populations with the highest abundance such as V. iris, F. barnesiana, P. oviforme, and M. conradicus will likely have the highest probability of survival over time. These species are also widespread throughout the mainstem and likely occur in larger tributaries of Copper Creek, enabling greater success in reestablishing popula-tions if losses occur in the mainstem population. Recovery of less widespread species are presumably compromised by their limited distribution, particularly species occupying only the lower mainstem reach of the creek. Although our data show an increase in mussel abundance from 1998 to 2005, statistical analysis did not support a signifi cant increase in the num-ber of species per site. Presence-absence sampling designs typically have a low to moderate statistical power to detect modest and uniform changes (<20–50%) in a population (Strayer 1999). Therefore, a change in the fauna was not discernible. Although we observed 5 additional species that were not reported in the 1998 survey, these species were represented by older speci-mens during our survey and were most likely present, but simply undetected during the 1998 survey. This possibility is logical given the lower level of survey effort conducted in the 1998 survey.
Causes of decline There are likely multiple factors that have contributed to the faunal de-cline in Copper Creek, particularly in the lower reaches of the creek. Exactly when this decline began and what the historic status of fauna in Copper Creek was prior to 1980 is clouded by lack of data. Declining populations in the lower reaches of Copper Creek may be “sink” populations and may depend on the Clinch River “source” popula-tions; the lower reaches of the creek may merely represent a habitat interface between species adapted to smaller and larger streams. Lower Copper Creek may represent marginal habitat for much of the declining fauna, especially for those species that were never reported in any abundance in Copper Creek. Although data collected on overall mussel densities at Speers Ferry have been relatively consistent since 1979, the composition of the fauna has changed (Ahlstedt et al. 2005). Prior to 1979, there are no population
S.D. Hanlon, M.A. Petty, and R. J. Neves2009 11
data from Speers Ferry to evaluate changes in density. However, Ortmann (1918) reported 25 species from Speers Ferry, 15 species more than what was detected in the most recent survey conducted in 2004, indicating a sub-stantial decline in species richness. While some species populations could likely persist in isolation of the Clinch River, others species such as A. p. plicata, A. ligamentina, E. brevidens, E. capsaeformis, F. cor, F. cuneolus, F. subrotunda, and Q. c. strigillata, may represent declining sink populations that have subsequently followed population declines in the Clinch River. Another factor that would impede dispersal of mussels upstream from source populations is the presence of the Spivey Mill dam. This low-head dam is located in Copper Creek 20 rkm from the confl uence with the Clinch River. While the dam certainly limits upstream expansion of mussel populations, 20 km of the creek below the dam has suffered the greatest loss in species richness, indicating other factors are also contributing to the decline. In 1992, Copper Creek ranked number one for the most signifi cant agri-cultural water quality and erosion problems in the Clinch River basin (USDA 1992). Primary problems were siltation and pathogens related to poor agri-cultural and silvicultural practices. Soil loss in the watershed was estimated to be 130,329 metric tons/year. High levels of nitrogenous wastes may have also contributed to the decline in mussel fauna. Nitrogen and phosphorus production from livestock and other forms of agriculture was estimated to be 927,918 kg/yr or 27 kg/ha/yr. By comparison, estimates for the Guest River and Swords/Lewis Creek watersheds, adjacent hydrologic units of compa-rable size, were 1.96 and 8.27 kg/ha/yr, respectively. Given that several species including E. brevidens, L. recta, A. ligamentina, F. subrotunda, and P. fabula were only reported as relics and were not reported alive during the initial survey (Ahlstedt 1981, 1986), it is possible that the mus-sel fauna in Copper Creek was more diverse prior to 1980. In fact, some level of faunal decline may have been linked to land-use legacies initiated during the early 20th century, when most of the region’s forest was harvested and the water-shed was converted to row cropping and pasture land (Pederson 1925). However, forest cover has increased in Scott and Russell counties, VA, from 42.2% of land area in 1940 to 66.6% in 2002 (Lotti and Evans 1942, Miles 2007). A similar rate of increase has occurred in the Copper Creek watershed, which occupies 13.5% of the area in the combined counties. For-est cover in the Copper Creek watershed apparently increased from 38.9% in 1992 (USDA 1992) to 57.7% in 2002 (USEPA 2002). Perhaps impacts from the larger landscape level are beginning to lessen and may, in part, infl uence recovery of the Copper Creek fauna. Despite an increase in forest cover within the watershed, removal of ripar-ian vegetation has progressively increased in the last 30 years (Fraley and Ahlstedt 2000). Even while conducting our survey, we observed land owners actively removing large trees and root masses from stream banks, presumably to accommodate livestock grazing. Elimination of stream-side riparian veg-etation is widespread, and cattle have unlimited access to the creek in many places (Fraley and Ahlstedt 2000). The removal of riparian vegetation has de-stabilized stream banks and has destroyed reaches of suitable mussel habitat.

Southeastern Naturalist Vol. 8, No. 112
Nearly 23% of the mainstem length has no riparian vegetation, and ≈22% of stream banks are protected only by a narrow strip of trees. Riparian widths of about 9 m are a minimum for effective sediment control (Wenger 1999). Therefore, approximately half (45%) of the stream banks in Copper Creek have inadequate riparian vegetation necessary to provide even minimal sedi-ment control. Historically, species diversity in Copper Creek increased in a downstream direction, with the lower 24 km being the most diverse section of the creek. It is clear from our data that signifi cant declines in species richness and abundance have occurred in the downstream section, particularly in the lower 32 km of the creek. Mussel populations in the upper reaches, although not excluded from impacts, seem to have remained relatively intact. Stressors impacting the lower reaches may be more intense, given the culmination of hydrologic impacts associated with widespread riparian degradation and loss of forest cover. Therefore, a resultant increase in siltation and stream-bed de-stabilization will impact mussel habitat, particularly in the lower reaches.
Implications In summary, there are several factors that are likely contributing to the cur-rent faunal structure of Copper Creek. These factors include: 1) agricultural and land conversion stressors and the inter-specifi c tolerances to those stressors among species, 2) pre-decline population densities and distribution, 3) popula-tion source-sink relationships with the Clinch River, and 4) a barrier (Spivey Mill Dam) to upstream dispersal. What exact weight each factor has in deter-mining the current and future fauna of Copper Creek is unclear. Faunal decline in the Clinch River and agricultural and land conversion stressors may be the most signifi cant factors in driving the decline. Copper Creek was one of the most diverse lotic systems of its size in North America, and is of national importance as a refugium for rare and endangered mussel species. Unlike many tributaries of the Upper Tennessee River system, it has escaped large-scale impacts from urban, railroad, and highway develop-ment, as well as mining and point-source discharges. Gradual reforestation of the watershed may be providing some relief to the system at a larger landscape level. However, this reforestation is occurring more in upland areas and may be less important than the riparian corridor in infl uencing suitable habitat for mus-sels (USEPA 2002). Although the mussel fauna has shown some initial signs of recovery, streamside livestock activity and loss of forested riparian vegeta-tion may be pivotal in contributing to the faunal decline. Currently there are no state laws or county ordinances to mandate livestock exclusion from streams or riparian protection in the watershed. Government-sponsored incentive pro-grams such as the Conservation Reserve Enhancement Program, Landowner Incentive Program, and Partners for Fish and Wildlife Program have succeeded in introducing best management practices (BMPs) into the watershed. How-ever voluntary cost-share programs such as these may not be enough to correct perturbations within the time frame necessary to prevent the extirpation of ad-ditional species. A higher level of resources and focus must be dedicated to establishing conservation easements, purchasing lands for permanent protection, educat-

S.D. Hanlon, M.A. Petty, and R. J. Neves2009 13
ing the public, and assisting land owners in implementing BMPs. Although installation of a fi sh-passage structure or removal of the Spivey Mill dam will reestablish connectivity to the middle and upper reaches of Copper Creek, further investigation on sediment transport and changes in hydraulics will need to be conducted to estimate the impact to mussel populations below the dam. Further monitoring of the mussel populations will be necessary periodically to evaluate trends in populations over time. Specifi cally, comprehensive surveys need to be conducted in the near future to determine whether mussel popula-tions are truly rebounding or continuing in a state of decline.
Acknowledgments
We thank Dave Garst for conducting much of the qualitative survey work. We also thank Rachel Mair, Jake Rash, John Schmerfeld, Brett Ostby, and Sumalee Hoskin for assisting in survey work. John Scrivani provided USDA Forest Service forest inventory and analysis data, and Carolyn Copenhaver provided references on historic regional forest cutting. We also appreciate reviews of this paper by Mike Pinder and Brian Watson. This work was funded by USGS Science Supported Part-nership Program in cooperation with the US Fish and Wildlife Service and Virginia Polytechnic Institute and State University.
Literature Cited
Ahlstedt, S.A. 1981. The molluscan fauna of Copper Creek (Clinch River System) in southwestern Virginia. Bulletin of the American Malacological Union 1981:4–6.
Ahlstedt, S.A. 1986. Cumberlandian mollusk conservation program. Activity 1: Mus-sel distribution survey. Unpublished report, Tennessee Valley Authority, Offi ce of Natural Resources and Economic Development, Knoxville, TN. 125 pp.
Ahlstedt, S.A., M.T. Fagg, RS. Butler, and J.F. Connell. 2005. Long-term trend informa-tion for freshwater mussel populations at twelve fi xed-station monitoring sites in the Clinch and Powell River of eastern Tennessee and Southwestern Virginia 1979–2004. Unpublished report prepared for the US Fish and Wildlife Service, Ecological Services, Cookeville, TN. 38 pp.
Augspurger, T., A.E. Keller, M.C. Black, W.G. Cope, and F.J. Dwyer. 2003. Water qual-ity guidance for protection of freshwater mussels (Unionidae) from ammonia expo-sure. Environmental Toxicology and Chemistry 22(11):2569–2575.
Barr, W.C., S.A. Ahlstedt, G.D. Hickman, and D.M. Hill. 1993–1994. Cumberlandian mollusk conservation program. Activity 8: Analysis of macrofauna factors. Walk-erana 7(17/18):159–224.
Commonwealth of Virginia. 2002. Aerial imagery, raster digital data - true color. Vir-ginia Geographic Information Network. Available online at www.vgin.virginia.gov. Accessed April 28, 2007.
Downing, J.A., and W.L. Downing. 1992. Spatial aggregation, precision, and power in surveys of freshwater mussel populations. Canadian Journal of Fisheries and Aquatic Sciences 49:985–991.
Farris, J.L., and J.H. Van Hassel. 2007. Freshwater Bivalve Ecotoxicology. Society of Environmental Toxicology and Chemistry, Pensacola, FL. 375 pp.
Fraley, S.J., and S.A. Ahlstedt. 2000. The recent decline of the native mussels (Unioni-dae) of Copper Creek, Russell and Scott counties, Virginia. Pp.189–195, In R.A. Tankersley, D.I. Warmolts, G.T. Watters, B.J. Armitage, P.D. Johnson, and R.S. Butler (Eds.). Freshwater Mollusk Symposia Proceedings. Ohio Biological Survey, Columbus, OH.

Southeastern Naturalist Vol. 8, No. 114
Henley, W.F., R.J. Neves, L.L. Zimmerman, and R. Winterringer. 1999. A survey of freshwater mussels in the Middle Fork Holston River, Virginia. Banisteria 14:15–24.
Hubbard, D.A., Jr. 2001. Selected karst features of the Southern Valley and Ridge Province, Virginia. Virginia Division of Mineral Resources, Charlottesville, VA. Publication 167.
Lotti, T., and T.C. Evans. 1942. Virginia’s forests. US Department of Agriculture. Forest Service, Resources Bulletin SE-8. Southeastern Forest Experiment Sta-tion, Asheville, NC. 47 pp.
Miles, P.D. 2007. Forest inventory mapmaker web-application version 2.1. US De-partment of Agriculture, Forest Service, North Central Research Station, St. Paul, MN. Available online at www.ncrs2.fs.fed.us/4801/fi adb/index.htm. Accessed February 9, 2007.
Ortmann, A.E. 1918. The nayades (freshwater mussels) of the upper Tennessee drainage, with notes on synonymy and distribution. Proceedings of the American Philosophical Society 57(6):521–626.
Pederson, F.C. 1925. The forest of the valley coal fi elds of Virginia. Virginia Forestry Publication Number 34, University of Virginia, Charlottesville, VA.
Pilarczyk, M.M., P.M. Stewart, D.N. Shelton, H.N. Blalock-Herod, and J.D. William. 2006. Current and recent historical freshwater mussel assemblages in the Gulf Coastal Plains. Southeastern Naturalist 5(2):205–226.
Strayer, D.L. 1999. Statistical power of presence-absence data to detect population declines. Conservation Biology 13(5):1034–1038.
Strayer, D.L., and D.R. Smith. 2003. A Guide to Sampling Freshwater Mussel Popu-lations. American Fisheries Society, Monograph 8, Bethesda, MD.
US Department of Agriculture (USDA). 1992. Clinch River basin land and water resources study for hydrologic units. Unpublished report, June 1992, Richmond, VA. 58 pp.
US Environmental Protection Agency (USEPA). 2002. Clinch and Powell Valley wa-tershed ecological risk assessment. National Center for Environmental Assess-ment, Washington, DC. EPA/600/R-01/050. Available from National Technical Information Service, Springfi eld, VA as publication PB2003-101118, and online at http://www.epa.gov/ncea.
Wang, N., C.G. Ingersoll, D.K. Hardesty, C.D. Ivey, J.L. Kunz, T.W. May, F.J. Dwyer, A.D. Roberts, T. Augsburger, C.M. Kane, R.J. Neves, and M.C. Barn-hart. 2007a. Acute toxicity of copper, ammonia, and chlorine to glochidia and juveniles of freshwater mussels (Unionidae). Environmental Toxicology and Chemistry 26(10):2036–2047.
Wang, N., C.G. Ingersoll, I.E. Greer, D.K. Hardesty, C.D. Ivey, J.L. Kunz, W.G. Brumbaugh, F.J. Dwyer, A.D. Roberts, T. Augsburger, C.M. Kane, R.J. Neves, and M.C. Barnhart. 2007b. Chronic toxicity of copper and ammonia to juvenile freshwater mussels (Unionidae). Environmental Toxicology and Chemistry 26(10):2048–2056.
Warren, M.L., and W.R. Haag. 2005. Spatio-temporal patterns of the decline of fresh-water mussels in the Little South Fork Cumberland River, USA. Biodiversity and Conservation 14:1383–1400.
Wenger, S. 1999. A review of the scientifi c literature on riparian buffer width, extent, and vegetation. Offi ce of Public Service and Outreach, Institute of Ecology, Uni-versity of Georgia, Athens, GA. 59 pp.
S.D. Hanlon, M.A. Petty, and R. J. Neves2009 15
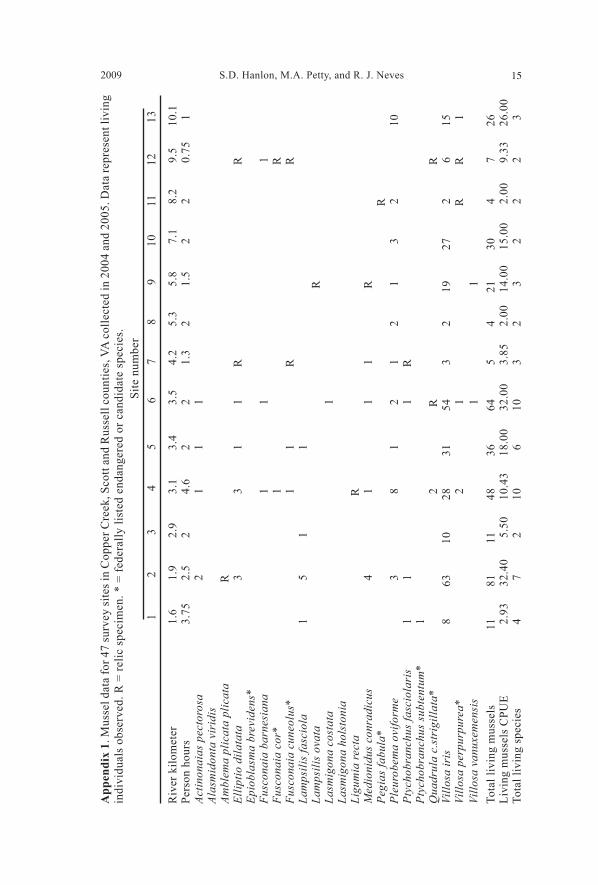
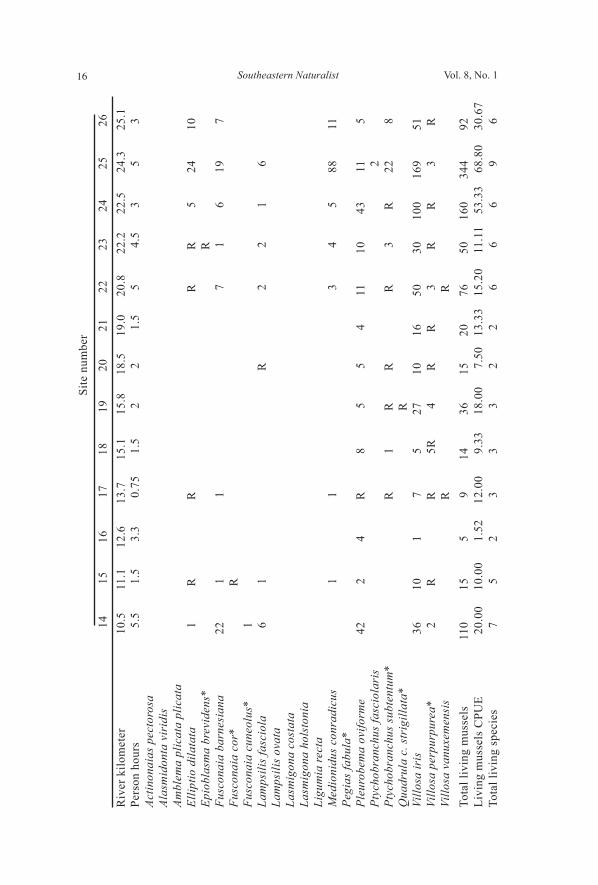
App
endi
x 1.
Mus
sel d
ata
for 4
7 su
rvey
site
s in
Cop
per C
reek
, Sco
tt an
d R
usse
ll co
untie
s, V
A c
olle
cted
in 2
004
and
2005
. Dat
a re
pres
ent l
ivin
g in
divi
dual
s ob
serv
ed. R
= re
lic s
peci
men
. * =
fede
rally
list
ed e
ndan
gere
d or
can
dida
te s
peci
es.
Site
num
ber
1
2 3
4 5
6 7
8 9
10
11
12
13
Riv
er k
ilom
eter
1.
6 1.
9 2.
9 3.
1 3.
4 3.
5 4.
2 5.
3 5.
8 7.
1 8.
2 9.
5 10
.1Pe
rson
hou
rs
3.75
2.
5 2
4.6
2 2
1.3
2 1.
5 2
2 0.
75
1Ac
tinon
aias
pec
toro
sa
2
1
1 1
Alas
mid
onta
vir
idis
Am
blem
a pl
icat
a pl
icat
a
R
Ellip
tio d
ilata
ta
3
3
1 1
R
R
Epio
blas
ma
brev
iden
s*
Fusc
onai
a ba
rnes
iana
1
1
1 Fu
scon
aia
cor*
1
R
Fusc
onai
a cu
neol
us*
1
1
R
R
Lam
psili
s fa
scio
la
1 5
1
1
Lam
psili
s ov
ata
R
La
smig
ona
cost
ata
1
Lasm
igon
a ho
lsto
nia
Ligu
mia
rect
a
R
Med
ioni
dus
conr
adic
us
4
1
1
1
R
Pe
gias
fabu
la*
R
Pl
euro
bem
a ov
iform
e
3
8 1
2 1
2 1
3 2
10
Ptyc
hobr
anch
us fa
scio
lari
s 1
1
1 R
Ptyc
hobr
anch
us s
ubte
ntum
* 1
Q
uadr
ula
c.st
rigi
llata
*
2
R
R
Vi
llosa
iris
8
63
10
28
31
54
3 2
19
27
2 6
15Vi
llosa
per
purp
urea
*
2
1
R
R
1
Villo
sa v
anux
emen
sis
1
1
Tota
l liv
ing
mus
sels
11
81
11
48
36
64
5
4 21
30
4
7 26
Livi
ng m
usse
ls C
PUE
2.93
32
.40
5.50
10
.43
18.0
0 32
.00
3.85
2.
00
14.0
0 15
.00
2.00
9.
33
26.0
0To
tal l
ivin
g sp
ecie
s 4
7 2
10
6 10
3
2 3
2 2
2 3
Southeastern Naturalist Vol. 8, No. 116
Site
num
ber
14
15
16
17
18
19
20
21
22
23
24
25
26
Riv
er k
ilom
eter
10
.5
11.1
12
.6
13.7
15
.1
15.8
18
.5
19.0
20
.8
22.2
22
.5
24.3
25
.1Pe
rson
hou
rs
5.5
1.5
3.3
0.75
1.
5 2
2 1.
5 5
4.5
3 5
3Ac
tinon
aias
pec
toro
sa
Alas
mid
onta
vir
idis
Am
blem
a pl
icat
a pl
icat
a
El
liptio
dila
tata
1
R
R
R
R
5
24
10Ep
iobl
asm
a br
evid
ens*
R
Fusc
onai
a ba
rnes
iana
22
1
1
7 1
6 19
7
Fusc
onai
a co
r*
R
Fu
scon
aia
cune
olus
* 1
La
mps
ilis
fasc
iola
6
1
R
2 2
1 6
Lam
psili
s ov
ata
Lasm
igon
a co
stat
a
La
smig
ona
hols
toni
a
Li
gum
ia re
cta
Med
ioni
dus
conr
adic
us
1
1
3 4
5 88
11
Pegi
as fa
bula
*
Pl
euro
bem
a ov
iform
e 42
2
4 R
8
5 5
4 11
10
43
11
5
Ptyc
hobr
anch
us fa
scio
lari
s
2 Pt
ycho
bran
chus
sub
tent
um*
R
1
R
R
R
3
R
22
8Q
uadr
ula
c. s
trig
illat
a*
R
Vi
llosa
iris
36
10
1
7 5
27
10
16
50
30
100
169
51Vi
llosa
per
purp
urea
* 2
R
R
5R
4
R
R
3 R
R
3
RVi
llosa
van
uxem
ensi
s
R
R
To
tal l
ivin
g m
usse
ls
110
15
5 9
14
36
15
20
76
50
160
344
92Li
ving
mus
sels
CPU
E 20
.00
10.0
0 1.
52
12.0
0 9.
33
18.0
0 7.
50
13.3
3 15
.20
11.1
1 53
.33
68.8
0 30
.67
Tota
l liv
ing
spec
ies
7 5
2 3
3 3
2 2
6 6
6 9
6

S.D. Hanlon, M.A. Petty, and R. J. Neves2009 17
Si
te n
umbe
r
27
28
29
30
31
32
33
34
35
36
37
38
39
Riv
er k
ilom
eter
29
.4
34.0
38
.5
47.0
49
.6
52.8
53
.6
56.0
64
.4
67.8
72
.1
72.7
73
.7Pe
rson
hou
rs
3.5
0.75
4
5 1
0.25
1
4.5
1 1
2 1
0.75
Actin
onai
as p
ecto
rosa
Al
asm
idon
ta v
irid
is
Ambl
ema
plic
ata
plic
ata
Ellip
tio d
ilata
ta
1
Epio
blas
ma
brev
iden
s*
Fusc
onai
a ba
rnes
iana
21
11
2 1
1
3
1 13
5
Fusc
onai
a co
r*
Fusc
onai
a cu
neol
us*
Lam
psili
s fa
scio
la
1
2
R
La
mps
ilis
ovat
a
La
smig
ona
cost
ata
Lasm
igon
a ho
lsto
nia
1R
Li
gum
ia re
cta
Med
ioni
dus
conr
adic
us
102
4
1
R
3 1
6
7 1
Pegi
as fa
bula
*
Pleu
robe
ma
ovifo
rme
90
1 23
5
1 1
8 4
R
10
28
20
Ptyc
hobr
anch
us fa
scio
lari
s
Pt
ycho
bran
chus
sub
tent
um*
30
Q
uadr
ula
c. s
trig
illat
a*
Villo
sa ir
is
150
5 72
78
22
3
38
60
35
50
115
64
8Vi
llosa
per
purp
urea
*
Vi
llosa
van
uxem
ensi
s
To
tal l
ivin
g m
usse
ls
395
6 11
2 86
24
4
50
68
35
67
163
90
8Li
ving
mus
sels
CPU
E 11
2.86
8.
00
28.0
0 17
.20
24.0
0 16
.00
50.0
0 15
.11
35.0
0 67
.00
81.5
0 90
.00
10.6
7

Southeastern Naturalist Vol. 8, No. 118
No.
of s
ites
Si
te n
umbe
r
o
ccur
ring
40
41
42
43
44
45
46
47
To
tal
% o
f tot
al
aliv
eR
iver
kilo
met
er
77.7
78
.7
81.1
82
.9
83.8
85
.3
87.2
93
.0
Pers
on h
ours
3
0.75
3
4 3.
5 1.
5 2
2 11
1.45
Actin
onai
as p
ecto
rosa
5
0.12
%
4Al
asm
idon
ta v
irid
is
1 1R
3R
D
1
0.02
%
1Am
blem
a pl
icat
a pl
icat
a
0
0.00
%
0El
liptio
dila
tata
49
1.
19%
9
Epio
blas
ma
brev
iden
s*
0 0.
00%
0
Fusc
onai
a ba
rnes
iana
6
2
12
145
3.53
%
23Fu
scon
aia
cor*
1
0.02
%
1Fu
scon
aia
cune
olus
*
3
0.07
%
3La
mps
ilis
fasc
iola
1
1R
2
8
40
0.97
%
15La
mps
ilis
ovat
a
0
0.00
%
0La
smig
ona
cost
ata
1 0.
02%
1
Lasm
igon
a ho
lsto
nia
1R
1R
1R
5R
0 0.
00%
0
Ligu
mia
rect
a
0
0.00
%
0M
edio
nidu
s co
nrad
icus
2
3
11
53
6 4
32
4 7.
89%
25
Pegi
as fa
bula
*
0
0.00
%
0Pl
euro
bem
a ov
iform
e 11
3 41
75
9
513
12.4
9%
38Pt
ycho
bran
chus
fasc
iola
ris
5 0.
12%
4
Ptyc
hobr
anch
us s
ubte
ntum
*
65
1.
58%
6
Qua
drul
a c.
str
igill
ata*
2
0.05
%
1Vi
llosa
iris
10
1 6
126
318
438
172
293
29
34
71.4
6%
46Vi
llosa
per
purp
urea
*
16
0.
39%
7
Villo
sa v
anux
emen
sis
1R
2
0.05
%
2To
tal l
ivin
g m
usse
ls
121
6 13
4 37
2 58
7 18
7 29
7 0
4106
10
0.00
%
Livi
ng m
usse
ls C
PUE
40.3
3 8.
00
44.6
7 93
.00
167.
71
124.
67 1
48.5
0 0.
00
36.8
4
Tota
l liv
ing
spec
ies
5 1
4 4
6 3
2 0
16