status of wildlife populations and land degradation in … · status of wildlife populations and...
TRANSCRIPT
_______________________________________________________________________________
STATUS OF WILDLIFE POPULATIONS AND LAND DEGRADATION IN BOTSWANA’S
FOREST RESERVES AND CHOBE DISTRICT
Michael Chase Elephants Without Borders PO Box 682 Kasane Tel: ++267 6250505 Email: [email protected]
April 2013
ii
STATUS OF WILDLIFE POPULATIONS AND LAND DEGRADATION IN BOTSWANA’S FOREST
RESERVES AND CHOBE DISTRICT
Michael Chase1,2
April 2013
1 Elephants Without Borders, P.O. Box 682, Kasane, Botswana, and 2 San Diego Zoo Institute for Conservation Research, 15600 San Pasqual Valley Road,
Escondido, CA 92027-7000, U.S.A.
Forest Conservation Botswana
Elephants Without Borders
Zoological Society of San Diego
This survey was conducted jointly by Elephants Without Borders, Forest Conservation Botswana and, the Zoological Society of San Diego.
The opinions expressed in this report are those of the author and do not necessarily represent those of Forest Conservation Botswana, the Zoological Society of San Diego or any of the donors who have helped fund this aerial survey.
No part of this report may be reproduced without the prior written permission of the author and copyright owner(s).
iii
ACKNOWLEDGMENTS
This wildlife aerial survey of the Chobe District was flown by Elephants Without Borders, and largely funded through a grant from Forest Conservation Botswana (FCB 000018). Additional funding was received from Zoological Society of San Diego, Botswana Wildlife Management Association, Mr. Brett Warren and Family, Mutual and Federal Insurance Botswana and Madeleine and Jerry Delman Cohen.
I appreciate the assistance provided by Mr. E.B. Moabi, and Ms. M. Bolele from the
Ministry of Environment, Wildlife and Tourism. DWNP personnel, Dr. Cyril Taolo, Fredrick Dipotso and Chobe National Park officers and wildlife scouts are recognized for their help. The DWNP are acknowledged for their ongoing support of Elephants Without Borders elephant ecology research in northern Botswana. I acknowledge, with gratitude, the support provided by Mr. Steve Nolan, Dr. Larry Patterson, Mr. and Mrs. John Chase, Dr. Matt Anderson, Prof. Curt Griffin, Mr. Patrick Moyo, Mr. Ronnie Njavera and Shoni Nyoni. The members of staff at Forest Conservation Botswana namely; Meshack Keitumetse, Kempho Tsheko, Emmanuel Zuku are gratefully acknowledged for their ongoing support and encouragement for this project. Mr. G. Moremedi, Forest Conservation Botswana’s CEO, is specifically acknowledged for his understanding, patience and generous support. I thank him and the FCB board for recognizing that the status and conservation of wildlife in our Forest Reserves are critical information needs and data that will entice the future development and conservation of these environments.
I thank Mr. Mike Holding for flying this aerial survey. I appreciate the assistance of our
aerial observers, Ms. Kelly Landen, Mr. Graham Springer, Mr. John Chase and Dr. Larry Patterson. I am grateful to Kelly Landen for her logistical support and administrative assistance.
Prof. van Aarde is acknowledged for reviewing draft versions of this report. The first
Minister of Environment, Wildlife and Tourism, Honorable Onkokame Kitso Mokaila is thanked for his Ministry’s support of Elephants Without Borders projects. Forest Conservation Botswana board members are recognized for their funding, and accepting the validity of this project towards conserving and developing our country’s valuable forest habitats. FCB kindly funded the meeting and presentation of the results of this research work to key stakeholders in Gaborone.
Honorable Tshekedi Khama, Minister of Environment, Wildlife and Tourism, is gratefully
acknowledged for his commitment and enthusiasm for supporting the presentation of this study’s results and recommendations to key stakeholders in Gaborone.
iv
EXECUTIVE SUMMARY
Elephants Without Borders conducted dry (Sept. 2011) and wet (Mar. 2012) season aerial surveys of elephants and wildlife in the Chobe District of northern Botswana to provide recent information on the status of wildlife numbers and their seasonal distribution. The aerial surveys were commissioned by Elephants Without Borders (EWB) and funded largely by Forest Conservation Botswana. A small fixed wing plane was used to fly a stratified sample survey, with parallel transects over the Chobe Distinct a survey area of about 22560 km2 in extent. It included Chobe National Park (NP), Chobe Forest Reserve (FR), Kasane FR and Extension, Kazuma FR, Sibuyu FR and Maikaelelo FR, and surrounding Wildlife Management Areas (WMAs) in the Chobe District. The principal objective of this survey was to provide relatively precise and accurate estimates of wildlife in the survey area, using a method, which could be repeated. Secondary objectives included mapping the spatial distribution of elephants and other wildlife, distribution of elephant carcasses, baobab trees and large birds. The methods used were suitable for meeting the survey objectives, repeatability and technically robust. Thus this survey provides a baseline for monitoring future trends in the numbers and spatial distribution of wildlife in Chobe. This report provides the results of these two seasonal surveys, in addition to information on the spatial distribution, and abundance of wildlife and trends of elephant numbers. Maps and tables illustrating the distribution, numbers, density and trends of wildlife species in the survey area are provided.
The survey area was divided into 16 strata, which largely conformed to the boundaries of
WMAs, FRs and Chobe NP. Within each stratum, transects were parallel and regularly spaced between 2 and 8 km apart. To improve the precision of population estimates, sampling intensity varied between strata, and ranged from 5 – 20 %. The overall sampling intensity was 15 %, a 10 % increase compared to earlier Department of Wildlife and National Parks (DWNP) aerial surveys. Overall mean search effort was 1.4 minutes per km2.
Aerial surveys often underestimate wildlife numbers, with the degree of underestimation
higher for small or cryptic species than for large species. High-resolution digital cameras provided images to compensate for any underestimating or missed animals. The locations of wildlife herds seen during the survey were entered into a GIS to produce maps showing the distribution and herd sizes of principal large herbivores and birds in Chobe District. We adjusted for altitude and photo corrections and used the traditional Jolly’s Method II for unequal sized sampling units (Jolly 1969) to calculate population estimates and variance for each species in each stratum.
This survey is the tenth dry season aerial survey of wildlife populations in the Chobe
District since 1993. Estimates of elephant numbers in the District, and Chobe NP have remained similar, but do fluctuate according to the timing of dry season surveys. A trend analysis of wildlife estimates from earlier aerial surveys suggests that the estimated numbers of large mammal species remain stable. The 2011 population estimates for wildlife species in the District are generally similar to those of a survey conducted by EWB during 2010 dry season. However, there are large differences in estimates of population size for most species between EWBs and DWNP surveys. The high confidence limits to the DWNP estimates demonstrate that these low intensity surveys (1993 - 2004) might not be satisfactory for estimating wildlife numbers. The significant difference (d = 4.02) in elephant estimates between EWBs 2010 (57457) and 2011 (40517) surveys is most likely attributed to the dispersal of elephants and the timing of surveys.
v
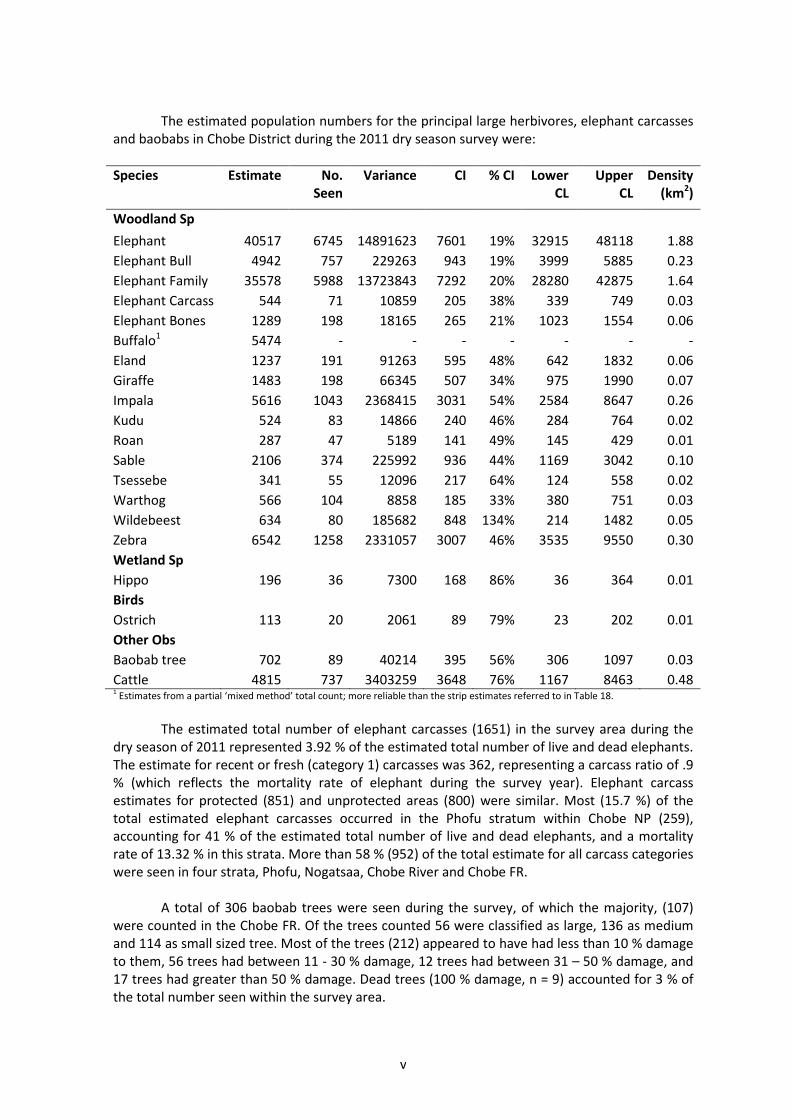
The estimated population numbers for the principal large herbivores, elephant carcasses
and baobabs in Chobe District during the 2011 dry season survey were:
Species Estimate No.
Seen
Variance CI % CI Lower
CL
Upper
CL
Density
(km2)
Woodland Sp
Elephant 40517 6745 14891623 7601 19% 32915 48118 1.88
Elephant Bull 4942 757 229263 943 19% 3999 5885 0.23
Elephant Family 35578 5988 13723843 7292 20% 28280 42875 1.64
Elephant Carcass 544 71 10859 205 38% 339 749 0.03
Elephant Bones 1289 198 18165 265 21% 1023 1554 0.06
Buffalo1 5474 - - - - - - -
Eland 1237 191 91263 595 48% 642 1832 0.06
Giraffe 1483 198 66345 507 34% 975 1990 0.07
Impala 5616 1043 2368415 3031 54% 2584 8647 0.26
Kudu 524 83 14866 240 46% 284 764 0.02
Roan 287 47 5189 141 49% 145 429 0.01
Sable 2106 374 225992 936 44% 1169 3042 0.10
Tsessebe 341 55 12096 217 64% 124 558 0.02
Warthog 566 104 8858 185 33% 380 751 0.03
Wildebeest 634 80 185682 848 134% 214 1482 0.05
Zebra 6542 1258 2331057 3007 46% 3535 9550 0.30
Wetland Sp
Hippo 196 36 7300 168 86% 36 364 0.01
Birds
Ostrich 113 20 2061 89 79% 23 202 0.01
Other Obs
Baobab tree 702 89 40214 395 56% 306 1097 0.03
Cattle 4815 737 3403259 3648 76% 1167 8463 0.48 1 Estimates from a partial ‘mixed method’ total count; more reliable than the strip estimates referred to in Table 18.
The estimated total number of elephant carcasses (1651) in the survey area during the
dry season of 2011 represented 3.92 % of the estimated total number of live and dead elephants. The estimate for recent or fresh (category 1) carcasses was 362, representing a carcass ratio of .9 % (which reflects the mortality rate of elephant during the survey year). Elephant carcass estimates for protected (851) and unprotected areas (800) were similar. Most (15.7 %) of the total estimated elephant carcasses occurred in the Phofu stratum within Chobe NP (259), accounting for 41 % of the estimated total number of live and dead elephants, and a mortality rate of 13.32 % in this strata. More than 58 % (952) of the total estimate for all carcass categories were seen in four strata, Phofu, Nogatsaa, Chobe River and Chobe FR.
A total of 306 baobab trees were seen during the survey, of which the majority, (107)
were counted in the Chobe FR. Of the trees counted 56 were classified as large, 136 as medium and 114 as small sized tree. Most of the trees (212) appeared to have had less than 10 % damage to them, 56 trees had between 11 - 30 % damage, 12 trees had between 31 – 50 % damage, and 17 trees had greater than 50 % damage. Dead trees (100 % damage, n = 9) accounted for 3 % of the total number seen within the survey area.
vi
A limited wet season survey was flown over the six FR, CH 5 (Northern Plains) and Chobe River stratum. Wildlife densities were considerably lower in strata which included or were close to the Chobe River during the wet season. Most species moved away from the perennial water sources to the interior portions of the District to make use of rain filled pans. Variations in seasonal wildlife estimates can be attributed to the dispersal of large mammals, the Chobe riverfront is not a complete ecological unit but part of a far larger ecosystem in which the FRs and Northern Plains serve as critical wet season ranges for wildlife.
Herbivore populations in the District appear to be stable. The extent of bush fires during
the survey across large areas of the District are a major determinant in the density of plant species, a fire management programme needs to be implemented. Fire frequency in the Maikaelelo and Sibuyu FR is so high that the woodlands have lost their commercial value, and destroying old growth stands of mongongo (Schinziophyton rautanenii). The level of deforestation and encroaching human activities for arable fields along the Northern Plains ecotone and Chobe FR ridge are destructive, and will impede wildlife movements. The ecotone along the northern border of Kasane FR and CH 5 (Northern Plains), falls within an important wildlife corridor and should be conserved by incorporating parts of the Northern Plains into Chobe NP or Kasane FR. The allocation of arable fields in the middle of elephant pathways northwest of Kachikau is hindering wildlife access to water which will lead to an inevitable increase in human elephant conflict. Considerable development is taking place within and on the boundaries of FRs; this will have a negative impact on wildlife movements, escalate human wildlife conflicts and is causing high incidents of retaliatory killings of lion, hyena and elephant.
With the District’s burgeoning human population (2.5 % annual growth rate) there is a
shortage of land, with over 52 % of the District set aside for the Chobe NP, and 18 % designated as FR. There has been growing concern that the large percentage of land (70 %) set aside for conservation needs to offer more diversified investment opportunities. To date, one of the major problems facing Chobe has been a poor effort to implement development programmes within conservation areas (FR specifically) despite repeated recommendations for the sustainable development of such areas. Ecotourism development initiatives have been recommended in a plethora of management plans and policies that appear to have been largely overlooked by decision makers. Tourism operators implied that the management and responsibility for the FR is fragmented, with no-one department showing authority and accountability for the management of the FRs.
While this study provides new information on the status of wildlife in Chobe District, the
study merely repeats longstanding recommendations echoed by previous reports to motivate for the sustainable development of Botswana’s Forest Reserves. In this case however, the call and urgency to diversify the economic activities within Forest Reserves coincide with increasing concern over tourism congestion along the Chobe riverfront between Kasane – Serondela, rising human wildlife conflicts, poaching of wildlife and overharvesting of natural resources.
vii
TABLE OF CONTENTS
Page
ACKNOWLEDGMENTS ...................................................................................................................iii
EXECUTIVE SUMMARY .................................................................................................................. iv
TABLE OF CONTENTS .................................................................................................................... vii
LIST OF TABLES .............................................................................................................................. ix
LIST OF FIGURES ............................................................................................................................ xi
STATUS OF WILDLIFE POPULATIONS AND LAND DEGRADATION IN BOTSWANA’S FOREST RESERVES AND CHOBE DISTRICT ................................................................................................... 1
Background ...................................................................................................................... 1 Introduction ..................................................................................................................... 1 Study Area ........................................................................................................................ 2 Methods ........................................................................................................................... 5
Fixed-Wing Aerial Survey ....................................................................... 5 Survey Design ......................................................................................... 5 Flight Procedures and Observations ...................................................... 7 Strip Width and Calibration.................................................................... 8
Data Analysis .................................................................................................................... 8
Strip Transect Sampling / Fixed-Wing Aerial Survey .............................. 8 Search Effort ......................................................................................... 10
Results ............................................................................................................................ 10
Sampling Effort ..................................................................................... 10 Estimates .............................................................................................. 11 Observations ........................................................................................ 12 Wildlife Distributions ........................................................................... 16 Cattle Distribution ................................................................................ 17 Trends in Elephant Numbers in Chobe District .................................... 17 Trends in Wildlife Numbers ................................................................. 20 Differences between 2011 dry and 2012 Wet Season Wildlife
Estimates ....................................................................................... 25 Road Strip Count along the Chobe River .............................................. 26 Buffalo - Partial Total Count ................................................................. 27 Savuti Marsh – Partial Total Count of Wildlife ..................................... 28 Factors Effecting Population Trends .................................................... 28
viii
Discussion ....................................................................................................................... 31 Wildlife Estimates ................................................................................ 31 Observations ........................................................................................ 31 Wildlife Distribution ............................................................................. 31 Trends in Elephant Numbers................................................................ 32 Trends in Wildlife Numbers ................................................................. 32 Conservation Implications .................................................................... 33
Conclusion ...................................................................................................................... 34
Recommendations ............................................................................... 34
References ...................................................................................................................... 36 Appendix 1. Data analysis and plane set-up for aerial survey ....................................... 77 Appendix 2. Wildlife numbers within the new Pandamatenga Farming area,
March 2012. ............................................................................................................. 79

ix
LIST OF TABLES
Table Page Table 1. Wildlife estimates and statistics for major wildlife species, elephant carcasses,
baobab trees. .......................................................................................................................... 12 Table 2. Numbers seen, groups counted and average group size of animals, baobabs, birds
and carcasses seen during the 2011 dry season aerial survey in Chobe District. .................. 13 Table 3. Comparison of numbers of individual animals seen and numbers of herds/groups
seen by the left and right observers. ...................................................................................... 15 Table 4. Calculated growth rates (r) and 95% Confidence Intervals (CI) for elephants in
Chobe District, Chobe NP, Chobe River and CH 1 and 2 strata, covered by all aerial surveys in Chobe District, 1993 - 2010. .................................................................................. 18
Table 5. d - test (students t test) comparing the 2010 and 2011 aerial survey elephant
estimates. ............................................................................................................................... 19 Table 6. Wildlife population estimates from ten dry season aerial surveys over Chobe
District and Chobe NP, 1993 – 2011. ...................................................................................... 20 Table 7. Two dry season (2010 and 2011) strip aerial survey estimates of wildlife, with d-
test comparisons between 2010 and 2011 aerial surveys. .................................................... 22 Table 8. Comparison between dry (2011) and wet (2012) season aerial survey estimates for
selected wildlife species. ........................................................................................................ 25 Table 9. Road strip survey estimates of wildlife along the Chobe River, May 2012. ..................... 26 Table 10. Buffalo partial total count in the Chobe District, 2011 dry season aerial survey........... 28 Table 11. Wildlife numbers on the Savuti Marsh, 03 September 2011. ........................................ 28 Table 12. Stratum number, name, area (km2) and survey coverage during the 2011 dry
season aerial survey of wildlife in Chobe District. .................................................................. 38 Table 13. Population estimates and statistics for elephants in Chobe District.............................. 40 Table 14. Population estimates and statistics for elephant bulls in Chobe District. ...................... 42 Table 15. Population estimates and statistics for elephant family groups in Chobe District. ....... 43 Table 16. Population estimates and statistics for elephant carcasses (Cat.1) in Chobe
District. ................................................................................................................................... 46 Table 17. Population estimates and statistics for elephant carcasses (Cat. 2, Bones) in Chobe
District. ................................................................................................................................... 47 Table 18. Population estimates and statistics for buffalo in Chobe District. ................................. 50
x
Table 19. Population estimates and statistics for eland in Chobe District..................................... 52 Table 20. Dry season population estimates and statistics for giraffe in Chobe District. ............... 54 Table 21. Population estimates and statistics for gemsbok in Chobe District. .............................. 56 Table 22. Population estimates and statistics for hippo in Chobe District. ................................... 57 Table 23. Population estimates and statistics for impala in Chobe District. .................................. 58 Table 24. Population estimates and statistics for kudu in Chobe District. .................................... 60 Table 25. Population estimates and statistics for roan in Chobe District. ..................................... 62 Table 26. Population estimates and statistics for sable in Chobe District. .................................... 64 Table 27. Population estimates and statistics for tsessebe in Chobe District. .............................. 66 Table 28. Population estimates and statistics for wildebeest in Chobe District. ........................... 68 Table 29. Population estimates and statistics for zebra in Chobe District. .................................... 70 Table 30. Population estimates and statistics for ostrich in Chobe District. ................................. 72 Table 31. Population estimates and statistics for cattle in Chobe District. ................................... 73 Table 32. Estimates and statistics for baobab trees in Chobe District. .......................................... 75
xi
LIST OF FIGURES
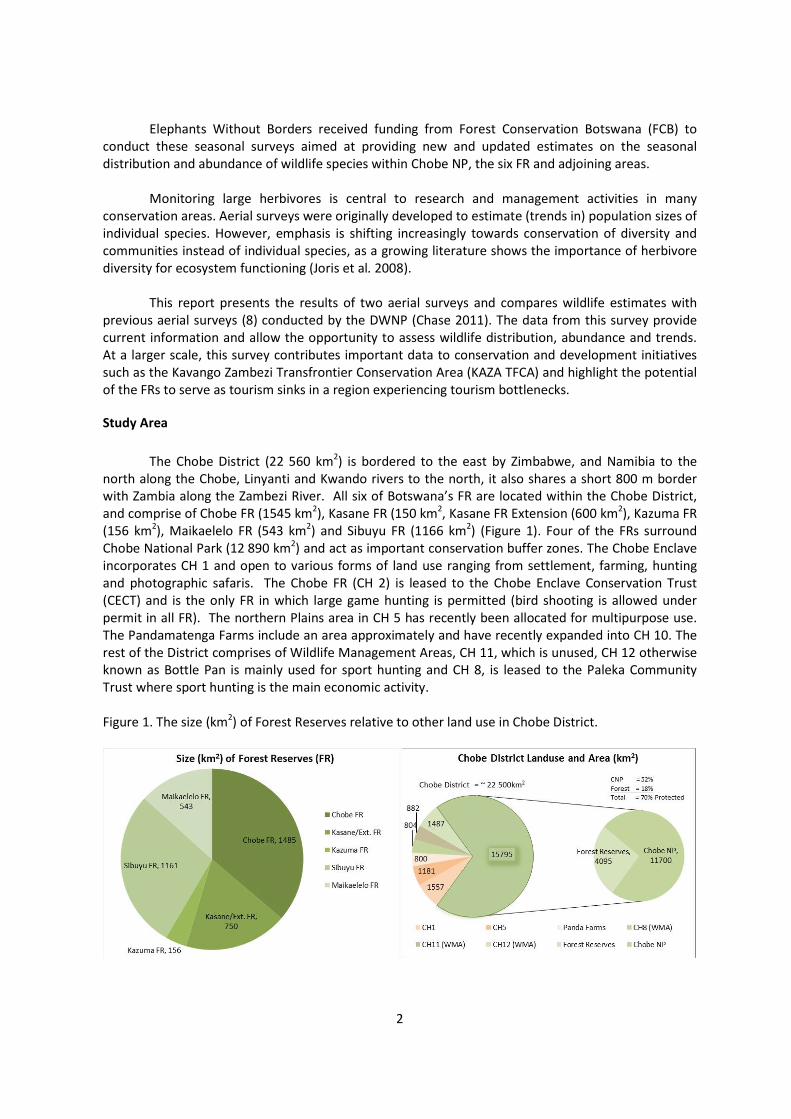
Figure Page Figure 1. The size (km2) Forest Reserves relative to other land use in Chobe District. .................... 2 Figure 2. Chobe District human population in each village (Population Census, 2011) ................... 3 Figure 3. Chobe District, Forest Reserves, Chobe National Park, and surrounding land use in
northern Botswana. ................................................................................................................... 4 Figure 4. Survey stratum and sample coverage during 2011 dry season aerial survey of Chobe
District. ...................................................................................................................................... 6 Figure 5. The number and density (km2) of elephants in Chobe District in relation to protected
areas (CNP), forest reserves (FR) and WMAs, dry season 2011. ............................................. 16 Figure 6. Trends in the number of elephants in Chobe District and Chobe NP (1993 – 2011). ...... 19 Figure 7. Summary trend analyses for selected wildlife species in Chobe District, based upon dry
season aerial surveys (10) flown between 1993 and 2011. .................................................... 23 Figure 8. Summary trend analyses for selected wildlife species in Chobe NP, based upon dry
season aerial surveys (10) flown between 1993 and 2011. .................................................... 24 Figure 9. Comparison between dry and wet season aerial survey estimates for Chobe River
Stratum. ................................................................................................................................... 25 Figure 10. Dry (2011) and wet (2012) season aerial survey estimates for elephants in selected
survey strata in Chobe District. ............................................................................................... 26 Figure 11. Comparison between three aerial surveys (Dry 2010 - 2012, Wet 2012) and one strip
round estimates (May 2012 Rd) for selected wildlife along the Chobe River. ........................ 27 Figure 12. Conservation threats, wildlife corridors and important wildlife habitat in the Chobe
District. .................................................................................................................................... 30 Figure 13. Number of visitors and projected visitation to Chobe NP (BTO 2010). ......................... 34 Figure 14. Recorded track log of flight lines indicting transects flown during aerial surveys, Chobe
District. .................................................................................................................................... 39 Figure 15. Distribution and density (km2) of elephants in Chobe District during 2011 dry and 2012
wet season aerial surveys. ....................................................................................................... 41 Figure 16. Distribution and density (km2) of elephant bulls in Chobe District during 2011 dry and
2012 wet season aerial surveys. .............................................................................................. 44 Figure 17. Distribution and density (km2) of elephant family groups in Chobe District during 2011
dry and 2012 wet season aerial survey. .................................................................................. 45

xii
Figure 18. Distribution and density (km2) of elephant carcasses (Cat.1) in Chobe District during 2011 dry season aerial survey. ................................................................................................ 48
Figure 19. Distribution and density (km2) of elephant carcasses (Cat. 2, bones) in Chobe District
during 2011 dry season aerial survey. ..................................................................................... 49 Figure 20. Distribution and density (km2) of buffalo in Chobe District during 2011 dry and 2012
wet season aerial survey. ........................................................................................................ 51 Figure 21. Distribution and density (km2) of eland in Chobe District during 2011 dry and 2012 wet
season aerial survey. ............................................................................................................... 53 Figure 22. Distribution and density (km2) of giraffe in Chobe District during 2011 dry and 2012
wet season aerial survey. ........................................................................................................ 55 Figure 23. Distribution and density (km2) of impala in Chobe District during 2011 dry season aerial
survey. ..................................................................................................................................... 59 Figure 24. Distribution of kudu in Chobe District, 2011 dry season aerial survey. ......................... 61 Figure 25. Distribution and density (km2) of roan in Chobe District on 2011 dry and 2012 wet
season aerial survey. ............................................................................................................... 63 Figure 26. Distribution and density (km2) of sable in Chobe District on 2011 dry and 2012 wet
season aerial survey. ............................................................................................................... 65 Figure 27. Distribution of tsessebe in Chobe District, 2011 dry season aerial survey. ................... 67 Figure 28. Distribution of wildebeest in Chobe District, 2011 dry season aerial survey. ............... 69 Figure 29. Distribution and density (km2) of zebra in Chobe District during 2011 dry and 2012 wet
season aerial survey. ............................................................................................................... 71 Figure 30. Distribution of cattle in the Chobe District, 2011 dry season aerial survey................... 74 Figure 31. Distribution and density (km2) of baobab tress in Chobe District.................................. 76
1
STATUS OF WILDLIFE POPULATIONS AND LAND DEGRADATION IN BOTSWANA’S FOREST RESERVES
AND CHOBE DISTRICT
Background
Management decisions for conservation areas and wildlife species require accurate and
reliable information about population size, distribution, demography, and habitat use while simultaneously understanding the needs of people who live adjacent to these areas. Obtaining detailed and current data for these parameters in Botswana’s Forest Reserves has been hampered by financial constraints. As a consequence, there has been limited information on the status of wildlife populations in Botswana’s Forest Reserves (FR), all six of which occur in the Chobe District. Current information on the seasonal distribution and abundance of wildlife together with threats to these FR are needed to guide policy decisions and implement conservation and development projects. The purpose of this study is to present the results of two wildlife aerial surveys flown by Elephants Without Borders (EWB) during the 2011 dry and 2012 wet seasons, providing an updated status report on Chobe District wildlife numbers and distribution. We also use these survey results as part of an analysis of wildlife distribution and abundance in the Chobe District relative to the potential effects of increasing human activities.
Introduction
The Chobe District has become internationally renowned for its large elephant population,
specifically; Chobe National Park (NP) is frequented by visitors for its large aggregations of wildlife along the Chobe, Linyanti and Khwai Rivers, while parts of the Park’s drier interiors such as Savuti and Nogatsaa have also become popular with tourists for their remoteness. The dry season wildlife concentrations along the Chobe River coincide with increasing visitors (Aug. – Nov.) along parts of the Chobe riverfront. Tourism congestion, mainly between Sedudu Gate and Serondela, has raised concerns within the tourism industry and the possibility of using FR to ease this overcrowding. Tourism overcrowding, human wildlife conflict, concern about wildlife numbers, illegal harvesting and speculative information about the status of wildlife in Botswana’s FR prompted this study. Two fixed wing aerial surveys of wildlife in Chobe District were flown. The first survey was conducted during the dry season between August and September 2011 (Sept11) and covered the entire District, while the second survey was flown during the wet season between 1 - 8 March 2012 (Mar12), and covered all the FRs. A ground based strip road count was also conducted along the Chobe River from 22 – 25 May 2012, and a helicopter total count of wildlife on the Savuti Marsh was flown.
Although aerial surveys over the Chobe District have been flown, by the Department of
Wildlife and National Parks (DWNP) (1993 – 2006), this is the first independent fixed-wing aerial survey to provide estimates for wildlife populations specifically within Botswana’s Forest Reserves (FR) and adjoining areas. The principal objective of this survey was to provide relatively accurate and precise estimates of the numbers of elephants and other large herbivores in the FRs, using a technique that could be executed within a reasonable time and at a reasonable cost. Secondary objectives included determination of the spatial distributions of elephants and large herbivores, and estimation of the number and distribution of elephant carcasses and baobab trees. The methods used were suitable for meeting the survey objectives, repeatable and technically robust. Thus, this survey provides a solid baseline for monitoring future trends in the numbers and spatial distribution of wildlife in the Chobe District and its six Forest Reserves.
2
Elephants Without Borders received funding from Forest Conservation Botswana (FCB) to conduct these seasonal surveys aimed at providing new and updated estimates on the seasonal distribution and abundance of wildlife species within Chobe NP, the six FR and adjoining areas.
Monitoring large herbivores is central to research and management activities in many
conservation areas. Aerial surveys were originally developed to estimate (trends in) population sizes of individual species. However, emphasis is shifting increasingly towards conservation of diversity and communities instead of individual species, as a growing literature shows the importance of herbivore diversity for ecosystem functioning (Joris et al. 2008).
This report presents the results of two aerial surveys and compares wildlife estimates with
previous aerial surveys (8) conducted by the DWNP (Chase 2011). The data from this survey provide current information and allow the opportunity to assess wildlife distribution, abundance and trends. At a larger scale, this survey contributes important data to conservation and development initiatives such as the Kavango Zambezi Transfrontier Conservation Area (KAZA TFCA) and highlight the potential of the FRs to serve as tourism sinks in a region experiencing tourism bottlenecks.
Study Area
The Chobe District (22 560 km2) is bordered to the east by Zimbabwe, and Namibia to the
north along the Chobe, Linyanti and Kwando rivers to the north, it also shares a short 800 m border with Zambia along the Zambezi River. All six of Botswana’s FR are located within the Chobe District, and comprise of Chobe FR (1545 km2), Kasane FR (150 km2, Kasane FR Extension (600 km2), Kazuma FR (156 km2), Maikaelelo FR (543 km2) and Sibuyu FR (1166 km2) (Figure 1). Four of the FRs surround Chobe National Park (12 890 km2) and act as important conservation buffer zones. The Chobe Enclave incorporates CH 1 and open to various forms of land use ranging from settlement, farming, hunting and photographic safaris. The Chobe FR (CH 2) is leased to the Chobe Enclave Conservation Trust (CECT) and is the only FR in which large game hunting is permitted (bird shooting is allowed under permit in all FR). The northern Plains area in CH 5 has recently been allocated for multipurpose use. The Pandamatenga Farms include an area approximately and have recently expanded into CH 10. The rest of the District comprises of Wildlife Management Areas, CH 11, which is unused, CH 12 otherwise known as Bottle Pan is mainly used for sport hunting and CH 8, is leased to the Paleka Community Trust where sport hunting is the main economic activity. Figure 1. The size (km2) of Forest Reserves relative to other land use in Chobe District.
3
Rainfall is strongly seasonal, occurring mostly from October to April. Rain occurs occasionally in May and September, but it is rare in June through August. Average annual rainfall for northern Botswana is ~ 660 mm. There are six perennial rivers in the study area. The Chobe, and Zambezi (800 m), rivers are the largest rivers that provide abundant water throughout the year. The Khwai, Linyanti, Savuti and Kwando rivers are smaller perennial rivers flanked by seasonally flooded wetlands. These rivers are highly dependent on rainfall in Angola and typically flood during the dry season in northern Botswana. In dry years, only western portions of the Linyanti River may flood, and the Savuti Channel may dry completely. Throughout much of the study area, seasonal pans contain water during the wet season. Typically, water persists in these pans into August; the larger pans can retain water until November when the wet season begins. Yet, little water is available over large portions of the elephant range during the latter part of the dry season except for that available at artificial waterholes.
The vegetation consists predominately of deciduous dry woodland and scattered grassland on
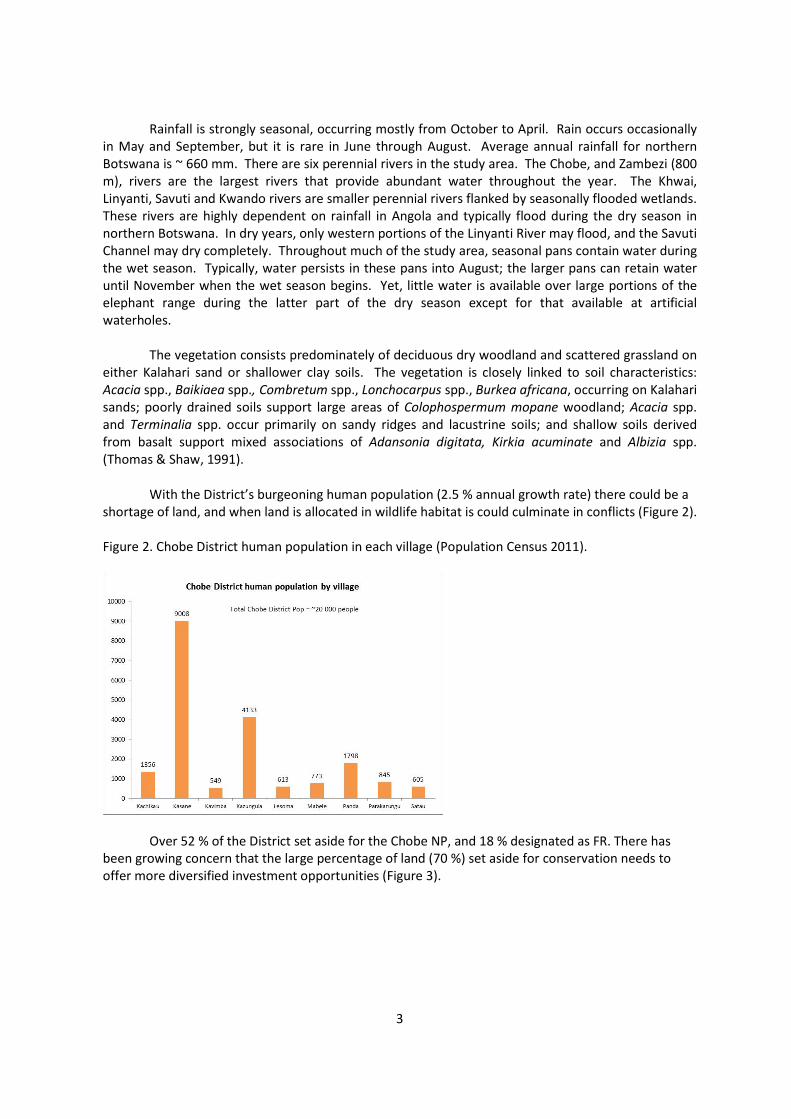
either Kalahari sand or shallower clay soils. The vegetation is closely linked to soil characteristics: Acacia spp., Baikiaea spp., Combretum spp., Lonchocarpus spp., Burkea africana, occurring on Kalahari sands; poorly drained soils support large areas of Colophospermum mopane woodland; Acacia spp. and Terminalia spp. occur primarily on sandy ridges and lacustrine soils; and shallow soils derived from basalt support mixed associations of Adansonia digitata, Kirkia acuminate and Albizia spp. (Thomas & Shaw, 1991). With the District’s burgeoning human population (2.5 % annual growth rate) there could be a shortage of land, and when land is allocated in wildlife habitat is could culminate in conflicts (Figure 2). Figure 2. Chobe District human population in each village (Population Census 2011).
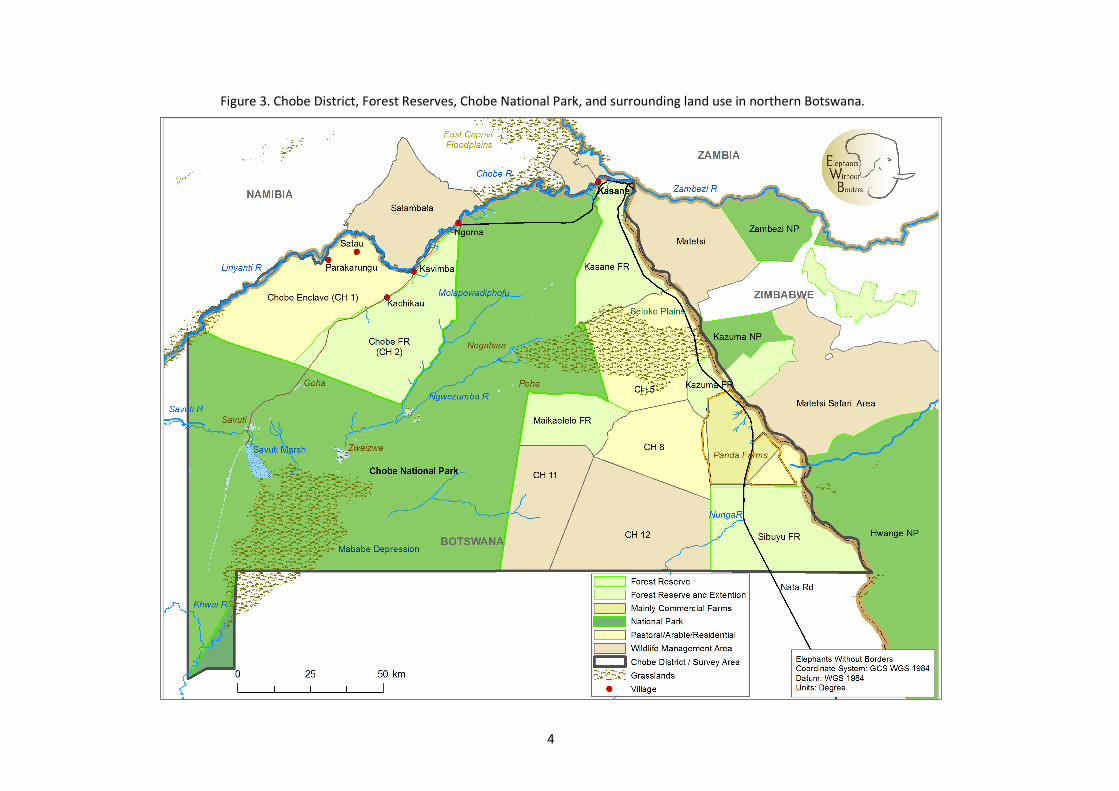
Over 52 % of the District set aside for the Chobe NP, and 18 % designated as FR. There has been growing concern that the large percentage of land (70 %) set aside for conservation needs to offer more diversified investment opportunities (Figure 3).
4
Figure 3. Chobe District, Forest Reserves, Chobe National Park, and surrounding land use in northern Botswana.
5
Methods
Fixed-Wing Aerial Survey
Two aerial surveys were flown over the Chobe District. The first was a dry season survey, flown during 26 Aug. - 4 Sept. 2011 (Sept11) and corresponded with the peak dry season when we expected increased visibility and wildlife to be congregated near permanent water. The second survey, 1 - 8 March (Mar12) was flown when water was available throughout the study area in seasonal pans. The areas surveyed differed somewhat between our two surveys. For the Sept11 survey, the entire Chobe District was surveyed, similar to the strata flown by Chase (2011), allowing for direct comparisons between the two dry season surveys. For the Mar12 wet season survey we flew the six FR, the Chobe NP riverfront and CH 5 (Kazuma or more commonly referred to Northern Plains/Seloko area). Survey Design
The survey used the standard methodology for strip-transect sampling (Norton-Griffiths 1978), which has been well established for aerial surveys of large African herbivores (Chase & Griffin 2009, Craig & Gibson 2002). This report follows the procedures and methodology used by Chase (2011) for conducting, analyzing and presenting wildlife aerial survey data. For a comprehensive explanation of the survey methodologies refer to this report (Chase 2011).
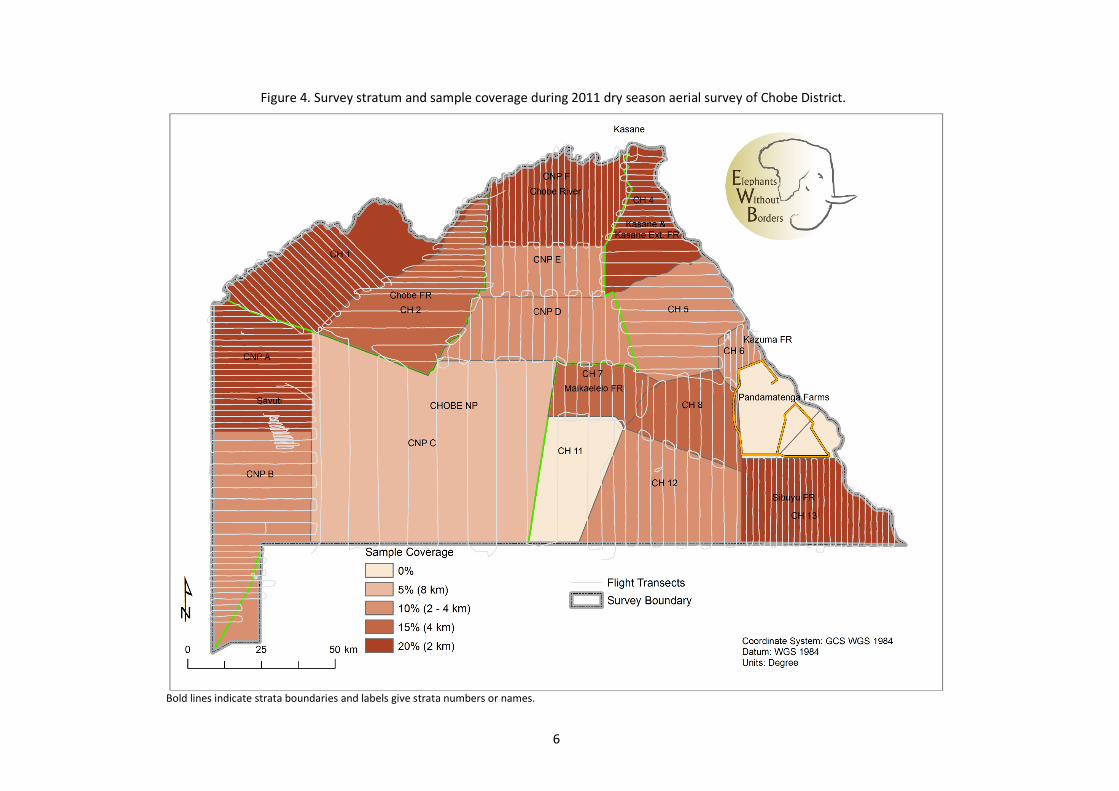
Prior to the Sept11 survey, the study area was subdivided into 16 strata1 (Figure 4). These
strata were delineated according to WMA number, protected status (land use), expected distribution and abundance of wildlife from prior surveys, elephant satellite telemetry data, consistency with methods used on previous surveys, and changes in land cover. To reduce sampling bias, we oriented systematic, parallel transects to correspond to the perpendicular gradient of major rivers, drainage valleys, environmental features, watercourses and fence lines. The position of the first transect in each stratum was determined randomly using the DNR Garmin Sampling Extension (Minnesota Department of Natural Resources) in ArcView (ESRI Redlands CA 2002).
In order to maximize the precision of the estimate of the total number of elephant in the area
sampled, the sampling intensity varied between strata. In areas designated for high intensity sampling, we spaced transects 2 km apart, providing ~ 20 % sampling coverage, with a strip width of ~ 400 m (i.e. combined width of the two search strips). Transects were spaced between 2 and 4 km apart in areas that we designated for moderate sampling intensity, providing a sampling coverage of ~ 15 %. Transects were spaced 8 km apart in two strata (Chinamaba and CH 11), were the expected density of wildlife is considered low during the dry season, providing a sampling coverage of ~ 5 % (Figure 4).
1 Stratum - is one ‘block’ of a sample area which has been partitioned into blocks/strata (plural = strata). Most stratum on
this survey were defined by the boundaries of WMAs. The results from the strata are then aggregated to make inferences about the population.
6
Figure 4. Survey stratum and sample coverage during 2011 dry season aerial survey of Chobe District.
Bold lines indicate strata boundaries and labels give strata numbers or names.
7
Flight Procedures and Observations For all strata we used the standard methodology for transect sampling developed by Norton-
Griffiths (1978).
During the survey observers were instructed to search for elephants, buffalo, eland, gemsbok, giraffe, hartebeest, hippo, impala, kudu, roan, sable, lechwe, tsessebe, warthog, wildebeest and zebra. In the tribal grazing areas, cattle were counted.
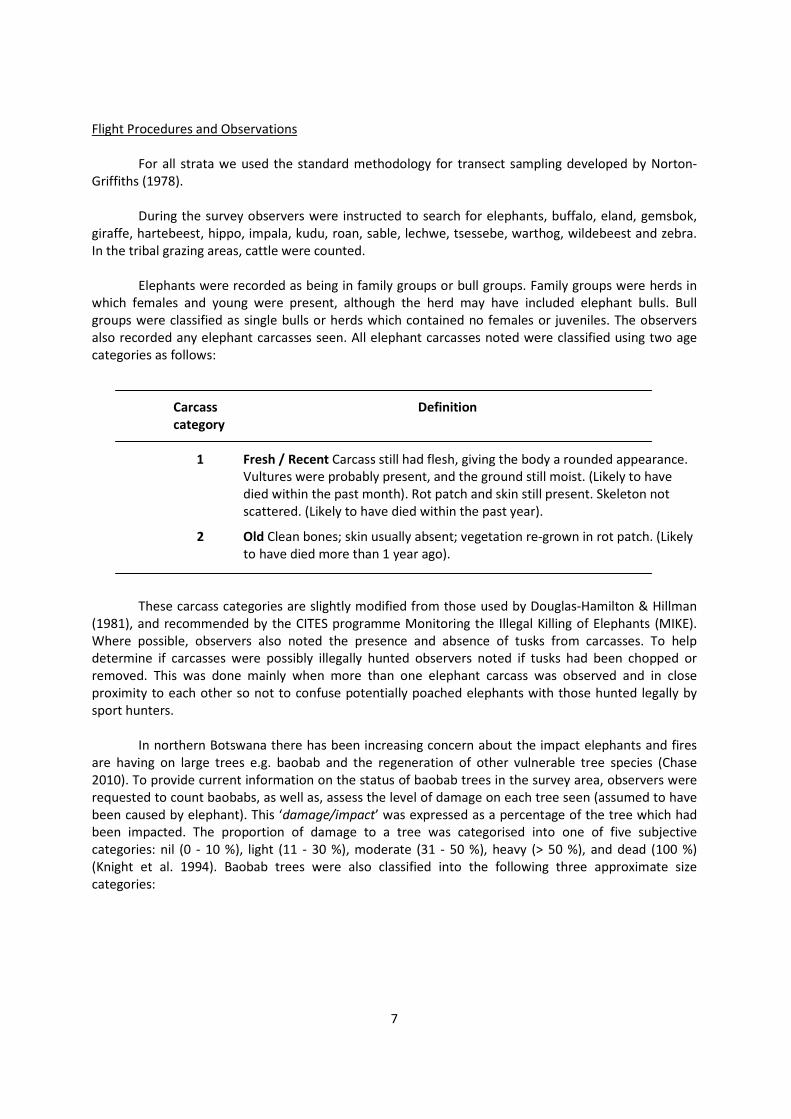
Elephants were recorded as being in family groups or bull groups. Family groups were herds in which females and young were present, although the herd may have included elephant bulls. Bull groups were classified as single bulls or herds which contained no females or juveniles. The observers also recorded any elephant carcasses seen. All elephant carcasses noted were classified using two age categories as follows:
Carcass Definition
category
1 Fresh / Recent Carcass still had flesh, giving the body a rounded appearance. Vultures were probably present, and the ground still moist. (Likely to have died within the past month). Rot patch and skin still present. Skeleton not scattered. (Likely to have died within the past year).
2 Old Clean bones; skin usually absent; vegetation re-grown in rot patch. (Likely to have died more than 1 year ago).
These carcass categories are slightly modified from those used by Douglas-Hamilton & Hillman (1981), and recommended by the CITES programme Monitoring the Illegal Killing of Elephants (MIKE). Where possible, observers also noted the presence and absence of tusks from carcasses. To help determine if carcasses were possibly illegally hunted observers noted if tusks had been chopped or removed. This was done mainly when more than one elephant carcass was observed and in close proximity to each other so not to confuse potentially poached elephants with those hunted legally by sport hunters. In northern Botswana there has been increasing concern about the impact elephants and fires are having on large trees e.g. baobab and the regeneration of other vulnerable tree species (Chase 2010). To provide current information on the status of baobab trees in the survey area, observers were requested to count baobabs, as well as, assess the level of damage on each tree seen (assumed to have been caused by elephant). This ‘damage/impact’ was expressed as a percentage of the tree which had been impacted. The proportion of damage to a tree was categorised into one of five subjective categories: nil (0 - 10 %), light (11 - 30 %), moderate (31 - 50 %), heavy (> 50 %), and dead (100 %) (Knight et al. 1994). Baobab trees were also classified into the following three approximate size categories:

8
Baobab size Definition
Small < 1.5 m in diameter Medium between 2.5 - 3 m in diameter. Large > 3 m in diameter.
All wildlife species seen during the survey were recorded, although estimates (and assessments) of some were likely to be either inaccurate or imprecise. Estimates of small or cryptic species and those whose behaviour (dive as the plane approaches) or habitat makes them difficult to see from the air can be inaccurate. Examples of these include kudu, lechwe, reedbuck, hippo and impala, among others. Rare species or those that have clumped distributions (such as lechwe, buffalo and zebra, respectively) tend to have imprecise estimates (Craig & Gibson 2002). We tried to address these concerns by stratification of survey effort and aerial photography, which are two technical tools frequently used to improve precision and accuracy of wildlife surveys, respectively. Strip Width and Calibration
Strip widths were delineated by two parallel aluminum wands connected to custom made brackets, which were attached to each wing strut of the aircraft. The wands could be moved in any direction during the setup phase to delineate a planned 200 m field of view for each strip for recording wildlife observations at an altitude of ~ 91.5 m.
Interval widths on each side of the plane were calibrated and confirmed prior to initiating a survey over each stratum. This was done by placing markers at measured distances (10 m apart) on an airstrip and conducting flyover tests. After repeated flyovers (at ~ 91.5 m) and photo verification, wands were adjusted to provide a designated field of view for each strip interval of ~ 200 m at appropriate flight altitude. The aluminum wands were attached to the struts for the duration of the survey. Transects were typically flown during morning hours (~ 07h00 - ~ 11h30); however, some were flown between 16h00 - 17h30 due logistical constraints.
Data Analysis
Strip Transect Sampling / Fixed-Wing Aerial Survey
Survey strata were largely delineated according to the boundaries of WMAs and protected areas to provide wildlife estimates specific to these areas. Prior to surveying Chobe NP, the survey team conducted reconnaissance flights to determine the density of elephants. Chobe NP was then subdivided into six strata based upon elephant and wildlife sightings on these reconnaissance flights. Two strata (Kasane Forest Reserve and CH 5) were both flown as single strata but subdivided prior to data analysis. The entire survey area, in this report is termed ‘Chobe District’, the survey area covered the entire part of the Chobe District’ and the term is used in reference to the area sampled (22560 km2).
Following the guidelines developed by Norton-Griffiths (1978) we calculated abundance for
individual strata from wildlife counted within the 200 m wide intervals. We adjusted for altitude and photo corrections and used the traditional Jolly’s Method II for unequal sized sampling units (Jolly 1969)
9
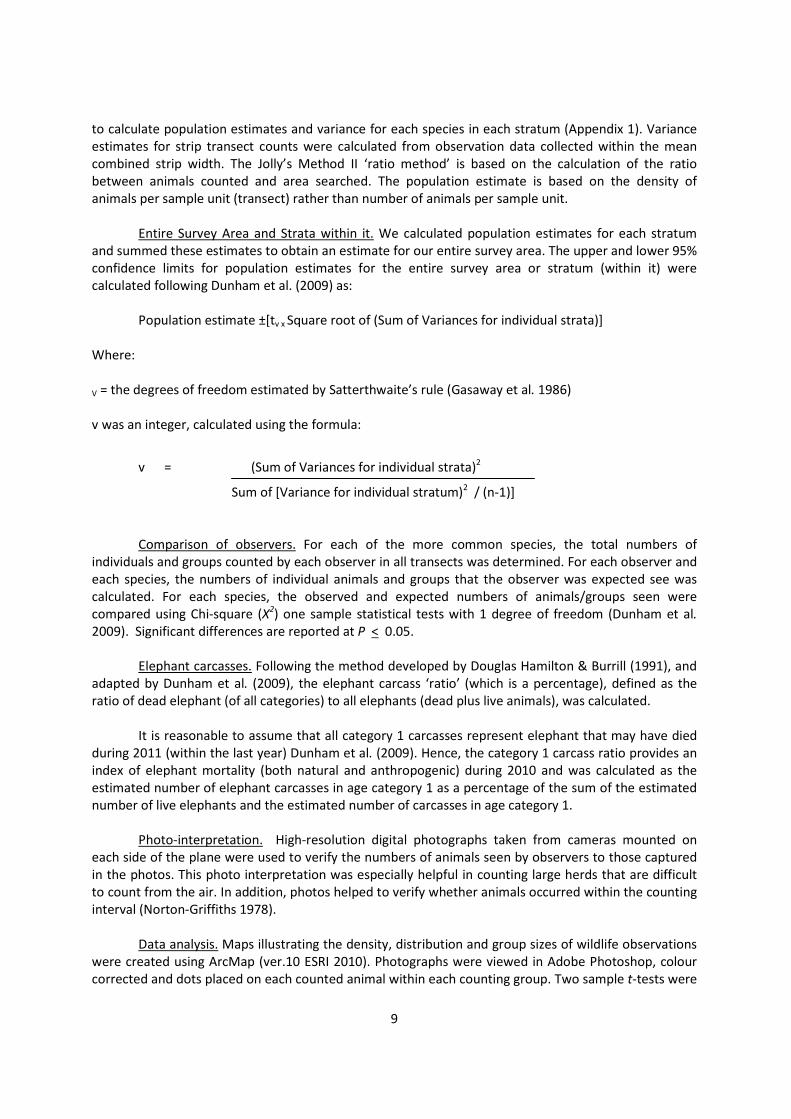
to calculate population estimates and variance for each species in each stratum (Appendix 1). Variance estimates for strip transect counts were calculated from observation data collected within the mean combined strip width. The Jolly’s Method II ‘ratio method’ is based on the calculation of the ratio between animals counted and area searched. The population estimate is based on the density of animals per sample unit (transect) rather than number of animals per sample unit.
Entire Survey Area and Strata within it. We calculated population estimates for each stratum and summed these estimates to obtain an estimate for our entire survey area. The upper and lower 95% confidence limits for population estimates for the entire survey area or stratum (within it) were calculated following Dunham et al. (2009) as:
Population estimate ±[tv x Square root of (Sum of Variances for individual strata)] Where:
V = the degrees of freedom estimated by Satterthwaite’s rule (Gasaway et al. 1986) v was an integer, calculated using the formula:
v = (Sum of Variances for individual strata)2
Sum of [Variance for individual stratum)2 / (n-1)]
Comparison of observers. For each of the more common species, the total numbers of
individuals and groups counted by each observer in all transects was determined. For each observer and each species, the numbers of individual animals and groups that the observer was expected see was calculated. For each species, the observed and expected numbers of animals/groups seen were compared using Chi-square (X2) one sample statistical tests with 1 degree of freedom (Dunham et al. 2009). Significant differences are reported at P < 0.05.
Elephant carcasses. Following the method developed by Douglas Hamilton & Burrill (1991), and
adapted by Dunham et al. (2009), the elephant carcass ‘ratio’ (which is a percentage), defined as the ratio of dead elephant (of all categories) to all elephants (dead plus live animals), was calculated.
It is reasonable to assume that all category 1 carcasses represent elephant that may have died during 2011 (within the last year) Dunham et al. (2009). Hence, the category 1 carcass ratio provides an index of elephant mortality (both natural and anthropogenic) during 2010 and was calculated as the estimated number of elephant carcasses in age category 1 as a percentage of the sum of the estimated number of live elephants and the estimated number of carcasses in age category 1.
Photo-interpretation. High-resolution digital photographs taken from cameras mounted on
each side of the plane were used to verify the numbers of animals seen by observers to those captured in the photos. This photo interpretation was especially helpful in counting large herds that are difficult to count from the air. In addition, photos helped to verify whether animals occurred within the counting interval (Norton-Griffiths 1978).
Data analysis. Maps illustrating the density, distribution and group sizes of wildlife observations
were created using ArcMap (ver.10 ESRI 2010). Photographs were viewed in Adobe Photoshop, colour corrected and dots placed on each counted animal within each counting group. Two sample t-tests were
10
used to compare the sizes of baobab trees and a Rank Correlation test was used to determine the relationship between elephant density and baobab damage east (NG 26) and west (NG 8) of the Southern Buffalo Fence. SYSTAT® 10.2 and Excel® were used for all statistical analyses. Search Effort
The greater the time spent searching each square kilometer of a transect, the greater the probability that the observer saw animals that occurred within the counting strip. Search effort (in minutes per sq km) for a stratum was defined as the total time spent flying all transects within that stratum, divided by the total area of those same transects (Gasaway et al. 1986). Aerial surveys inherently underestimate wildlife numbers, with the degree of underestimation greater for small or cryptic species than for larger species. However, population estimates are given for all species, because the estimates provide useful indices of abundance (with measures of precision) that can be used to determine spatial distribution, as well as, temporal trends in population numbers (Dunham et al. 2009). Other than the observations which were corrected by reference to photographs, no other corrections have been applied to any estimates to compensate for any undercounting or missed animals.
Results
Sampling Effort
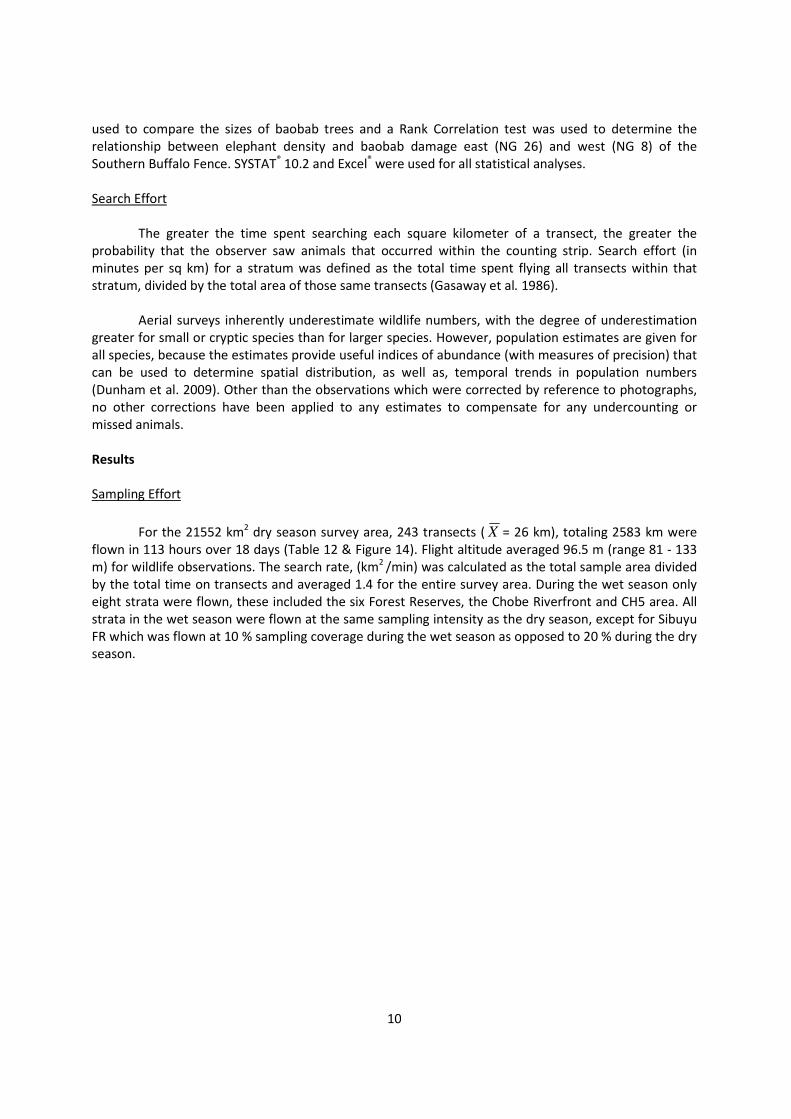
For the 21552 km2 dry season survey area, 243 transects ( X = 26 km), totaling 2583 km were flown in 113 hours over 18 days (Table 12 & Figure 14). Flight altitude averaged 96.5 m (range 81 - 133 m) for wildlife observations. The search rate, (km2 /min) was calculated as the total sample area divided by the total time on transects and averaged 1.4 for the entire survey area. During the wet season only eight strata were flown, these included the six Forest Reserves, the Chobe Riverfront and CH5 area. All strata in the wet season were flown at the same sampling intensity as the dry season, except for Sibuyu FR which was flown at 10 % sampling coverage during the wet season as opposed to 20 % during the dry season.
11
Estimates
The estimated numbers of elephants, elephant bulls, elephant family groups, elephant carcasses (age category 1 = elephant carcass and, 2 = elephant bones), buffalo, eland, giraffe, gemsbok, hippopotamus, impala, kudu, roan, sable, tsessebe, wildebeest, zebra, ostrich, baobab trees and cattle are given in Tables 13 to 32, respectively. Estimates are given for each stratum, for various land units within the survey area (WMAs, protected areas and district estimates) and for the entire survey area. There may appear to be small arithmetic errors in some tables, but these are rounding errors. The columns in the abundance estimate tables provide:
• the name of stratum,
• the estimate of the number of animals of that species in that stratum, in other words the population estimate,
• the number of individuals of that species seen (No. seen) inside the search strips during the survey of that stratum,
• the variance of the estimate number of animals in that stratum,
• the 95 % confidence interval of the population estimate for that species in the stratum, as a percentage of the population estimate for that stratum (% CI),
• the lower 95 % confidence limit of the population estimate (Lower CL),
• the upper 95 % confidence limit of the population estimate (Upper CL), and
• the density (estimate of animals per km2) was calculated using the stratum area. Density estimates were calculated for those strata in which the animals occurred or where animals were not observed but are known to occur.
The last row of each table gives the same measures of the entire survey area and additional
rows give subtotals for various land units within the survey area. If the calculated lower confidence limit (Lower CL), was less than the actual number of elephants counted within the strip (No. seen), then it is biologically meaningful to replace the calculated lower confidence limit with the number seen (Chase & Griffin 2009, Dunham et al. 2009).
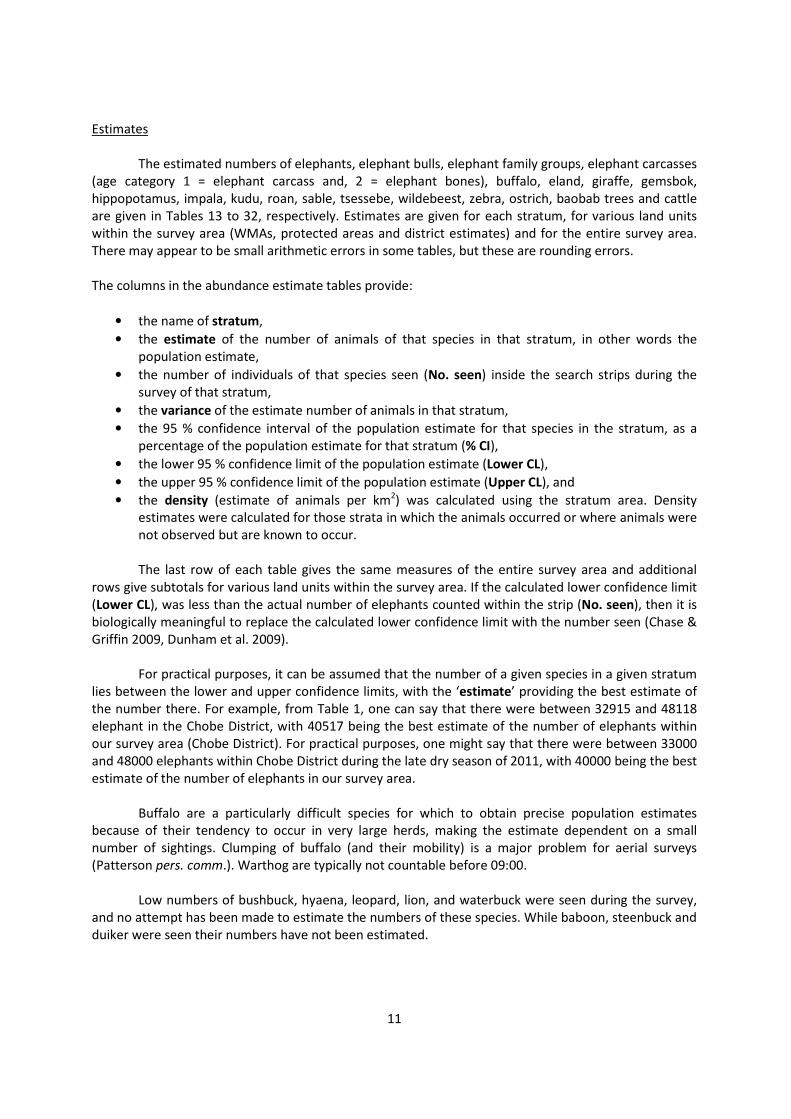
For practical purposes, it can be assumed that the number of a given species in a given stratum
lies between the lower and upper confidence limits, with the ‘estimate’ providing the best estimate of the number there. For example, from Table 1, one can say that there were between 32915 and 48118 elephant in the Chobe District, with 40517 being the best estimate of the number of elephants within our survey area (Chobe District). For practical purposes, one might say that there were between 33000 and 48000 elephants within Chobe District during the late dry season of 2011, with 40000 being the best estimate of the number of elephants in our survey area.
Buffalo are a particularly difficult species for which to obtain precise population estimates
because of their tendency to occur in very large herds, making the estimate dependent on a small number of sightings. Clumping of buffalo (and their mobility) is a major problem for aerial surveys (Patterson pers. comm.). Warthog are typically not countable before 09:00.
Low numbers of bushbuck, hyaena, leopard, lion, and waterbuck were seen during the survey,
and no attempt has been made to estimate the numbers of these species. While baboon, steenbuck and duiker were seen their numbers have not been estimated.
12
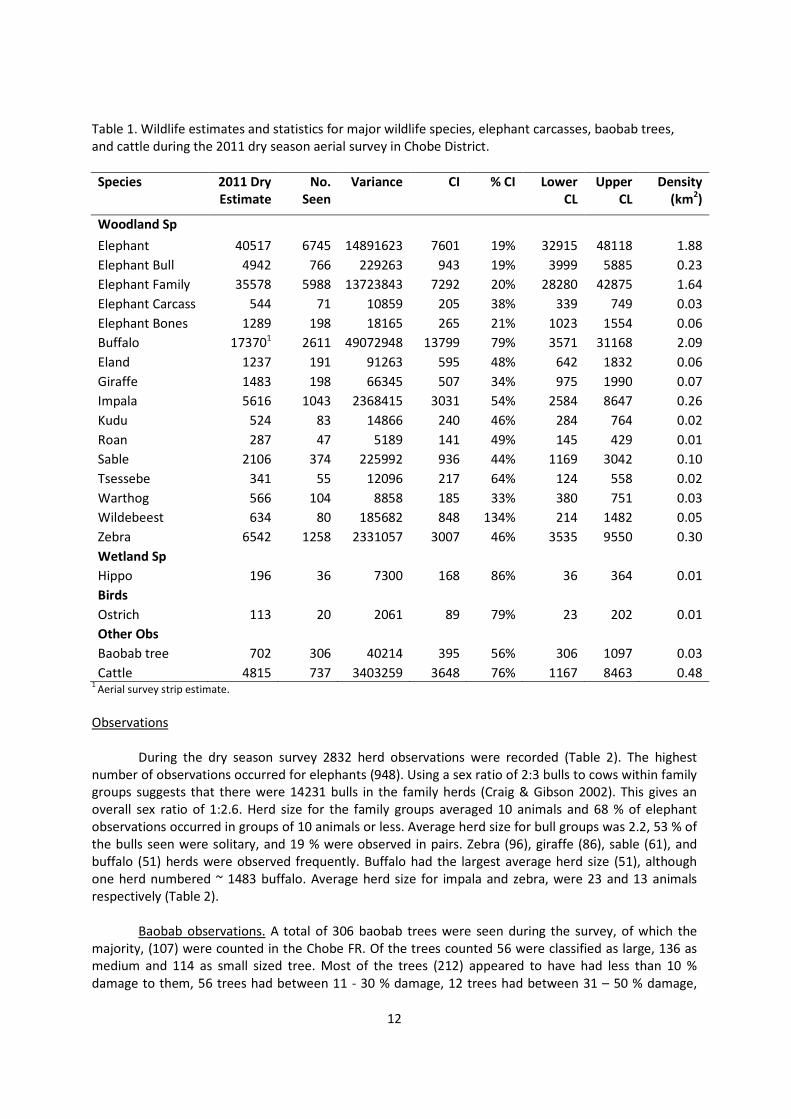
Table 1. Wildlife estimates and statistics for major wildlife species, elephant carcasses, baobab trees, and cattle during the 2011 dry season aerial survey in Chobe District.
Species 2011 Dry
Estimate
No.
Seen
Variance CI % CI Lower
CL
Upper
CL
Density
(km2)
Woodland Sp
Elephant 40517 6745 14891623 7601 19% 32915 48118 1.88
Elephant Bull 4942 766 229263 943 19% 3999 5885 0.23
Elephant Family 35578 5988 13723843 7292 20% 28280 42875 1.64
Elephant Carcass 544 71 10859 205 38% 339 749 0.03
Elephant Bones 1289 198 18165 265 21% 1023 1554 0.06
Buffalo 173701 2611 49072948 13799 79% 3571 31168 2.09
Eland 1237 191 91263 595 48% 642 1832 0.06
Giraffe 1483 198 66345 507 34% 975 1990 0.07
Impala 5616 1043 2368415 3031 54% 2584 8647 0.26
Kudu 524 83 14866 240 46% 284 764 0.02
Roan 287 47 5189 141 49% 145 429 0.01
Sable 2106 374 225992 936 44% 1169 3042 0.10
Tsessebe 341 55 12096 217 64% 124 558 0.02
Warthog 566 104 8858 185 33% 380 751 0.03
Wildebeest 634 80 185682 848 134% 214 1482 0.05
Zebra 6542 1258 2331057 3007 46% 3535 9550 0.30
Wetland Sp
Hippo 196 36 7300 168 86% 36 364 0.01
Birds
Ostrich 113 20 2061 89 79% 23 202 0.01
Other Obs
Baobab tree 702 306 40214 395 56% 306 1097 0.03
Cattle 4815 737 3403259 3648 76% 1167 8463 0.48 1
Aerial survey strip estimate.
Observations
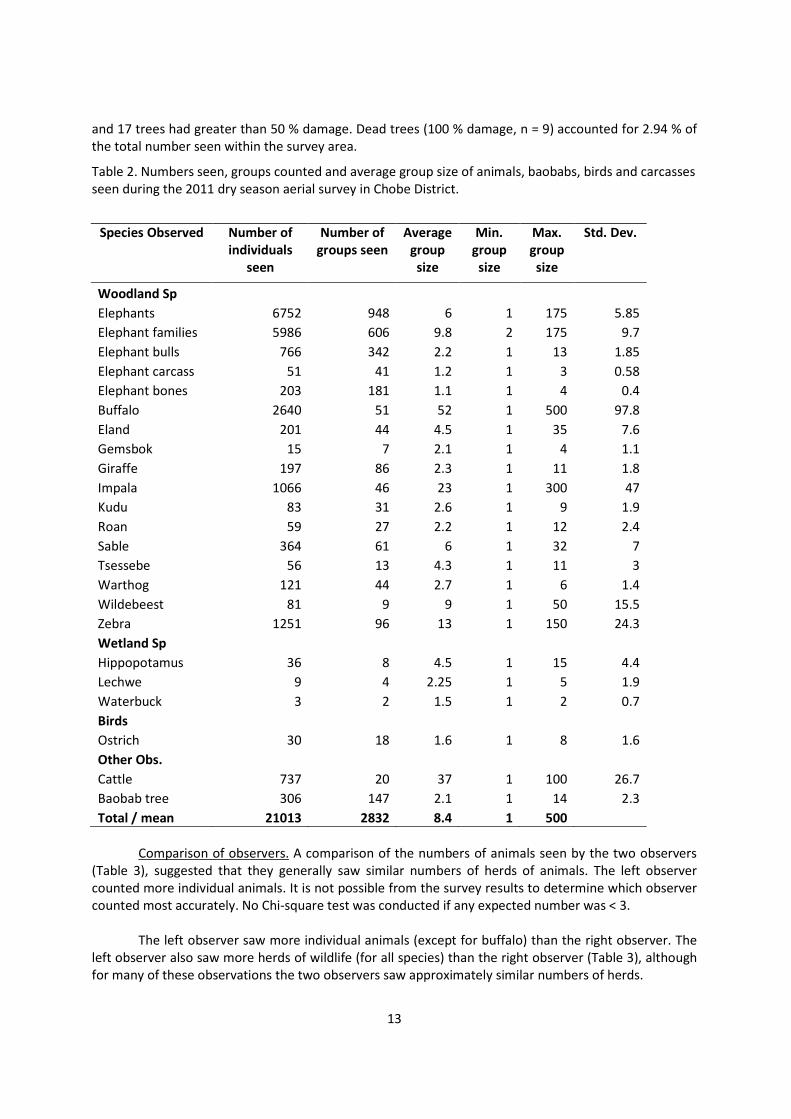
During the dry season survey 2832 herd observations were recorded (Table 2). The highest number of observations occurred for elephants (948). Using a sex ratio of 2:3 bulls to cows within family groups suggests that there were 14231 bulls in the family herds (Craig & Gibson 2002). This gives an overall sex ratio of 1:2.6. Herd size for the family groups averaged 10 animals and 68 % of elephant observations occurred in groups of 10 animals or less. Average herd size for bull groups was 2.2, 53 % of the bulls seen were solitary, and 19 % were observed in pairs. Zebra (96), giraffe (86), sable (61), and buffalo (51) herds were observed frequently. Buffalo had the largest average herd size (51), although one herd numbered ~ 1483 buffalo. Average herd size for impala and zebra, were 23 and 13 animals respectively (Table 2).
Baobab observations. A total of 306 baobab trees were seen during the survey, of which the
majority, (107) were counted in the Chobe FR. Of the trees counted 56 were classified as large, 136 as medium and 114 as small sized tree. Most of the trees (212) appeared to have had less than 10 % damage to them, 56 trees had between 11 - 30 % damage, 12 trees had between 31 – 50 % damage,
13
and 17 trees had greater than 50 % damage. Dead trees (100 % damage, n = 9) accounted for 2.94 % of the total number seen within the survey area.
Table 2. Numbers seen, groups counted and average group size of animals, baobabs, birds and carcasses seen during the 2011 dry season aerial survey in Chobe District.
Species Observed Number of
individuals
seen
Number of
groups seen
Average
group
size
Min.
group
size
Max.
group
size
Std. Dev.
Woodland Sp
Elephants 6752 948 6 1 175 5.85
Elephant families 5986 606 9.8 2 175 9.7
Elephant bulls 766 342 2.2 1 13 1.85
Elephant carcass 51 41 1.2 1 3 0.58
Elephant bones 203 181 1.1 1 4 0.4
Buffalo 2640 51 52 1 500 97.8
Eland 201 44 4.5 1 35 7.6
Gemsbok 15 7 2.1 1 4 1.1
Giraffe 197 86 2.3 1 11 1.8
Impala 1066 46 23 1 300 47
Kudu 83 31 2.6 1 9 1.9
Roan 59 27 2.2 1 12 2.4
Sable 364 61 6 1 32 7
Tsessebe 56 13 4.3 1 11 3
Warthog 121 44 2.7 1 6 1.4
Wildebeest 81 9 9 1 50 15.5
Zebra 1251 96 13 1 150 24.3
Wetland Sp
Hippopotamus 36 8 4.5 1 15 4.4
Lechwe 9 4 2.25 1 5 1.9
Waterbuck 3 2 1.5 1 2 0.7
Birds
Ostrich 30 18 1.6 1 8 1.6
Other Obs.
Cattle 737 20 37 1 100 26.7
Baobab tree 306 147 2.1 1 14 2.3
Total / mean 21013 2832 8.4 1 500
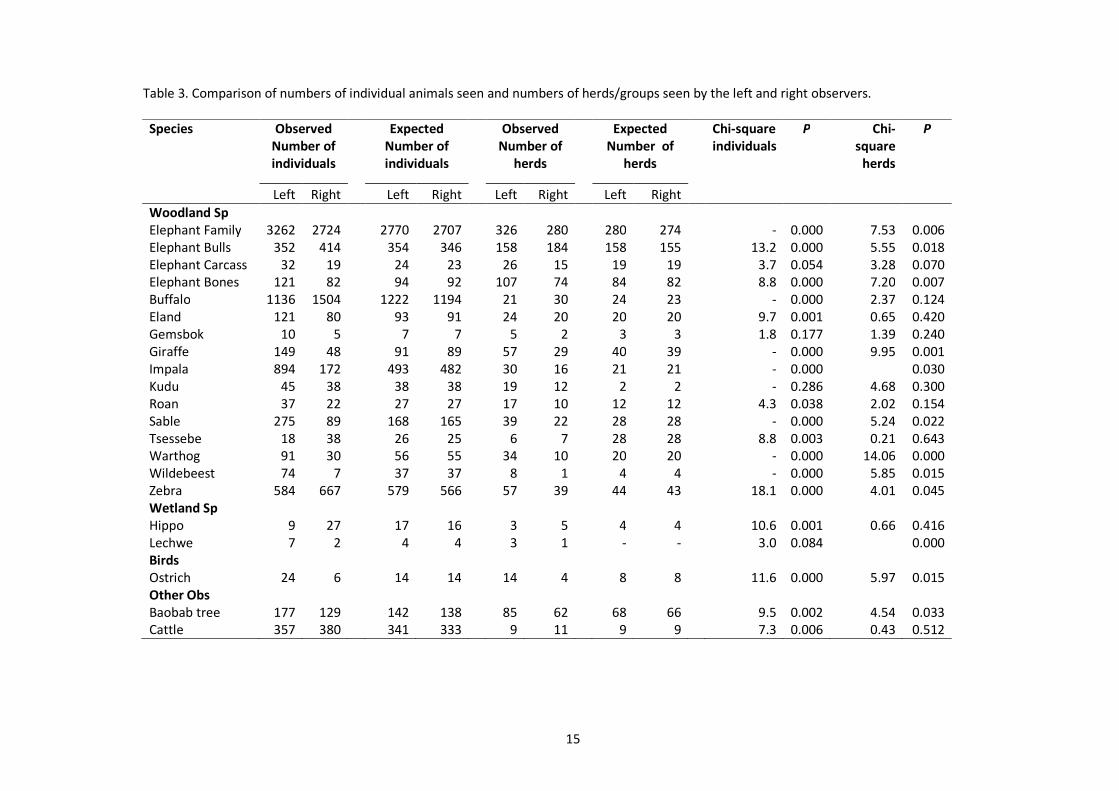
Comparison of observers. A comparison of the numbers of animals seen by the two observers
(Table 3), suggested that they generally saw similar numbers of herds of animals. The left observer counted more individual animals. It is not possible from the survey results to determine which observer counted most accurately. No Chi-square test was conducted if any expected number was < 3. The left observer saw more individual animals (except for buffalo) than the right observer. The left observer also saw more herds of wildlife (for all species) than the right observer (Table 3), although for many of these observations the two observers saw approximately similar numbers of herds.
14
Some species (e.g. buffalo, impala and zebra) often occur in relatively large herds. Furthermore, relatively few groups of these same species are seen during the survey. Hence, some of the differences, while statistically significant, are probably a consequence of chance. However, differences were found for most species, the left observer saw more animals than expected if the observers were of similar efficiency.
Elephant carcasses. Observers counted 51 recent elephant carcasses (i.e. age category 1) during the survey. The majority of elephant carcasses seen were bones and occurred in the age category 2 (n = 203). Douglas-Hamilton et al. (1991) suggest a carcass ratio of 2 – 8 % as being normal for a stable or increasing population. The estimated total number of elephant carcasses (1651) in the survey area during the dry season of 2011 represented 3.92 % of the estimated total number of live and dead elephants. The estimate for recent or fresh (category 1) carcasses was 362, representing a carcass ratio of .9 % (which reflects the mortality rate of elephant during the survey year). Elephant carcass estimates for protected (851) and unprotected areas (800) were similar. Most (15.7 %) of the total estimated elephant carcasses occurred in the Phofu stratum within Chobe NP (259), accounting for 41 % of the estimated total number of live and dead elephants, and a mortality rate of 13.32 % in this strata. More than 58 % (952) of the total estimate for all carcass categories were seen in four strata, Phofu, Nogatsaa, Chobe River and Chobe FR.
Of the 11 fresh elephant carcasses seen during the entire survey 24 occurred in the Phofu- Nogatsaa and CH 5 region, of which observers assumed that 52 % had been killed by poachers. This number is a reliable estimate based upon fresh carcasses which were observed in non-sport hunting concessions, carcasses which appeared to have had their tusks chopped out, and the occurrence of more than one carcass in close proximity to each other. Wildlife officials may have removed tusks from these elephant carcasses, but it is unlikely given the remote areas where carcasses were observed. Nearly a quarter (21 %) of the estimated total number of elephant carcasses occurred in the Chobe Enclave.
15
Table 3. Comparison of numbers of individual animals seen and numbers of herds/groups seen by the left and right observers.
Species Observed
Number of
individuals
Expected
Number of
individuals
Observed
Number of
herds
Expected
Number of
herds
Chi-square
individuals
P Chi-
square
herds
P
Left Right Left Right Left Right Left Right
Woodland Sp Elephant Family 3262 2724 2770 2707 326 280 280 274 - 0.000 7.53 0.006 Elephant Bulls 352 414 354 346 158 184 158 155 13.2 0.000 5.55 0.018 Elephant Carcass 32 19 24 23 26 15 19 19 3.7 0.054 3.28 0.070 Elephant Bones 121 82 94 92 107 74 84 82 8.8 0.000 7.20 0.007 Buffalo 1136 1504 1222 1194 21 30 24 23 - 0.000 2.37 0.124 Eland 121 80 93 91 24 20 20 20 9.7 0.001 0.65 0.420 Gemsbok 10 5 7 7 5 2 3 3 1.8 0.177 1.39 0.240 Giraffe 149 48 91 89 57 29 40 39 - 0.000 9.95 0.001 Impala 894 172 493 482 30 16 21 21 - 0.000 0.030 Kudu 45 38 38 38 19 12 2 2 - 0.286 4.68 0.300 Roan 37 22 27 27 17 10 12 12 4.3 0.038 2.02 0.154 Sable 275 89 168 165 39 22 28 28 - 0.000 5.24 0.022 Tsessebe 18 38 26 25 6 7 28 28 8.8 0.003 0.21 0.643 Warthog 91 30 56 55 34 10 20 20 - 0.000 14.06 0.000 Wildebeest 74 7 37 37 8 1 4 4 - 0.000 5.85 0.015 Zebra 584 667 579 566 57 39 44 43 18.1 0.000 4.01 0.045 Wetland Sp Hippo 9 27 17 16 3 5 4 4 10.6 0.001 0.66 0.416 Lechwe 7 2 4 4 3 1 - - 3.0 0.084 0.000 Birds Ostrich 24 6 14 14 14 4 8 8 11.6 0.000 5.97 0.015 Other Obs Baobab tree 177 129 142 138 85 62 68 66 9.5 0.002 4.54 0.033 Cattle 357 380 341 333 9 11 9 9 7.3 0.006 0.43 0.512
16
Wildlife Distributions
The spatial distribution of wildlife is illustrated in Figures 12 to 30. On most maps, the distribution is shown in two ways. First, each stratum is shaded to represent the average density of the given species in that stratum. Secondly, the locations of sightings of groups of the given species, together with an indication of the size of group/herd are depicted by points of varying sizes. It should be remembered that the recorded number of groups of any species was determined by both group density and sampling intensity – which, by design varied between strata (Table 12). The distribution of animals during the 2011 dry season was generally similar to that seen to the previous year’s aerial survey (Chase 2011). Most animals were found within 30 km of the major perennial rivers. Wildlife densities were lowest in the dry interiors of south east Chobe NP, and adjoining CH 11 WMA.
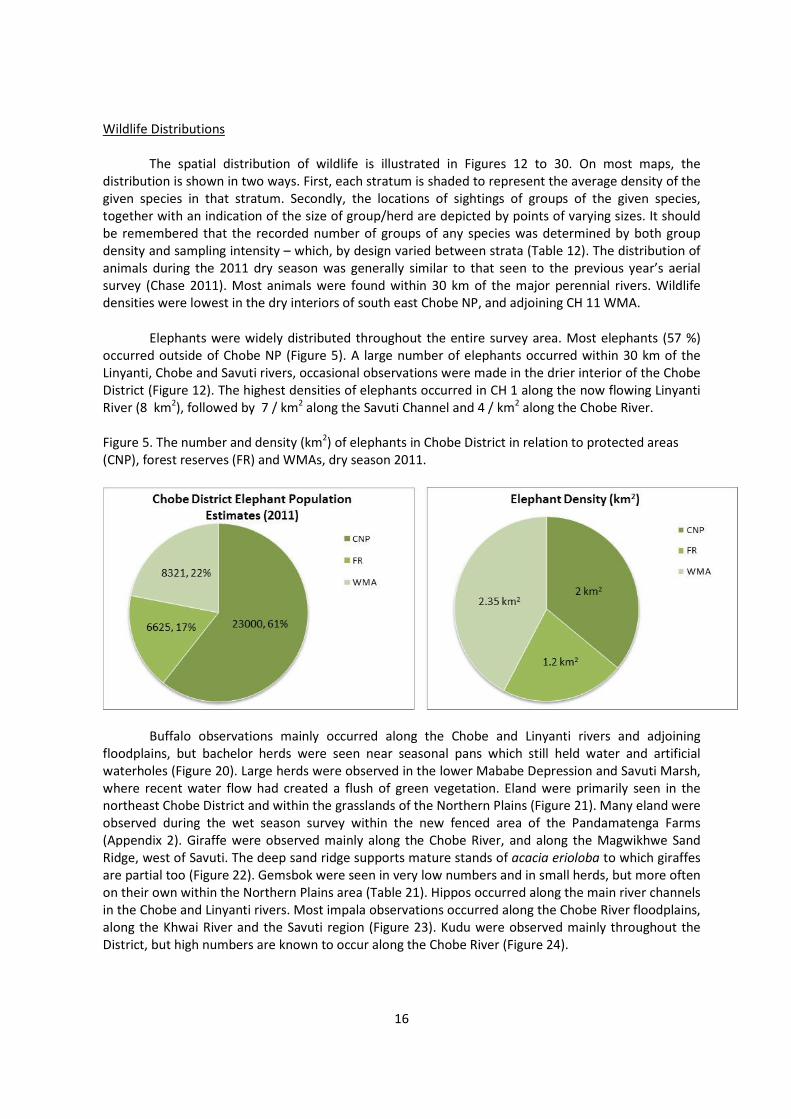
Elephants were widely distributed throughout the entire survey area. Most elephants (57 %)
occurred outside of Chobe NP (Figure 5). A large number of elephants occurred within 30 km of the Linyanti, Chobe and Savuti rivers, occasional observations were made in the drier interior of the Chobe District (Figure 12). The highest densities of elephants occurred in CH 1 along the now flowing Linyanti River (8 km2), followed by 7 / km2 along the Savuti Channel and 4 / km2 along the Chobe River. Figure 5. The number and density (km2) of elephants in Chobe District in relation to protected areas (CNP), forest reserves (FR) and WMAs, dry season 2011.
Buffalo observations mainly occurred along the Chobe and Linyanti rivers and adjoining
floodplains, but bachelor herds were seen near seasonal pans which still held water and artificial waterholes (Figure 20). Large herds were observed in the lower Mababe Depression and Savuti Marsh, where recent water flow had created a flush of green vegetation. Eland were primarily seen in the northeast Chobe District and within the grasslands of the Northern Plains (Figure 21). Many eland were observed during the wet season survey within the new fenced area of the Pandamatenga Farms (Appendix 2). Giraffe were observed mainly along the Chobe River, and along the Magwikhwe Sand Ridge, west of Savuti. The deep sand ridge supports mature stands of acacia erioloba to which giraffes are partial too (Figure 22). Gemsbok were seen in very low numbers and in small herds, but more often on their own within the Northern Plains area (Table 21). Hippos occurred along the main river channels in the Chobe and Linyanti rivers. Most impala observations occurred along the Chobe River floodplains, along the Khwai River and the Savuti region (Figure 23). Kudu were observed mainly throughout the District, but high numbers are known to occur along the Chobe River (Figure 24).
17
Roan observations were limited (27), and mainly observed in small groups (3 - 5). Most observations were made in the Linyanti region, the Northern Plains appear to be a critical wet season habitat for these animals (Figure 25). Sable were mostly seen in the northeast parts of the District within the Kasane Forest Reserve and Chobe River stratum (Figure 26). Tsessebe were mainly seen ~ 20 km south of the Chobe River and on the Northern Plains in CH 5 (Figure 27). Wildebeest were rarely observed, and were only seen within the Savuti region and along the Khwai River (Figure 28). Zebra occurred mainly along the Chobe and Linyanti floodplains. Just one herd of zebra were seen on the Savuti Marsh despite this area having water (Figure 29). Ostrich occurred throughout the survey area but at relatively low numbers (Table 30). In the multi-use concessions which allow agriculture, many cattle were observed. Cattle were distributed in the Chobe Enclave and within the Kasane FR and CH 5 areas (Figure 30). Baobab trees occurred throughout the survey area (Figure 31). Important baobab habitat included the Kachikau ridge, the Northern Plains – Kasane FR ecotone and northern Sibuyu FR. Cattle Distribution
The survey was flown mainly over wildlife conservation areas, but within the six FR, CH 1 and CH 5 WMAs cattle farming (grazing rights in the case of the FR) is permitted under a multiple land use system (Table 31). The Chobe FR and CH 1 areas had an estimated 4815 cattle. The density estimate of 3 cattle / km2 is misleading, as the density estimate incorporates the entire Chobe FR, and areas where cattle do not occur. Given that cattle mainly occur within 10 km of villages, the density of cattle within 10 km of the Linyanti River (along the Kachikau Rd) increases significantly to approximately 20 cattle / km2.
A comparison of wildlife density and distribution shows that there is a clear separation
between areas of high cattle and high wildlife numbers. Wildlife density within 10 km of the Chobe Enclave villages is low. Where people and livestock are concentrated, wildlife populations are lower.
Trends in Elephant Numbers in Chobe District
In 1993, the DWNP standardized their aerial survey methods. Since then, nine aerial surveys of wildlife in northern Botswana have been flown (DWNP 1993, DWNP 1994, DWNP 1996, DWNP 1999, DWNP 2001, DWNP 2002, DWNP 2003, DWNP 2004, and this survey). Wildlife population estimates for Chobe District and Chobe NP were compared to the DWNP aerial survey estimates. For all stratum the areas covered by the surveys were similar and survey intensity for a few strata varied between the Chase (2010 and 2011) and the DWNP (1993 -2004) surveys. The time series of population estimates for Chobe District and Chobe NP were examined to determine trends over the past 17 years (Table 4 and Figure 6).
Elephant population estimates derived from the nine aerial surveys suggests that Chobe’s elephant population increased during the early 1990s. From 2004 however, elephant population estimates in Chobe District and Chobe NP have remained similar or declined. This suggests that the elephant population has remained stable.
18
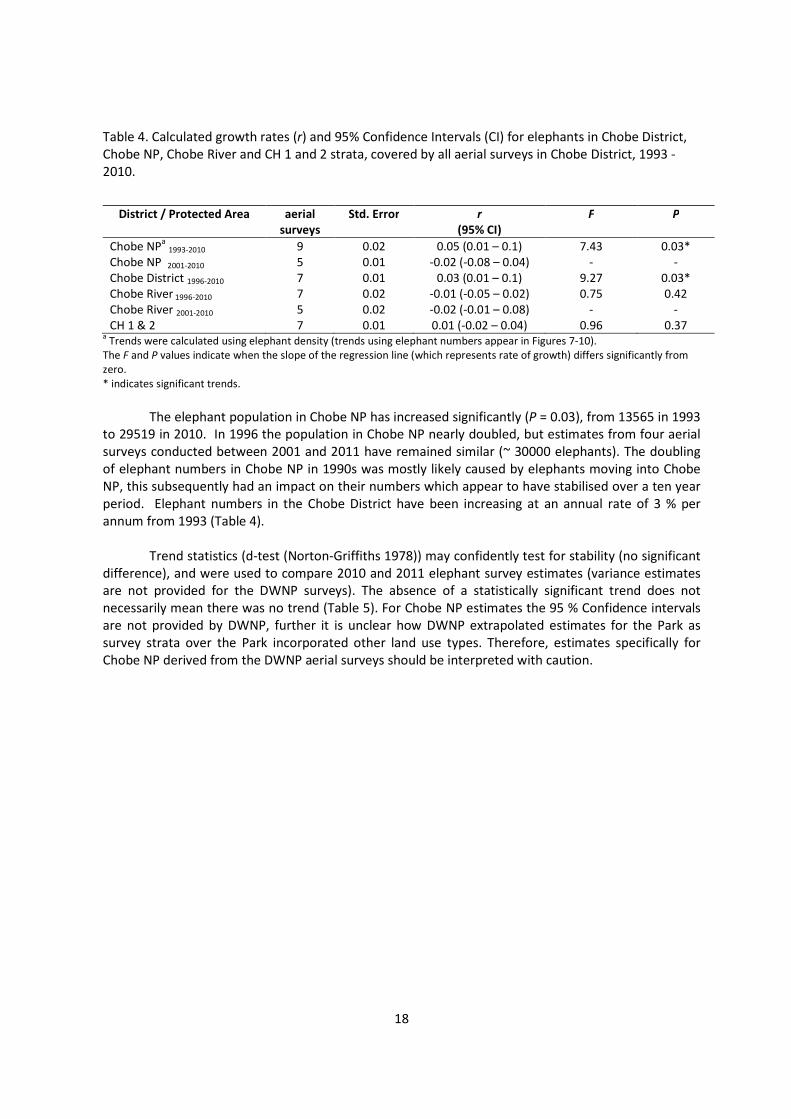
Table 4. Calculated growth rates (r) and 95% Confidence Intervals (CI) for elephants in Chobe District, Chobe NP, Chobe River and CH 1 and 2 strata, covered by all aerial surveys in Chobe District, 1993 - 2010.
District / Protected Area aerial
surveys
Std. Error r
(95% CI)
F P
Chobe NPa 1993-2010 9 0.02 0.05 (0.01 – 0.1) 7.43 0.03*
Chobe NP 2001-2010 5 0.01 -0.02 (-0.08 – 0.04) - - Chobe District 1996-2010 7 0.01 0.03 (0.01 – 0.1) 9.27 0.03* Chobe River
1996-2010 7 0.02 -0.01 (-0.05 – 0.02) 0.75 0.42
Chobe River 2001-2010 5 0.02 -0.02 (-0.01 – 0.08) - - CH 1 & 2 7 0.01 0.01 (-0.02 – 0.04) 0.96 0.37
a Trends were calculated using elephant density (trends using elephant numbers appear in Figures 7-10).
The F and P values indicate when the slope of the regression line (which represents rate of growth) differs significantly from zero. * indicates significant trends.
The elephant population in Chobe NP has increased significantly (P = 0.03), from 13565 in 1993
to 29519 in 2010. In 1996 the population in Chobe NP nearly doubled, but estimates from four aerial surveys conducted between 2001 and 2011 have remained similar (~ 30000 elephants). The doubling of elephant numbers in Chobe NP in 1990s was mostly likely caused by elephants moving into Chobe NP, this subsequently had an impact on their numbers which appear to have stabilised over a ten year period. Elephant numbers in the Chobe District have been increasing at an annual rate of 3 % per annum from 1993 (Table 4).
Trend statistics (d-test (Norton-Griffiths 1978)) may confidently test for stability (no significant
difference), and were used to compare 2010 and 2011 elephant survey estimates (variance estimates are not provided for the DWNP surveys). The absence of a statistically significant trend does not necessarily mean there was no trend (Table 5). For Chobe NP estimates the 95 % Confidence intervals are not provided by DWNP, further it is unclear how DWNP extrapolated estimates for the Park as survey strata over the Park incorporated other land use types. Therefore, estimates specifically for Chobe NP derived from the DWNP aerial surveys should be interpreted with caution.
19
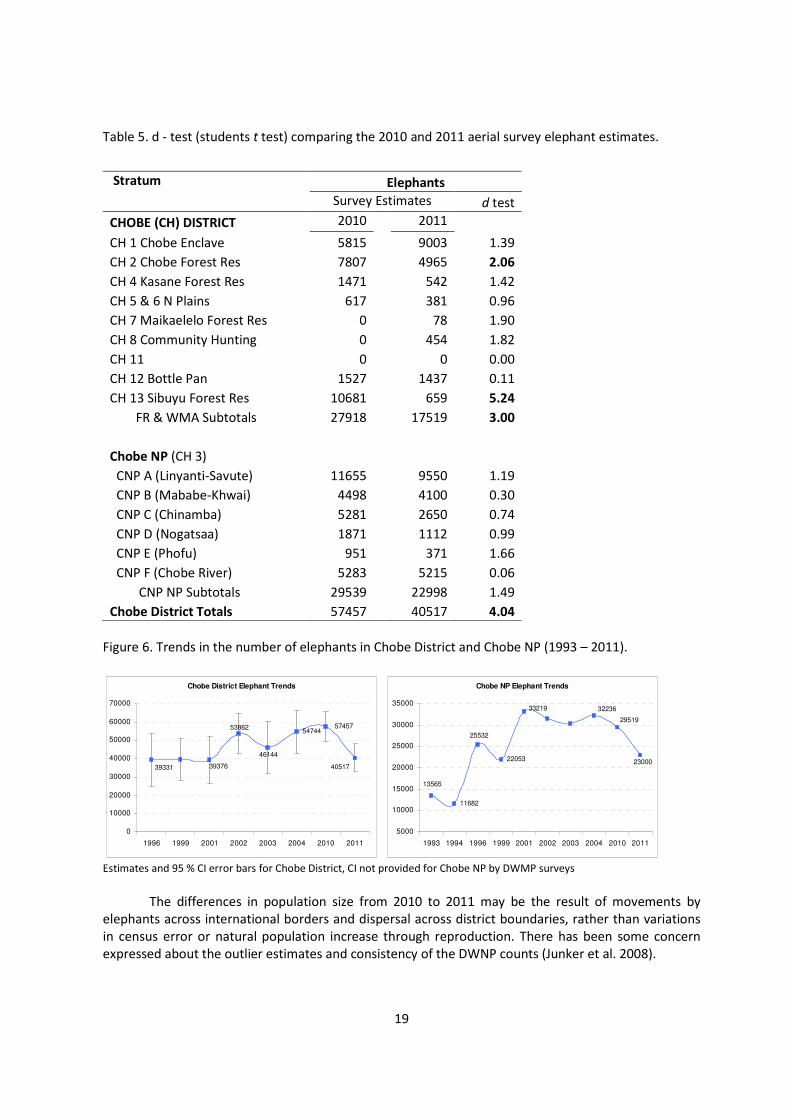
Table 5. d - test (students t test) comparing the 2010 and 2011 aerial survey elephant estimates.
Stratum Elephants
Survey Estimates d test
CHOBE (CH) DISTRICT 2010 2011
CH 1 Chobe Enclave 5815 9003 1.39
CH 2 Chobe Forest Res 7807 4965 2.06
CH 4 Kasane Forest Res 1471 542 1.42
CH 5 & 6 N Plains 617 381 0.96
CH 7 Maikaelelo Forest Res 0 78 1.90
CH 8 Community Hunting 0 454 1.82
CH 11 0 0 0.00
CH 12 Bottle Pan 1527 1437 0.11
CH 13 Sibuyu Forest Res 10681 659 5.24
FR & WMA Subtotals 27918 17519 3.00
Chobe NP (CH 3)
CNP A (Linyanti-Savute) 11655 9550 1.19
CNP B (Mababe-Khwai) 4498 4100 0.30
CNP C (Chinamba) 5281 2650 0.74
CNP D (Nogatsaa) 1871 1112 0.99
CNP E (Phofu) 951 371 1.66
CNP F (Chobe River) 5283 5215 0.06
CNP NP Subtotals 29539 22998 1.49
Chobe District Totals 57457 40517 4.04
Figure 6. Trends in the number of elephants in Chobe District and Chobe NP (1993 – 2011). Estimates and 95 % CI error bars for Chobe District, CI not provided for Chobe NP by DWMP surveys
The differences in population size from 2010 to 2011 may be the result of movements by
elephants across international borders and dispersal across district boundaries, rather than variations in census error or natural population increase through reproduction. There has been some concern expressed about the outlier estimates and consistency of the DWNP counts (Junker et al. 2008).
Chobe District Elephant Trends
5474453862
3937639331
46144
57457
40517
0
10000
20000
30000
40000
50000
60000
70000
1996 1999 2001 2002 2003 2004 2010 2011
Chobe NP Elephant Trends
11682
22053
13565
25532
33219
23000
29519
32236
5000
10000
15000
20000
25000
30000
35000
1993 1994 1996 1999 2001 2002 2003 2004 2010 2011
20
Trends in Wildlife Numbers
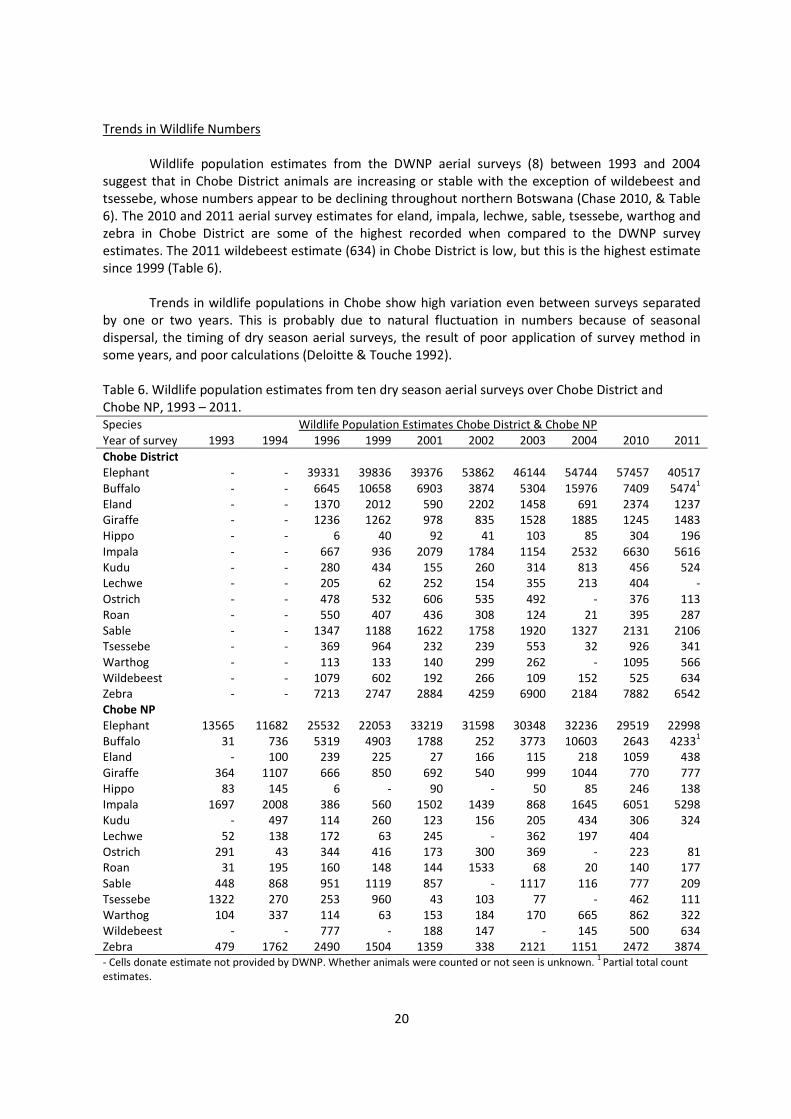
Wildlife population estimates from the DWNP aerial surveys (8) between 1993 and 2004 suggest that in Chobe District animals are increasing or stable with the exception of wildebeest and tsessebe, whose numbers appear to be declining throughout northern Botswana (Chase 2010, & Table 6). The 2010 and 2011 aerial survey estimates for eland, impala, lechwe, sable, tsessebe, warthog and zebra in Chobe District are some of the highest recorded when compared to the DWNP survey estimates. The 2011 wildebeest estimate (634) in Chobe District is low, but this is the highest estimate since 1999 (Table 6).
Trends in wildlife populations in Chobe show high variation even between surveys separated
by one or two years. This is probably due to natural fluctuation in numbers because of seasonal dispersal, the timing of dry season aerial surveys, the result of poor application of survey method in some years, and poor calculations (Deloitte & Touche 1992). Table 6. Wildlife population estimates from ten dry season aerial surveys over Chobe District and Chobe NP, 1993 – 2011. Species Wildlife Population Estimates Chobe District & Chobe NP Year of survey 1993 1994 1996 1999 2001 2002 2003 2004 2010 2011
Chobe District Elephant - - 39331 39836 39376 53862 46144 54744 57457 40517 Buffalo - - 6645 10658 6903 3874 5304 15976 7409 5474
1
Eland - - 1370 2012 590 2202 1458 691 2374 1237 Giraffe - - 1236 1262 978 835 1528 1885 1245 1483 Hippo - - 6 40 92 41 103 85 304 196 Impala - - 667 936 2079 1784 1154 2532 6630 5616 Kudu - - 280 434 155 260 314 813 456 524 Lechwe - - 205 62 252 154 355 213 404 - Ostrich - - 478 532 606 535 492 - 376 113 Roan - - 550 407 436 308 124 21 395 287 Sable - - 1347 1188 1622 1758 1920 1327 2131 2106 Tsessebe - - 369 964 232 239 553 32 926 341 Warthog - - 113 133 140 299 262 - 1095 566 Wildebeest - - 1079 602 192 266 109 152 525 634 Zebra - - 7213 2747 2884 4259 6900 2184 7882 6542 Chobe NP Elephant 13565 11682 25532 22053 33219 31598 30348 32236 29519 22998 Buffalo 31 736 5319 4903 1788 252 3773 10603 2643 4233
1
Eland - 100 239 225 27 166 115 218 1059 438 Giraffe 364 1107 666 850 692 540 999 1044 770 777 Hippo 83 145 6 - 90 - 50 85 246 138 Impala 1697 2008 386 560 1502 1439 868 1645 6051 5298 Kudu - 497 114 260 123 156 205 434 306 324 Lechwe 52 138 172 63 245 - 362 197 404 Ostrich 291 43 344 416 173 300 369 - 223 81 Roan 31 195 160 148 144 1533 68 20 140 177 Sable 448 868 951 1119 857 - 1117 116 777 209 Tsessebe 1322 270 253 960 43 103 77 - 462 111 Warthog 104 337 114 63 153 184 170 665 862 322 Wildebeest - - 777 - 188 147 - 145 500 634 Zebra 479 1762 2490 1504 1359 338 2121 1151 2472 3874 - Cells donate estimate not provided by DWNP. Whether animals were counted or not seen is unknown.
1 Partial total count
estimates.
21
Complete trend data were not available to calculate d- tests (trend) for the DWNP data (1993 -2004), as variance estimates were not presented/missing from the dataset provided by DWNP. Long-term trends are difficult to analyse given the variable nature of the DWNP surveys and comparisons in this report will be made only to 2010 data and course comparisons made through the use of graphs to earlier DWNP surveys (Figure 7 & Table 7).
The great differences in estimates of population size for most species between different surveys and the high confidence limits to the estimates demonstrate that the older DWNP surveys are not satisfactory for estimating numbers other than for elephants, particularly if estimates are required for sub-units within the total survey area e.g. specifically the FRs. They also provide data at too crude a level to show anything but gross seasonal distribution patterns of elephants (Deloitte & Touche 1992). The problem with the DWNP surveys is that the sample intensity is very low, generally around 3.5 % to 4 %. Transects are flown approximately 10 km apart. With the low density of animals it is likely that species could be missed in any single block.
The 2011 dry season estimate of 40500 elephants in the Chobe District is ~17000 lower when compared to aerial survey estimates between 2002 – 2010. There was a statistical significance between the 2010 and the 2011 estimate (d = 4.04). This variation could be attributed to cross border elephant movements between Botswana and Zimbabwe. The estimates for elephants in the Sibuyu FR along the Zimbabwe border differ by nearly 10000 animals between the two surveys.
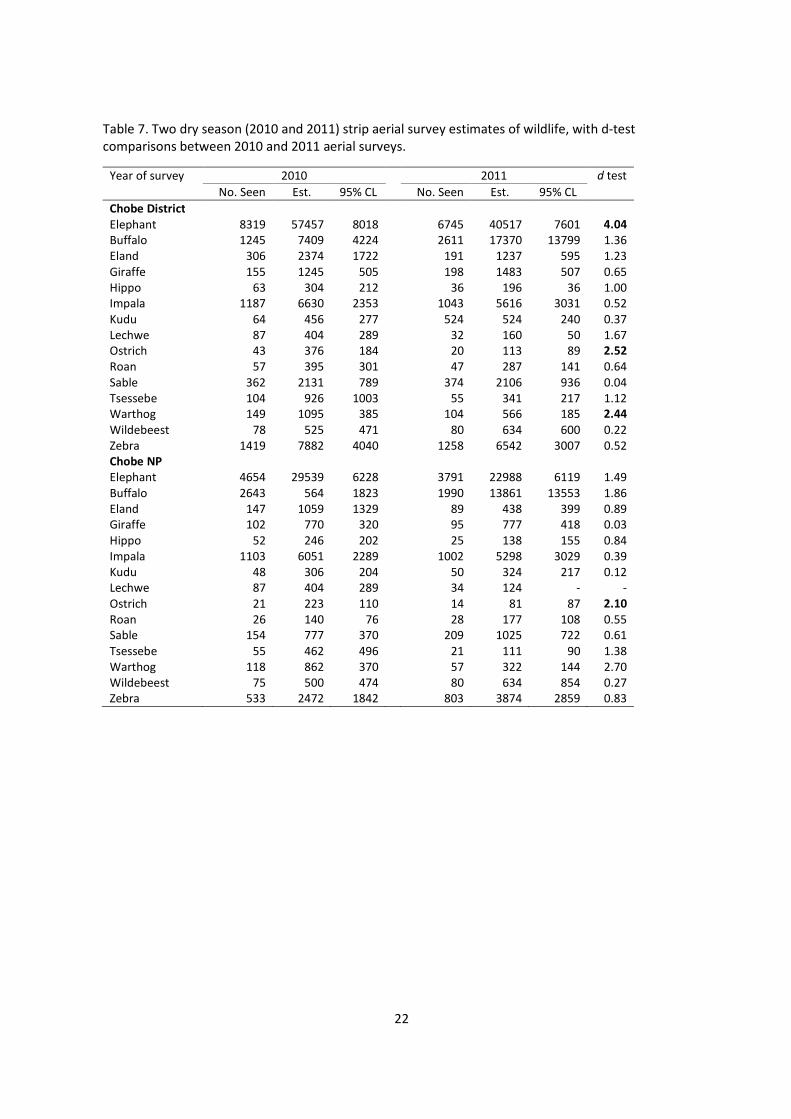
22
Table 7. Two dry season (2010 and 2011) strip aerial survey estimates of wildlife, with d-test comparisons between 2010 and 2011 aerial surveys.
Year of survey 2010 2011 d test
No. Seen Est. 95% CL No. Seen Est. 95% CL
Chobe District Elephant 8319 57457 8018 6745 40517 7601 4.04
Buffalo 1245 7409 4224 2611 17370 13799 1.36 Eland 306 2374 1722 191 1237 595 1.23 Giraffe 155 1245 505 198 1483 507 0.65 Hippo 63 304 212 36 196 36 1.00 Impala 1187 6630 2353 1043 5616 3031 0.52 Kudu 64 456 277 524 524 240 0.37 Lechwe 87 404 289 32 160 50 1.67 Ostrich 43 376 184 20 113 89 2.52
Roan 57 395 301 47 287 141 0.64 Sable 362 2131 789 374 2106 936 0.04 Tsessebe 104 926 1003 55 341 217 1.12 Warthog 149 1095 385 104 566 185 2.44
Wildebeest 78 525 471 80 634 600 0.22 Zebra 1419 7882 4040 1258 6542 3007 0.52 Chobe NP Elephant 4654 29539 6228 3791 22988 6119 1.49 Buffalo 2643 564 1823 1990 13861 13553 1.86 Eland 147 1059 1329 89 438 399 0.89 Giraffe 102 770 320 95 777 418 0.03 Hippo 52 246 202 25 138 155 0.84 Impala 1103 6051 2289 1002 5298 3029 0.39 Kudu 48 306 204 50 324 217 0.12 Lechwe 87 404 289 34 124 - - Ostrich 21 223 110 14 81 87 2.10
Roan 26 140 76 28 177 108 0.55 Sable 154 777 370 209 1025 722 0.61 Tsessebe 55 462 496 21 111 90 1.38 Warthog 118 862 370 57 322 144 2.70 Wildebeest 75 500 474 80 634 854 0.27 Zebra 533 2472 1842 803 3874 2859 0.83

23
Figure 7. Summary trend analyses for selected wildlife species in Chobe District, based upon dry season aerial surveys (10) flown between 1993 and 2011.
Buffalo
0
5000
10000
15000
20000
25000
1996 1999 2001 2002 2003 2004 2010 2011
Eland
0
1000
2000
3000
4000
1996 1999 2001 2002 2003 2004 2010 2011
Giraffe
0
500
1000
1500
2000
2500
1996 1999 2001 2002 2003 2004 2010 2011
Impala
0
1000
2000
3000
4000
5000
6000
7000
8000
9000
1996 1999 2001 2002 2003 2004 2010 2011
Kudu
0
200
400
600
800
1000
1200
1996 1999 2001 2002 2003 2004 2010 2011
Roan
0
100
200
300
400
500
600
700
800
900
1996 1999 2001 2002 2003 2004 2010 2011
Sable
0
500
1000
1500
2000
2500
3000
1996 1999 2001 2002 2003 2004 2010 2011
Tsessebe
0
200
400
600
800
1000
1200
1400
1600
1800
1996 1999 2001 2002 2003 2004 2010 2011
Wildebeest
0
200
400
600
800
1000
1200
1400
1600
1800
2000
1996 1999 2001 2002 2003 2004 2010 2011
Zebra
0
2000
4000
6000
8000
10000
12000
1996 1999 2001 2002 2003 2004 2010 2011
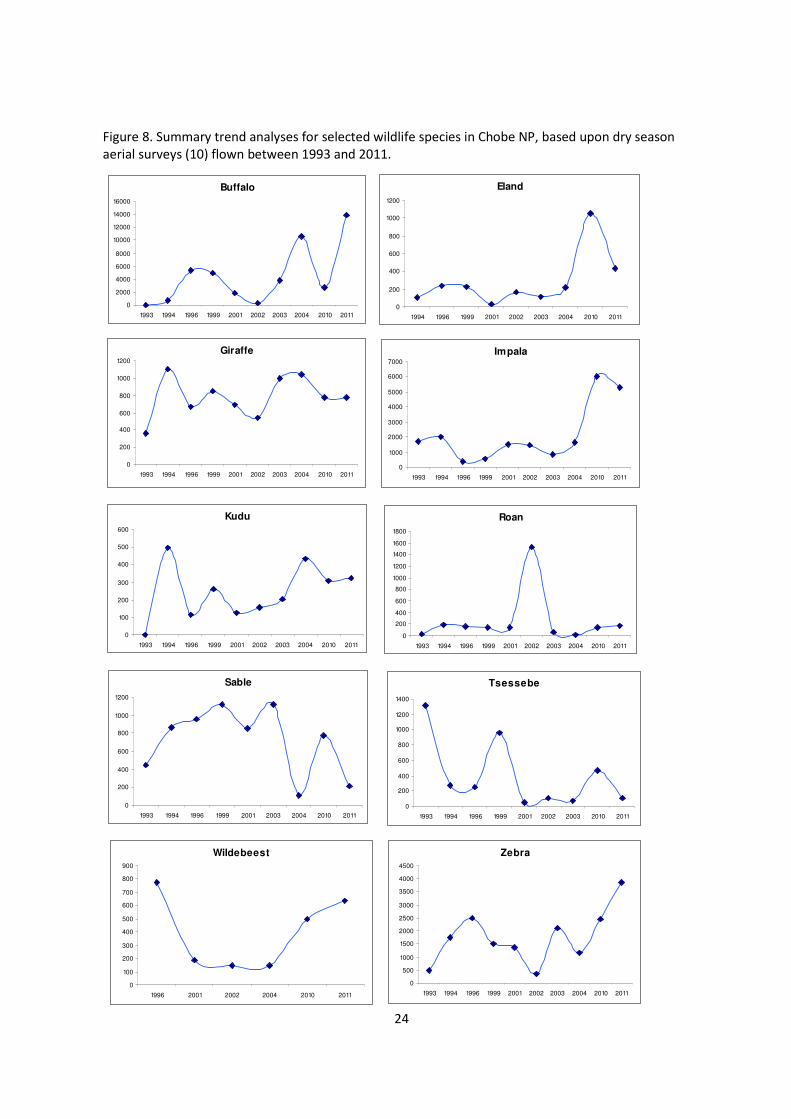
24
Figure 8. Summary trend analyses for selected wildlife species in Chobe NP, based upon dry season aerial surveys (10) flown between 1993 and 2011.
Buffalo
0
2000
4000
6000
8000
10000
12000
14000
16000
1993 1994 1996 1999 2001 2002 2003 2004 2010 2011
Eland
0
200
400
600
800
1000
1200
1994 1996 1999 2001 2002 2003 2004 2010 2011
Giraffe
0
200
400
600
800
1000
1200
1993 1994 1996 1999 2001 2002 2003 2004 2010 2011
Impala
0
1000
2000
3000
4000
5000
6000
7000
1993 1994 1996 1999 2001 2002 2003 2004 2010 2011
Kudu
0
100
200
300
400
500
600
1993 1994 1996 1999 2001 2002 2003 2004 2010 2011
Roan
0
200
400
600
800
1000
1200
1400
1600
1800
1993 1994 1996 1999 2001 2002 2003 2004 2010 2011
Sable
0
200
400
600
800
1000
1200
1993 1994 1996 1999 2001 2003 2004 2010 2011
Tsessebe
0
200
400
600
800
1000
1200
1400
1993 1994 1996 1999 2001 2002 2003 2010 2011
Wildebeest
0
100
200
300
400
500
600
700
800
900
1996 2001 2002 2004 2010 2011
Zebra
0
500
1000
1500
2000
2500
3000
3500
4000
4500
1993 1994 1996 1999 2001 2002 2003 2004 2010 2011
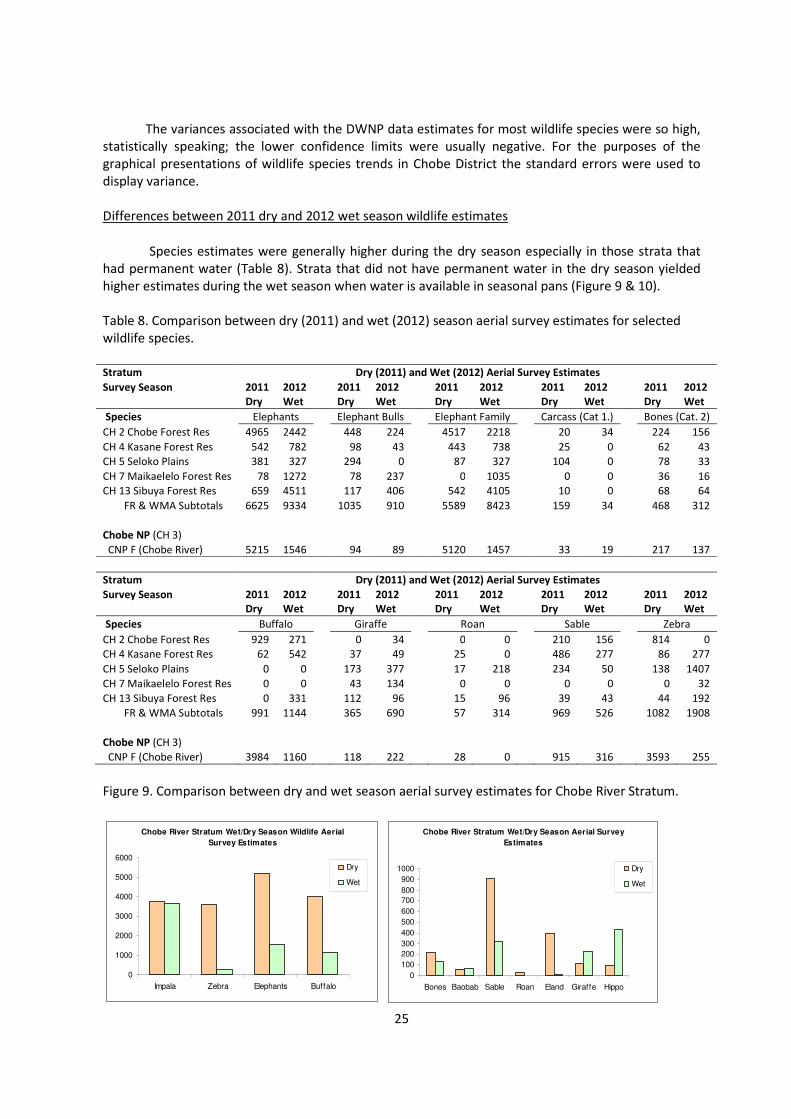
25
The variances associated with the DWNP data estimates for most wildlife species were so high, statistically speaking; the lower confidence limits were usually negative. For the purposes of the graphical presentations of wildlife species trends in Chobe District the standard errors were used to display variance. Differences between 2011 dry and 2012 wet season wildlife estimates
Species estimates were generally higher during the dry season especially in those strata that had permanent water (Table 8). Strata that did not have permanent water in the dry season yielded higher estimates during the wet season when water is available in seasonal pans (Figure 9 & 10). Table 8. Comparison between dry (2011) and wet (2012) season aerial survey estimates for selected wildlife species.
Stratum Dry (2011) and Wet (2012) Aerial Survey Estimates
Survey Season 2011
Dry
2012
Wet 2011
Dry
2012
Wet 2011
Dry
2012
Wet 2011
Dry
2012
Wet 2011
Dry
2012
Wet
Species Elephants Elephant Bulls Elephant Family Carcass (Cat 1.) Bones (Cat. 2)
CH 2 Chobe Forest Res 4965 2442 448 224 4517 2218 20 34 224 156
CH 4 Kasane Forest Res 542 782 98 43 443 738 25 0 62 43 CH 5 Seloko Plains 381 327 294 0 87 327 104 0 78 33
CH 7 Maikaelelo Forest Res 78 1272 78 237 0 1035 0 0 36 16 CH 13 Sibuya Forest Res 659 4511 117 406 542 4105 10 0 68 64
FR & WMA Subtotals 6625 9334 1035 910 5589 8423 159 34 468 312
Chobe NP (CH 3)
CNP F (Chobe River) 5215 1546 94 89 5120 1457 33 19 217 137
Stratum Dry (2011) and Wet (2012) Aerial Survey Estimates
Survey Season 2011
Dry
2012
Wet 2011
Dry
2012
Wet 2011
Dry
2012
Wet 2011
Dry
2012
Wet 2011
Dry
2012
Wet
Species Buffalo Giraffe Roan Sable Zebra
CH 2 Chobe Forest Res 929 271 0 34 0 0 210 156 814 0 CH 4 Kasane Forest Res 62 542 37 49 25 0 486 277 86 277
CH 5 Seloko Plains 0 0 173 377 17 218 234 50 138 1407
CH 7 Maikaelelo Forest Res 0 0 43 134 0 0 0 0 0 32
CH 13 Sibuya Forest Res 0 331 112 96 15 96 39 43 44 192
FR & WMA Subtotals 991 1144 365 690 57 314 969 526 1082 1908
Chobe NP (CH 3)
CNP F (Chobe River) 3984 1160 118 222 28 0 915 316 3593 255
Figure 9. Comparison between dry and wet season aerial survey estimates for Chobe River Stratum.
Chobe River Stratum Wet/Dry Season Wildlife Aerial
Survey Estimates
0
1000
2000
3000
4000
5000
6000
Impala Zebra Elephants Buffalo
Dry
Wet
Chobe River Stratum Wet/Dry Season Aerial Survey
Estimates
0
100
200
300
400
500
600
700
800
900
1000
Bones Baobab Sable Roan Eland Giraffe Hippo
Dry
Wet
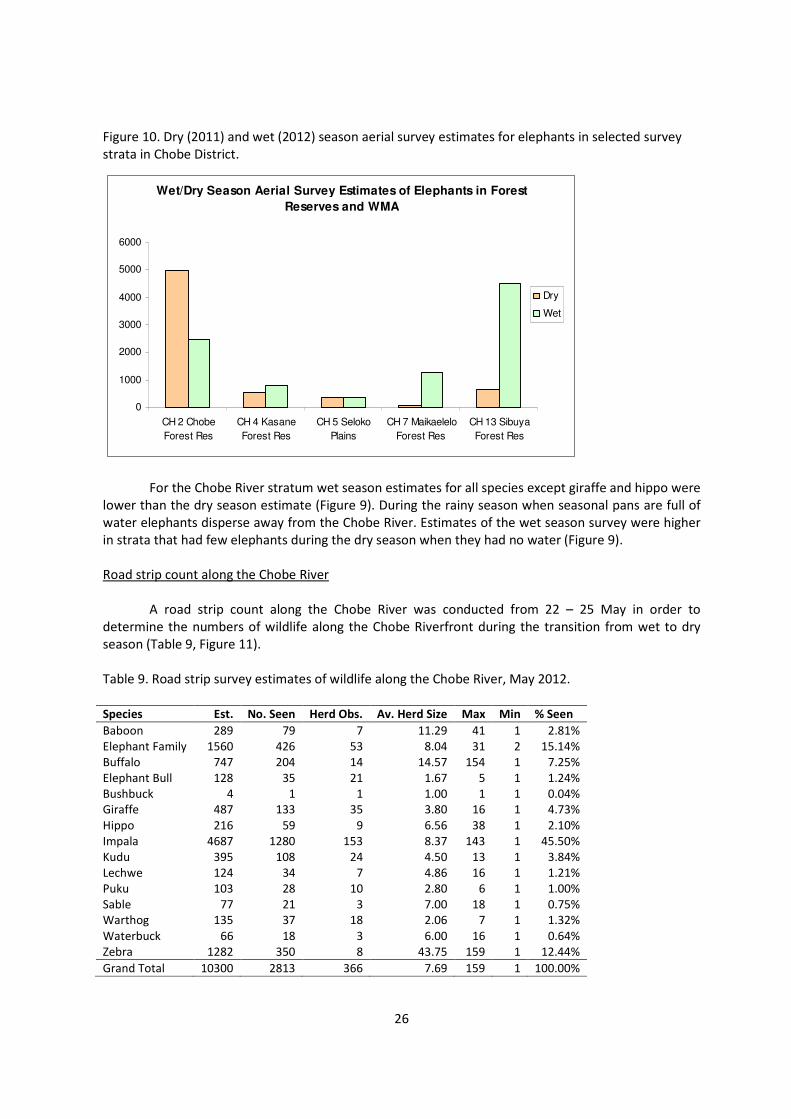
26
Figure 10. Dry (2011) and wet (2012) season aerial survey estimates for elephants in selected survey strata in Chobe District.
Wet/Dry Season Aerial Survey Estimates of Elephants in Forest
Reserves and WMA
0
1000
2000
3000
4000
5000
6000
CH 2 Chobe
Forest Res
CH 4 Kasane
Forest Res
CH 5 Seloko
Plains
CH 7 Maikaelelo
Forest Res
CH 13 Sibuya
Forest Res
Dry
Wet
For the Chobe River stratum wet season estimates for all species except giraffe and hippo were lower than the dry season estimate (Figure 9). During the rainy season when seasonal pans are full of water elephants disperse away from the Chobe River. Estimates of the wet season survey were higher in strata that had few elephants during the dry season when they had no water (Figure 9). Road strip count along the Chobe River
A road strip count along the Chobe River was conducted from 22 – 25 May in order to determine the numbers of wildlife along the Chobe Riverfront during the transition from wet to dry season (Table 9, Figure 11). Table 9. Road strip survey estimates of wildlife along the Chobe River, May 2012.
Species Est. No. Seen Herd Obs. Av. Herd Size Max Min % Seen
Baboon 289 79 7 11.29 41 1 2.81% Elephant Family 1560 426 53 8.04 31 2 15.14% Buffalo 747 204 14 14.57 154 1 7.25% Elephant Bull 128 35 21 1.67 5 1 1.24% Bushbuck 4 1 1 1.00 1 1 0.04% Giraffe 487 133 35 3.80 16 1 4.73% Hippo 216 59 9 6.56 38 1 2.10% Impala 4687 1280 153 8.37 143 1 45.50% Kudu 395 108 24 4.50 13 1 3.84% Lechwe 124 34 7 4.86 16 1 1.21% Puku 103 28 10 2.80 6 1 1.00% Sable 77 21 3 7.00 18 1 0.75% Warthog 135 37 18 2.06 7 1 1.32% Waterbuck 66 18 3 6.00 16 1 0.64% Zebra 1282 350 8 43.75 159 1 12.44%
Grand Total 10300 2813 366 7.69 159 1 100.00%

27
Figure 11. Comparison between three aerial surveys (Dry 2010 - 2012, Wet 2012) and one strip round estimates (May 2012 Rd) for selected wildlife along the Chobe River.
Survey Estimates of Key Wildlife Species along the Chobe River
0
1000
2000
3000
4000
5000
6000
Dry 2010
Dry 2011
Wet 2012
May 2012 Rd
Dry 2010 547 83 144 3627 2472 5283 5167 116 2481 111
Dry 2011 915 28 118 3744 3593 5215 5120 94 3984 151
Wet 2012 316 0 222 3683 255 1546 1457 89 1160 0
May 2012 Rd 77 0 487 4689 1282 2750 2619 131 747 395
Sable Roan Giraffe Impala Zebra ElephantEle
FamilyEle Bull Buffalo Kudu
The road count estimates suggests that migratory species such as zebra and elephant are beginning to move back to the river during the month of May. While estimates for non-migratory species such as impala and giraffe are slightly higher than estimates derived from the air. Buffalo - partial total count
Time and budget constraints limit aerial total counts, so we attempted to more accurately
count buffalo during the survey. Buffalo numbers have been extremely variable in previous surveys, ranging from 3874 to > 17 000 (this survey’s strip estimate). This is typical of sample counts of highly aggregated species such as buffalo, which tend to occur in large herds; the sample count may count only a few groups, and those very large – removing or adding a single group by chance can change the estimate by more than half or double, respectively. The buffalo population in the Chobe District is mostly contained in several large herds (several hundred to a thousand individuals), along the Khwai, Linyanti and Chobe Rivers, as well as lower reaches of the Mababe Depression (where one herd numbered 1463 animals) and Savuti Marsh. We used the ‘mixed method’ following Frederick (2011) to give a truer representation of the total number of buffalo than has been achieved to date (Table 10).
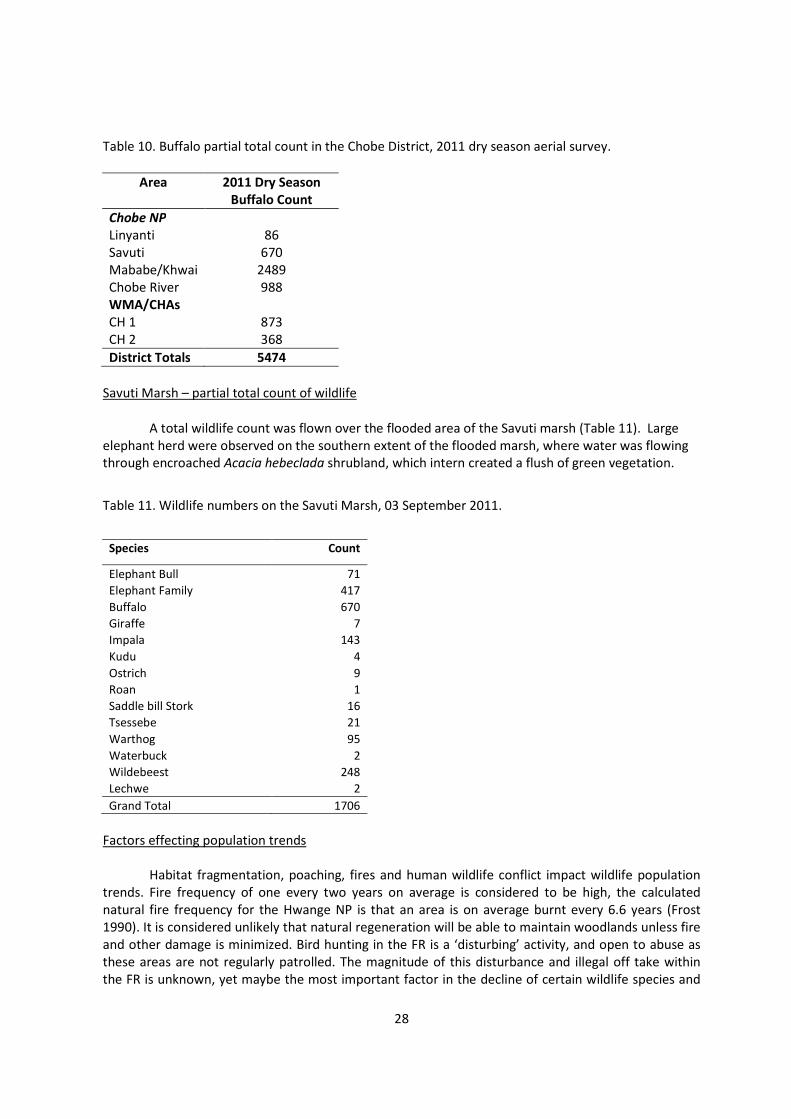
28
Table 10. Buffalo partial total count in the Chobe District, 2011 dry season aerial survey.
Area 2011 Dry Season
Buffalo Count
Chobe NP Linyanti 86 Savuti 670 Mababe/Khwai 2489 Chobe River 988 WMA/CHAs CH 1 873 CH 2 368
District Totals 5474
Savuti Marsh – partial total count of wildlife
A total wildlife count was flown over the flooded area of the Savuti marsh (Table 11). Large elephant herd were observed on the southern extent of the flooded marsh, where water was flowing through encroached Acacia hebeclada shrubland, which intern created a flush of green vegetation.
Table 11. Wildlife numbers on the Savuti Marsh, 03 September 2011.
Species Count
Elephant Bull 71
Elephant Family 417
Buffalo 670
Giraffe 7
Impala 143
Kudu 4
Ostrich 9
Roan 1
Saddle bill Stork 16
Tsessebe 21
Warthog 95
Waterbuck 2
Wildebeest 248
Lechwe 2
Grand Total 1706
Factors effecting population trends
Habitat fragmentation, poaching, fires and human wildlife conflict impact wildlife population trends. Fire frequency of one every two years on average is considered to be high, the calculated natural fire frequency for the Hwange NP is that an area is on average burnt every 6.6 years (Frost 1990). It is considered unlikely that natural regeneration will be able to maintain woodlands unless fire and other damage is minimized. Bird hunting in the FR is a ‘disturbing’ activity, and open to abuse as these areas are not regularly patrolled. The magnitude of this disturbance and illegal off take within the FR is unknown, yet maybe the most important factor in the decline of certain wildlife species and
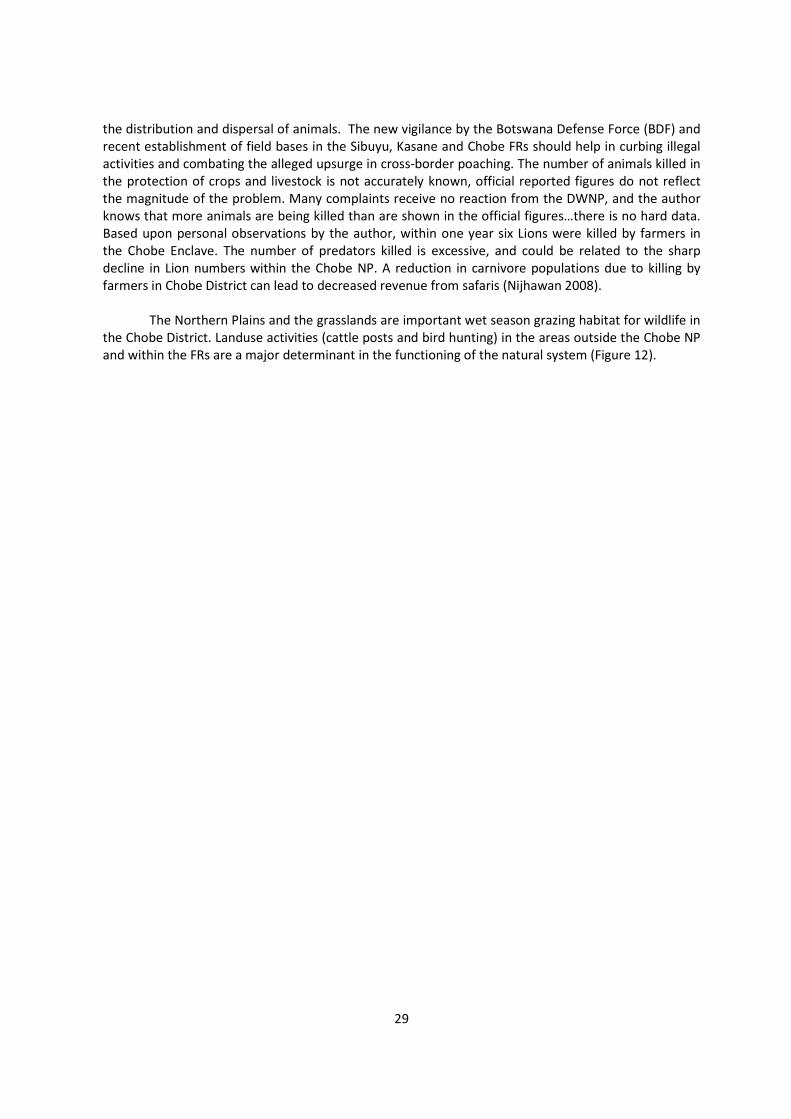
29
the distribution and dispersal of animals. The new vigilance by the Botswana Defense Force (BDF) and recent establishment of field bases in the Sibuyu, Kasane and Chobe FRs should help in curbing illegal activities and combating the alleged upsurge in cross-border poaching. The number of animals killed in the protection of crops and livestock is not accurately known, official reported figures do not reflect the magnitude of the problem. Many complaints receive no reaction from the DWNP, and the author knows that more animals are being killed than are shown in the official figures…there is no hard data. Based upon personal observations by the author, within one year six Lions were killed by farmers in the Chobe Enclave. The number of predators killed is excessive, and could be related to the sharp decline in Lion numbers within the Chobe NP. A reduction in carnivore populations due to killing by farmers in Chobe District can lead to decreased revenue from safaris (Nijhawan 2008).
The Northern Plains and the grasslands are important wet season grazing habitat for wildlife in the Chobe District. Landuse activities (cattle posts and bird hunting) in the areas outside the Chobe NP and within the FRs are a major determinant in the functioning of the natural system (Figure 12).
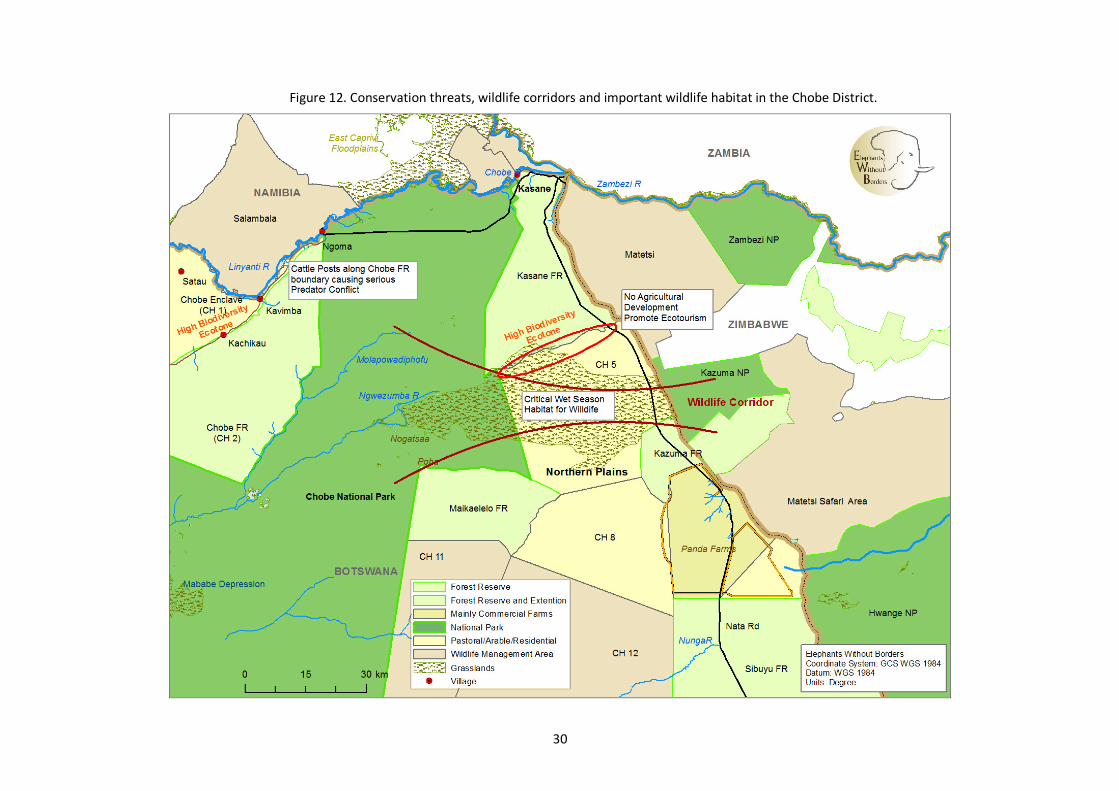
30
Figure 12. Conservation threats, wildlife corridors and important wildlife habitat in the Chobe District.
31
The dry season survey yielded an estimate of 4800 cattle within the survey area (note the survey area did not cover the northeast section of CH 1 where cattle numbers are known to be high). Cattle generally occurred within 10 km of villages, and overgrazing is evident around the villages of Satau, Parakarungu, Mabele and Kavimba. This is mainly due to the fact people keep their livestock close to the village where livestock is safe from predators and nearer to water. The recent allocation of cattle posts along the Chobe FR boundary may increase grazing pressure and predator conflicts in the FR and Chobe NP.
Discussion Wildlife Estimates
EWB and DWNP felt it was relevant that this survey increase the precision of population estimates for Chobe District (i.e. to reduce the confidence interval of the estimate, but the population estimate itself may be biased, that is, usually on the low side). This survey was conducted in a robust manner, at high sampling coverage (~ 15 %). This relatively high sample aerial survey over a large area has yielded estimates of wildlife and established a sound basis for wildlife numbers needed to follow population trends. These data can now be used to evaluate the efficacy of conservation activities and trends in wildlife populations with the ability to prioritize conservation projects against any severe variations in wildlife numbers. Observations
Comparison of observers. Both our aerial observers had experience in counting animals from the air. The two observers appear to have been equally efficient at detecting groups of animals. However, there does appear to have been a difference (for some species) between the observers in their ability to count or estimate the number of animals in a group, once a group was detected.
Elephant carcasses. Many of the elephant carcasses seen during the survey occurred in human elephant conflict hotspots, specifically the Chobe Enclave. Carcasses which appeared to be the result of poaching occurred in the Nogatsaa region. The GPS locations of possible poaching incidents recorded on our survey were reported to the Botswana Defense Force who acted upon our reports. Wildlife Distribution
The distribution of wildlife is likely to vary according to seasonal climatic conditions, the timing of the flood in the Kwando, Linyanti and Chobe rivers and the movements of animals. As the dry season survey was conducted during the height of the dry season, wildlife observations mostly occurred within 30 km of perennial rivers (Chobe, Kwando, Linyanti, Savuti and Khwai) (Figure 1). There was much difference in herd distribution between the wet and dry season surveys. While most of the herds occurred in the center of the District on the Mar12 wet season survey, during the dry season survey most of the herds were scattered along the northern portion of the District. This difference in distribution between the wet and dry seasons is related to the availability of water in seasonal pans and occurrence of human settlements. During the wet season when there is water in the numerous seasonal pans throughout the District, wildlife may be concentrating in the center of the District/Chobe NP where there are no human settlements (Figure 1) and associated disturbance. Whereas in the dry season when water in pans is more limited, wildlife shift their distribution to the northern portions of the District where there are few human settlements. Although we observed numerous pans with water in the northern portion of the Park during the Mar12 wet season survey, we did not record water in any of these pans during the dry season survey.
32
Most wildlife species in the Chobe District undergo seasonal change in home range, associated
with wide spread surface water in the wet season. Most species showed a marked seasonal movement away from the perennial rivers in the north towards the FR and Northern Plains regions in the wet season. The wet season movement of zebra south of the Ngoma floodplains in eastern Chobe NP needs to be researched and their dispersal/migration route mapped and conserved. This survey suggests there could be a new migration towards the Northern Plains grasslands in the west season. The movement patterns of zebra recorded by Vanderwalle (1988) are likely to have changed during the past 20 years in response to expanding human settlements in the Chobe Enclave. As for other large mammal dispersal patterns the Chobe FRs are critical ecological units incorporating part of a larger ecosystem connected to Chobe NP and protected areas in Zimbabwe.
Trends in Elephant Numbers
From 1993 to this 2011 survey, ten dry season surveys were conducted over the Chobe District. The Districts elephant population is large, but the results of this survey imply that it is stable. The elephant population estimate for Chobe NP has remained similar since 2001. This suggests that elephant numbers in Chobe have apparently stabilized, possibly due to the onset of density-dependence (Junker et al. 2009). A similar stabilization has been noted for elephants in neighboring Hwange NP in Zimbabwe (Chamaillé-Jammes et al. 2008). This could be due to reduced reproductive output at high densities, increased mortalities at high densities and /or increased dispersal at high densities. The recent dispersal of elephants into Angola, Namibia and Zambia from northern Botswana may account for this apparent stabilization (Chase & Griffin 2008, Chase & Griffin 2009, Cushman et al. 2010). The apparent stabilisation in elephant numbers and the underlying mechanisms for such stabilisation are not yet clear, but would be of special importance for elephant conservation management for northern Botswana (Junker et al. 2009 & Chase 2011). Trends in Wildlife Numbers
Any time-series analysis depends on the use of similar (ideally identical) methods during successive surveys, so that any observed differences in population number can confidently be assumed to be genuine and not simply a consequence of changing methods. Given the difficulty of ensuring that methods are identical (e.g. the same observers are often not available for successive surveys), the application of high and consistent standards during the execution of surveys is important. Future aerial surveys should standardize their coverage (20 %). While DWNP have conducted aerial surveys over northern Botswana, their survey stratum were not delineated along WMA concession boundaries, rather their surveys tend to lump multiple WMAs together making it difficult to infer trends about wildlife numbers at smaller scales.
Conducting aerial surveys in a standardized way should lead to repeatable and comparable indices of abundance. Having started out with a broad scale sampling design (possible under sampling, DWNP 1996 - 2004), this survey has provided valuable information about trends in wildlife numbers. An urgent and comprehensive research initiative to study the ecology of large mammals should be developed. A specially elected team of wildlife ecologists appointed to conduct a rapid assessment and funded in part by the Botswana Government will help determine the factors influencing the spatial and temporal variability and declines in wildlife populations. The failure to initiate such a programme that helps to identify the threats to wildlife could lead to unnecessary declines of selected wildlife (an economically important natural resource) and risk the ecotourism industry in Chobe District.
33
Conservation Implications
For the past 30 years the Department of Forestry and Range Resources have essentially had a hands off, ‘laisser faire’ management approach in the FR. This report suggests that the FRs provide important wet season refuge for wildlife in the Chobe District. While the FRs contribute to the supply of forest products for people living in Chobe (timber, poles, fire wood and cattle grazing), they have great potential to fulfill a much border role in the diversification of ecotourism in the District. This potential has long been recognized but not implemented. There has been a plethora of repeated proposals, and management plans that encourage the Government to create ecotourism ventures in the FR (Norwegian Forest Society 1992, Basalumi 2004, Basalumi 2006). Northern/Seloko Plains. The Northern Plains along the Botswana - Zimbabwe border occur in the Kazuma Depression. Pure basalt soils flood seasonally into slippery deep anaerobic clay pans, then crack and churn as they dry. As agriculture on these ‘black cotton’ soils is risky the plains have escaped agricultural development and remained relatively open for wildlife to disperse across the Kazuma Depression between Chobe NP in Botswana and Kazuma NP in Zimbabwe. Hunter and Kerley (1999) in a study on the movements of buffalo demonstrated that herds use the Kazuma Depression as a movement corridor and concluded ‘the importance of protecting this valuable corridor for all large
mobile species to continue moving between Botswana and Zimbabwe cannot be understated’. The high numbers of wildlife observed on the Plains during the wet season provide convincing new evidence that the plains are critical grazing habitat for wildlife during the rains. Protection of the Northern Plains would involve not only abandoning expansion of agriculture as proposed by the Zambezi Integrated Agro-Commercial Development Project but also the careful allocation of fields and cattle posts by the Chobe Land Board. The areas rugged terrain makes it inaccessible to vehicles and people during the wet season, it is this minimal disturbance and grassland habitat which makes Northern Plains a critical wildlife sanctuary which the government should consider conserving by either integrating this region within Chobe NP, or creating sustainable ecotourism ventures e.g. walking, horseback safaris. Currently the allocation of agricultural land adjacent and within the Plains will seriously compromise conservation efforts of one of Botswana’s little known but impressive wildlife spectacles. The alluvial grasslands of CH 5 (northern Plains) are an important ecological link between Hwange / Kazuma ecosystem in the east and the Chobe / Nogatsaa ecosystem in the west. The ecotone zone and parallel drainage lines provide critical and unique habitats, but which are being settled either for fields or cattle posts. There are already human wildlife conflicts in the area, which are expected to be exacerbated by the further allocation of agriculture by the Chobe Land Board. The Kasane FR and CH 5 boundary form an interface between Kalahari sand the clay soils of the Northern Plains and support high habitat diversity. Habitat Fragmentation. The 2011 population census estimates 22 000 people living in Chobe District, growing at 2.5 % per annum. Increasing human population and associated development activities have led to infringement into neighboring FR. This has necessitated appropriation of some land from the FR to meeting increasing land requirements. Recently government de-gazetted 6000 ha of land from Chobe FR to cater for the land requirements of Chobe west, 3000 ha of Kasane FR Ext. to augment the Kasane-Kazungula planning area and 1200 ha from Kazuma FR for extension of the Pandamatenga Commercial Farms. Chobe District has the highest rainfall compared to the rest of Botswana. Agriculture outside of Pandamatenga is basically for subsistence arable and livestock farming. Arable farming is nevertheless constrained by poor soils and crop damage due to wildlife. Chobe District is a key hub for tourism
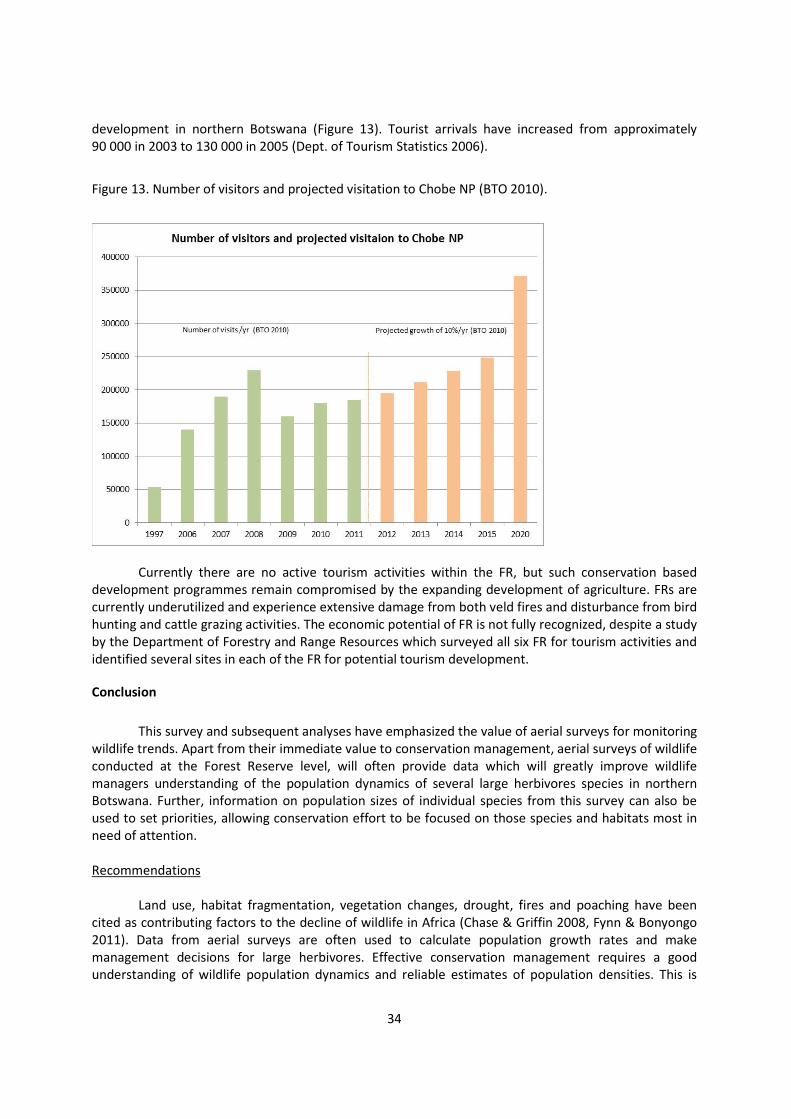
34
development in northern Botswana (Figure 13). Tourist arrivals have increased from approximately 90 000 in 2003 to 130 000 in 2005 (Dept. of Tourism Statistics 2006).
Figure 13. Number of visitors and projected visitation to Chobe NP (BTO 2010).
Currently there are no active tourism activities within the FR, but such conservation based
development programmes remain compromised by the expanding development of agriculture. FRs are currently underutilized and experience extensive damage from both veld fires and disturbance from bird hunting and cattle grazing activities. The economic potential of FR is not fully recognized, despite a study by the Department of Forestry and Range Resources which surveyed all six FR for tourism activities and identified several sites in each of the FR for potential tourism development.
Conclusion
This survey and subsequent analyses have emphasized the value of aerial surveys for monitoring
wildlife trends. Apart from their immediate value to conservation management, aerial surveys of wildlife conducted at the Forest Reserve level, will often provide data which will greatly improve wildlife managers understanding of the population dynamics of several large herbivores species in northern Botswana. Further, information on population sizes of individual species from this survey can also be used to set priorities, allowing conservation effort to be focused on those species and habitats most in need of attention. Recommendations
Land use, habitat fragmentation, vegetation changes, drought, fires and poaching have been cited as contributing factors to the decline of wildlife in Africa (Chase & Griffin 2008, Fynn & Bonyongo 2011). Data from aerial surveys are often used to calculate population growth rates and make management decisions for large herbivores. Effective conservation management requires a good understanding of wildlife population dynamics and reliable estimates of population densities. This is
35
especially true in many of Botswana’s concession areas where ecotourism is the main source of income. To provide accurate estimates of population sizes of large animals ranging over extensive areas, aerial surveys are often the only practical way to monitor wildlife trends. Future surveys based upon the methods used on this survey should be conducted, and would provide critical information on wildlife distribution, abundance and trends. Higher coverage, concession level aerial surveys are critical when current DWNP aerial surveys are intermittent and do not cover the area at the sampling intensity required to detect trends at finer spatial scales. Indeed, the execution, data compilation and analysis of this survey, provides a good example of collaboration and mutualism between government management and civil society organisations like Elephants Without Borders. The current aerial survey routine should now be continued.
In addition to collecting data on wildlife populations, the aerial survey provided an opportunity
to identify the following conservation issues:
• Habitat fragmentation and the environmental degradation associated with allocating fields for farming must be addressed by Chobe Land Board. The encroachment of farming fields in prime wildlife habitat and deforestation in the middle of key wildlife migratory corridors will continue to increase human wildlife conflict, disrupt connectivity between seasonal ranges and result in wildlife declines. Land Boards should reconsider their land allocation sites in prime wildlife conservation areas and not promote the cutting of large trees on these fields. The levels of deforestation along the Kachikau ridge (border of CH 1 and CH 2) are destructive.
• Much of the survey area in the late dry season of 2011 was burning. The extent of bush fires, the timing and intensity of these fires and their effects on the distribution and abundance of wildlife populations and vegetation communities needs to be studied.
• Definitive conclusions about the trends and possible stabilization of elephant numbers in Chobe District will be difficult to justify without assessments of elephant population trends based on population parameters derived from the assessment of age structures and age related reproductive and survival rates. Such a study will provide valuable information on elephant growth rates, and inferences about the causes of a possible stabilisation.
• Complimentary species specific aerial surveys need to be flown together with ground based demographic profiling that includes determining age and sex structures which will allow DWNP to understand the uncertainties in aerial survey data.
• Ecotourism ventures in the Forest Reserve should be established as a matter of priority. Many reports and consultancies, dating back as early as the 1980s have recommended the development of tourism activities in the Forest Reserves but government has not responded to these repeated recommendations. Current use of the FRs appear to favor agricultural interests over and above those of developing tourism.
• It is critical that Chobe Land Board, DFRR and the DWNP maintain established wildlife movement routes through designation of migration corridors.
36
References
Bartlam-Brooks H.L.A., C. Bonyongo, and Harris, S. (2011) Will reconnecting ecosystems allow long-
distance mammal migrations to resume? A case study of a zebra migration in Botswana. Oryx 45, 210-216.
Basalumi, L. (2004) A draft report on the Eco-tourism Survey of the Chobe Forest Reserves, November
2003 – March 2004. Ministry of Environment, Wildlife and Tourism. Division of Forestry. Kasane. Caughley, G. (1977) An analysis of vertebrate populations. New York, John Wiley & Sons. Chamaillé-Jammes S., F.H., V. M., Murindagomo F., and Clobert J. (2008) Resource variability,
aggregation and direct density dependence: the local regulation of an African elephant population. Journal of Animal Ecology 77, 135-144.
Chase, M.J. (2007) Home ranges, transboundary movements and harvest of elephants in northern
Botswana and factors affecting elephant distribution and abundance in the Lower Kwando River Basin. PhD Dissertation. University of Massachusetts.
Chase, M.J. and Griffin, C. (2008) Seasonal abundance and distribution of Elephants in Sioma Ngwezi
National Park, southwest Zambia. Pachyderm 45, 88-97. Chase, M.J. and Griffin, C. (2009) Elephants caught in the middle: Impacts of war, fences, and people on
elephant distribution and abundance in the Caprivi Strip, Namibia. African Journal of Ecology 47, 223-233.
Chase, M.J. (2010) Ecology of elephants in the Okavango Delta. Elephants Without Borders, Kasane, Botswana.
Chase, M.J. (2011) Fixed wing aerial survey of wildlife in the NG26 Wildlife Management Area, Okavango
Delta. Elephant Back Safaris. Maun. Craig, C. and D. St.C. Gibson. (2002) Aerial survey of Wildlife in the Niassa Reserve and Hunting
Concessions, Moçambique, October/November 2002. Cushman, S.A., Chase, M.J. and Griffin, C. (2010) Mapping Landscape resistance to identify corridors and
barriers for elephant movement in southern Africa. In S.A. Cushman and F. Huettmann (Ed.), Spatial Complexity, Informatics, and Wildlife Conservation, (pp. 349-367). Springer Japan.
Deloitte & Touche. (1992) Chobe National Park Management Plan, Volume 1, Background Information.
Commissioned by Kalahari Conservation Society, Gaborone, Botswana. Department of Forestry and Range Resources (DFRR). (2010) Ecotourism manual for Forest Reserves.
Standards, quality control and compensation. Version 1.0, Gaborone, Botswana. Dunham, K.M., E. van der Westhuizen, H.F. van der Westhuizen and E. Gandiwa. (2009) Aerial Survey of
Elephants and other Large Herbivores in Gonarezhou National Park (Zimbabwe), Zinave National Park (Mozambique) and surrounds. Frankfurt Zoological Society.

37
DNR Garmin Extension. (2002) Minnesota Department of Natural Resources, GIS Section. Available
from: http://www.dnr.state.mn.us/mis/gis/tools/arcview/ extensions/DNRGarmin/DNRGarmin.html (accessed June 2002).
DWNP. 1993 – 2004. Aerial census of wildlife and some domestic animals in Botswana. Department of
Wildlife and National Parks. Monitoring Unit, Research Division. Gaborone. ESRI. ArcMap 10.1. (2010) California: Environmental Systems Research Institute, 2008. Frost. (1990) Occurrence of natural processes within Hwange National Park. In; Management of Hwange
Ecosystem. Proceeding of a workshop, 9-13 July 1990. National Parks, Zimbabwe. Fynn, R. and C. Bonyongo. (2011) Functional conservation areas and the future of Africa’s wildlife.
African Journal of Ecology. In Press. GARMIN Corporation. (2000) MapSource: User’s manual and reference guide. GARMIN International,
Olathe, Kansas, USA. Gasaway W.C., S.D. duBois, D.J. Reed and S.J. Harbo. (1986) Estimating moose population parameters
from aerial surveys. Biological Papers of the University of Alaska No. 22. 108pp. Google Earth. (2007) Google. http://earth.google.com/. Jolly, G.M. (1969) Sampling methods for aerial census of wildlife populations. East African Agriculture
and Forestry Journal 34, 46-49. Junker, J., van Aarde, R. & Ferreira, S. (2008) Temporal trends in elephant Loxodonta africana numbers
and densities in northern Botswana: is the population really increasing? Oryx, 42, 58-65. Kelwij, J.M., De Boer, W.R., Mucina, L., Prins H.H.T., Skarpe. C., and Winterbach. C. (2010) Tree cover
and biomass increase in a southern African savanna despite growing elephant population. Ecological Applications 20, 222-233.
Martin, R.B. (2005). Transboundary species project, background study, Elephants. Ministry of
Environment and Tourism, and the Namibian Nature Foundation. Windhoek, Namibia. Norton-Griffiths, M. (1978) Counting animals. African Wildlife Leadership Foundation. Nairobi, Kenya.
pp. 139. Norwegian Forestry Society. (1992) Chobe Forest s Inventory and Management Plan. Prepared for the
Ministry of Agriculture Division of Crop Production and Forestry , Government of Botswana.
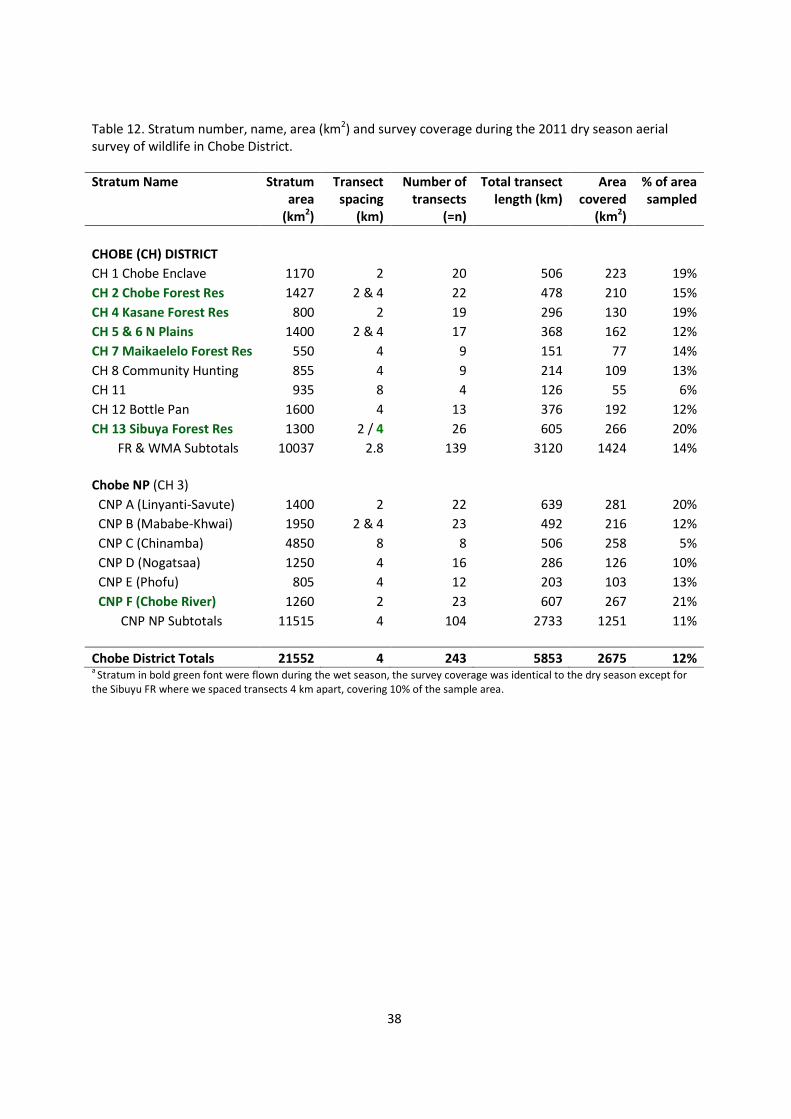
38
Table 12. Stratum number, name, area (km2) and survey coverage during the 2011 dry season aerial survey of wildlife in Chobe District.
Stratum Name Stratum
area
(km2)
Transect
spacing
(km)
Number of
transects
(=n)
Total transect
length (km)
Area
covered
(km2)
% of area
sampled
CHOBE (CH) DISTRICT
CH 1 Chobe Enclave 1170 2 20 506 223 19%
CH 2 Chobe Forest Res 1427 2 & 4 22 478 210 15%
CH 4 Kasane Forest Res 800 2 19 296 130 19%
CH 5 & 6 N Plains 1400 2 & 4 17 368 162 12%
CH 7 Maikaelelo Forest Res 550 4 9 151 77 14%
CH 8 Community Hunting 855 4 9 214 109 13%
CH 11 935 8 4 126 55 6%
CH 12 Bottle Pan 1600 4 13 376 192 12%
CH 13 Sibuya Forest Res 1300 2 / 4 26 605 266 20%
FR & WMA Subtotals 10037 2.8 139 3120 1424 14%
Chobe NP (CH 3)
CNP A (Linyanti-Savute) 1400 2 22 639 281 20%
CNP B (Mababe-Khwai) 1950 2 & 4 23 492 216 12%
CNP C (Chinamba) 4850 8 8 506 258 5%
CNP D (Nogatsaa) 1250 4 16 286 126 10%
CNP E (Phofu) 805 4 12 203 103 13%
CNP F (Chobe River) 1260 2 23 607 267 21%
CNP NP Subtotals 11515 4 104 2733 1251 11%
Chobe District Totals 21552 4 243 5853 2675 12% a
Stratum in bold green font were flown during the wet season, the survey coverage was identical to the dry season except for the Sibuyu FR where we spaced transects 4 km apart, covering 10% of the sample area.
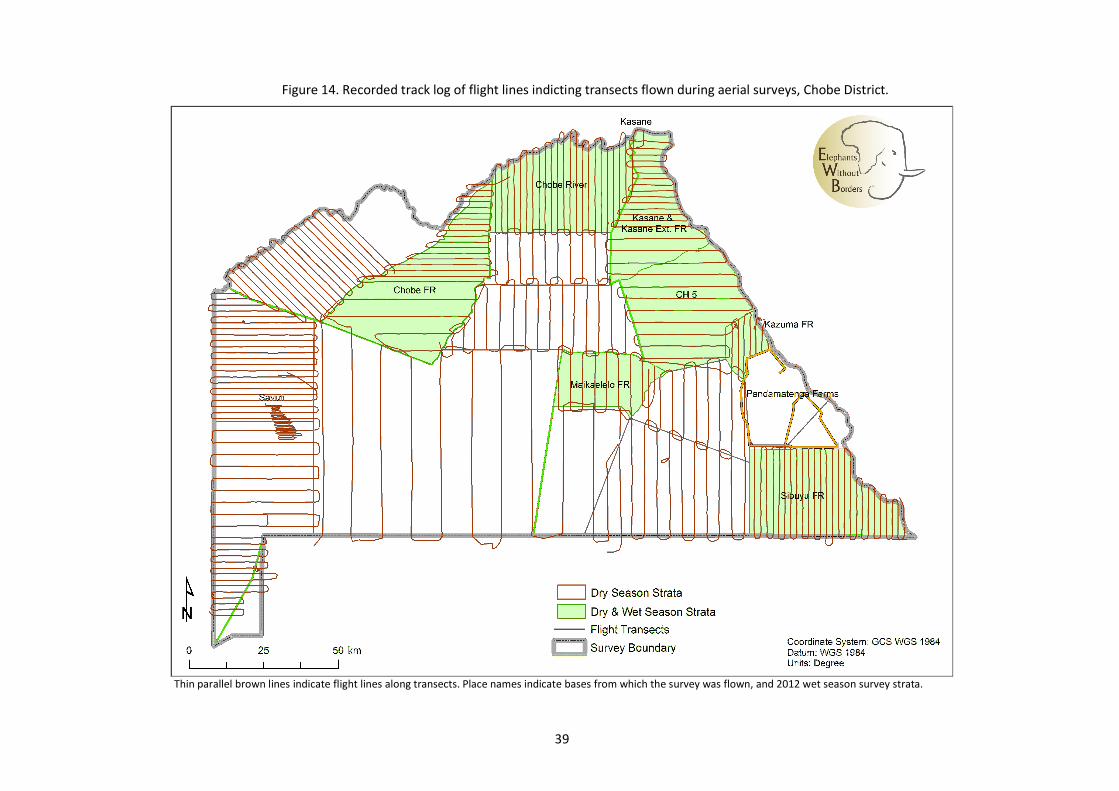
39
Figure 14. Recorded track log of flight lines indicting transects flown during aerial surveys, Chobe District.
Thin parallel brown lines indicate flight lines along transects. Place names indicate bases from which the survey was flown, and 2012 wet season survey strata.
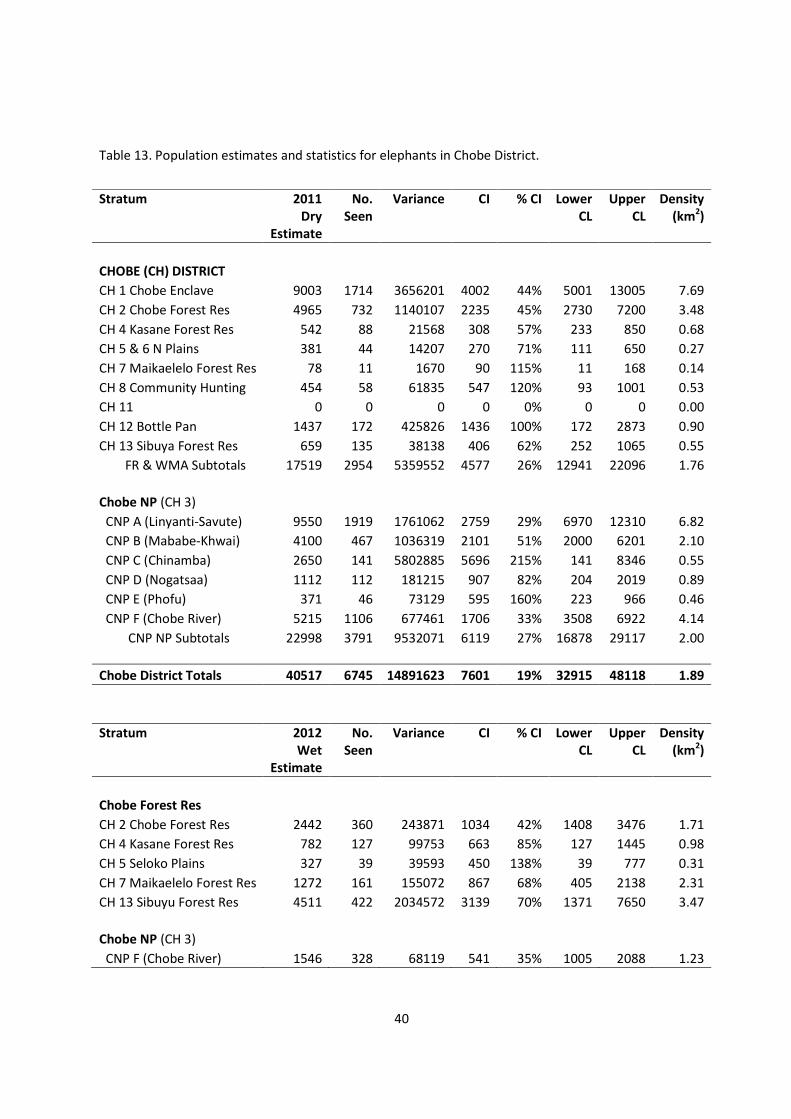
40
Table 13. Population estimates and statistics for elephants in Chobe District.
Stratum 2011
Dry
Estimate
No.
Seen
Variance CI % CI Lower
CL
Upper
CL
Density
(km2)
CHOBE (CH) DISTRICT
CH 1 Chobe Enclave 9003 1714 3656201 4002 44% 5001 13005 7.69
CH 2 Chobe Forest Res 4965 732 1140107 2235 45% 2730 7200 3.48
CH 4 Kasane Forest Res 542 88 21568 308 57% 233 850 0.68
CH 5 & 6 N Plains 381 44 14207 270 71% 111 650 0.27
CH 7 Maikaelelo Forest Res 78 11 1670 90 115% 11 168 0.14
CH 8 Community Hunting 454 58 61835 547 120% 93 1001 0.53
CH 11 0 0 0 0 0% 0 0 0.00
CH 12 Bottle Pan 1437 172 425826 1436 100% 172 2873 0.90
CH 13 Sibuya Forest Res 659 135 38138 406 62% 252 1065 0.55
FR & WMA Subtotals 17519 2954 5359552 4577 26% 12941 22096 1.76
Chobe NP (CH 3)
CNP A (Linyanti-Savute) 9550 1919 1761062 2759 29% 6970 12310 6.82
CNP B (Mababe-Khwai) 4100 467 1036319 2101 51% 2000 6201 2.10
CNP C (Chinamba) 2650 141 5802885 5696 215% 141 8346 0.55
CNP D (Nogatsaa) 1112 112 181215 907 82% 204 2019 0.89
CNP E (Phofu) 371 46 73129 595 160% 223 966 0.46
CNP F (Chobe River) 5215 1106 677461 1706 33% 3508 6922 4.14
CNP NP Subtotals 22998 3791 9532071 6119 27% 16878 29117 2.00
Chobe District Totals 40517 6745 14891623 7601 19% 32915 48118 1.89
Stratum 2012
Wet
Estimate
No.
Seen
Variance CI % CI Lower
CL
Upper
CL
Density
(km2)
Chobe Forest Res
CH 2 Chobe Forest Res 2442 360 243871 1034 42% 1408 3476 1.71
CH 4 Kasane Forest Res 782 127 99753 663 85% 127 1445 0.98
CH 5 Seloko Plains 327 39 39593 450 138% 39 777 0.31
CH 7 Maikaelelo Forest Res 1272 161 155072 867 68% 405 2138 2.31
CH 13 Sibuyu Forest Res 4511 422 2034572 3139 70% 1371 7650 3.47
Chobe NP (CH 3)
CNP F (Chobe River) 1546 328 68119 541 35% 1005 2088 1.23
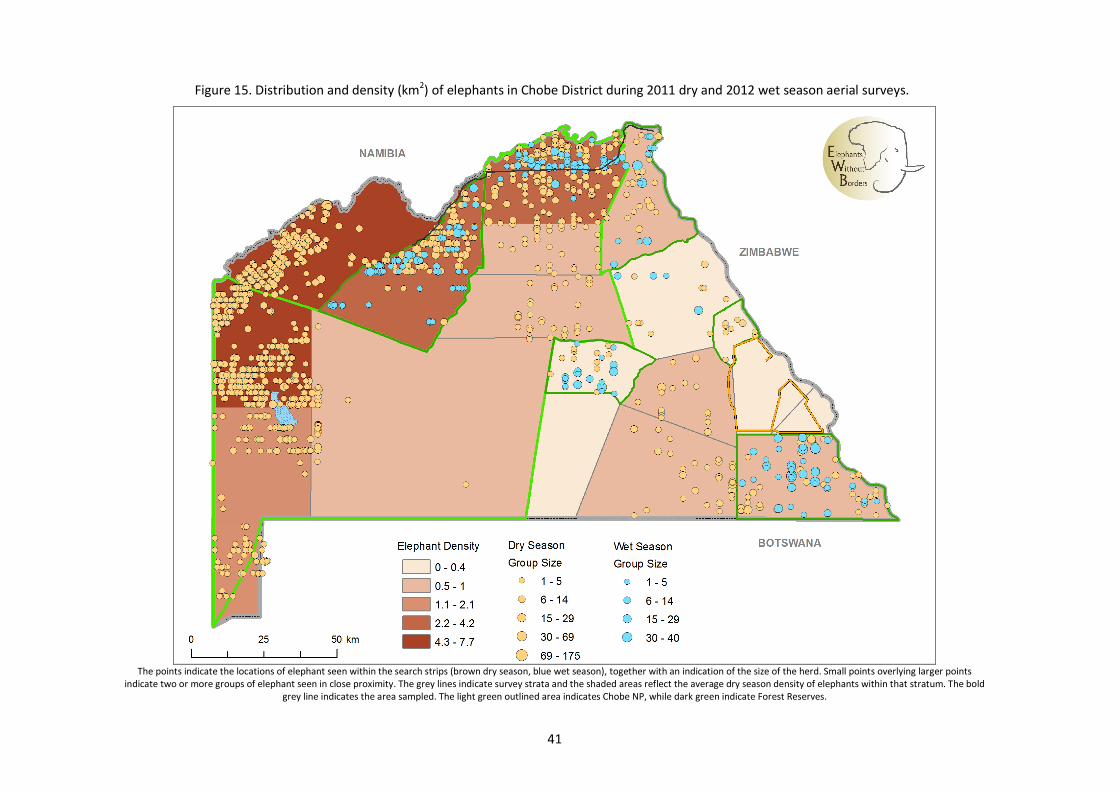
41
Figure 15. Distribution and density (km2) of elephants in Chobe District during 2011 dry and 2012 wet season aerial surveys.
The points indicate the locations of elephant seen within the search strips (brown dry season, blue wet season), together with an indication of the size of the herd. Small points overlying larger points
indicate two or more groups of elephant seen in close proximity. The grey lines indicate survey strata and the shaded areas reflect the average dry season density of elephants within that stratum. The bold grey line indicates the area sampled. The light green outlined area indicates Chobe NP, while dark green indicate Forest Reserves.
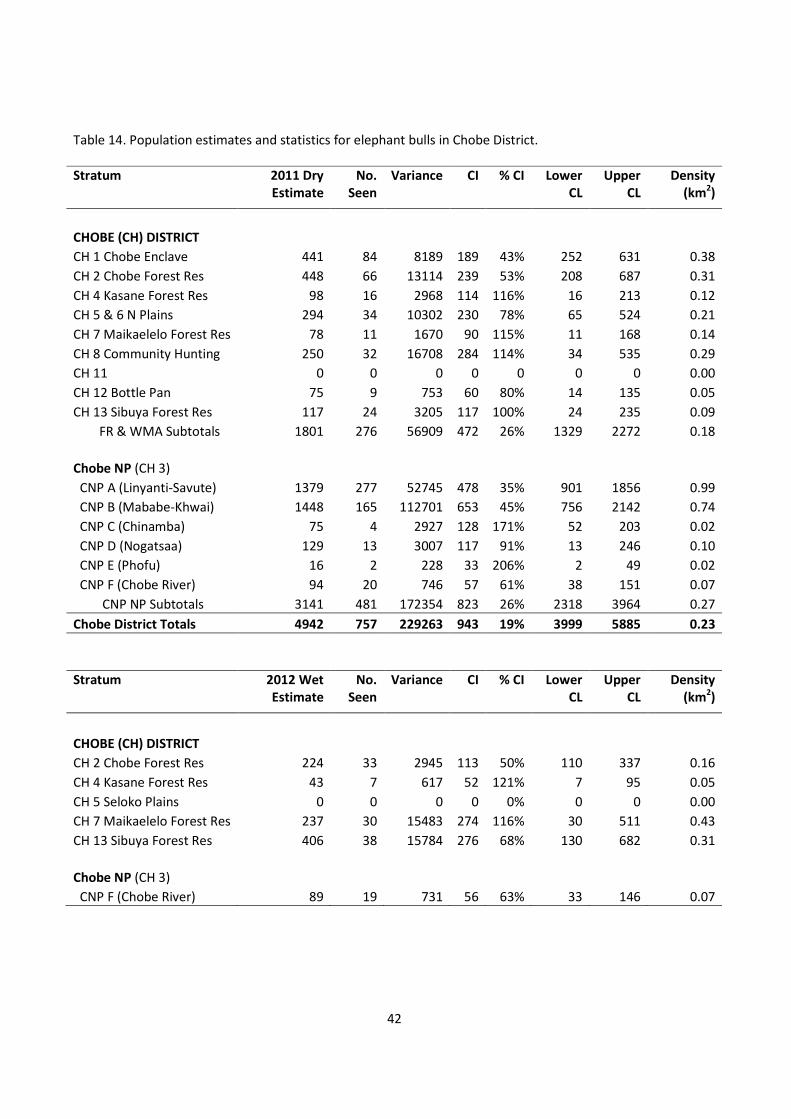
42
Table 14. Population estimates and statistics for elephant bulls in Chobe District.
Stratum 2011 Dry
Estimate
No.
Seen
Variance CI % CI Lower
CL
Upper
CL
Density
(km2)
CHOBE (CH) DISTRICT
CH 1 Chobe Enclave 441 84 8189 189 43% 252 631 0.38
CH 2 Chobe Forest Res 448 66 13114 239 53% 208 687 0.31
CH 4 Kasane Forest Res 98 16 2968 114 116% 16 213 0.12
CH 5 & 6 N Plains 294 34 10302 230 78% 65 524 0.21
CH 7 Maikaelelo Forest Res 78 11 1670 90 115% 11 168 0.14
CH 8 Community Hunting 250 32 16708 284 114% 34 535 0.29
CH 11 0 0 0 0 0 0 0 0.00
CH 12 Bottle Pan 75 9 753 60 80% 14 135 0.05
CH 13 Sibuya Forest Res 117 24 3205 117 100% 24 235 0.09
FR & WMA Subtotals 1801 276 56909 472 26% 1329 2272 0.18
Chobe NP (CH 3)
CNP A (Linyanti-Savute) 1379 277 52745 478 35% 901 1856 0.99
CNP B (Mababe-Khwai) 1448 165 112701 653 45% 756 2142 0.74
CNP C (Chinamba) 75 4 2927 128 171% 52 203 0.02
CNP D (Nogatsaa) 129 13 3007 117 91% 13 246 0.10
CNP E (Phofu) 16 2 228 33 206% 2 49 0.02
CNP F (Chobe River) 94 20 746 57 61% 38 151 0.07
CNP NP Subtotals 3141 481 172354 823 26% 2318 3964 0.27
Chobe District Totals 4942 757 229263 943 19% 3999 5885 0.23
Stratum 2012 Wet
Estimate
No.
Seen
Variance CI % CI Lower
CL
Upper
CL
Density
(km2)
CHOBE (CH) DISTRICT
CH 2 Chobe Forest Res 224 33 2945 113 50% 110 337 0.16
CH 4 Kasane Forest Res 43 7 617 52 121% 7 95 0.05
CH 5 Seloko Plains 0 0 0 0 0% 0 0 0.00
CH 7 Maikaelelo Forest Res 237 30 15483 274 116% 30 511 0.43
CH 13 Sibuya Forest Res 406 38 15784 276 68% 130 682 0.31
Chobe NP (CH 3)
CNP F (Chobe River) 89 19 731 56 63% 33 146 0.07
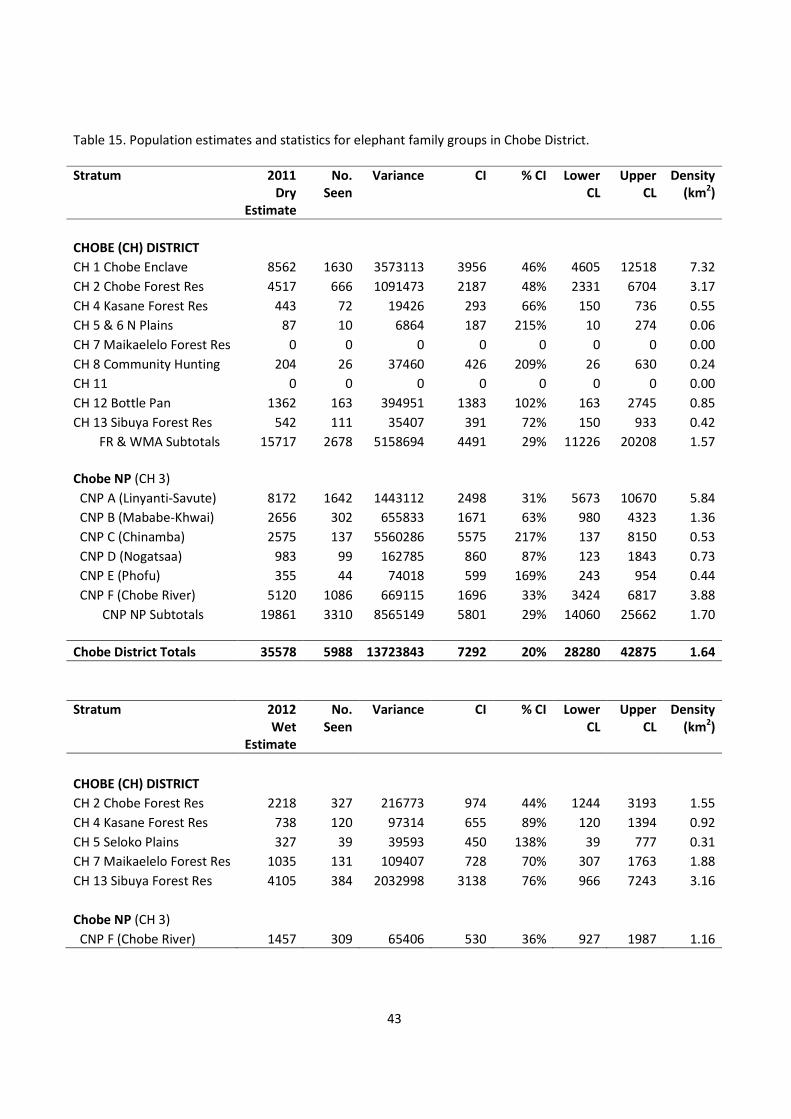
43
Table 15. Population estimates and statistics for elephant family groups in Chobe District.
Stratum 2011
Dry
Estimate
No.
Seen
Variance CI % CI Lower
CL
Upper
CL
Density
(km2)
CHOBE (CH) DISTRICT
CH 1 Chobe Enclave 8562 1630 3573113 3956 46% 4605 12518 7.32
CH 2 Chobe Forest Res 4517 666 1091473 2187 48% 2331 6704 3.17
CH 4 Kasane Forest Res 443 72 19426 293 66% 150 736 0.55
CH 5 & 6 N Plains 87 10 6864 187 215% 10 274 0.06
CH 7 Maikaelelo Forest Res 0 0 0 0 0 0 0 0.00
CH 8 Community Hunting 204 26 37460 426 209% 26 630 0.24
CH 11 0 0 0 0 0 0 0 0.00
CH 12 Bottle Pan 1362 163 394951 1383 102% 163 2745 0.85
CH 13 Sibuya Forest Res 542 111 35407 391 72% 150 933 0.42
FR & WMA Subtotals 15717 2678 5158694 4491 29% 11226 20208 1.57
Chobe NP (CH 3)
CNP A (Linyanti-Savute) 8172 1642 1443112 2498 31% 5673 10670 5.84
CNP B (Mababe-Khwai) 2656 302 655833 1671 63% 980 4323 1.36
CNP C (Chinamba) 2575 137 5560286 5575 217% 137 8150 0.53
CNP D (Nogatsaa) 983 99 162785 860 87% 123 1843 0.73
CNP E (Phofu) 355 44 74018 599 169% 243 954 0.44
CNP F (Chobe River) 5120 1086 669115 1696 33% 3424 6817 3.88
CNP NP Subtotals 19861 3310 8565149 5801 29% 14060 25662 1.70
Chobe District Totals 35578 5988 13723843 7292 20% 28280 42875 1.64
Stratum 2012
Wet
Estimate
No.
Seen
Variance CI % CI Lower
CL
Upper
CL
Density
(km2)
CHOBE (CH) DISTRICT
CH 2 Chobe Forest Res 2218 327 216773 974 44% 1244 3193 1.55
CH 4 Kasane Forest Res 738 120 97314 655 89% 120 1394 0.92
CH 5 Seloko Plains 327 39 39593 450 138% 39 777 0.31
CH 7 Maikaelelo Forest Res 1035 131 109407 728 70% 307 1763 1.88
CH 13 Sibuya Forest Res 4105 384 2032998 3138 76% 966 7243 3.16
Chobe NP (CH 3)
CNP F (Chobe River) 1457 309 65406 530 36% 927 1987 1.16
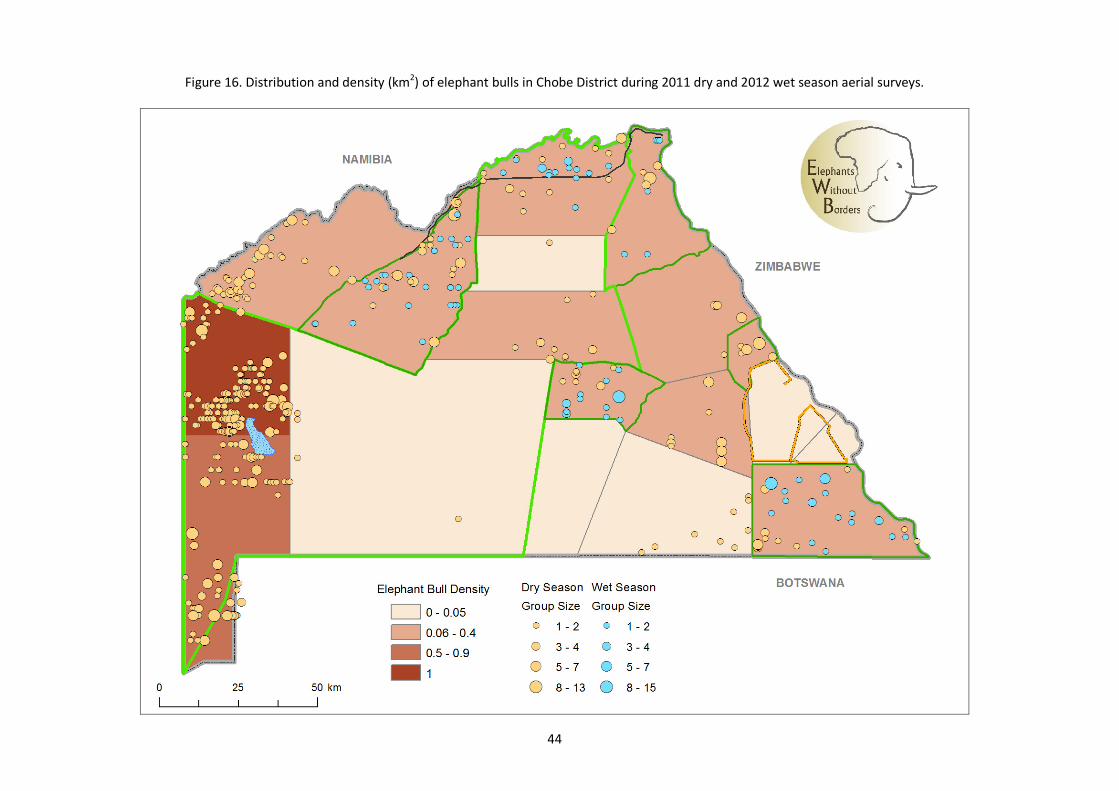
44
Figure 16. Distribution and density (km2) of elephant bulls in Chobe District during 2011 dry and 2012 wet season aerial surveys.
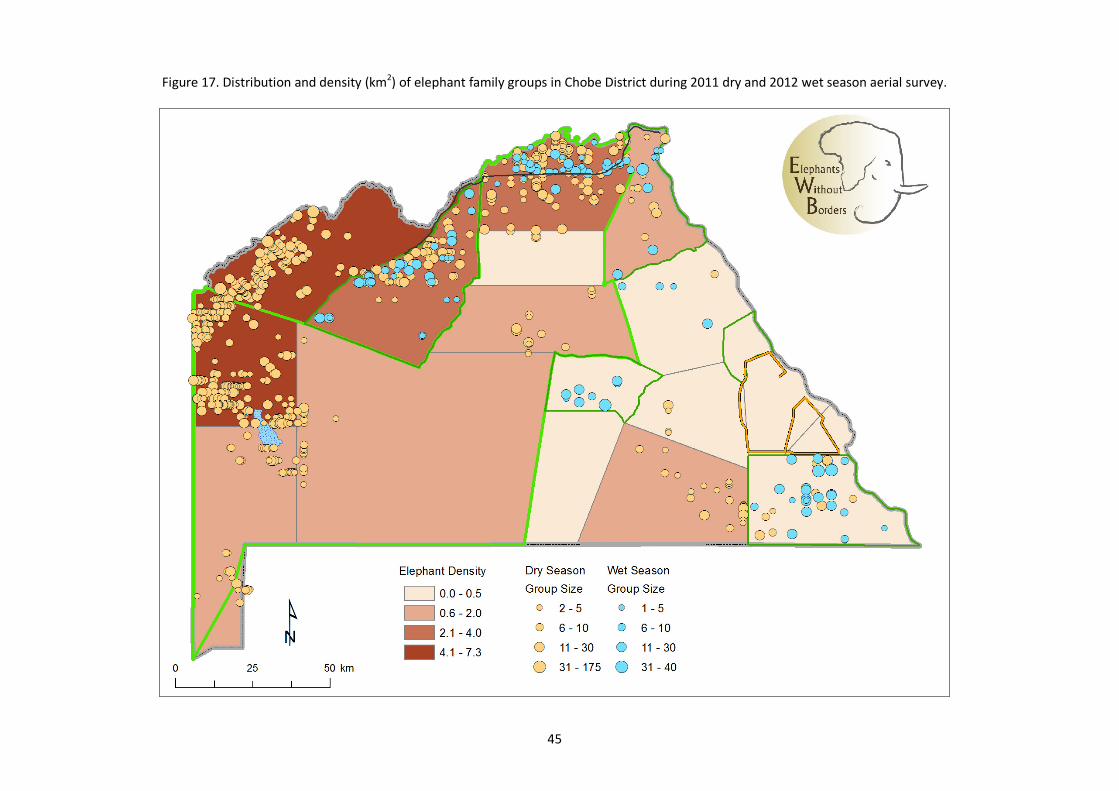
45
Figure 17. Distribution and density (km2) of elephant family groups in Chobe District during 2011 dry and 2012 wet season aerial survey.
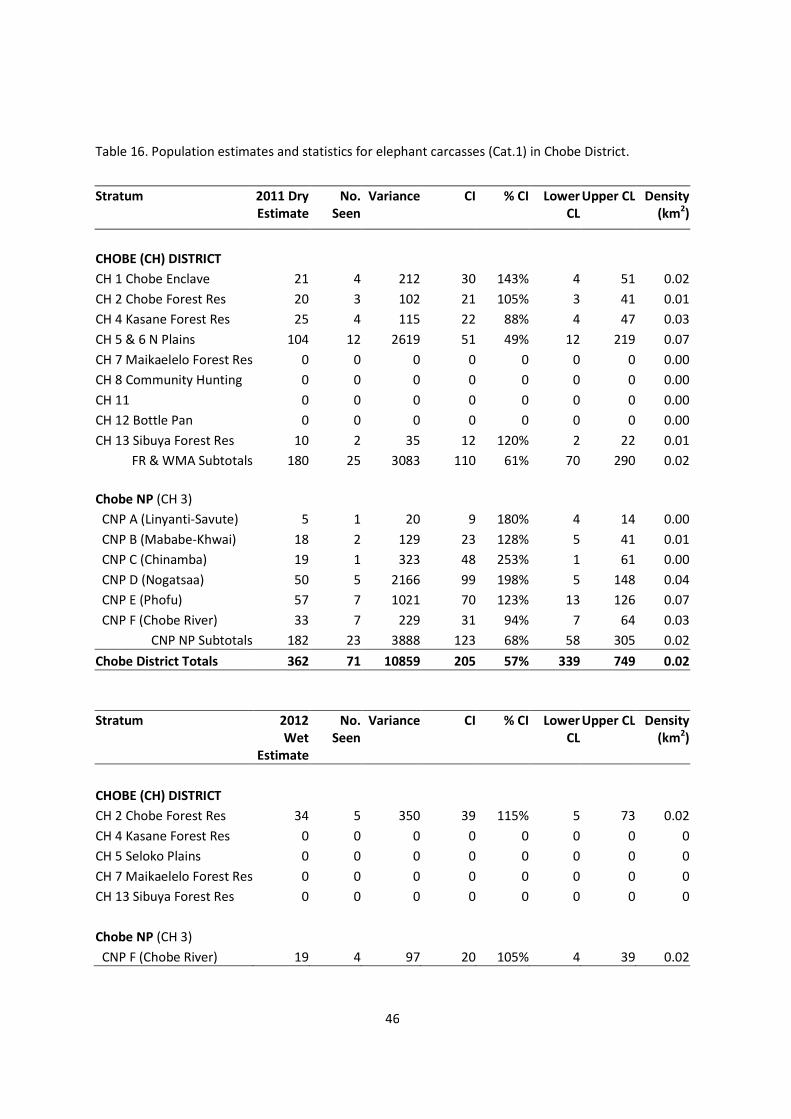
46
Table 16. Population estimates and statistics for elephant carcasses (Cat.1) in Chobe District.
Stratum 2011 Dry
Estimate
No.
Seen
Variance CI % CI Lower
CL
Upper CL Density
(km2)
CHOBE (CH) DISTRICT
CH 1 Chobe Enclave 21 4 212 30 143% 4 51 0.02
CH 2 Chobe Forest Res 20 3 102 21 105% 3 41 0.01
CH 4 Kasane Forest Res 25 4 115 22 88% 4 47 0.03
CH 5 & 6 N Plains 104 12 2619 51 49% 12 219 0.07
CH 7 Maikaelelo Forest Res 0 0 0 0 0 0 0 0.00
CH 8 Community Hunting 0 0 0 0 0 0 0 0.00
CH 11 0 0 0 0 0 0 0 0.00
CH 12 Bottle Pan 0 0 0 0 0 0 0 0.00
CH 13 Sibuya Forest Res 10 2 35 12 120% 2 22 0.01
FR & WMA Subtotals 180 25 3083 110 61% 70 290 0.02
Chobe NP (CH 3)
CNP A (Linyanti-Savute) 5 1 20 9 180% 4 14 0.00
CNP B (Mababe-Khwai) 18 2 129 23 128% 5 41 0.01
CNP C (Chinamba) 19 1 323 48 253% 1 61 0.00
CNP D (Nogatsaa) 50 5 2166 99 198% 5 148 0.04
CNP E (Phofu) 57 7 1021 70 123% 13 126 0.07
CNP F (Chobe River) 33 7 229 31 94% 7 64 0.03
CNP NP Subtotals 182 23 3888 123 68% 58 305 0.02
Chobe District Totals 362 71 10859 205 57% 339 749 0.02
Stratum 2012
Wet
Estimate
No.
Seen
Variance CI % CI Lower
CL
Upper CL Density
(km2)
CHOBE (CH) DISTRICT
CH 2 Chobe Forest Res 34 5 350 39 115% 5 73 0.02
CH 4 Kasane Forest Res 0 0 0 0 0 0 0 0
CH 5 Seloko Plains 0 0 0 0 0 0 0 0
CH 7 Maikaelelo Forest Res 0 0 0 0 0 0 0 0
CH 13 Sibuya Forest Res 0 0 0 0 0 0 0 0
Chobe NP (CH 3)
CNP F (Chobe River) 19 4 97 20 105% 4 39 0.02
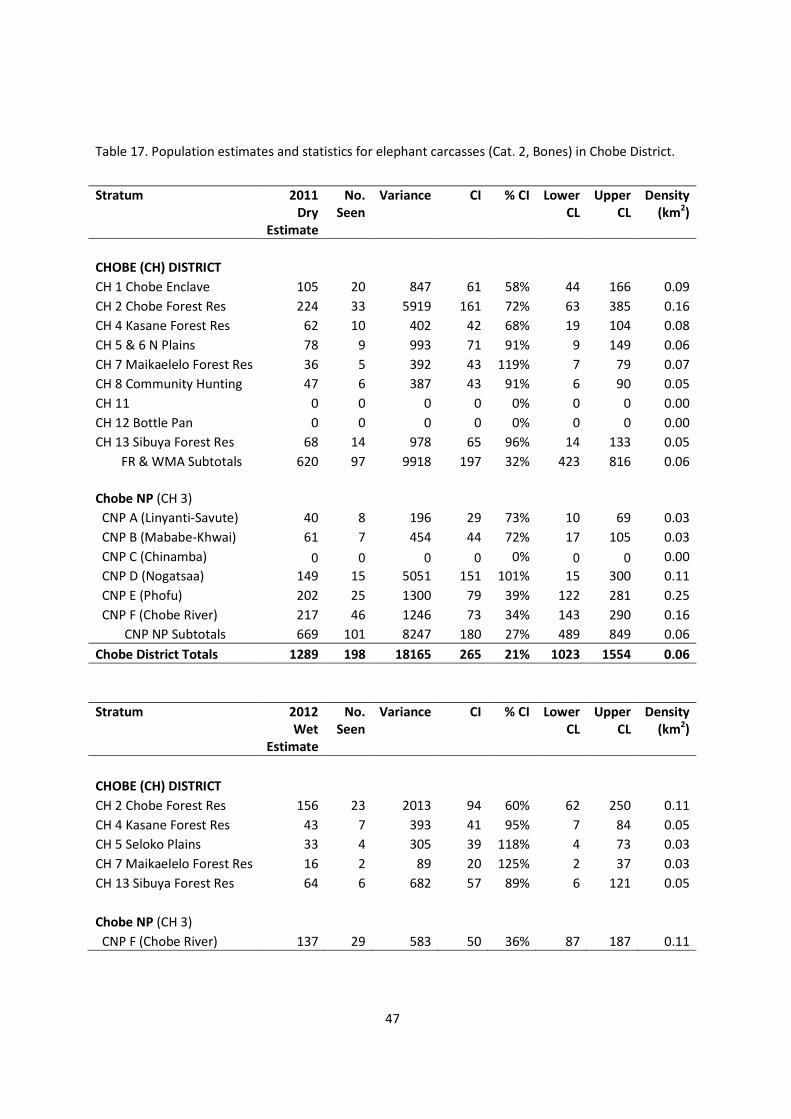
47
Table 17. Population estimates and statistics for elephant carcasses (Cat. 2, Bones) in Chobe District.
Stratum 2011
Dry
Estimate
No.
Seen
Variance CI % CI Lower
CL
Upper
CL
Density
(km2)
CHOBE (CH) DISTRICT
CH 1 Chobe Enclave 105 20 847 61 58% 44 166 0.09
CH 2 Chobe Forest Res 224 33 5919 161 72% 63 385 0.16
CH 4 Kasane Forest Res 62 10 402 42 68% 19 104 0.08
CH 5 & 6 N Plains 78 9 993 71 91% 9 149 0.06
CH 7 Maikaelelo Forest Res 36 5 392 43 119% 7 79 0.07
CH 8 Community Hunting 47 6 387 43 91% 6 90 0.05
CH 11 0 0 0 0 0% 0 0 0.00
CH 12 Bottle Pan 0 0 0 0 0% 0 0 0.00
CH 13 Sibuya Forest Res 68 14 978 65 96% 14 133 0.05
FR & WMA Subtotals 620 97 9918 197 32% 423 816 0.06
Chobe NP (CH 3)
CNP A (Linyanti-Savute) 40 8 196 29 73% 10 69 0.03
CNP B (Mababe-Khwai) 61 7 454 44 72% 17 105 0.03
CNP C (Chinamba) 0 0 0 0 0% 0 0 0.00
CNP D (Nogatsaa) 149 15 5051 151 101% 15 300 0.11
CNP E (Phofu) 202 25 1300 79 39% 122 281 0.25
CNP F (Chobe River) 217 46 1246 73 34% 143 290 0.16
CNP NP Subtotals 669 101 8247 180 27% 489 849 0.06
Chobe District Totals 1289 198 18165 265 21% 1023 1554 0.06
Stratum 2012
Wet
Estimate
No.
Seen
Variance CI % CI Lower
CL
Upper
CL
Density
(km2)
CHOBE (CH) DISTRICT
CH 2 Chobe Forest Res 156 23 2013 94 60% 62 250 0.11
CH 4 Kasane Forest Res 43 7 393 41 95% 7 84 0.05
CH 5 Seloko Plains 33 4 305 39 118% 4 73 0.03
CH 7 Maikaelelo Forest Res 16 2 89 20 125% 2 37 0.03
CH 13 Sibuya Forest Res 64 6 682 57 89% 6 121 0.05
Chobe NP (CH 3)
CNP F (Chobe River) 137 29 583 50 36% 87 187 0.11
48
Figure 18. Distribution and density (km2) of elephant carcasses (Cat.1) in Chobe District during 2011 dry season aerial survey.
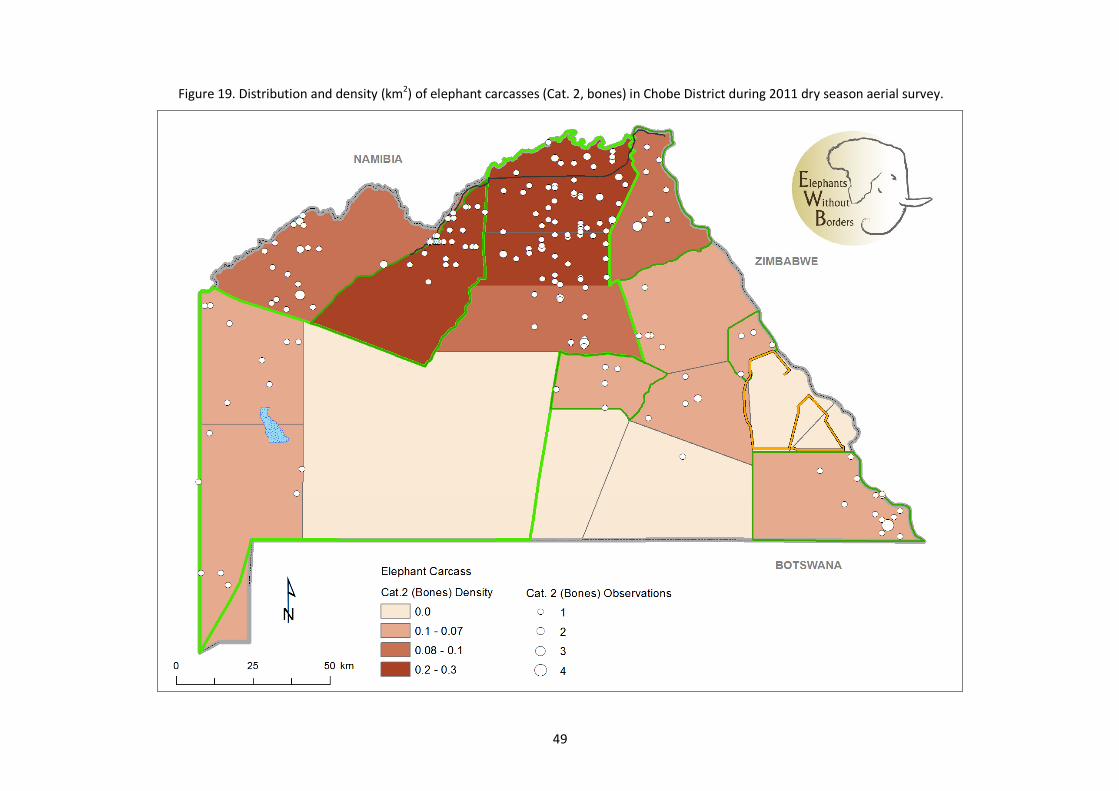
49
Figure 19. Distribution and density (km2) of elephant carcasses (Cat. 2, bones) in Chobe District during 2011 dry season aerial survey.
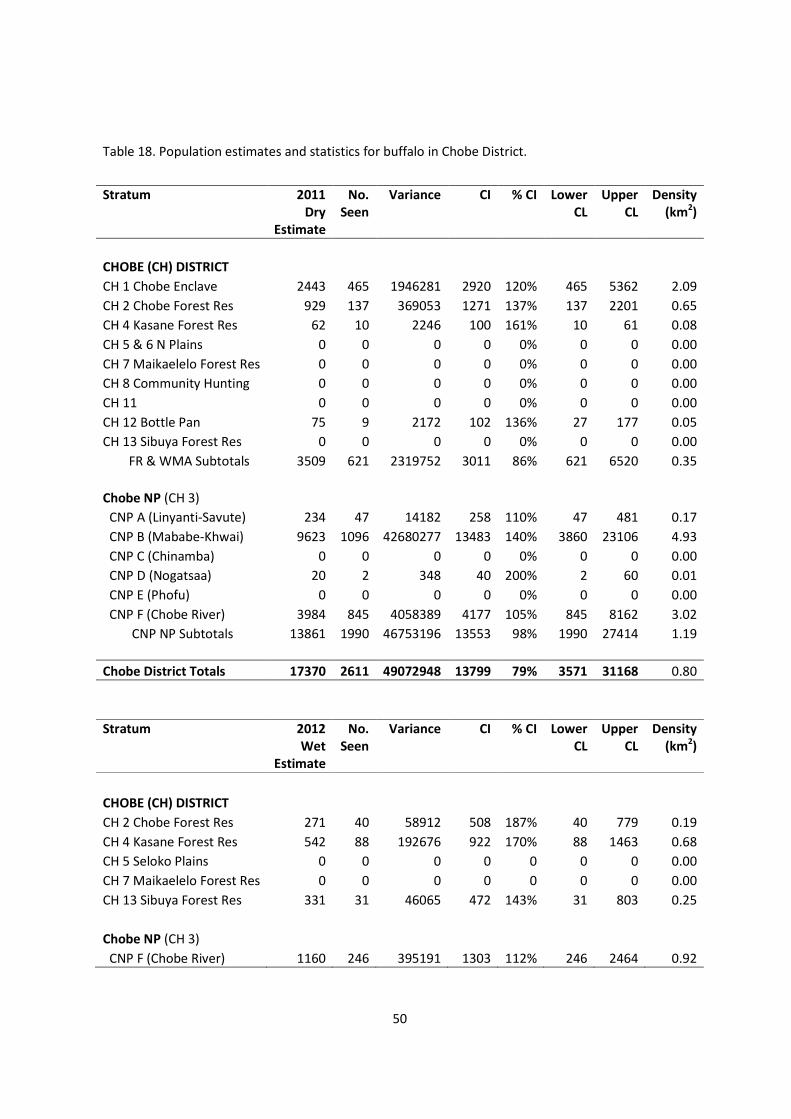
50
Table 18. Population estimates and statistics for buffalo in Chobe District.
Stratum 2011
Dry
Estimate
No.
Seen
Variance CI % CI Lower
CL
Upper
CL
Density
(km2)
CHOBE (CH) DISTRICT
CH 1 Chobe Enclave 2443 465 1946281 2920 120% 465 5362 2.09
CH 2 Chobe Forest Res 929 137 369053 1271 137% 137 2201 0.65
CH 4 Kasane Forest Res 62 10 2246 100 161% 10 61 0.08
CH 5 & 6 N Plains 0 0 0 0 0% 0 0 0.00
CH 7 Maikaelelo Forest Res 0 0 0 0 0% 0 0 0.00
CH 8 Community Hunting 0 0 0 0 0% 0 0 0.00
CH 11 0 0 0 0 0% 0 0 0.00
CH 12 Bottle Pan 75 9 2172 102 136% 27 177 0.05
CH 13 Sibuya Forest Res 0 0 0 0 0% 0 0 0.00
FR & WMA Subtotals 3509 621 2319752 3011 86% 621 6520 0.35
Chobe NP (CH 3)
CNP A (Linyanti-Savute) 234 47 14182 258 110% 47 481 0.17
CNP B (Mababe-Khwai) 9623 1096 42680277 13483 140% 3860 23106 4.93
CNP C (Chinamba) 0 0 0 0 0% 0 0 0.00
CNP D (Nogatsaa) 20 2 348 40 200% 2 60 0.01
CNP E (Phofu) 0 0 0 0 0% 0 0 0.00
CNP F (Chobe River) 3984 845 4058389 4177 105% 845 8162 3.02
CNP NP Subtotals 13861 1990 46753196 13553 98% 1990 27414 1.19
Chobe District Totals 17370 2611 49072948 13799 79% 3571 31168 0.80
Stratum 2012
Wet
Estimate
No.
Seen
Variance CI % CI Lower
CL
Upper
CL
Density
(km2)
CHOBE (CH) DISTRICT
CH 2 Chobe Forest Res 271 40 58912 508 187% 40 779 0.19
CH 4 Kasane Forest Res 542 88 192676 922 170% 88 1463 0.68
CH 5 Seloko Plains 0 0 0 0 0 0 0 0.00
CH 7 Maikaelelo Forest Res 0 0 0 0 0 0 0 0.00
CH 13 Sibuya Forest Res 331 31 46065 472 143% 31 803 0.25
Chobe NP (CH 3)
CNP F (Chobe River) 1160 246 395191 1303 112% 246 2464 0.92
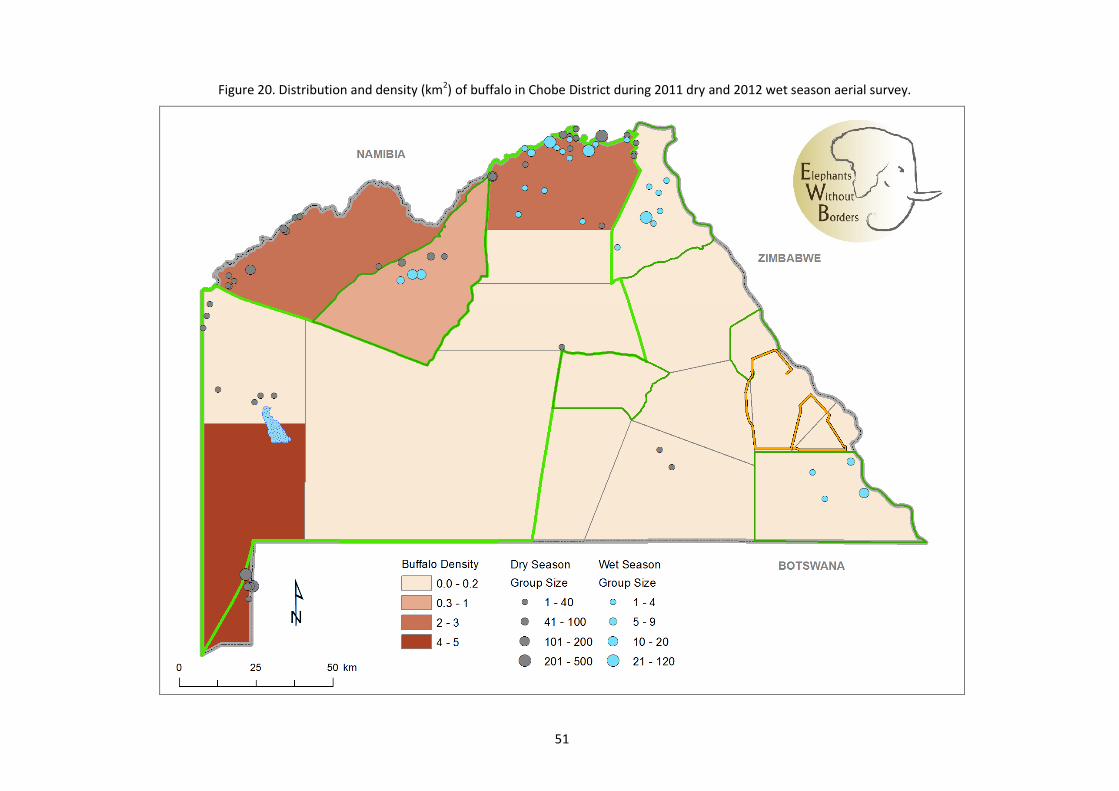
51
Figure 20. Distribution and density (km2) of buffalo in Chobe District during 2011 dry and 2012 wet season aerial survey.
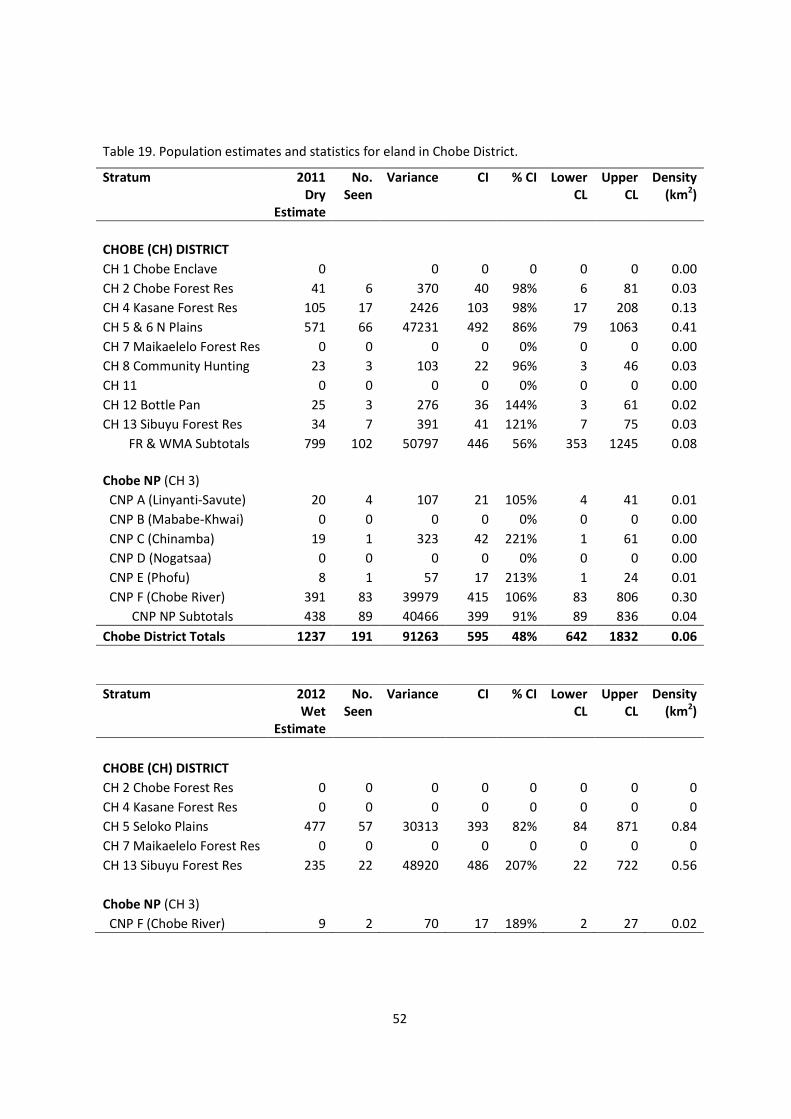
52
Table 19. Population estimates and statistics for eland in Chobe District.
Stratum 2011
Dry
Estimate
No.
Seen
Variance CI % CI Lower
CL
Upper
CL
Density
(km2)
CHOBE (CH) DISTRICT
CH 1 Chobe Enclave 0 0 0 0 0 0 0.00
CH 2 Chobe Forest Res 41 6 370 40 98% 6 81 0.03
CH 4 Kasane Forest Res 105 17 2426 103 98% 17 208 0.13
CH 5 & 6 N Plains 571 66 47231 492 86% 79 1063 0.41
CH 7 Maikaelelo Forest Res 0 0 0 0 0% 0 0 0.00
CH 8 Community Hunting 23 3 103 22 96% 3 46 0.03
CH 11 0 0 0 0 0% 0 0 0.00
CH 12 Bottle Pan 25 3 276 36 144% 3 61 0.02
CH 13 Sibuyu Forest Res 34 7 391 41 121% 7 75 0.03
FR & WMA Subtotals 799 102 50797 446 56% 353 1245 0.08
Chobe NP (CH 3)
CNP A (Linyanti-Savute) 20 4 107 21 105% 4 41 0.01
CNP B (Mababe-Khwai) 0 0 0 0 0% 0 0 0.00
CNP C (Chinamba) 19 1 323 42 221% 1 61 0.00
CNP D (Nogatsaa) 0 0 0 0 0% 0 0 0.00
CNP E (Phofu) 8 1 57 17 213% 1 24 0.01
CNP F (Chobe River) 391 83 39979 415 106% 83 806 0.30
CNP NP Subtotals 438 89 40466 399 91% 89 836 0.04
Chobe District Totals 1237 191 91263 595 48% 642 1832 0.06
Stratum 2012
Wet
Estimate
No.
Seen
Variance CI % CI Lower
CL
Upper
CL
Density
(km2)
CHOBE (CH) DISTRICT
CH 2 Chobe Forest Res 0 0 0 0 0 0 0 0
CH 4 Kasane Forest Res 0 0 0 0 0 0 0 0
CH 5 Seloko Plains 477 57 30313 393 82% 84 871 0.84
CH 7 Maikaelelo Forest Res 0 0 0 0 0 0 0 0
CH 13 Sibuyu Forest Res 235 22 48920 486 207% 22 722 0.56
Chobe NP (CH 3)
CNP F (Chobe River) 9 2 70 17 189% 2 27 0.02
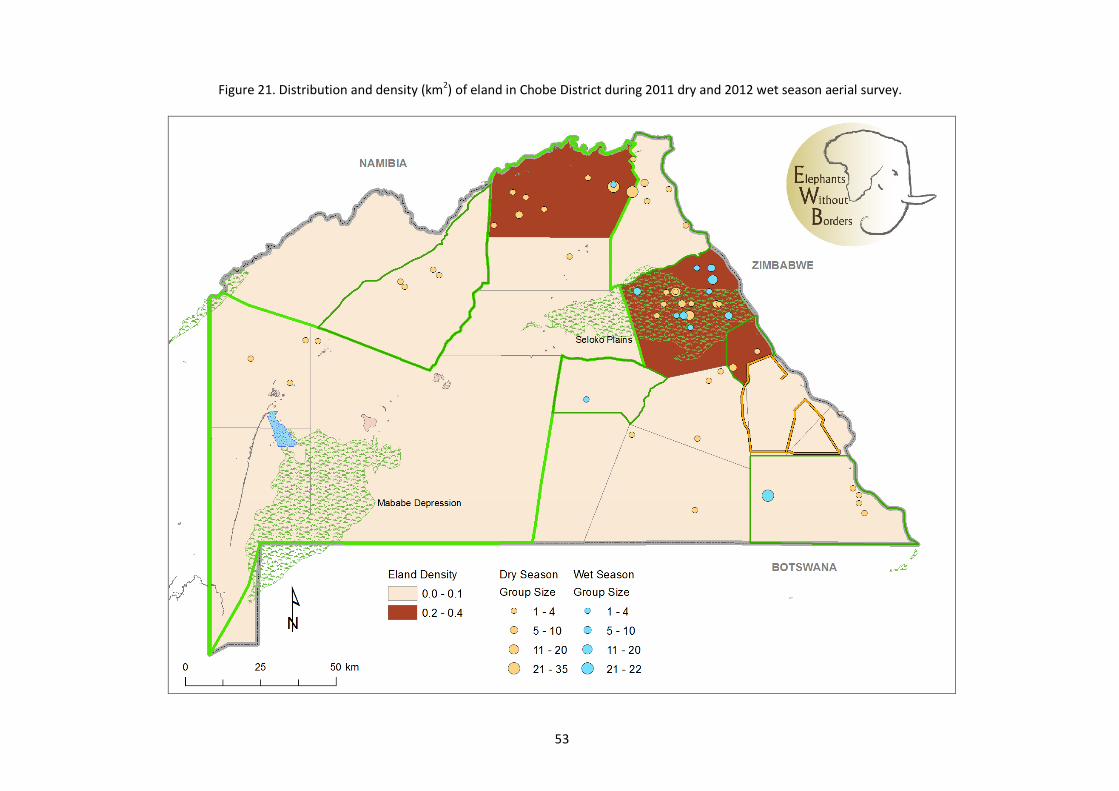
53
Figure 21. Distribution and density (km2) of eland in Chobe District during 2011 dry and 2012 wet season aerial survey.
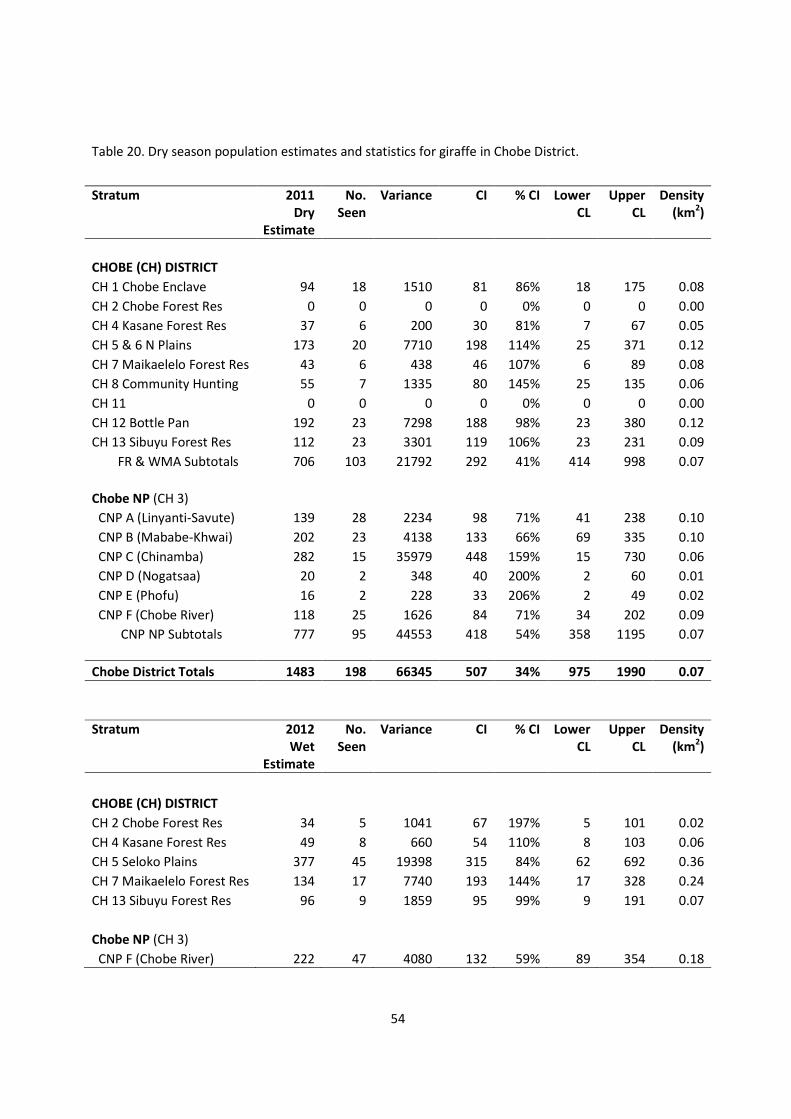
54
Table 20. Dry season population estimates and statistics for giraffe in Chobe District.
Stratum 2011
Dry
Estimate
No.
Seen
Variance CI % CI Lower
CL
Upper
CL
Density
(km2)
CHOBE (CH) DISTRICT
CH 1 Chobe Enclave 94 18 1510 81 86% 18 175 0.08
CH 2 Chobe Forest Res 0 0 0 0 0% 0 0 0.00
CH 4 Kasane Forest Res 37 6 200 30 81% 7 67 0.05
CH 5 & 6 N Plains 173 20 7710 198 114% 25 371 0.12
CH 7 Maikaelelo Forest Res 43 6 438 46 107% 6 89 0.08
CH 8 Community Hunting 55 7 1335 80 145% 25 135 0.06
CH 11 0 0 0 0 0% 0 0 0.00
CH 12 Bottle Pan 192 23 7298 188 98% 23 380 0.12
CH 13 Sibuyu Forest Res 112 23 3301 119 106% 23 231 0.09
FR & WMA Subtotals 706 103 21792 292 41% 414 998 0.07
Chobe NP (CH 3)
CNP A (Linyanti-Savute) 139 28 2234 98 71% 41 238 0.10
CNP B (Mababe-Khwai) 202 23 4138 133 66% 69 335 0.10
CNP C (Chinamba) 282 15 35979 448 159% 15 730 0.06
CNP D (Nogatsaa) 20 2 348 40 200% 2 60 0.01
CNP E (Phofu) 16 2 228 33 206% 2 49 0.02
CNP F (Chobe River) 118 25 1626 84 71% 34 202 0.09
CNP NP Subtotals 777 95 44553 418 54% 358 1195 0.07
Chobe District Totals 1483 198 66345 507 34% 975 1990 0.07
Stratum 2012
Wet
Estimate
No.
Seen
Variance CI % CI Lower
CL
Upper
CL
Density
(km2)
CHOBE (CH) DISTRICT
CH 2 Chobe Forest Res 34 5 1041 67 197% 5 101 0.02
CH 4 Kasane Forest Res 49 8 660 54 110% 8 103 0.06
CH 5 Seloko Plains 377 45 19398 315 84% 62 692 0.36
CH 7 Maikaelelo Forest Res 134 17 7740 193 144% 17 328 0.24
CH 13 Sibuyu Forest Res 96 9 1859 95 99% 9 191 0.07
Chobe NP (CH 3)
CNP F (Chobe River) 222 47 4080 132 59% 89 354 0.18
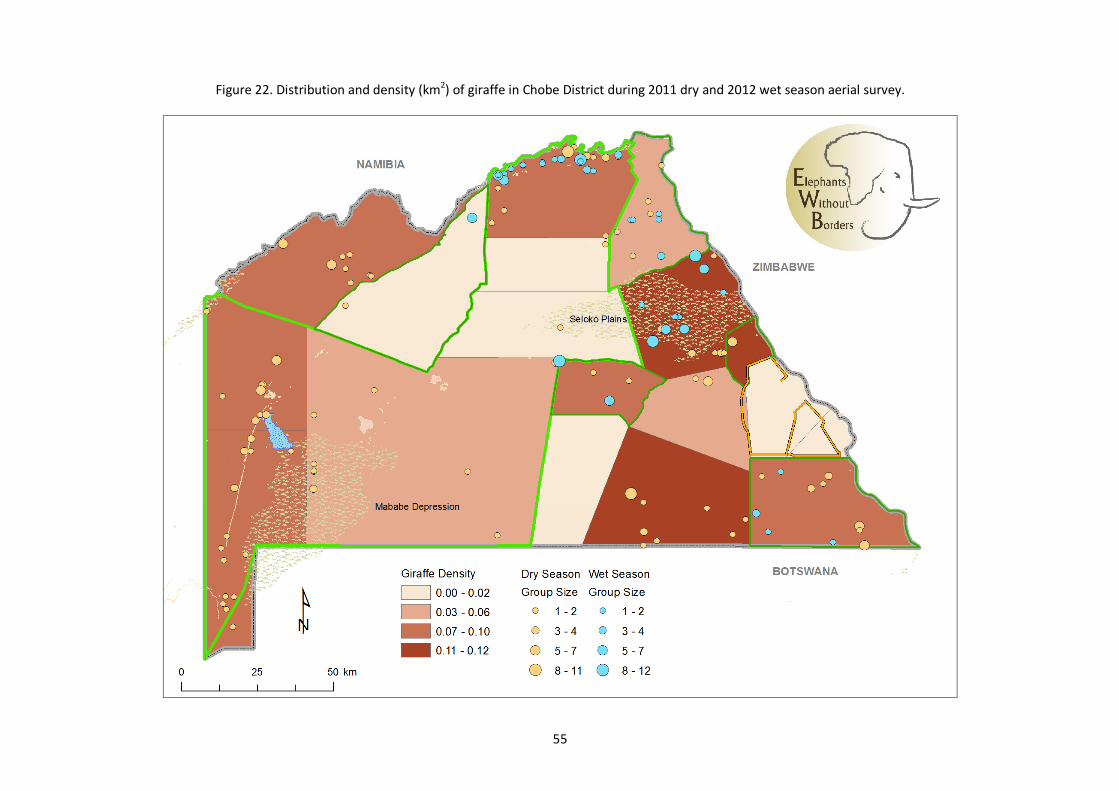
55
Figure 22. Distribution and density (km2) of giraffe in Chobe District during 2011 dry and 2012 wet season aerial survey.
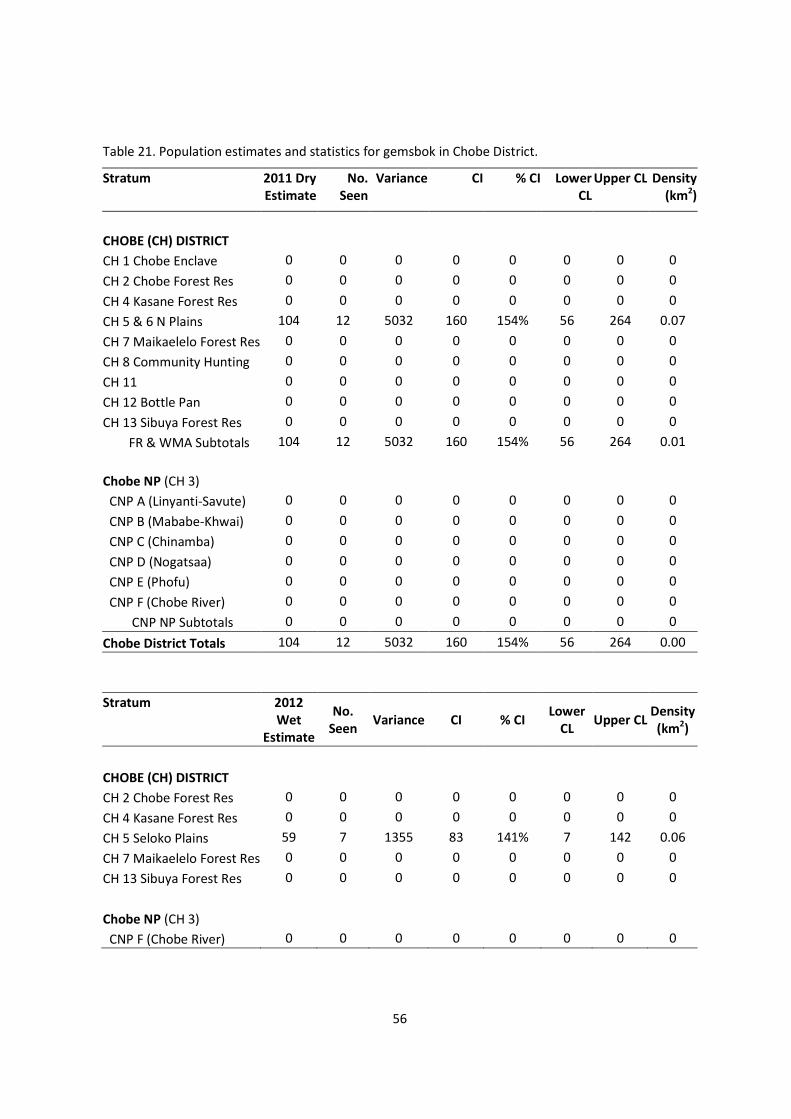
56
Table 21. Population estimates and statistics for gemsbok in Chobe District.
Stratum 2011 Dry
Estimate
No.
Seen
Variance CI % CI Lower
CL
Upper CL Density
(km2)
CHOBE (CH) DISTRICT
CH 1 Chobe Enclave 0 0 0 0 0 0 0 0
CH 2 Chobe Forest Res 0 0 0 0 0 0 0 0
CH 4 Kasane Forest Res 0 0 0 0 0 0 0 0
CH 5 & 6 N Plains 104 12 5032 160 154% 56 264 0.07
CH 7 Maikaelelo Forest Res 0 0 0 0 0 0 0 0
CH 8 Community Hunting 0 0 0 0 0 0 0 0
CH 11 0 0 0 0 0 0 0 0
CH 12 Bottle Pan 0 0 0 0 0 0 0 0
CH 13 Sibuya Forest Res 0 0 0 0 0 0 0 0
FR & WMA Subtotals 104 12 5032 160 154% 56 264 0.01
Chobe NP (CH 3)
CNP A (Linyanti-Savute) 0 0 0 0 0 0 0 0
CNP B (Mababe-Khwai) 0 0 0 0 0 0 0 0
CNP C (Chinamba) 0 0 0 0 0 0 0 0
CNP D (Nogatsaa) 0 0 0 0 0 0 0 0
CNP E (Phofu) 0 0 0 0 0 0 0 0
CNP F (Chobe River) 0 0 0 0 0 0 0 0
CNP NP Subtotals 0 0 0 0 0 0 0 0
Chobe District Totals 104 12 5032 160 154% 56 264 0.00
Stratum 2012
Wet
Estimate
No.
Seen Variance CI % CI
Lower
CL Upper CL
Density
(km2)
CHOBE (CH) DISTRICT
CH 2 Chobe Forest Res 0 0 0 0 0 0 0 0
CH 4 Kasane Forest Res 0 0 0 0 0 0 0 0
CH 5 Seloko Plains 59 7 1355 83 141% 7 142 0.06
CH 7 Maikaelelo Forest Res 0 0 0 0 0 0 0 0
CH 13 Sibuya Forest Res 0 0 0 0 0 0 0 0
Chobe NP (CH 3)
CNP F (Chobe River) 0 0 0 0 0 0 0 0
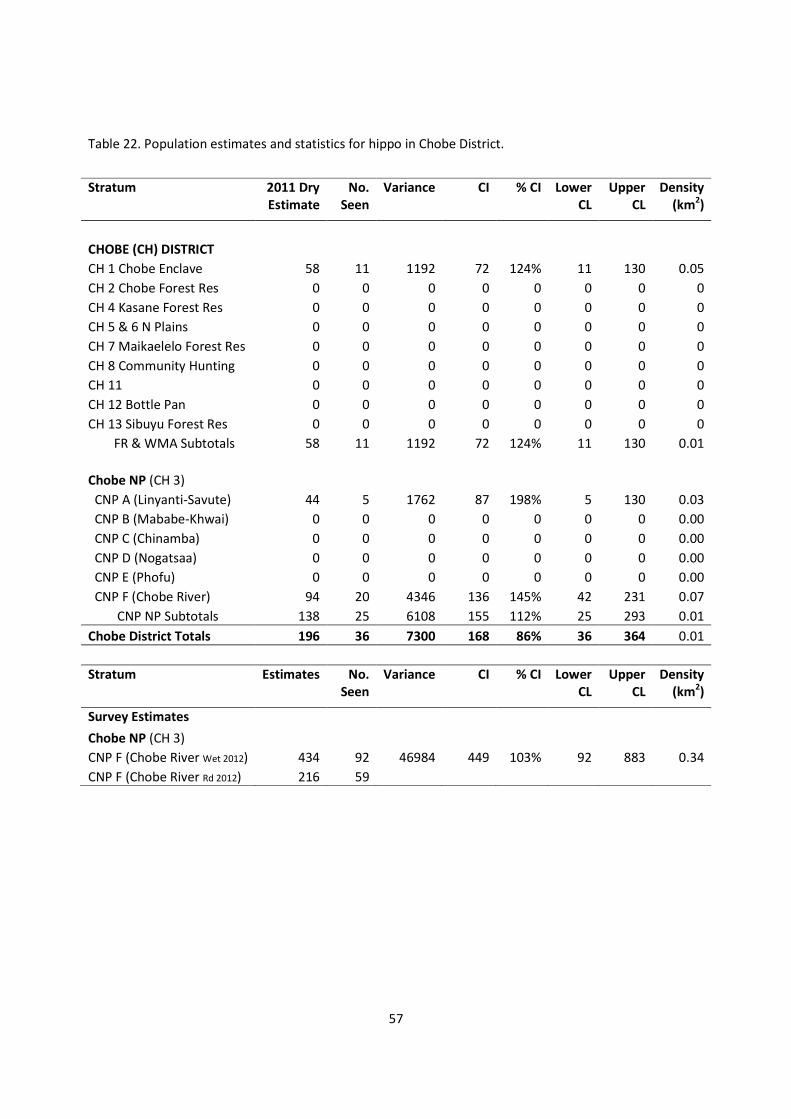
57
Table 22. Population estimates and statistics for hippo in Chobe District.
Stratum 2011 Dry
Estimate
No.
Seen
Variance CI % CI Lower
CL
Upper
CL
Density
(km2)
CHOBE (CH) DISTRICT
CH 1 Chobe Enclave 58 11 1192 72 124% 11 130 0.05
CH 2 Chobe Forest Res 0 0 0 0 0 0 0 0
CH 4 Kasane Forest Res 0 0 0 0 0 0 0 0
CH 5 & 6 N Plains 0 0 0 0 0 0 0 0
CH 7 Maikaelelo Forest Res 0 0 0 0 0 0 0 0
CH 8 Community Hunting 0 0 0 0 0 0 0 0
CH 11 0 0 0 0 0 0 0 0
CH 12 Bottle Pan 0 0 0 0 0 0 0 0
CH 13 Sibuyu Forest Res 0 0 0 0 0 0 0 0
FR & WMA Subtotals 58 11 1192 72 124% 11 130 0.01
Chobe NP (CH 3)
CNP A (Linyanti-Savute) 44 5 1762 87 198% 5 130 0.03
CNP B (Mababe-Khwai) 0 0 0 0 0 0 0 0.00
CNP C (Chinamba) 0 0 0 0 0 0 0 0.00
CNP D (Nogatsaa) 0 0 0 0 0 0 0 0.00
CNP E (Phofu) 0 0 0 0 0 0 0 0.00
CNP F (Chobe River) 94 20 4346 136 145% 42 231 0.07
CNP NP Subtotals 138 25 6108 155 112% 25 293 0.01
Chobe District Totals 196 36 7300 168 86% 36 364 0.01
Stratum Estimates No.
Seen
Variance CI % CI Lower
CL
Upper
CL
Density
(km2)
Survey Estimates
Chobe NP (CH 3)
CNP F (Chobe River Wet 2012) 434 92 46984 449 103% 92 883 0.34
CNP F (Chobe River Rd 2012) 216 59
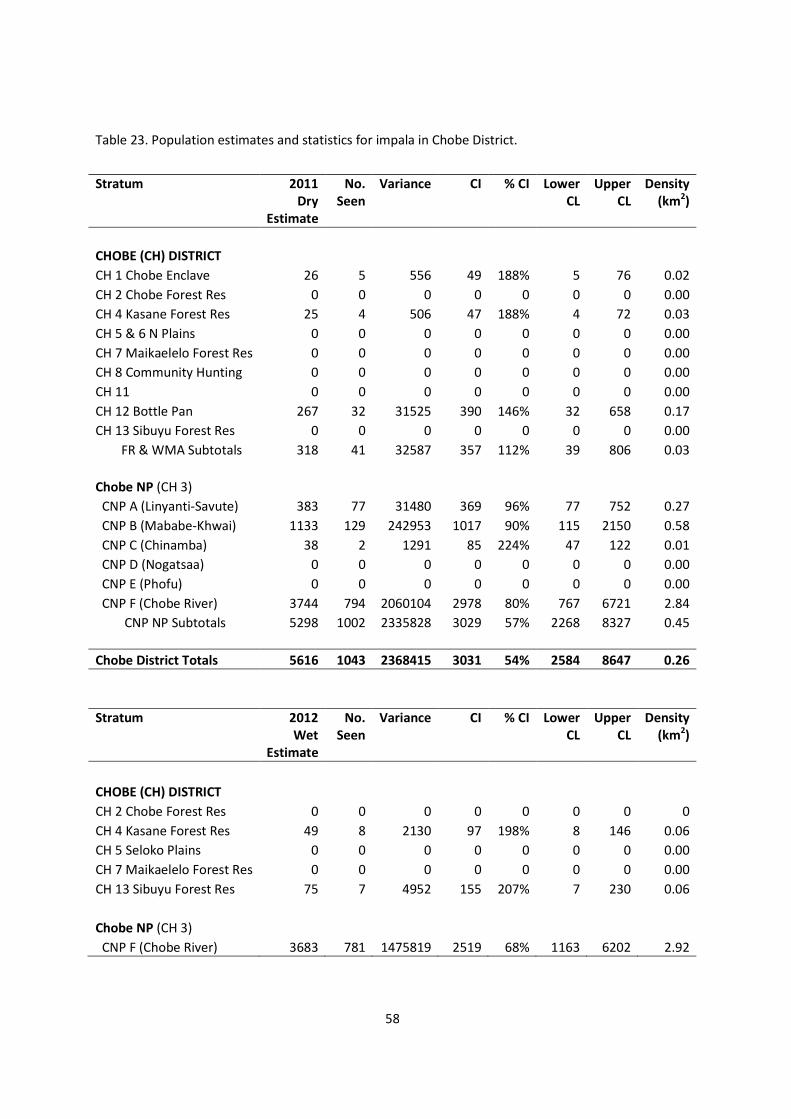
58
Table 23. Population estimates and statistics for impala in Chobe District.
Stratum 2011
Dry
Estimate
No.
Seen
Variance CI % CI Lower
CL
Upper
CL
Density
(km2)
CHOBE (CH) DISTRICT
CH 1 Chobe Enclave 26 5 556 49 188% 5 76 0.02
CH 2 Chobe Forest Res 0 0 0 0 0 0 0 0.00
CH 4 Kasane Forest Res 25 4 506 47 188% 4 72 0.03
CH 5 & 6 N Plains 0 0 0 0 0 0 0 0.00
CH 7 Maikaelelo Forest Res 0 0 0 0 0 0 0 0.00
CH 8 Community Hunting 0 0 0 0 0 0 0 0.00
CH 11 0 0 0 0 0 0 0 0.00
CH 12 Bottle Pan 267 32 31525 390 146% 32 658 0.17
CH 13 Sibuyu Forest Res 0 0 0 0 0 0 0 0.00
FR & WMA Subtotals 318 41 32587 357 112% 39 806 0.03
Chobe NP (CH 3)
CNP A (Linyanti-Savute) 383 77 31480 369 96% 77 752 0.27
CNP B (Mababe-Khwai) 1133 129 242953 1017 90% 115 2150 0.58
CNP C (Chinamba) 38 2 1291 85 224% 47 122 0.01
CNP D (Nogatsaa) 0 0 0 0 0 0 0 0.00
CNP E (Phofu) 0 0 0 0 0 0 0 0.00
CNP F (Chobe River) 3744 794 2060104 2978 80% 767 6721 2.84
CNP NP Subtotals 5298 1002 2335828 3029 57% 2268 8327 0.45
Chobe District Totals 5616 1043 2368415 3031 54% 2584 8647 0.26
Stratum 2012
Wet
Estimate
No.
Seen
Variance CI % CI Lower
CL
Upper
CL
Density
(km2)
CHOBE (CH) DISTRICT
CH 2 Chobe Forest Res 0 0 0 0 0 0 0 0
CH 4 Kasane Forest Res 49 8 2130 97 198% 8 146 0.06
CH 5 Seloko Plains 0 0 0 0 0 0 0 0.00
CH 7 Maikaelelo Forest Res 0 0 0 0 0 0 0 0.00
CH 13 Sibuyu Forest Res 75 7 4952 155 207% 7 230 0.06
Chobe NP (CH 3)
CNP F (Chobe River) 3683 781 1475819 2519 68% 1163 6202 2.92

59
Figure 23. Distribution and density (km2) of impala in Chobe District during 2011 dry season aerial survey.
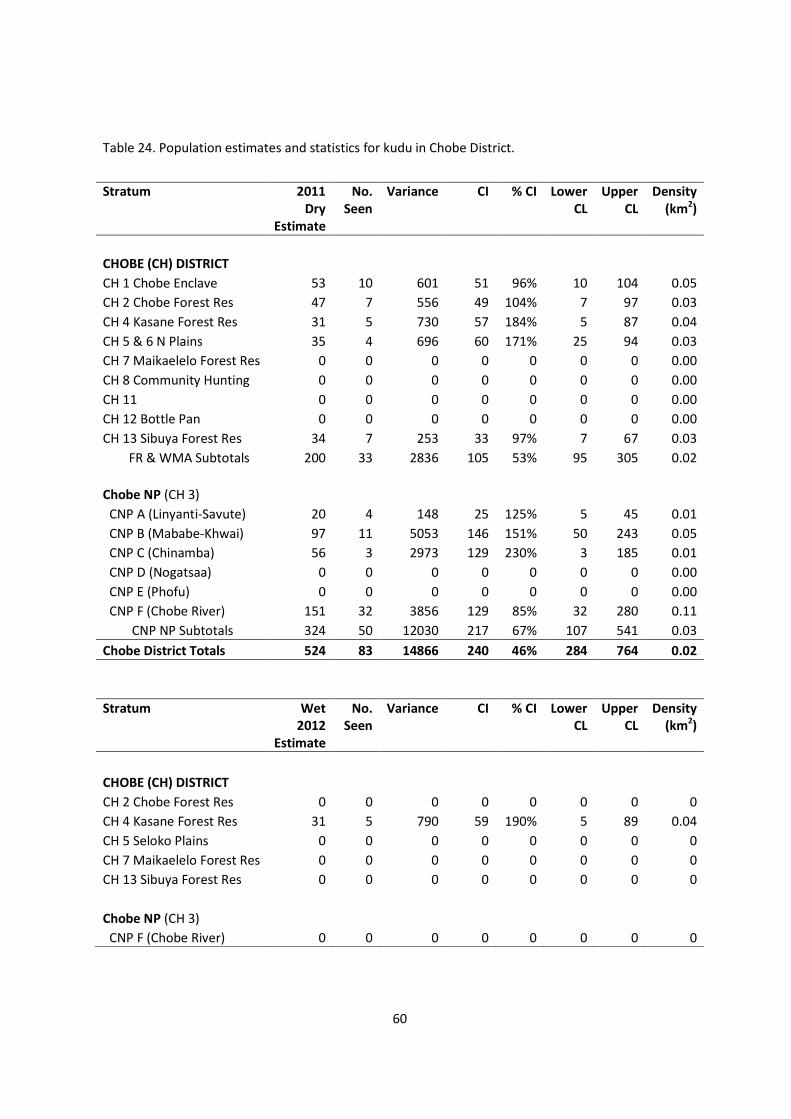
60
Table 24. Population estimates and statistics for kudu in Chobe District.
Stratum 2011
Dry
Estimate
No.
Seen
Variance CI % CI Lower
CL
Upper
CL
Density
(km2)
CHOBE (CH) DISTRICT
CH 1 Chobe Enclave 53 10 601 51 96% 10 104 0.05
CH 2 Chobe Forest Res 47 7 556 49 104% 7 97 0.03
CH 4 Kasane Forest Res 31 5 730 57 184% 5 87 0.04
CH 5 & 6 N Plains 35 4 696 60 171% 25 94 0.03
CH 7 Maikaelelo Forest Res 0 0 0 0 0 0 0 0.00
CH 8 Community Hunting 0 0 0 0 0 0 0 0.00
CH 11 0 0 0 0 0 0 0 0.00
CH 12 Bottle Pan 0 0 0 0 0 0 0 0.00
CH 13 Sibuya Forest Res 34 7 253 33 97% 7 67 0.03
FR & WMA Subtotals 200 33 2836 105 53% 95 305 0.02
Chobe NP (CH 3)
CNP A (Linyanti-Savute) 20 4 148 25 125% 5 45 0.01
CNP B (Mababe-Khwai) 97 11 5053 146 151% 50 243 0.05
CNP C (Chinamba) 56 3 2973 129 230% 3 185 0.01
CNP D (Nogatsaa) 0 0 0 0 0 0 0 0.00
CNP E (Phofu) 0 0 0 0 0 0 0 0.00
CNP F (Chobe River) 151 32 3856 129 85% 32 280 0.11
CNP NP Subtotals 324 50 12030 217 67% 107 541 0.03
Chobe District Totals 524 83 14866 240 46% 284 764 0.02
Stratum Wet
2012
Estimate
No.
Seen
Variance CI % CI Lower
CL
Upper
CL
Density
(km2)
CHOBE (CH) DISTRICT
CH 2 Chobe Forest Res 0 0 0 0 0 0 0 0
CH 4 Kasane Forest Res 31 5 790 59 190% 5 89 0.04
CH 5 Seloko Plains 0 0 0 0 0 0 0 0
CH 7 Maikaelelo Forest Res 0 0 0 0 0 0 0 0
CH 13 Sibuya Forest Res 0 0 0 0 0 0 0 0
Chobe NP (CH 3)
CNP F (Chobe River) 0 0 0 0 0 0 0 0
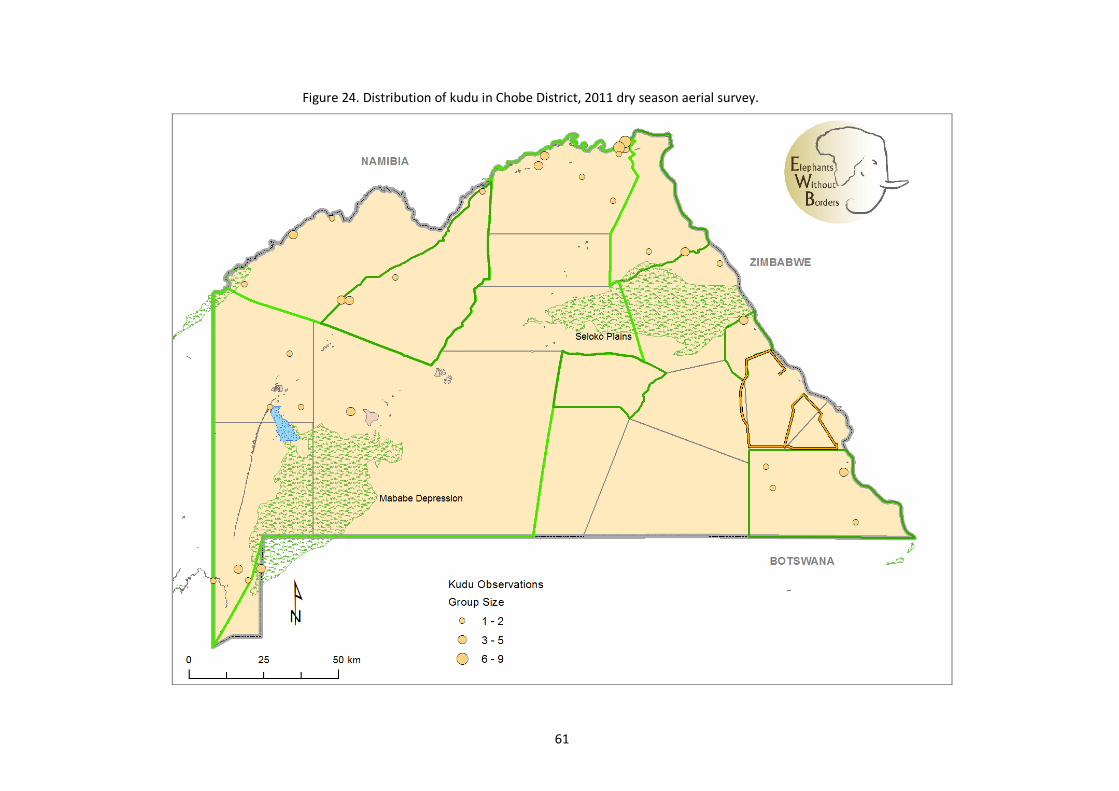
61
Figure 24. Distribution of kudu in Chobe District, 2011 dry season aerial survey.
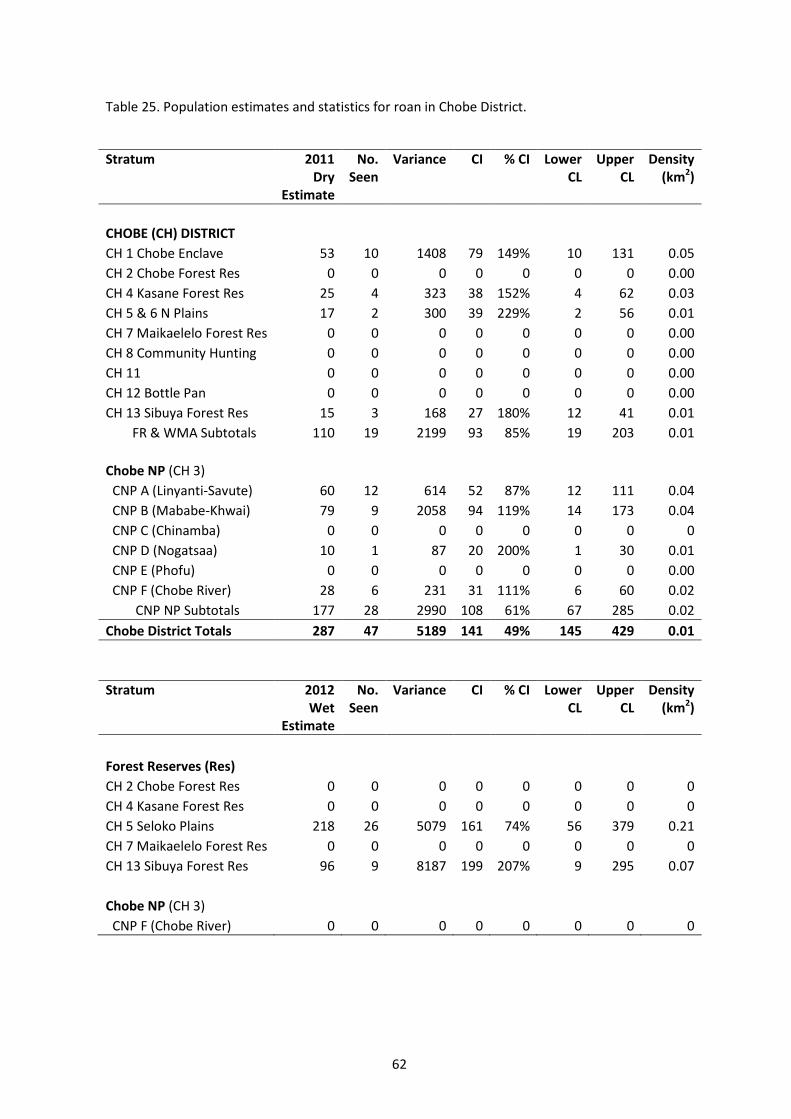
62
Table 25. Population estimates and statistics for roan in Chobe District.
Stratum 2011
Dry
Estimate
No.
Seen
Variance CI % CI Lower
CL
Upper
CL
Density
(km2)
CHOBE (CH) DISTRICT
CH 1 Chobe Enclave 53 10 1408 79 149% 10 131 0.05
CH 2 Chobe Forest Res 0 0 0 0 0 0 0 0.00
CH 4 Kasane Forest Res 25 4 323 38 152% 4 62 0.03
CH 5 & 6 N Plains 17 2 300 39 229% 2 56 0.01
CH 7 Maikaelelo Forest Res 0 0 0 0 0 0 0 0.00
CH 8 Community Hunting 0 0 0 0 0 0 0 0.00
CH 11 0 0 0 0 0 0 0 0.00
CH 12 Bottle Pan 0 0 0 0 0 0 0 0.00
CH 13 Sibuya Forest Res 15 3 168 27 180% 12 41 0.01
FR & WMA Subtotals 110 19 2199 93 85% 19 203 0.01
Chobe NP (CH 3)
CNP A (Linyanti-Savute) 60 12 614 52 87% 12 111 0.04
CNP B (Mababe-Khwai) 79 9 2058 94 119% 14 173 0.04
CNP C (Chinamba) 0 0 0 0 0 0 0 0
CNP D (Nogatsaa) 10 1 87 20 200% 1 30 0.01
CNP E (Phofu) 0 0 0 0 0 0 0 0.00
CNP F (Chobe River) 28 6 231 31 111% 6 60 0.02
CNP NP Subtotals 177 28 2990 108 61% 67 285 0.02
Chobe District Totals 287 47 5189 141 49% 145 429 0.01
Stratum 2012
Wet
Estimate
No.
Seen
Variance CI % CI Lower
CL
Upper
CL
Density
(km2)
Forest Reserves (Res)
CH 2 Chobe Forest Res 0 0 0 0 0 0 0 0
CH 4 Kasane Forest Res 0 0 0 0 0 0 0 0
CH 5 Seloko Plains 218 26 5079 161 74% 56 379 0.21
CH 7 Maikaelelo Forest Res 0 0 0 0 0 0 0 0
CH 13 Sibuya Forest Res 96 9 8187 199 207% 9 295 0.07
Chobe NP (CH 3)
CNP F (Chobe River) 0 0 0 0 0 0 0 0
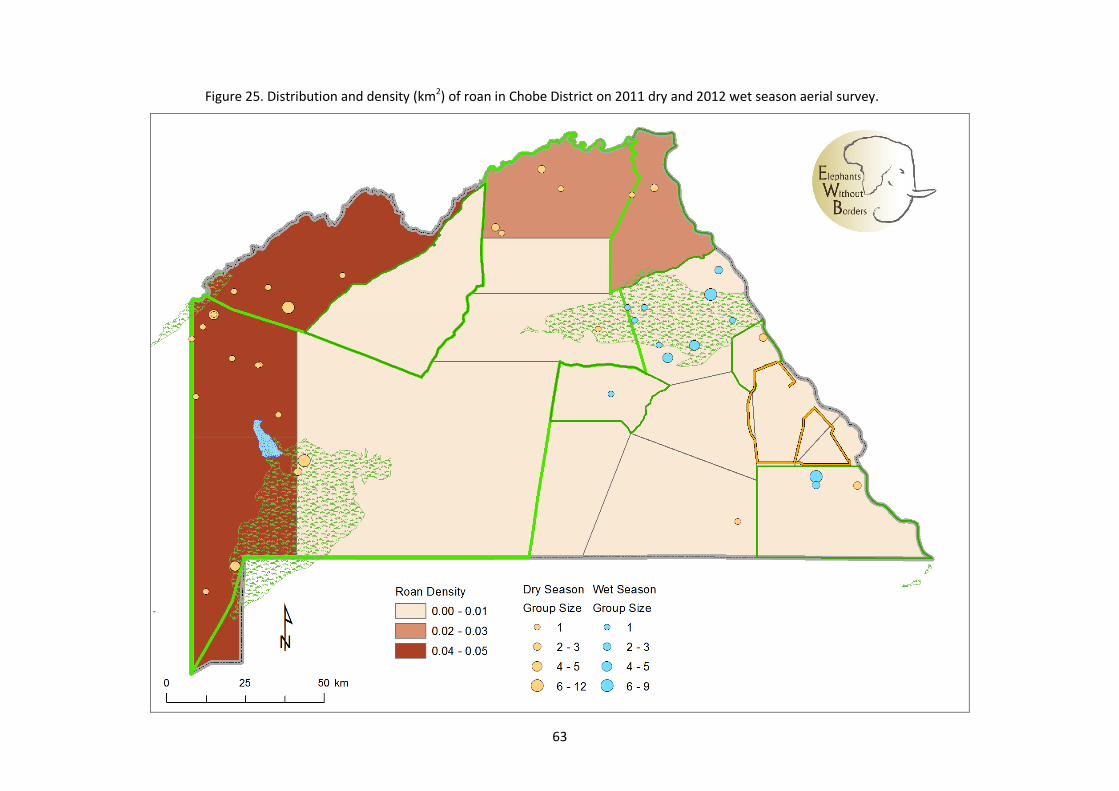
63
Figure 25. Distribution and density (km2) of roan in Chobe District on 2011 dry and 2012 wet season aerial survey.
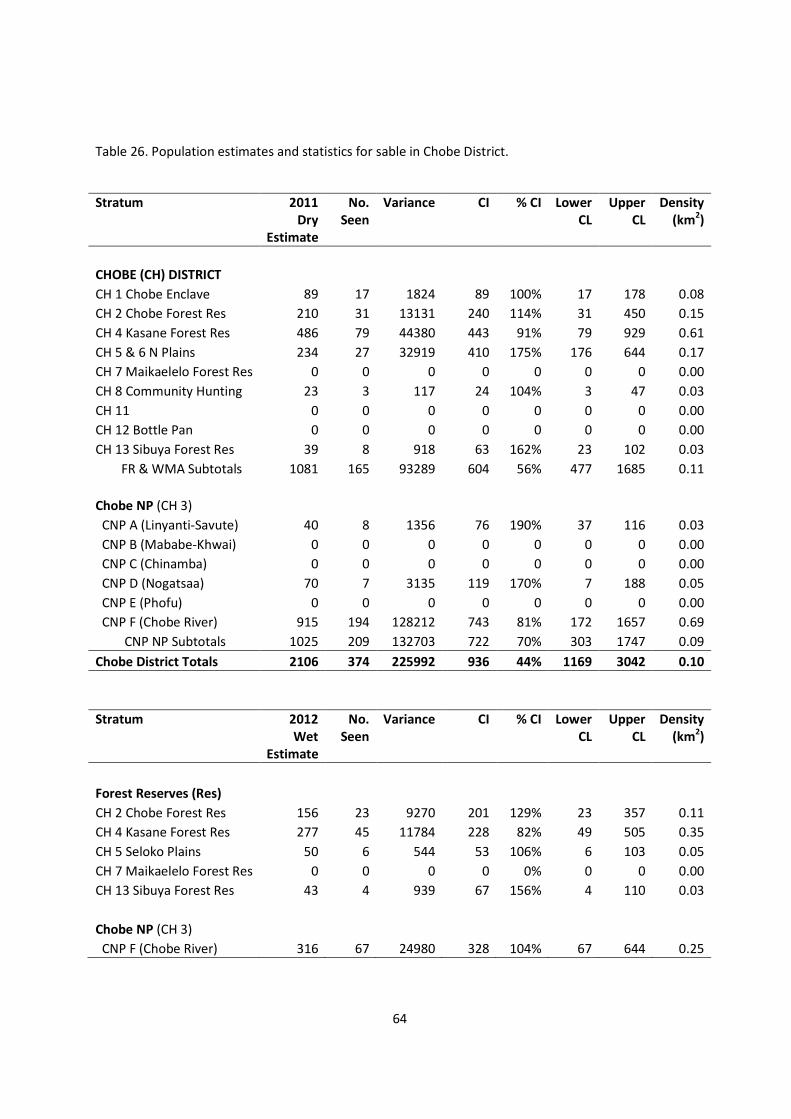
64
Table 26. Population estimates and statistics for sable in Chobe District.
Stratum 2011
Dry
Estimate
No.
Seen
Variance CI % CI Lower
CL
Upper
CL
Density
(km2)
CHOBE (CH) DISTRICT
CH 1 Chobe Enclave 89 17 1824 89 100% 17 178 0.08
CH 2 Chobe Forest Res 210 31 13131 240 114% 31 450 0.15
CH 4 Kasane Forest Res 486 79 44380 443 91% 79 929 0.61
CH 5 & 6 N Plains 234 27 32919 410 175% 176 644 0.17
CH 7 Maikaelelo Forest Res 0 0 0 0 0 0 0 0.00
CH 8 Community Hunting 23 3 117 24 104% 3 47 0.03
CH 11 0 0 0 0 0 0 0 0.00
CH 12 Bottle Pan 0 0 0 0 0 0 0 0.00
CH 13 Sibuya Forest Res 39 8 918 63 162% 23 102 0.03
FR & WMA Subtotals 1081 165 93289 604 56% 477 1685 0.11
Chobe NP (CH 3)
CNP A (Linyanti-Savute) 40 8 1356 76 190% 37 116 0.03
CNP B (Mababe-Khwai) 0 0 0 0 0 0 0 0.00
CNP C (Chinamba) 0 0 0 0 0 0 0 0.00
CNP D (Nogatsaa) 70 7 3135 119 170% 7 188 0.05
CNP E (Phofu) 0 0 0 0 0 0 0 0.00
CNP F (Chobe River) 915 194 128212 743 81% 172 1657 0.69
CNP NP Subtotals 1025 209 132703 722 70% 303 1747 0.09
Chobe District Totals 2106 374 225992 936 44% 1169 3042 0.10
Stratum 2012
Wet
Estimate
No.
Seen
Variance CI % CI Lower
CL
Upper
CL
Density
(km2)
Forest Reserves (Res)
CH 2 Chobe Forest Res 156 23 9270 201 129% 23 357 0.11
CH 4 Kasane Forest Res 277 45 11784 228 82% 49 505 0.35
CH 5 Seloko Plains 50 6 544 53 106% 6 103 0.05
CH 7 Maikaelelo Forest Res 0 0 0 0 0% 0 0 0.00
CH 13 Sibuya Forest Res 43 4 939 67 156% 4 110 0.03
Chobe NP (CH 3)
CNP F (Chobe River) 316 67 24980 328 104% 67 644 0.25

65
Figure 26. Distribution and density (km2) of sable in Chobe District on 2011 dry and 2012 wet season aerial survey.
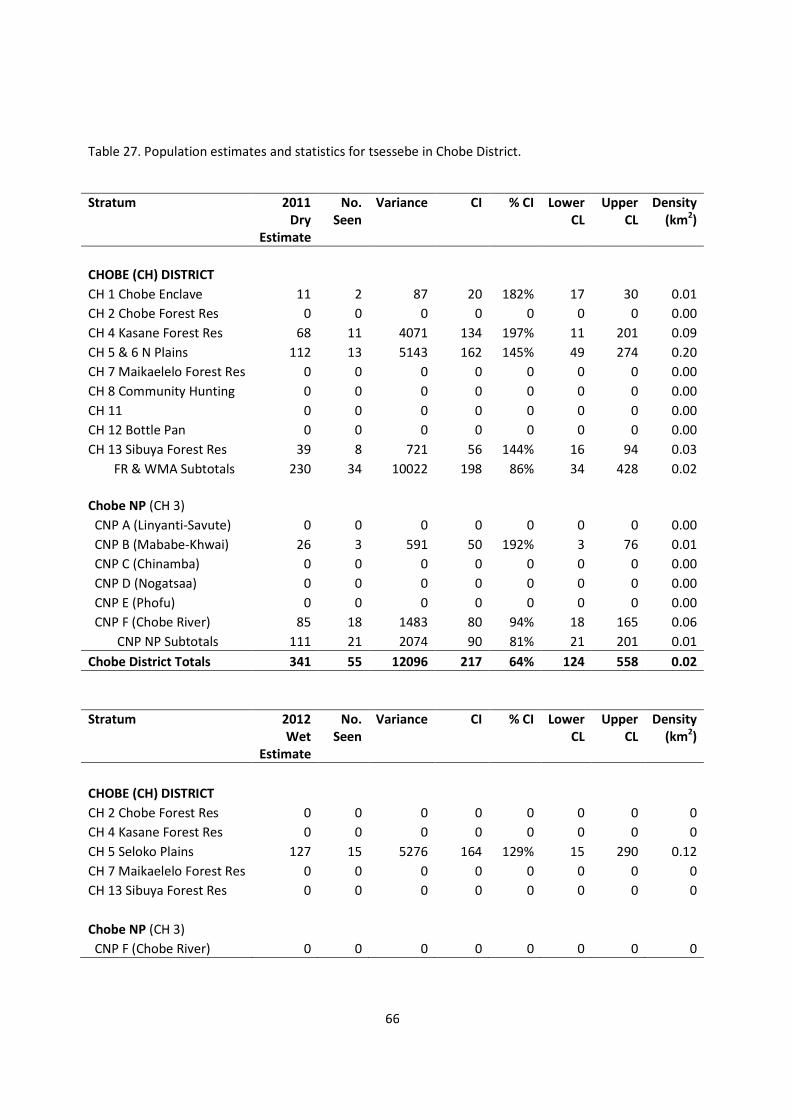
66
Table 27. Population estimates and statistics for tsessebe in Chobe District.
Stratum 2011
Dry
Estimate
No.
Seen
Variance CI % CI Lower
CL
Upper
CL
Density
(km2)
CHOBE (CH) DISTRICT
CH 1 Chobe Enclave 11 2 87 20 182% 17 30 0.01
CH 2 Chobe Forest Res 0 0 0 0 0 0 0 0.00
CH 4 Kasane Forest Res 68 11 4071 134 197% 11 201 0.09
CH 5 & 6 N Plains 112 13 5143 162 145% 49 274 0.20
CH 7 Maikaelelo Forest Res 0 0 0 0 0 0 0 0.00
CH 8 Community Hunting 0 0 0 0 0 0 0 0.00
CH 11 0 0 0 0 0 0 0 0.00
CH 12 Bottle Pan 0 0 0 0 0 0 0 0.00
CH 13 Sibuya Forest Res 39 8 721 56 144% 16 94 0.03
FR & WMA Subtotals 230 34 10022 198 86% 34 428 0.02
Chobe NP (CH 3)
CNP A (Linyanti-Savute) 0 0 0 0 0 0 0 0.00
CNP B (Mababe-Khwai) 26 3 591 50 192% 3 76 0.01
CNP C (Chinamba) 0 0 0 0 0 0 0 0.00
CNP D (Nogatsaa) 0 0 0 0 0 0 0 0.00
CNP E (Phofu) 0 0 0 0 0 0 0 0.00
CNP F (Chobe River) 85 18 1483 80 94% 18 165 0.06
CNP NP Subtotals 111 21 2074 90 81% 21 201 0.01
Chobe District Totals 341 55 12096 217 64% 124 558 0.02
Stratum 2012
Wet
Estimate
No.
Seen
Variance CI % CI Lower
CL
Upper
CL
Density
(km2)
CHOBE (CH) DISTRICT
CH 2 Chobe Forest Res 0 0 0 0 0 0 0 0
CH 4 Kasane Forest Res 0 0 0 0 0 0 0 0
CH 5 Seloko Plains 127 15 5276 164 129% 15 290 0.12
CH 7 Maikaelelo Forest Res 0 0 0 0 0 0 0 0
CH 13 Sibuya Forest Res 0 0 0 0 0 0 0 0
Chobe NP (CH 3)
CNP F (Chobe River) 0 0 0 0 0 0 0 0
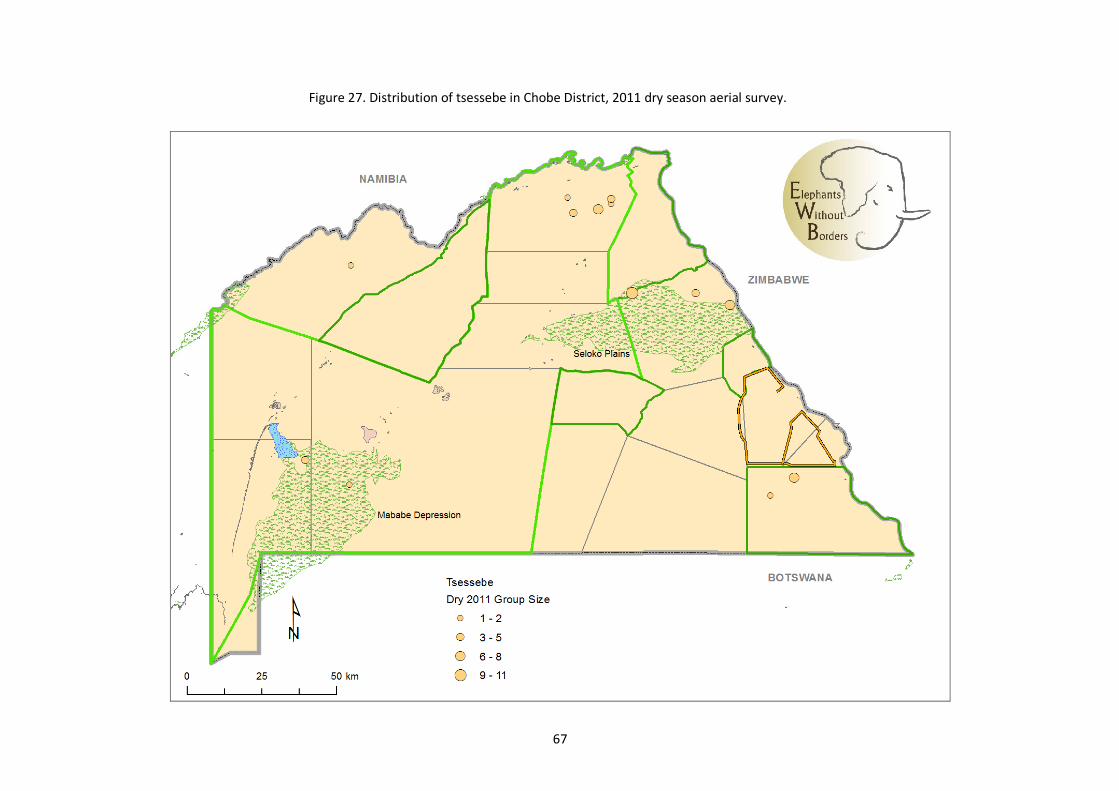
67
Figure 27. Distribution of tsessebe in Chobe District, 2011 dry season aerial survey.
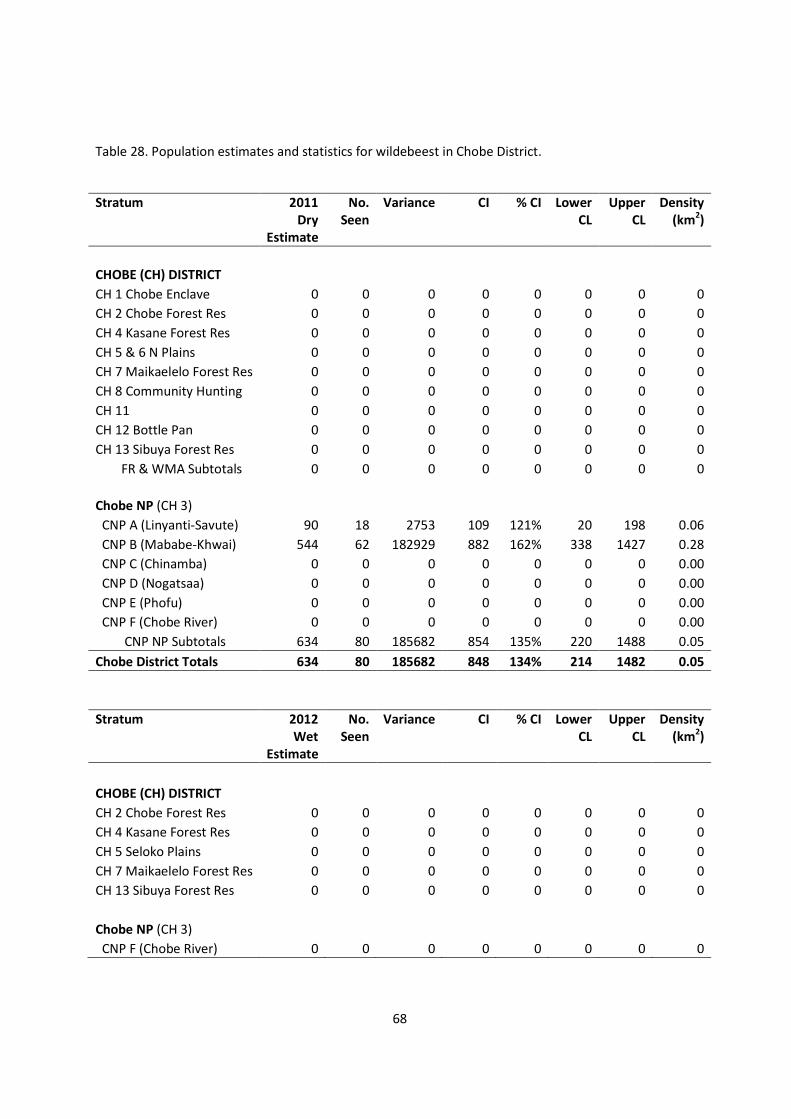
68
Table 28. Population estimates and statistics for wildebeest in Chobe District.
Stratum 2011
Dry
Estimate
No.
Seen
Variance CI % CI Lower
CL
Upper
CL
Density
(km2)
CHOBE (CH) DISTRICT
CH 1 Chobe Enclave 0 0 0 0 0 0 0 0
CH 2 Chobe Forest Res 0 0 0 0 0 0 0 0
CH 4 Kasane Forest Res 0 0 0 0 0 0 0 0
CH 5 & 6 N Plains 0 0 0 0 0 0 0 0
CH 7 Maikaelelo Forest Res 0 0 0 0 0 0 0 0
CH 8 Community Hunting 0 0 0 0 0 0 0 0
CH 11 0 0 0 0 0 0 0 0
CH 12 Bottle Pan 0 0 0 0 0 0 0 0
CH 13 Sibuya Forest Res 0 0 0 0 0 0 0 0
FR & WMA Subtotals 0 0 0 0 0 0 0 0
Chobe NP (CH 3)
CNP A (Linyanti-Savute) 90 18 2753 109 121% 20 198 0.06
CNP B (Mababe-Khwai) 544 62 182929 882 162% 338 1427 0.28
CNP C (Chinamba) 0 0 0 0 0 0 0 0.00
CNP D (Nogatsaa) 0 0 0 0 0 0 0 0.00
CNP E (Phofu) 0 0 0 0 0 0 0 0.00
CNP F (Chobe River) 0 0 0 0 0 0 0 0.00
CNP NP Subtotals 634 80 185682 854 135% 220 1488 0.05
Chobe District Totals 634 80 185682 848 134% 214 1482 0.05
Stratum 2012
Wet
Estimate
No.
Seen
Variance CI % CI Lower
CL
Upper
CL
Density
(km2)
CHOBE (CH) DISTRICT
CH 2 Chobe Forest Res 0 0 0 0 0 0 0 0
CH 4 Kasane Forest Res 0 0 0 0 0 0 0 0
CH 5 Seloko Plains 0 0 0 0 0 0 0 0
CH 7 Maikaelelo Forest Res 0 0 0 0 0 0 0 0
CH 13 Sibuya Forest Res 0 0 0 0 0 0 0 0
Chobe NP (CH 3)
CNP F (Chobe River) 0 0 0 0 0 0 0 0
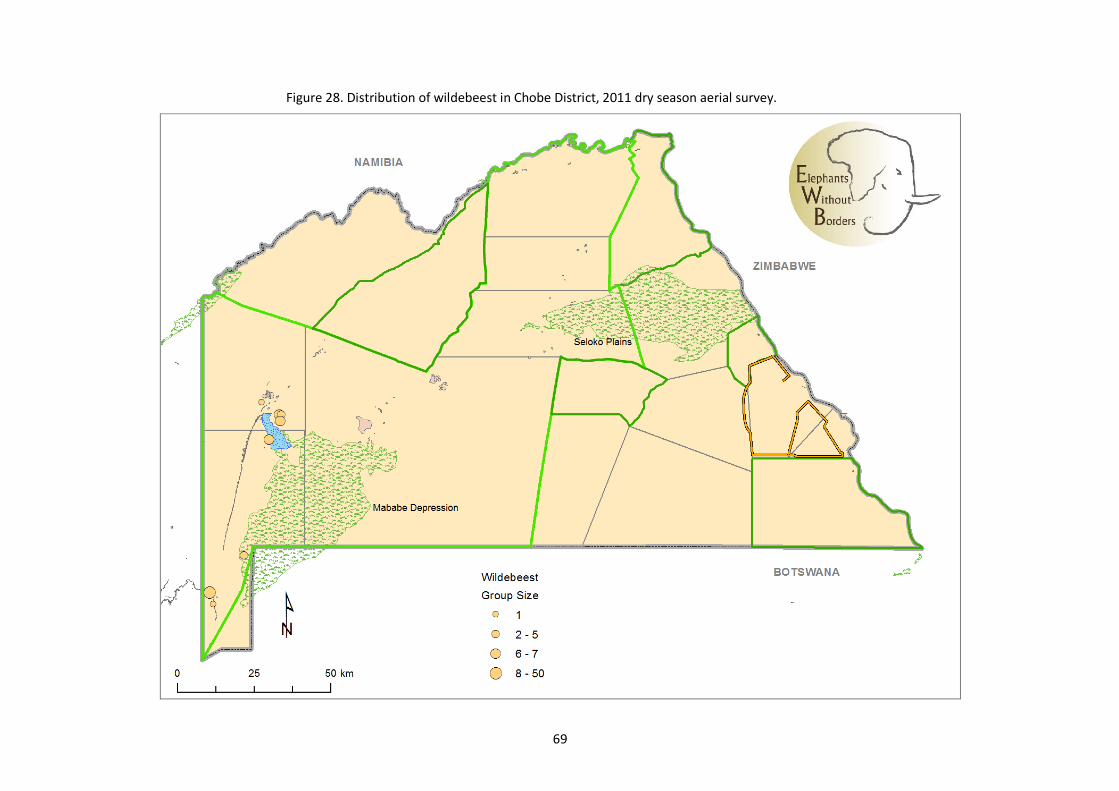
69
Figure 28. Distribution of wildebeest in Chobe District, 2011 dry season aerial survey.
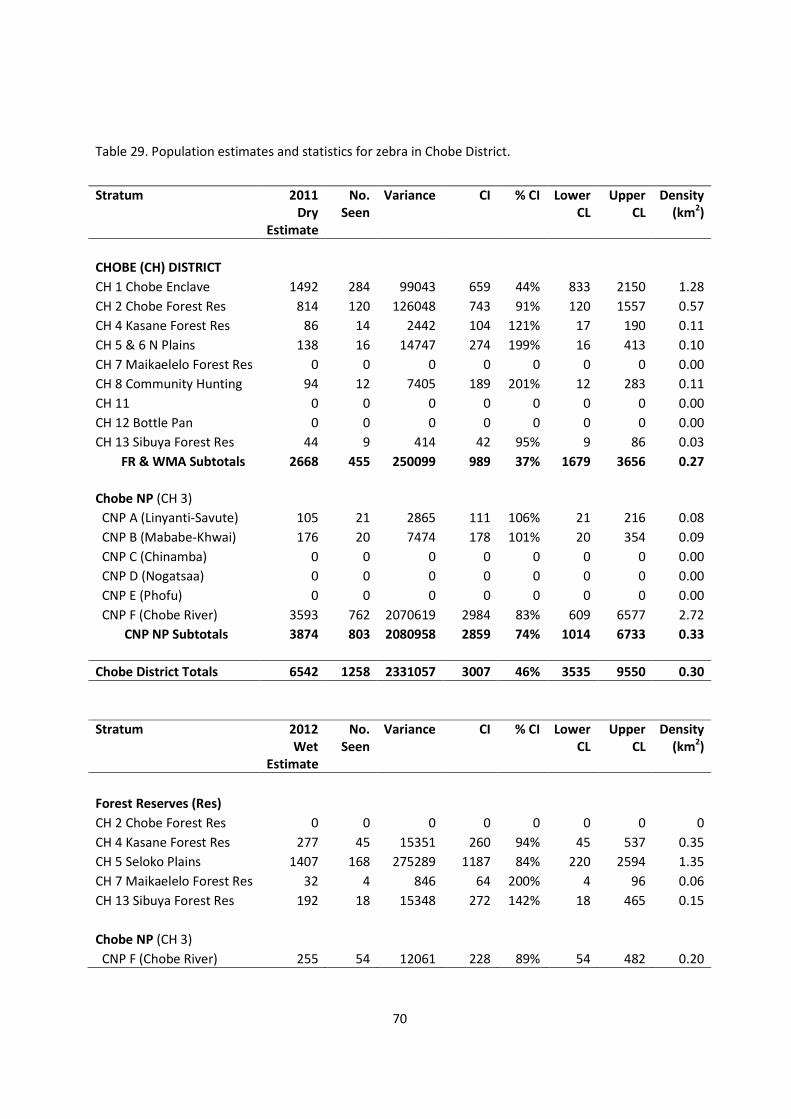
70
Table 29. Population estimates and statistics for zebra in Chobe District.
Stratum 2011
Dry
Estimate
No.
Seen
Variance CI % CI Lower
CL
Upper
CL
Density
(km2)
CHOBE (CH) DISTRICT
CH 1 Chobe Enclave 1492 284 99043 659 44% 833 2150 1.28
CH 2 Chobe Forest Res 814 120 126048 743 91% 120 1557 0.57
CH 4 Kasane Forest Res 86 14 2442 104 121% 17 190 0.11
CH 5 & 6 N Plains 138 16 14747 274 199% 16 413 0.10
CH 7 Maikaelelo Forest Res 0 0 0 0 0 0 0 0.00
CH 8 Community Hunting 94 12 7405 189 201% 12 283 0.11
CH 11 0 0 0 0 0 0 0 0.00
CH 12 Bottle Pan 0 0 0 0 0 0 0 0.00
CH 13 Sibuya Forest Res 44 9 414 42 95% 9 86 0.03
FR & WMA Subtotals 2668 455 250099 989 37% 1679 3656 0.27
Chobe NP (CH 3)
CNP A (Linyanti-Savute) 105 21 2865 111 106% 21 216 0.08
CNP B (Mababe-Khwai) 176 20 7474 178 101% 20 354 0.09
CNP C (Chinamba) 0 0 0 0 0 0 0 0.00
CNP D (Nogatsaa) 0 0 0 0 0 0 0 0.00
CNP E (Phofu) 0 0 0 0 0 0 0 0.00
CNP F (Chobe River) 3593 762 2070619 2984 83% 609 6577 2.72
CNP NP Subtotals 3874 803 2080958 2859 74% 1014 6733 0.33
Chobe District Totals 6542 1258 2331057 3007 46% 3535 9550 0.30
Stratum 2012
Wet
Estimate
No.
Seen
Variance CI % CI Lower
CL
Upper
CL
Density
(km2)
Forest Reserves (Res)
CH 2 Chobe Forest Res 0 0 0 0 0 0 0 0
CH 4 Kasane Forest Res 277 45 15351 260 94% 45 537 0.35
CH 5 Seloko Plains 1407 168 275289 1187 84% 220 2594 1.35
CH 7 Maikaelelo Forest Res 32 4 846 64 200% 4 96 0.06
CH 13 Sibuya Forest Res 192 18 15348 272 142% 18 465 0.15
Chobe NP (CH 3)
CNP F (Chobe River) 255 54 12061 228 89% 54 482 0.20
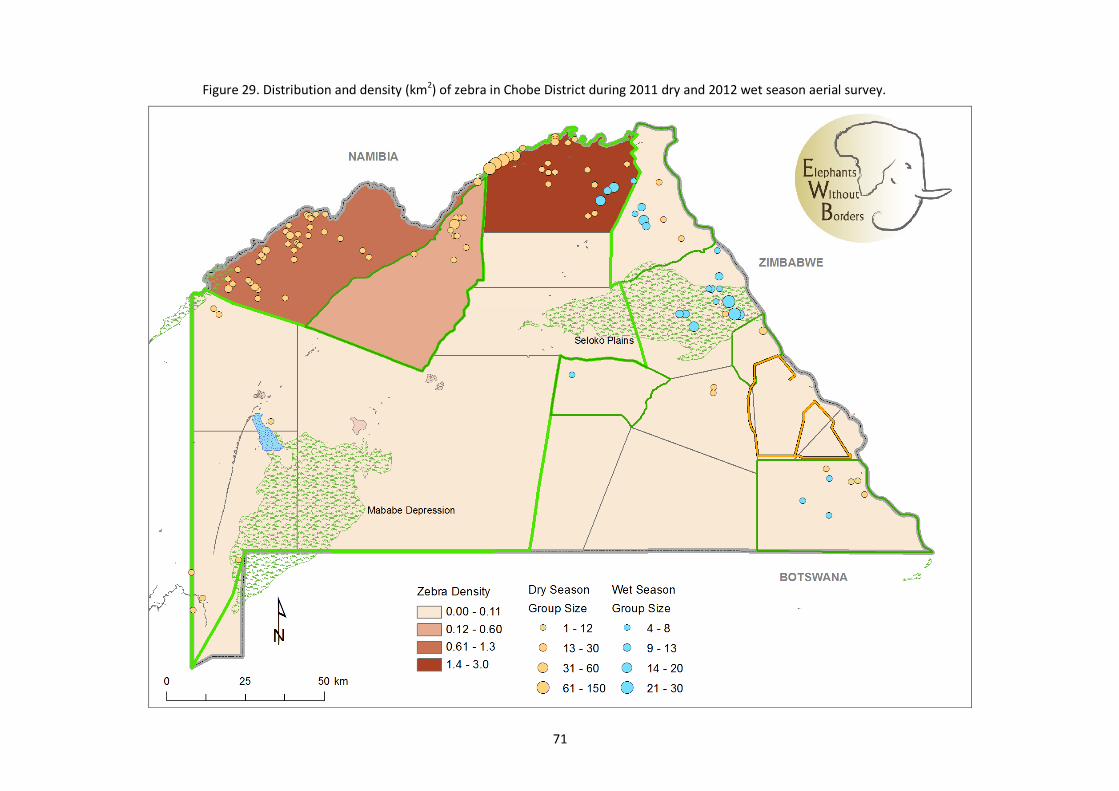
71
Figure 29. Distribution and density (km2) of zebra in Chobe District during 2011 dry and 2012 wet season aerial survey.
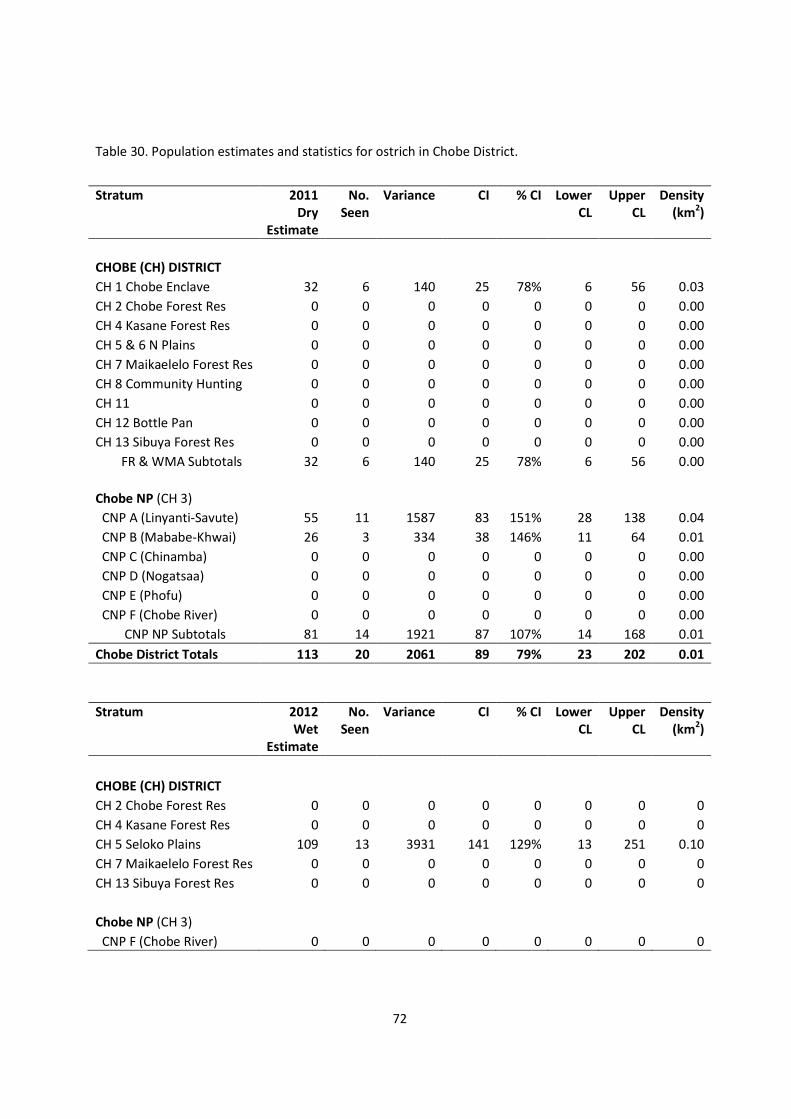
72
Table 30. Population estimates and statistics for ostrich in Chobe District.
Stratum 2011
Dry
Estimate
No.
Seen
Variance CI % CI Lower
CL
Upper
CL
Density
(km2)
CHOBE (CH) DISTRICT
CH 1 Chobe Enclave 32 6 140 25 78% 6 56 0.03
CH 2 Chobe Forest Res 0 0 0 0 0 0 0 0.00
CH 4 Kasane Forest Res 0 0 0 0 0 0 0 0.00
CH 5 & 6 N Plains 0 0 0 0 0 0 0 0.00
CH 7 Maikaelelo Forest Res 0 0 0 0 0 0 0 0.00
CH 8 Community Hunting 0 0 0 0 0 0 0 0.00
CH 11 0 0 0 0 0 0 0 0.00
CH 12 Bottle Pan 0 0 0 0 0 0 0 0.00
CH 13 Sibuya Forest Res 0 0 0 0 0 0 0 0.00
FR & WMA Subtotals 32 6 140 25 78% 6 56 0.00
Chobe NP (CH 3)
CNP A (Linyanti-Savute) 55 11 1587 83 151% 28 138 0.04
CNP B (Mababe-Khwai) 26 3 334 38 146% 11 64 0.01
CNP C (Chinamba) 0 0 0 0 0 0 0 0.00
CNP D (Nogatsaa) 0 0 0 0 0 0 0 0.00
CNP E (Phofu) 0 0 0 0 0 0 0 0.00
CNP F (Chobe River) 0 0 0 0 0 0 0 0.00
CNP NP Subtotals 81 14 1921 87 107% 14 168 0.01
Chobe District Totals 113 20 2061 89 79% 23 202 0.01
Stratum 2012
Wet
Estimate
No.
Seen
Variance CI % CI Lower
CL
Upper
CL
Density
(km2)
CHOBE (CH) DISTRICT
CH 2 Chobe Forest Res 0 0 0 0 0 0 0 0
CH 4 Kasane Forest Res 0 0 0 0 0 0 0 0
CH 5 Seloko Plains 109 13 3931 141 129% 13 251 0.10
CH 7 Maikaelelo Forest Res 0 0 0 0 0 0 0 0
CH 13 Sibuya Forest Res 0 0 0 0 0 0 0 0
Chobe NP (CH 3)
CNP F (Chobe River) 0 0 0 0 0 0 0 0
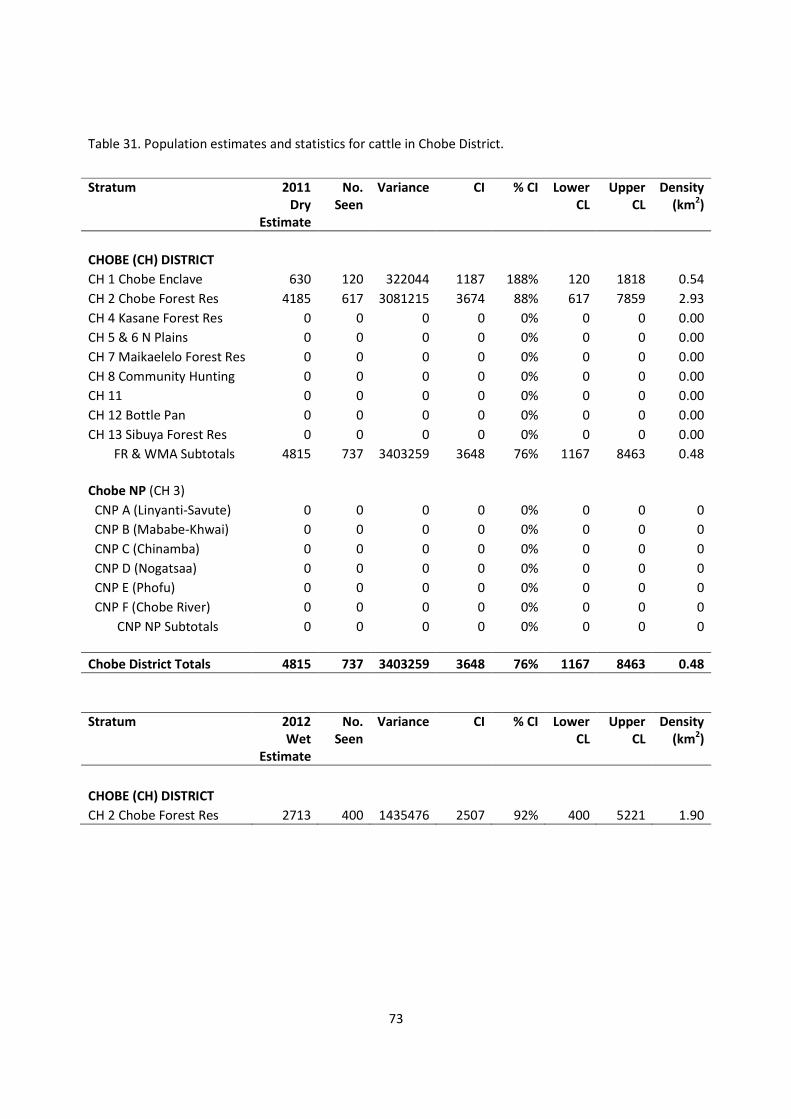
73
Table 31. Population estimates and statistics for cattle in Chobe District.
Stratum 2011
Dry
Estimate
No.
Seen
Variance CI % CI Lower
CL
Upper
CL
Density
(km2)
CHOBE (CH) DISTRICT
CH 1 Chobe Enclave 630 120 322044 1187 188% 120 1818 0.54
CH 2 Chobe Forest Res 4185 617 3081215 3674 88% 617 7859 2.93
CH 4 Kasane Forest Res 0 0 0 0 0% 0 0 0.00
CH 5 & 6 N Plains 0 0 0 0 0% 0 0 0.00
CH 7 Maikaelelo Forest Res 0 0 0 0 0% 0 0 0.00
CH 8 Community Hunting 0 0 0 0 0% 0 0 0.00
CH 11 0 0 0 0 0% 0 0 0.00
CH 12 Bottle Pan 0 0 0 0 0% 0 0 0.00
CH 13 Sibuya Forest Res 0 0 0 0 0% 0 0 0.00
FR & WMA Subtotals 4815 737 3403259 3648 76% 1167 8463 0.48
Chobe NP (CH 3)
CNP A (Linyanti-Savute) 0 0 0 0 0% 0 0 0
CNP B (Mababe-Khwai) 0 0 0 0 0% 0 0 0
CNP C (Chinamba) 0 0 0 0 0% 0 0 0
CNP D (Nogatsaa) 0 0 0 0 0% 0 0 0
CNP E (Phofu) 0 0 0 0 0% 0 0 0
CNP F (Chobe River) 0 0 0 0 0% 0 0 0
CNP NP Subtotals 0 0 0 0 0% 0 0 0
Chobe District Totals 4815 737 3403259 3648 76% 1167 8463 0.48
Stratum 2012
Wet
Estimate
No.
Seen
Variance CI % CI Lower
CL
Upper
CL
Density
(km2)
CHOBE (CH) DISTRICT
CH 2 Chobe Forest Res 2713 400 1435476 2507 92% 400 5221 1.90
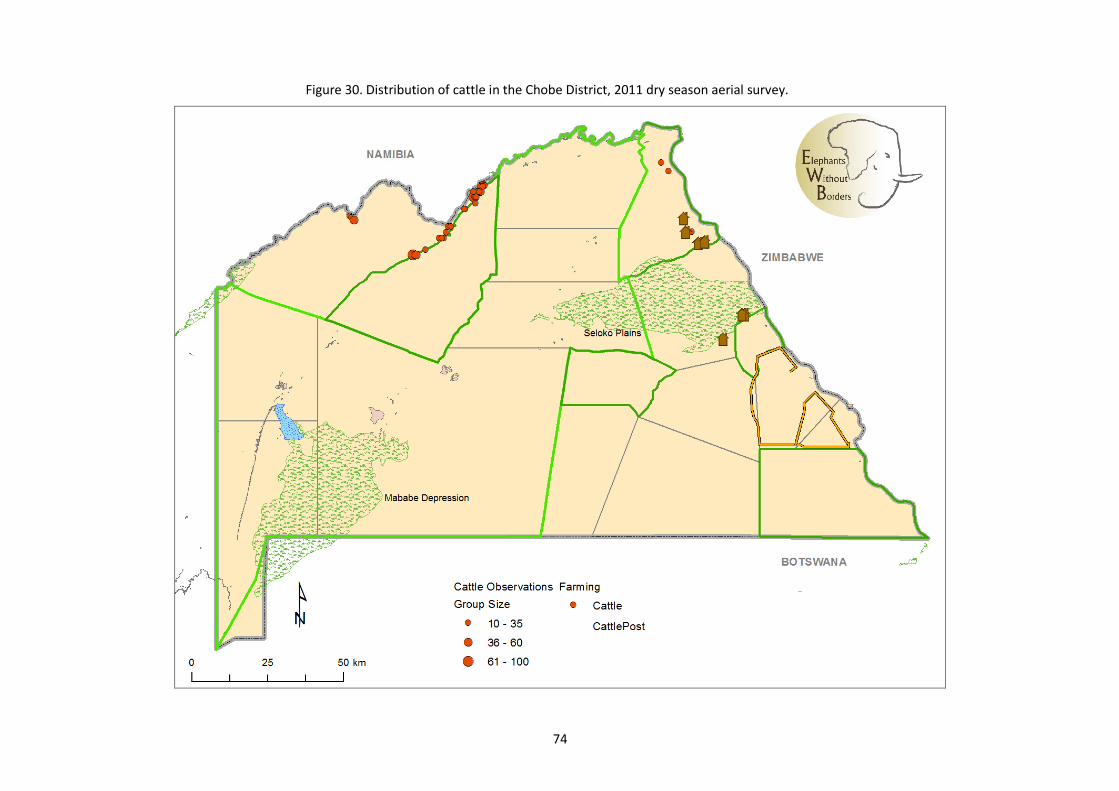
74
Figure 30. Distribution of cattle in the Chobe District, 2011 dry season aerial survey.
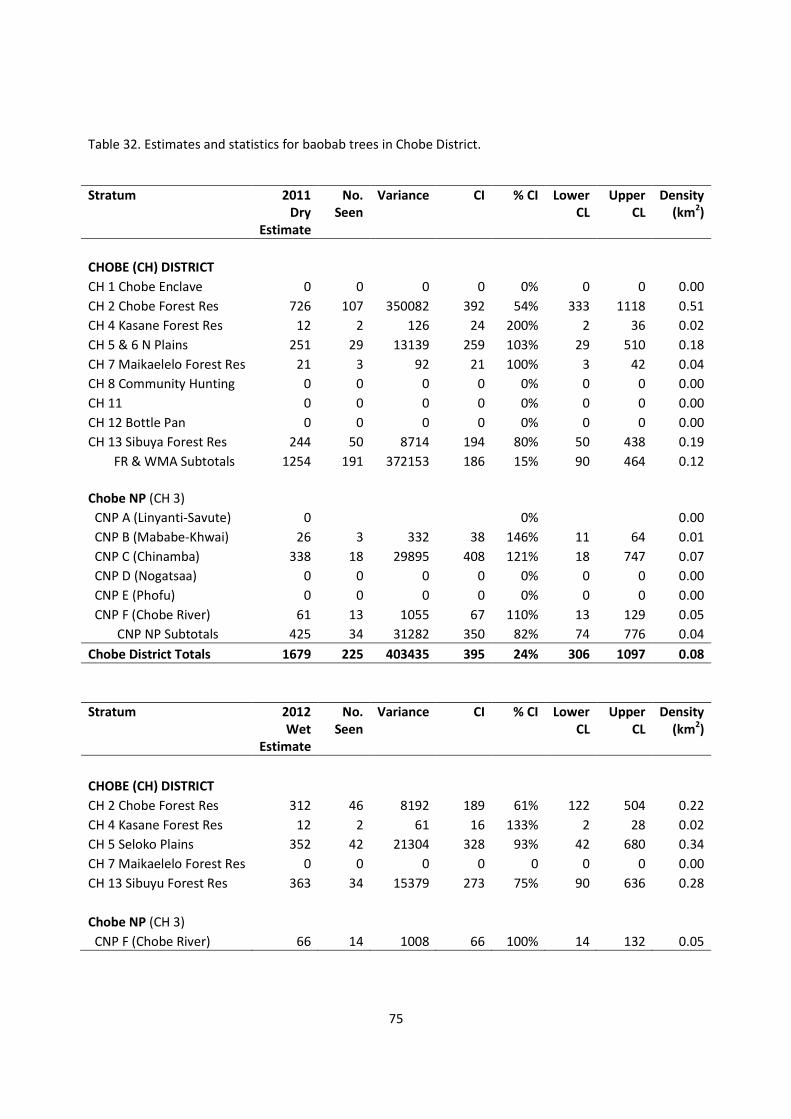
75
Table 32. Estimates and statistics for baobab trees in Chobe District.
Stratum 2011
Dry
Estimate
No.
Seen
Variance CI % CI Lower
CL
Upper
CL
Density
(km2)
CHOBE (CH) DISTRICT
CH 1 Chobe Enclave 0 0 0 0 0% 0 0 0.00
CH 2 Chobe Forest Res 726 107 350082 392 54% 333 1118 0.51
CH 4 Kasane Forest Res 12 2 126 24 200% 2 36 0.02
CH 5 & 6 N Plains 251 29 13139 259 103% 29 510 0.18
CH 7 Maikaelelo Forest Res 21 3 92 21 100% 3 42 0.04
CH 8 Community Hunting 0 0 0 0 0% 0 0 0.00
CH 11 0 0 0 0 0% 0 0 0.00
CH 12 Bottle Pan 0 0 0 0 0% 0 0 0.00
CH 13 Sibuya Forest Res 244 50 8714 194 80% 50 438 0.19
FR & WMA Subtotals 1254 191 372153 186 15% 90 464 0.12
Chobe NP (CH 3)
CNP A (Linyanti-Savute) 0 0% 0.00
CNP B (Mababe-Khwai) 26 3 332 38 146% 11 64 0.01
CNP C (Chinamba) 338 18 29895 408 121% 18 747 0.07
CNP D (Nogatsaa) 0 0 0 0 0% 0 0 0.00
CNP E (Phofu) 0 0 0 0 0% 0 0 0.00
CNP F (Chobe River) 61 13 1055 67 110% 13 129 0.05
CNP NP Subtotals 425 34 31282 350 82% 74 776 0.04
Chobe District Totals 1679 225 403435 395 24% 306 1097 0.08
Stratum 2012
Wet
Estimate
No.
Seen
Variance CI % CI Lower
CL
Upper
CL
Density
(km2)
CHOBE (CH) DISTRICT
CH 2 Chobe Forest Res 312 46 8192 189 61% 122 504 0.22
CH 4 Kasane Forest Res 12 2 61 16 133% 2 28 0.02
CH 5 Seloko Plains 352 42 21304 328 93% 42 680 0.34
CH 7 Maikaelelo Forest Res 0 0 0 0 0 0 0 0.00
CH 13 Sibuyu Forest Res 363 34 15379 273 75% 90 636 0.28
Chobe NP (CH 3)
CNP F (Chobe River) 66 14 1008 66 100% 14 132 0.05
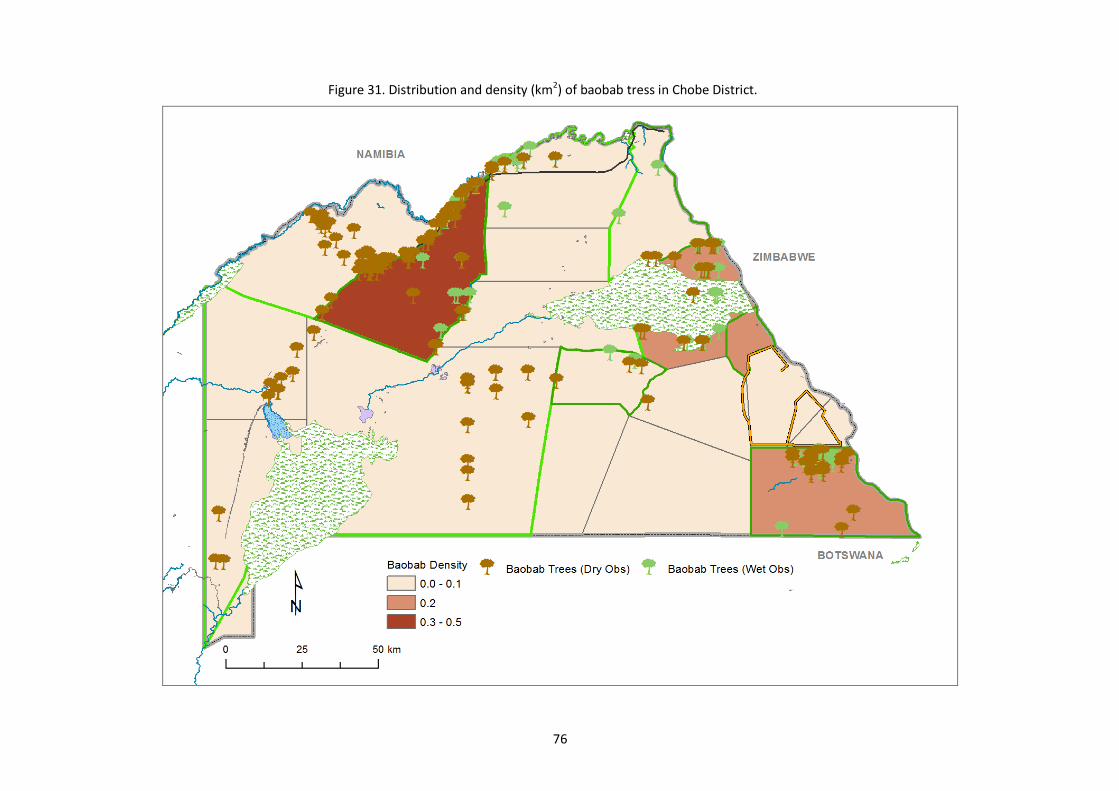
76
Figure 31. Distribution and density (km2) of baobab tress in Chobe District.
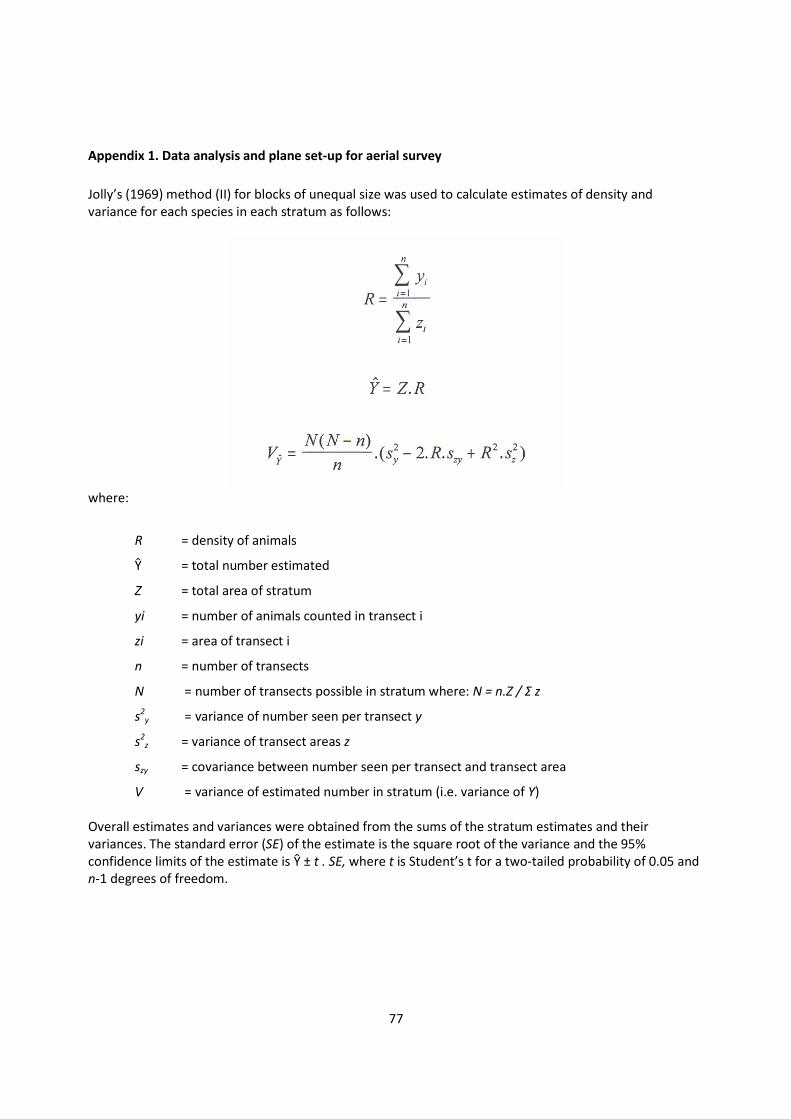
77
Appendix 1. Data analysis and plane set-up for aerial survey
Jolly’s (1969) method (II) for blocks of unequal size was used to calculate estimates of density and variance for each species in each stratum as follows:
where:
R = density of animals
Ŷ = total number estimated
Z = total area of stratum
yi = number of animals counted in transect i
zi = area of transect i
n = number of transects
N = number of transects possible in stratum where: N = n.Z / Ʃ z
s2
y = variance of number seen per transect y
s2
z = variance of transect areas z
szy = covariance between number seen per transect and transect area
V = variance of estimated number in stratum (i.e. variance of Y) Overall estimates and variances were obtained from the sums of the stratum estimates and their variances. The standard error (SE) of the estimate is the square root of the variance and the 95% confidence limits of the estimate is Ŷ ± t . SE, where t is Student’s t for a two-tailed probability of 0.05 and n-1 degrees of freedom.
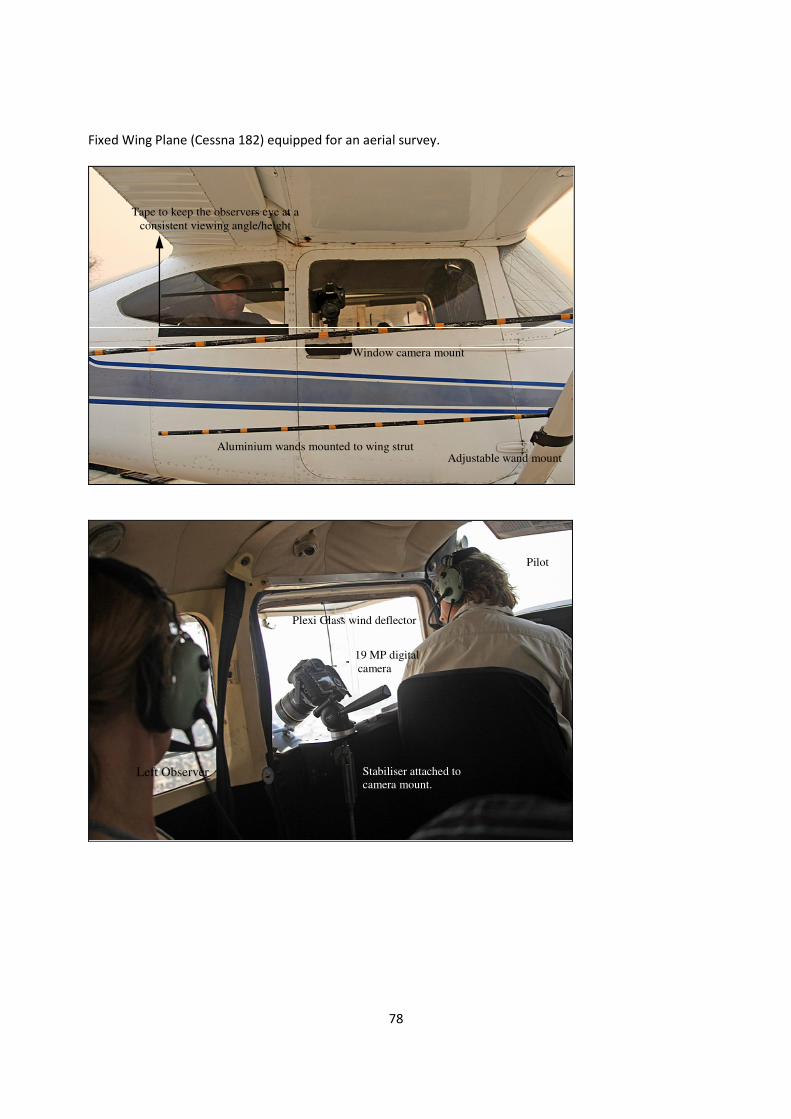
78
Fixed Wing Plane (Cessna 182) equipped for an aerial survey.
Aluminium wands mounted to wing strut
Tape to keep the observers eye at a
consistent viewing angle/height
Window camera mount
Adjustable wand mount
19 MP digital
camera
Pilot
Left Observer Stabiliser attached to
camera mount.
Plexi Glass wind deflector
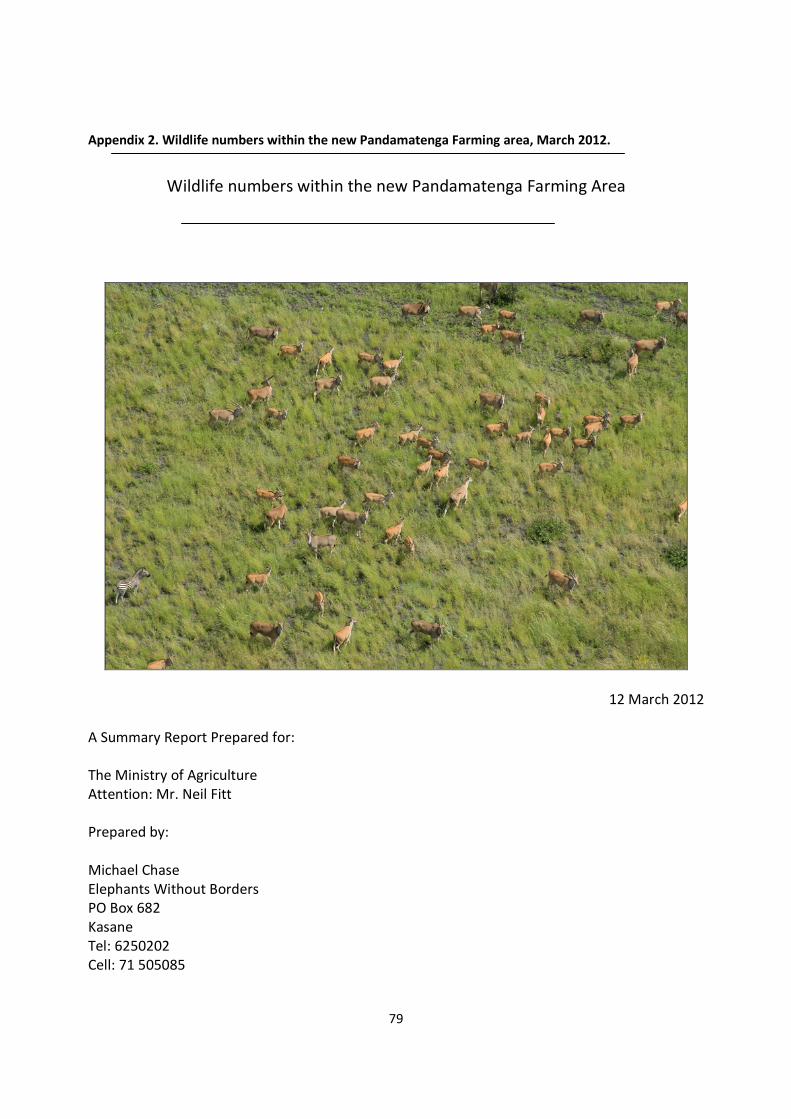
79
Appendix 2. Wildlife numbers within the new Pandamatenga Farming area, March 2012.
Wildlife numbers within the new Pandamatenga Farming Area
12 March 2012 A Summary Report Prepared for: The Ministry of Agriculture Attention: Mr. Neil Fitt Prepared by: Michael Chase Elephants Without Borders PO Box 682 Kasane Tel: 6250202 Cell: 71 505085
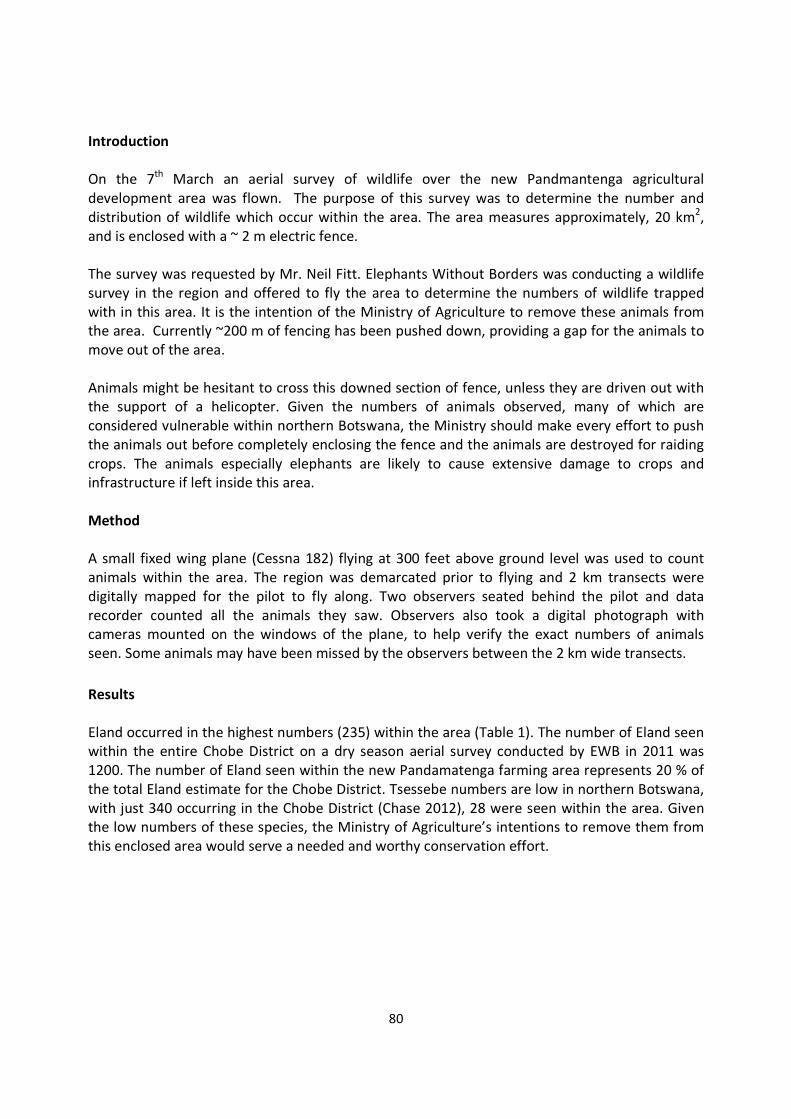
80
Introduction
On the 7th March an aerial survey of wildlife over the new Pandmantenga agricultural development area was flown. The purpose of this survey was to determine the number and distribution of wildlife which occur within the area. The area measures approximately, 20 km2, and is enclosed with a ~ 2 m electric fence. The survey was requested by Mr. Neil Fitt. Elephants Without Borders was conducting a wildlife survey in the region and offered to fly the area to determine the numbers of wildlife trapped with in this area. It is the intention of the Ministry of Agriculture to remove these animals from the area. Currently ~200 m of fencing has been pushed down, providing a gap for the animals to move out of the area. Animals might be hesitant to cross this downed section of fence, unless they are driven out with the support of a helicopter. Given the numbers of animals observed, many of which are considered vulnerable within northern Botswana, the Ministry should make every effort to push the animals out before completely enclosing the fence and the animals are destroyed for raiding crops. The animals especially elephants are likely to cause extensive damage to crops and infrastructure if left inside this area. Method
A small fixed wing plane (Cessna 182) flying at 300 feet above ground level was used to count animals within the area. The region was demarcated prior to flying and 2 km transects were digitally mapped for the pilot to fly along. Two observers seated behind the pilot and data recorder counted all the animals they saw. Observers also took a digital photograph with cameras mounted on the windows of the plane, to help verify the exact numbers of animals seen. Some animals may have been missed by the observers between the 2 km wide transects.
Results
Eland occurred in the highest numbers (235) within the area (Table 1). The number of Eland seen within the entire Chobe District on a dry season aerial survey conducted by EWB in 2011 was 1200. The number of Eland seen within the new Pandamatenga farming area represents 20 % of the total Eland estimate for the Chobe District. Tsessebe numbers are low in northern Botswana, with just 340 occurring in the Chobe District (Chase 2012), 28 were seen within the area. Given the low numbers of these species, the Ministry of Agriculture’s intentions to remove them from this enclosed area would serve a needed and worthy conservation effort.
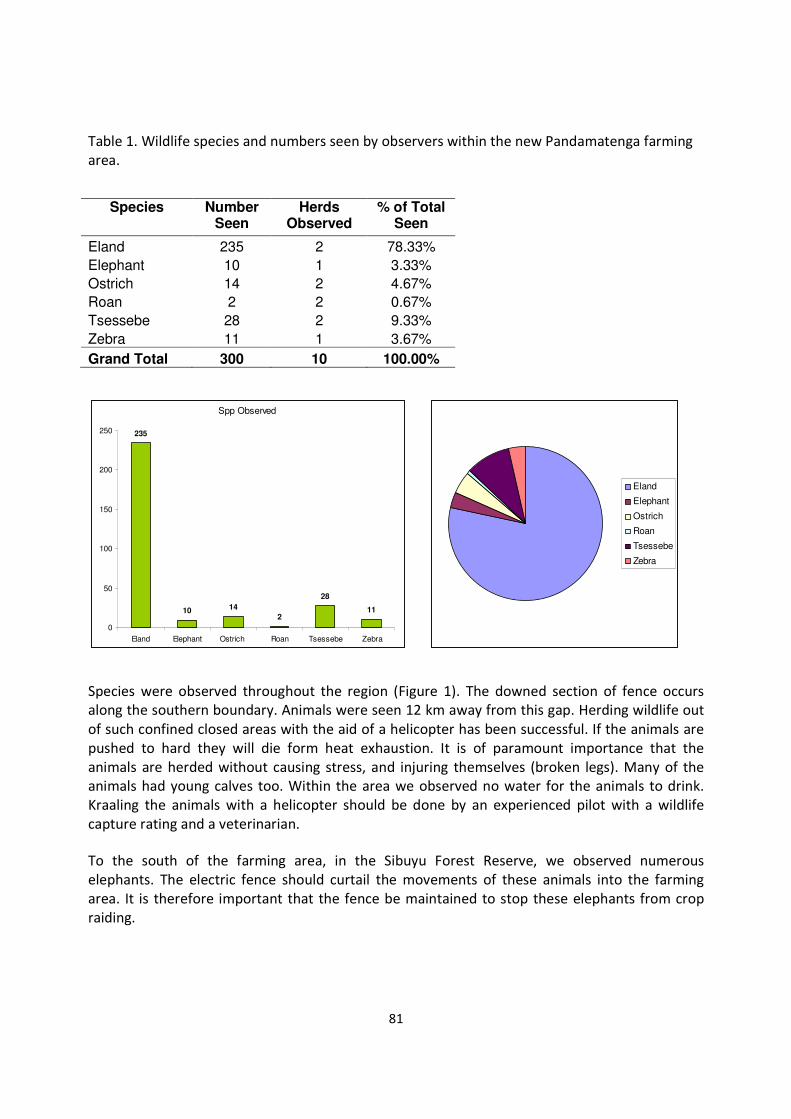
81
Table 1. Wildlife species and numbers seen by observers within the new Pandamatenga farming area.
Species were observed throughout the region (Figure 1). The downed section of fence occurs along the southern boundary. Animals were seen 12 km away from this gap. Herding wildlife out of such confined closed areas with the aid of a helicopter has been successful. If the animals are pushed to hard they will die form heat exhaustion. It is of paramount importance that the animals are herded without causing stress, and injuring themselves (broken legs). Many of the animals had young calves too. Within the area we observed no water for the animals to drink. Kraaling the animals with a helicopter should be done by an experienced pilot with a wildlife capture rating and a veterinarian.
To the south of the farming area, in the Sibuyu Forest Reserve, we observed numerous elephants. The electric fence should curtail the movements of these animals into the farming area. It is therefore important that the fence be maintained to stop these elephants from crop raiding.
Species Number Seen
Herds Observed
% of Total Seen
Eland 235 2 78.33%
Elephant 10 1 3.33%
Ostrich 14 2 4.67%
Roan 2 2 0.67%
Tsessebe 28 2 9.33%
Zebra 11 1 3.67%
Grand Total 300 10 100.00%
Spp Observed
235
10 14
2
28
11
0
50
100
150
200
250
Eland Elephant Ostrich Roan Tsessebe Zebra
Eland
Elephant
Ostrich
Roan
Tsessebe
Zebra
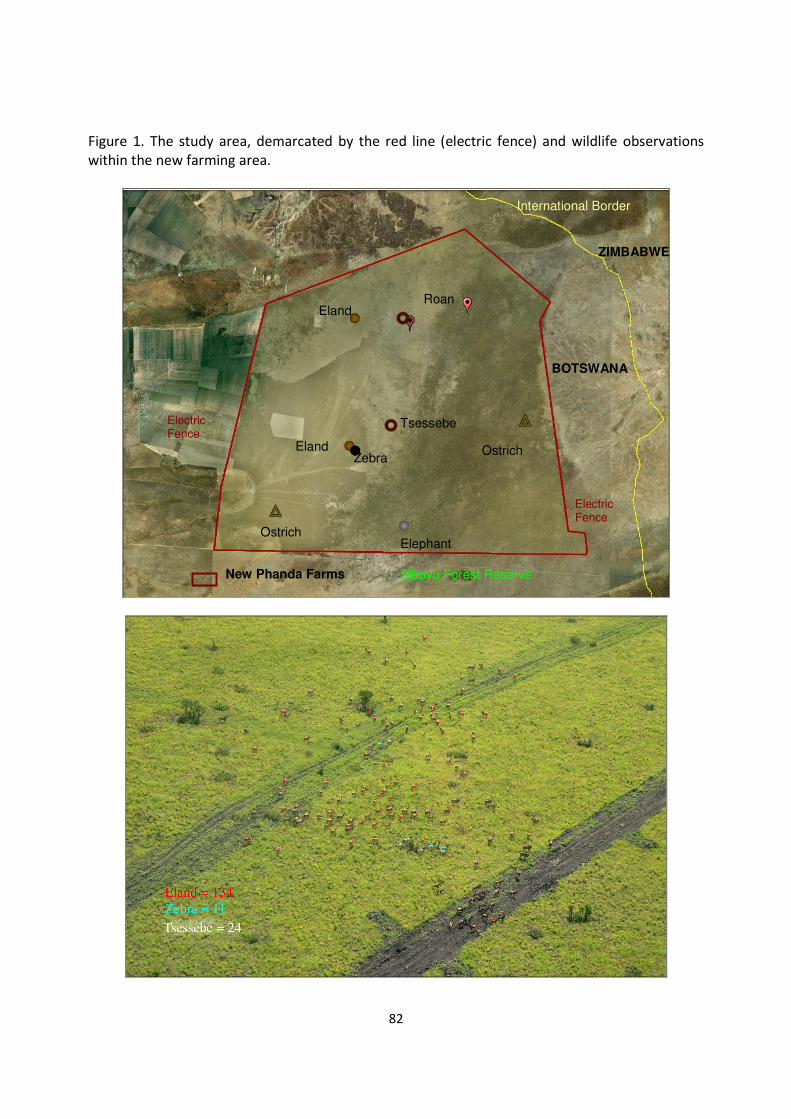
82
Figure 1. The study area, demarcated by the red line (electric fence) and wildlife observations within the new farming area.
New Phanda Farms Sibuyu Forest Reserve
ZIMBABWE
BOTSWANA
Elephant Ostrich
Ostrich
Eland Roan
Tsessebe
Eland Zebra
International Border
Electric Fence
Electric Fence