steel exports report: netherlands...3 steel exports report: netherlands exports by top market...
TRANSCRIPT
1
Steel Exports Report: Netherlands December 2017 Background
The Netherlands is the world’s thirteenth-largest steel exporter. In year-to-date 2017 (through September), further referred to as YTD 2017, the Netherlands exported 8.7 million metric tons of steel, an 8 percent increase from 8 million metric tons in YTD 2016. Exports from the Netherlands represented about 2 percent of all steel exported globally in 2016. The volume of the Netherlands’ 2016 steel exports was just about one-tenth that of the largest exporter, China. In value terms, steel represented just 1.5 percent of the total amount of goods the Netherlands exported in 2016.
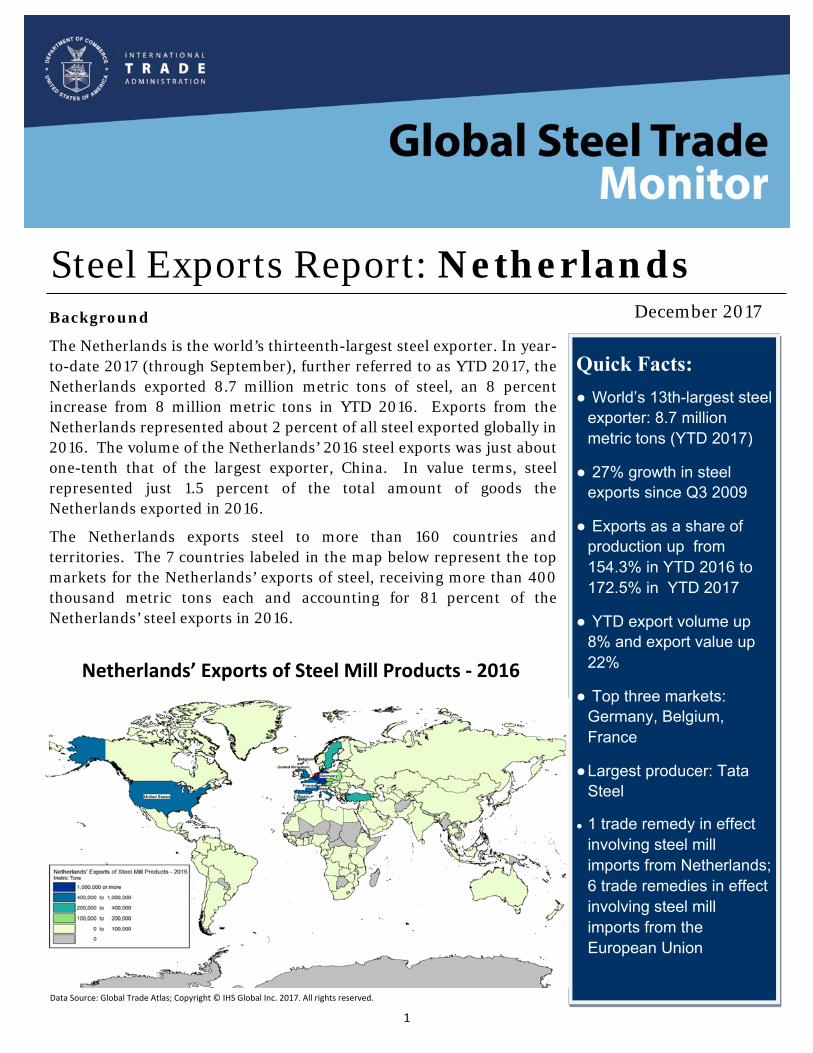
The Netherlands exports steel to more than 160 countries and territories. The 7 countries labeled in the map below represent the top markets for the Netherlands’ exports of steel, receiving more than 400 thousand metric tons each and accounting for 81 percent of the Netherlands’ steel exports in 2016.
Quick Facts:
● World’s 13th-largest steel exporter: 8.7 million metric tons (YTD 2017)
● 27% growth in steel exports since Q3 2009
● Exports as a share of production up from 154.3% in YTD 2016 to 172.5% in YTD 2017
● YTD export volume up 8% and export value up 22%
● Top three markets: Germany, Belgium, France
● Largest producer: Tata Steel
● 1 trade remedy in effect involving steel mill imports from Netherlands; 6 trade remedies in effect involving steel mill imports from the European Union
Netherlands’ Exports of Steel Mill Products ‐ 2016
Data Source: Global Trade Atlas; Copyright © IHS Global Inc. 2017. All rights reserved.
2
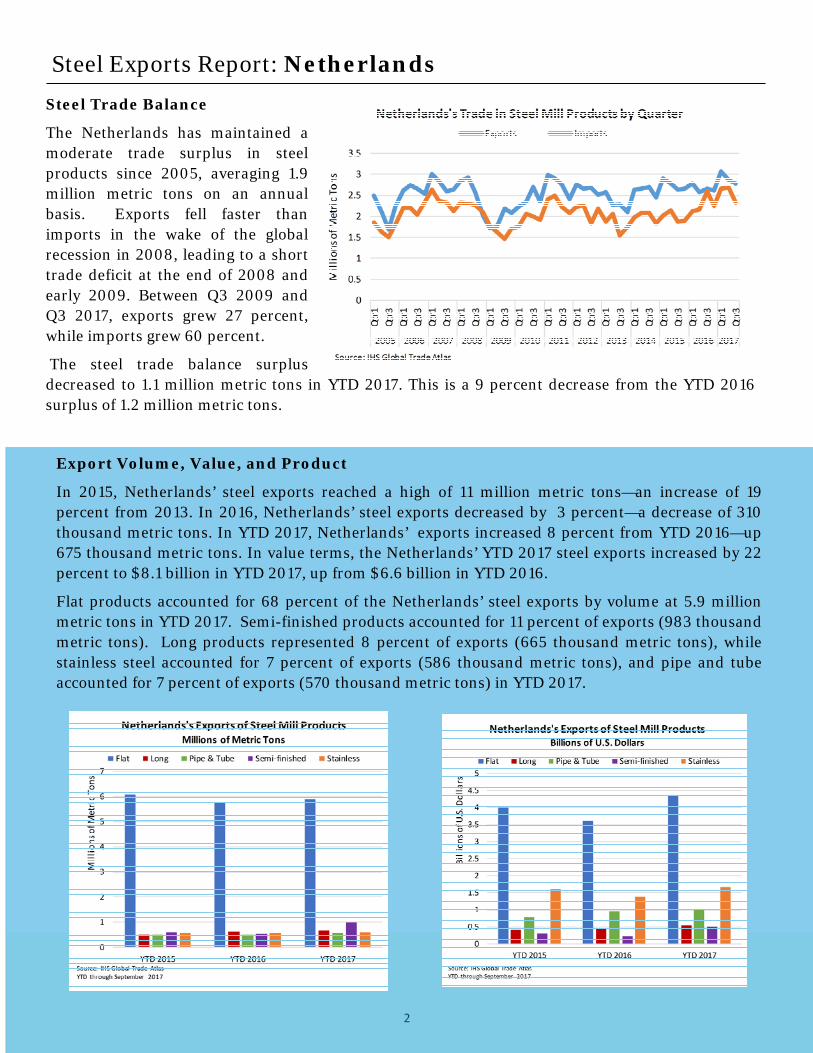
Steel Trade Balance
The Netherlands has maintained a moderate trade surplus in steel products since 2005, averaging 1.9 million metric tons on an annual basis. Exports fell faster than imports in the wake of the global recession in 2008, leading to a short trade deficit at the end of 2008 and early 2009. Between Q3 2009 and Q3 2017, exports grew 27 percent, while imports grew 60 percent.
The steel trade balance surplus decreased to 1.1 million metric tons in YTD 2017. This is a 9 percent decrease from the YTD 2016 surplus of 1.2 million metric tons.
Steel Exports Report: Netherlands
Export Volume, Value, and Product
In 2015, Netherlands’ steel exports reached a high of 11 million metric tons—an increase of 19 percent from 2013. In 2016, Netherlands’ steel exports decreased by 3 percent—a decrease of 310 thousand metric tons. In YTD 2017, Netherlands’ exports increased 8 percent from YTD 2016—up 675 thousand metric tons. In value terms, the Netherlands’ YTD 2017 steel exports increased by 22 percent to $8.1 billion in YTD 2017, up from $6.6 billion in YTD 2016.
Flat products accounted for 68 percent of the Netherlands’ steel exports by volume at 5.9 million metric tons in YTD 2017. Semi-finished products accounted for 11 percent of exports (983 thousand metric tons). Long products represented 8 percent of exports (665 thousand metric tons), while stainless steel accounted for 7 percent of exports (586 thousand metric tons), and pipe and tube accounted for 7 percent of exports (570 thousand metric tons) in YTD 2017.
3
Steel Exports Report: Netherlands
Exports by Top Market
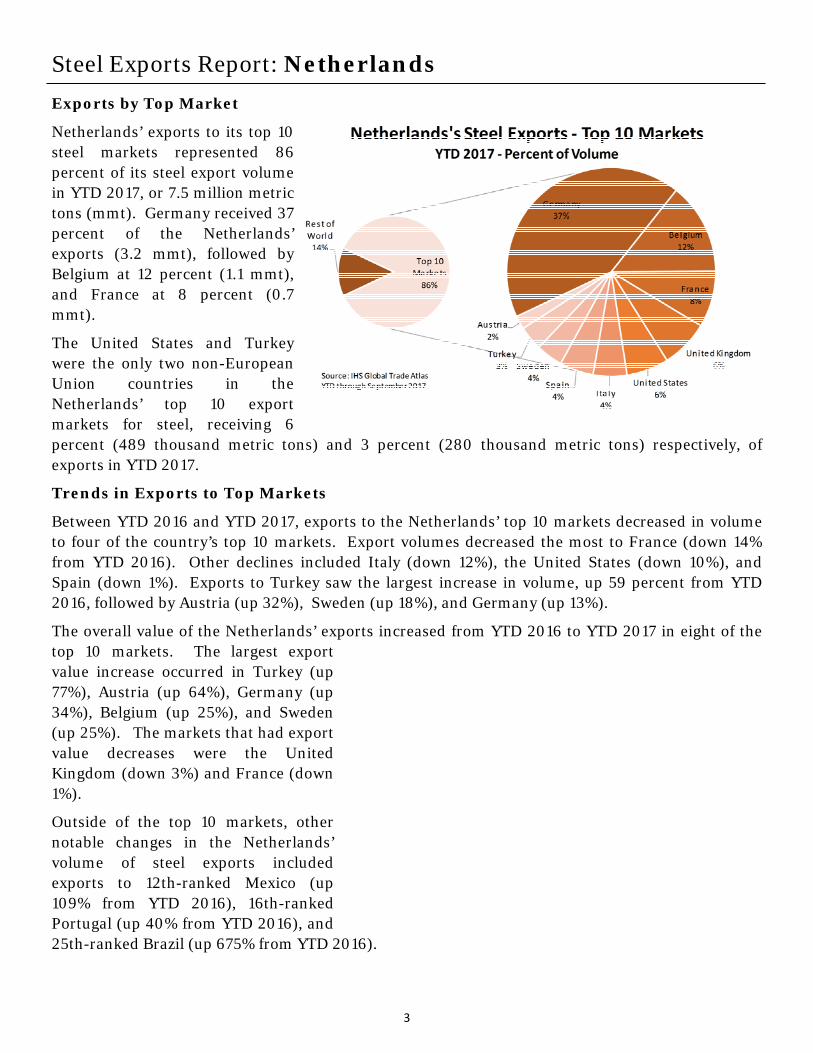
Netherlands’ exports to its top 10 steel markets represented 86 percent of its steel export volume in YTD 2017, or 7.5 million metric tons (mmt). Germany received 37 percent of the Netherlands’ exports (3.2 mmt), followed by Belgium at 12 percent (1.1 mmt), and France at 8 percent (0.7 mmt).
The United States and Turkey were the only two non-European Union countries in the Netherlands’ top 10 export markets for steel, receiving 6 percent (489 thousand metric tons) and 3 percent (280 thousand metric tons) respectively, of exports in YTD 2017.
Trends in Exports to Top Markets
Between YTD 2016 and YTD 2017, exports to the Netherlands’ top 10 markets decreased in volume to four of the country’s top 10 markets. Export volumes decreased the most to France (down 14% from YTD 2016). Other declines included Italy (down 12%), the United States (down 10%), and Spain (down 1%). Exports to Turkey saw the largest increase in volume, up 59 percent from YTD 2016, followed by Austria (up 32%), Sweden (up 18%), and Germany (up 13%).
The overall value of the Netherlands’ exports increased from YTD 2016 to YTD 2017 in eight of the top 10 markets. The largest export value increase occurred in Turkey (up 77%), Austria (up 64%), Germany (up 34%), Belgium (up 25%), and Sweden (up 25%). The markets that had export value decreases were the United Kingdom (down 3%) and France (down 1%).
Outside of the top 10 markets, other notable changes in the Netherlands’ volume of steel exports included exports to 12th-ranked Mexico (up 109% from YTD 2016), 16th-ranked Portugal (up 40% from YTD 2016), and 25th-ranked Brazil (up 675% from YTD 2016).
4
Steel Exports Report: Netherlands Top Markets by Steel Product Category
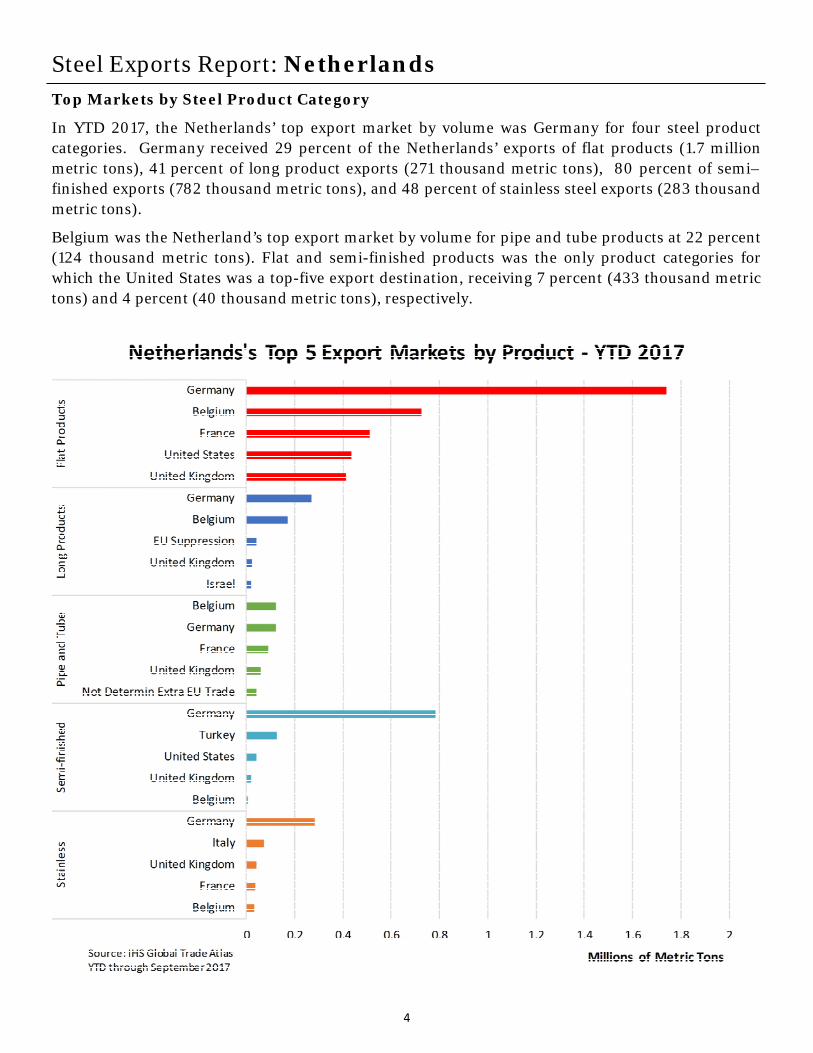
In YTD 2017, the Netherlands’ top export market by volume was Germany for four steel product categories. Germany received 29 percent of the Netherlands’ exports of flat products (1.7 million metric tons), 41 percent of long product exports (271 thousand metric tons), 80 percent of semi– finished exports (782 thousand metric tons), and 48 percent of stainless steel exports (283 thousand metric tons).
Belgium was the Netherland’s top export market by volume for pipe and tube products at 22 percent (124 thousand metric tons). Flat and semi-finished products was the only product categories for which the United States was a top-five export destination, receiving 7 percent (433 thousand metric tons) and 4 percent (40 thousand metric tons), respectively.
5
Steel Exports Report: Netherlands
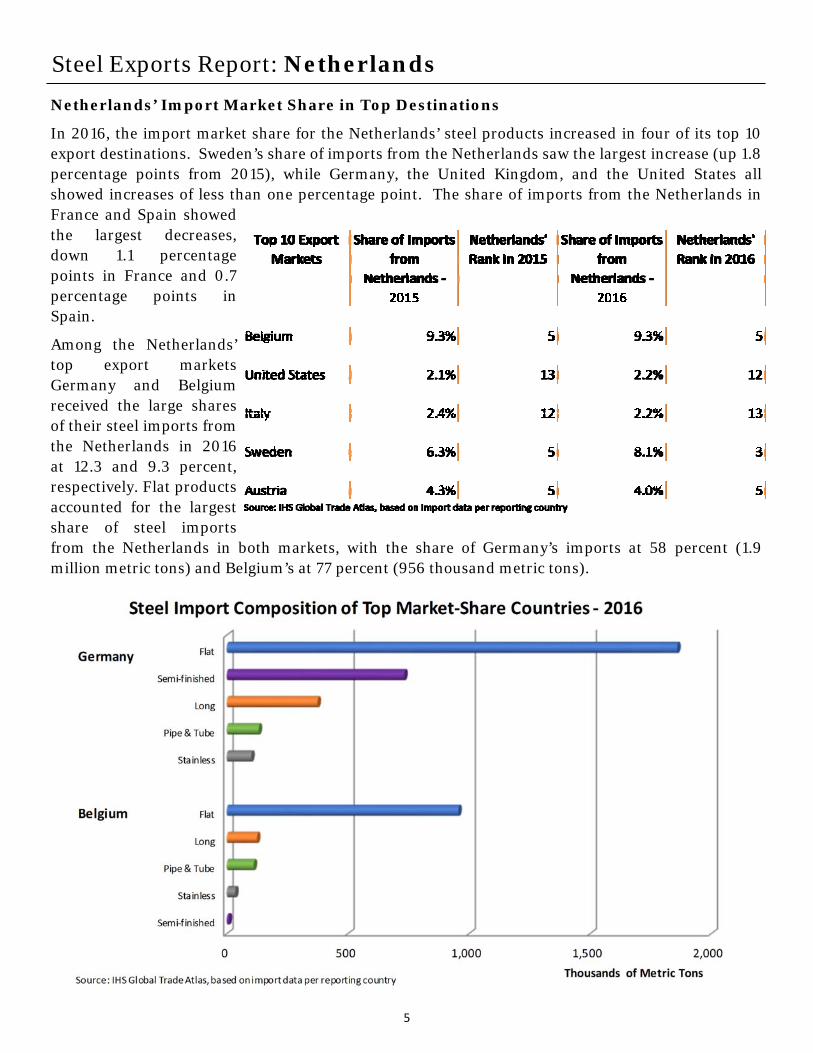
Netherlands’ Import Market Share in Top Destinations
In 2016, the import market share for the Netherlands’ steel products increased in four of its top 10 export destinations. Sweden’s share of imports from the Netherlands saw the largest increase (up 1.8 percentage points from 2015), while Germany, the United Kingdom, and the United States all showed increases of less than one percentage point. The share of imports from the Netherlands in France and Spain showed the largest decreases, down 1.1 percentage points in France and 0.7 percentage points in Spain.
Among the Netherlands’ top export markets Germany and Belgium received the large shares of their steel imports from the Netherlands in 2016 at 12.3 and 9.3 percent, respectively. Flat products accounted for the largest share of steel imports from the Netherlands in both markets, with the share of Germany’s imports at 58 percent (1.9 million metric tons) and Belgium’s at 77 percent (956 thousand metric tons).
6
Steel Exports Report: Netherlands
Overall Production and Export Share of Production
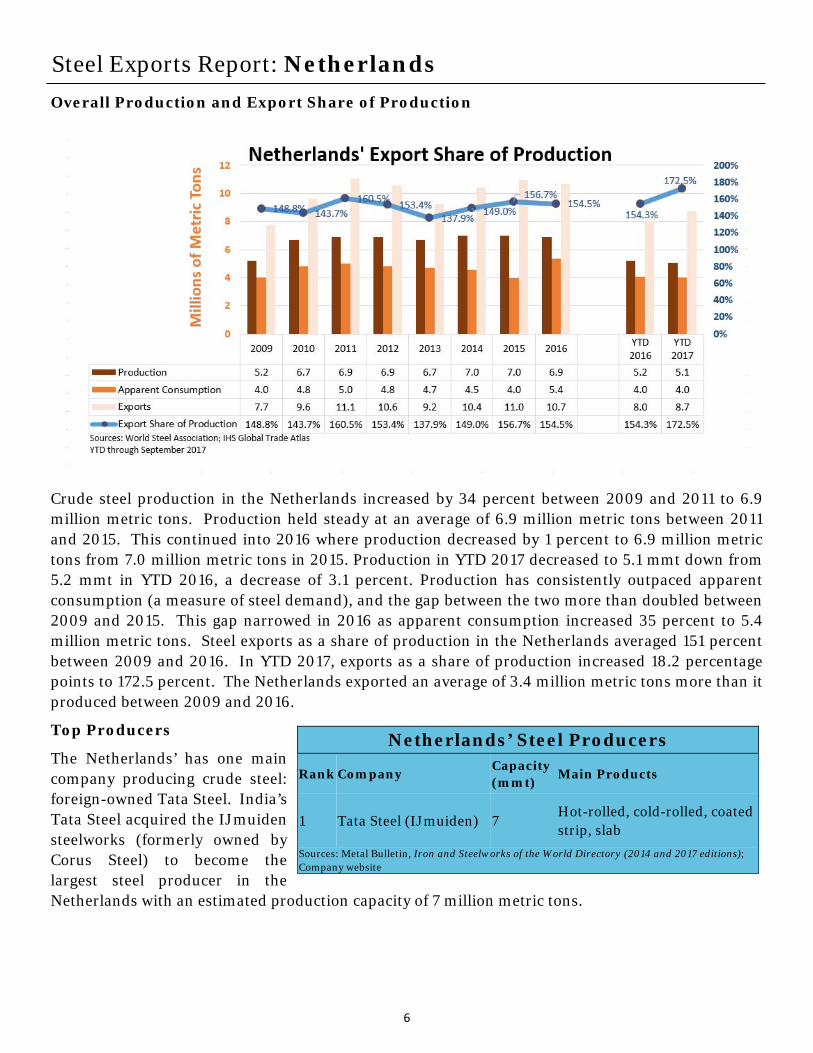
Crude steel production in the Netherlands increased by 34 percent between 2009 and 2011 to 6.9 million metric tons. Production held steady at an average of 6.9 million metric tons between 2011 and 2015. This continued into 2016 where production decreased by 1 percent to 6.9 million metric tons from 7.0 million metric tons in 2015. Production in YTD 2017 decreased to 5.1 mmt down from 5.2 mmt in YTD 2016, a decrease of 3.1 percent. Production has consistently outpaced apparent consumption (a measure of steel demand), and the gap between the two more than doubled between 2009 and 2015. This gap narrowed in 2016 as apparent consumption increased 35 percent to 5.4 million metric tons. Steel exports as a share of production in the Netherlands averaged 151 percent between 2009 and 2016. In YTD 2017, exports as a share of production increased 18.2 percentage points to 172.5 percent. The Netherlands exported an average of 3.4 million metric tons more than it produced between 2009 and 2016.
Top Producers
The Netherlands’ has one main company producing crude steel: foreign-owned Tata Steel. India’s Tata Steel acquired the IJmuiden steelworks (formerly owned by Corus Steel) to become the largest steel producer in the Netherlands with an estimated production capacity of 7 million metric tons.
Netherlands’ Steel Producers
Rank Company Capacity (mmt)
Main Products
1 Tata Steel (IJmuiden) 7 Hot-rolled, cold-rolled, coated strip, slab
Sources: Metal Bulletin, Iron and Steelworks of the World Directory (2014 and 2017 editions); Company website
7
Steel Exports Report: Netherlands
Trade Remedies in the Steel Sector
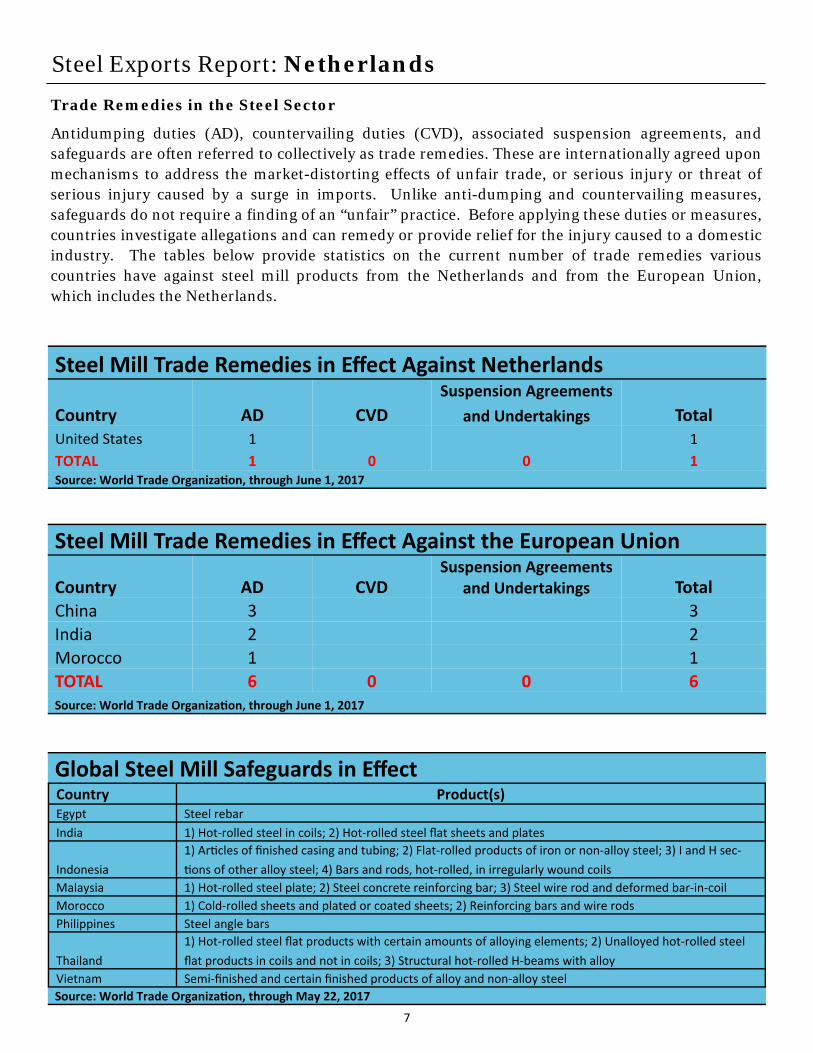
Antidumping duties (AD), countervailing duties (CVD), associated suspension agreements, and safeguards are often referred to collectively as trade remedies. These are internationally agreed upon mechanisms to address the market-distorting effects of unfair trade, or serious injury or threat of serious injury caused by a surge in imports. Unlike anti-dumping and countervailing measures, safeguards do not require a finding of an “unfair” practice. Before applying these duties or measures, countries investigate allegations and can remedy or provide relief for the injury caused to a domestic industry. The tables below provide statistics on the current number of trade remedies various countries have against steel mill products from the Netherlands and from the European Union, which includes the Netherlands.
Steel Mill Trade Remedies in Effect Against the European Union
Country AD CVD Suspension Agreements
and Undertakings Total
China 3 3
India 2 2
Morocco 1 1
TOTAL 6 0 0 6 Source: World Trade Organiza on, through June 1, 2017
Global Steel Mill Safeguards in Effect Country Product(s) Egypt Steel rebar
India 1) Hot‐rolled steel in coils; 2) Hot‐rolled steel flat sheets and plates
Indonesia
1) Ar cles of finished casing and tubing; 2) Flat‐rolled products of iron or non‐alloy steel; 3) I and H sec‐
ons of other alloy steel; 4) Bars and rods, hot‐rolled, in irregularly wound coils
Malaysia 1) Hot‐rolled steel plate; 2) Steel concrete reinforcing bar; 3) Steel wire rod and deformed bar‐in‐coil
Morocco 1) Cold‐rolled sheets and plated or coated sheets; 2) Reinforcing bars and wire rods
Philippines Steel angle bars
Thailand
1) Hot‐rolled steel flat products with certain amounts of alloying elements; 2) Unalloyed hot‐rolled steel
flat products in coils and not in coils; 3) Structural hot‐rolled H‐beams with alloy
Vietnam Semi‐finished and certain finished products of alloy and non‐alloy steel
Source: World Trade Organiza on, through May 22, 2017
Steel Mill Trade Remedies in Effect Against Netherlands
Country AD CVD
Suspension Agreements
and Undertakings Total United States 1 1
TOTAL 1 0 0 1 Source: World Trade Organiza on, through June 1, 2017
8
Steel Exports Report: Glossary
Apparent Consumption: Domestic crude steel production plus steel imports minus steel exports. Shipment data are not available for all countries, therefore crude steel production is used as a proxy.
Export Market: Destination of a country’s exports.
Flat Products: Produced by rolling semi-finished steel through varying sets of rolls. Includes sheets, strips, and plates. Used most often in the automotive, tubing, appliance, and machinery manufacturing sectors.
Import Penetration: Ratio of imports to apparent consumption.
Import Source: Source of a country’s imports.
Long Products: Steel products that fall outside the flat products category. Includes bars, rails, rods, and beams. Used in many sectors but most commonly in construction.
Pipe and Tube Products: Either seamless or welded pipe and tube products. Used in many sectors but most commonly in construction and energy sectors.
Semi-finished Products: The initial, intermediate solid forms of molten steel, to be re-heated and further forged, rolled, shaped, or otherwise worked into finished steel products. Includes blooms, billets, slabs, ingots, and steel for castings.
Stainless Products: Steel products containing at minimum 10.5% chromium (Cr) offering better corrosion resistance than regular steel.
Steel Mill Products: Carbon, alloy, or stainless steel produced by either a basic oxygen furnace or an electric arc furnace. Includes semi-finished steel products and finished steel products. For trade data purposes, steel mill products are defined at the Harmonized System (HS) 6-digit level as: 720610 through 721650, 721699 through 730110, 730210, 730240 through 730290, and 730410 through 730690. The following discontinued HTS codes have been included for purposes of reporting historical data (prior to 2007): 722520, 722693, 722694, 722910, 730410, 730421, 730610, 730620, and 730660.
Global Steel Trade Monitor: The monitor provides global import and export trends for the top countries trading in steel products. The current reports expand upon the early release information already provided by the Steel Import Monitoring and Analysis (SIMA) system that collects and publishes data on U.S. imports of steel mill products. Complementing the SIMA data, these reports provide objective and current global steel industry information about the top countries that play an essential role in the global steel trade. Information in these reports includes global exports and import trends, production and consumption data and, where available, information regarding trade remedy actions taken on steel products. The reports will be updated quarterly.
Steel Import Monitoring and Analysis (SIMA) System: The Department of Commerce uses a steel import licensing program to collect and publish aggregate data on near real-time steel mill imports into the United States. SIMA incorporates information collected from steel license applications with publicly released data from the U.S. Census Bureau. By design, this information provides stakeholders with valuable information on the steel trade with the United States. For more information about SIMA, please go to http://enforcement.trade.gov/steel/license/.