stock price response to earnings news in …management-review.nmims.edu/wp-content/uploads/... ·...
TRANSCRIPT

Volume XXXIII January 2017 | ISSN: 0971-1023
www.nmims.eduMANAGEMENT REVIEW
STOCK PRICERESPONSE TO EARNINGS
NEWS IN INDIA
University Day Special
cities of India, and therefore street
Contents
mall farmers. Majority of the
farmers (82%) borrow less than
Rs 5 lakhs, and 18% borrow
between Rs 5 – 10 lakhs on a
per annum basis. Most farmers
(65.79%) ar
Table source heading
Table 23: The Results of Mann-Whitney U Test for DOWJONES Index Daily ReturnsDr. Rosy Kalra
Mr. Piyuesh Pandey
References
References

Table of Contents
Editorial 07
– Gurumurthy Kalyanaram
Stock Price Response to Earnings News in India: Investors' Learning 10
Behaviour under Uncertainty
– Sachin Mathur
– Anupam Rastogi
Strategy Performance Evaluation of a Port Organisation based 27
on Multi-Criteria Decision Making using Fuzzy Logic Method
– M. Ramachandran
– Vishal Fegade
– P.P. Raichurkar
Emotional intelligence - the moderator of leadership styles and performance 35
– Dhruv Desai
– Manjari Srivastava
Beta Anomaly and Comparative Analysis of Beta Arbitrage Strategies 57
– Nehal Joshipura
– Mayank Joshipura
Study of the factors affecting the selection of orthopaedic implant 73
brands and their perceptual mapping in Mumbai city
– Haresh Raulgaonkar
– Aishwarya Wagle
– Henna Shah
– Anshul Garg
– Yugal Sikri
Expiration Day Impact on the Indian Spot Market Volatility 88
– Sangeeta Wats
ISSN: 0971-1023 | NMIMS Management ReviewVolume XXXIII January 2017
Table of ContentsISSN: 0971-1023 | NMIMS Management ReviewVolume XXXIII January 2017 3
cities of India, and therefore street
Contents
mall farmers. Majority of the
farmers (82%) borrow less than
Rs 5 lakhs, and 18% borrow
between Rs 5 – 10 lakhs on a
per annum basis. Most farmers
(65.79%) ar
Table source heading
Table 23: The Results of Mann-Whitney U Test for DOWJONES Index Daily ReturnsDr. Rosy Kalra
Mr. Piyuesh Pandey
References
References

School of Business Management Advisory Committee
Gurumurthy Kalyanaram, Editor in Chief
Managing Editor:
Ms. Papiya De, NMIMS University
The NMIMS Management Review, its Editorial Board, Editor and Publisher and Registrar, SVKM's Narsee Monjee
Institute of Management Studies, Vile Parle, Mumbai 400 056, disclaim responsibility and liability for any
statement of fact or opinion made by the contributors / authors.
Views expressed by authors in this publication do not represent the view of SVKM's Narsee Monjee Institute of
Management Studies. The authors are wholly and solely responsible for their articles including the source of
information and references.
Editorial Board
1) Avinandan Mukherjee, Editor, International Journal of Pharmaceutical and Healthcare Marketing, Emerald
Publishers, USA
2) Bino Paul, Tata Institute of Social Sciences, Mumbai
3) Charles Gengler, City University of New York, USA
4) David L. Ford, The University of Texas, USA
5) Franklin Carter, Penn State University, USA
6) Kalyan Raman, Northwestern University, USA
7) K. Narayanan, IIT Bombay, India
8) Kishore Gopalakrishna Pillai, Norwich School of Business, UK
9) Michael Benoliel, Singapore Management University, Singapore
10) N.R. Bhanumurthy, National Institute of Public Finance and Policy, New Delhi, India
11) Neil Wilkof, Head, Intellectual Property Division, Dr. Eyal Bressler & Co., Israel
12) Orlando Richard, The University of Texas at Dallas, USA
13) Paul R. Kutasovic, Consultant (Financial and Economic Analysis), New York, USA
14) Peter Leeflang, LUISS Guido Carli University, Italy and University of Groningen, Netherland
15) R.S. Deshpande, Director, Institute for Social and Economic Change, Bengaluru, India
16) Russell Winer, New York University, USA
17) Saraswathy (Sara) Nochur, Vice-President, Regulatory Affairs, Alnylam, USA
18) Umanath S. Narayan, University of Cincinnati, USA
School of Business Management Advisory Committee Editorial BoardISSN: 0971-1023 | NMIMS Management ReviewVolume XXXIII January 2017
ISSN: 0971-1023 | NMIMS Management ReviewVolume XXXIII January 2017
All communication should be addressed to:
The Editor in Chief
Dr. Gurumurthy Kalyanaram
NMIMS Management Review
V.L. Mehta Road,
Vile Parle (W), Mumbai – 400 056
Email: [email protected]
Manuscripts are generally required to undergo a double-blind review process. The journal is refereed and also appropriately indexed.
ADVISORY BOARD
Bala Krishnamoorthy Ashok Nag
SBM-NMIMS, Mumbai NMIMS, Mumbai
Ranjan Chakravarty Uma Narain
SBM-NMIMS, Mumbai NMIMS, Mumbai
Sashi Sivaramakrishna Geeta D'souza
SBM-NMIMS, Bangalore SBM-NMIMS, Mumbai
Mayank Joshipura
SBM-NMIMS, Mumbai
Managing Editor
Papiya De
NMIMS Management Review
V. L. Mehta Road
Vile Parle (W), Mumbai -400056
Email: [email protected]
4 5
cities of India, and therefore street
Contents
mall farmers. Majority of the
farmers (82%) borrow less than
Rs 5 lakhs, and 18% borrow
between Rs 5 – 10 lakhs on a
per annum basis. Most farmers
(65.79%) ar
Table source heading
Table 23: The Results of Mann-Whitney U Test for DOWJONES Index Daily ReturnsDr. Rosy Kalra
Mr. Piyuesh Pandey
References
References

1) Ajay Pandey, IIM Ahmedabad
2) Amalendu Jyothishi, Amrita University
3) Amiya Basu, Syracuse University, USA
4) Anindya Sen, IIM Calcutta
5) Ashok Pratap Arora, Management
Development Institute, Gurgaon
6) Bhuvan Damahe, L & T College of Engineering,
Mumbai
7) Devnath Tirupati, IIM Bangalore
8) Hao Chen, Tsinghua University, Beijing, China
9) Jim Sund, Tricertes, USA
10) John Malindretos, William Patterson
University, USA
11) Kumar Nochur, President,
Vidya Technologies, USA
12) M.B. Raghupathy, Shiv Nadar University
13) Nagasimha Kanagal, IIM Bangalore
Panel of Reviewers
14) Neerpal Rathi, Xavier School of Human
Resource Management
15) Panduranga Bhatta, IIM Calcutta
16) P. Balasubramanian, Amrita University
17) S.P. Agarwal, Mgmt. Consultant, India
18) Sashi Sivaramkrishnan, NMIMS University,
Bangalore
19) Steve Gilbert, The University of Texas,
Austin, USA
20) Sivakumar Venkataramany, Ashland
University, USA
21) Sushanta Mahapatra, Amrita University
22) Tejinder Sharma, Kurukshetra University
23) Vivek Natarajan, Lamar University, USA
24) Zubin Mulla, Tata Institute of Social Sciences,
Mumbai
Panel of Reviewers Editorial from Dr. Gurumurthy KalyanaramISSN: 0971-1023 | NMIMS Management ReviewVolume XXXIII January 2017
ISSN: 0971-1023 | NMIMS Management ReviewVolume XXXIII January 2017
Gurumurthy Kalyanaram
Improving the Long-term Prosperity and Productivity of India Through Improvement in
Learning Outcomes in Schools
In this special issue released on the occasion of University Day of NMIMS (Deemed to be) University, we present
six insightful manuscripts by scholars resident at NMIMS.
Shri Vile Parle Kelavani Mandal, with the help of a donation from Narsee Monjee Educational Trust, established a
Management institute of the Mumbai University in 1981. Based on its recognized excellence, University Grants
Commission granted Deemed-to-be-University status to the Institute in early 2000s. The University now offers
comprehensive education (undergraduate, graduate, executive and doctoral education) across a variety of
disciplines including Architecture, Business, Commerce, Economics, Education, Engineering, Pharmacy, Science,
and Technology.
This special issue features research contributions and insights from the distinguished scholars at this University.
Please review them and connect with these and other scholars at NMIMS University.
Here, in this editorial, we present reflections of improving prosperity, productivity and social mobility of India
through improving learning outcomes in schools.
Background to School Education
The evidence is compelling and pervasive that improved learning outcomes in schools increases prosperity and ¹
productivity by orders of magnitude. Such better education enhances social mobility and productivity of
individuals, equality of opportunity, and prosperity of the individuals and society by orders of magnitude.
The goal of India's public policy must be to improve the learning outcomes of students in schools through
enhancement of self-guided and motivated education and training of teachers.
The purpose must be to reach out to the less privileged and removed segments of the society in India. By all
reports, the number of teachers in large parts of India is awfully low;a large proportion of these teachers are un-
credentialed. We can address these challenges only through an open and scalable model (a point that many
educators repeatedly insist) – and that is precisely what we do here.
Better quality education can be delivered only by competent teachers whose knowledge set is contemporary. This
is even more urgent in India where access to information is limited and teachers, the chief mentors and resource
persons, are the authorities of information and knowledge.
Editorial
¹ Including studies by Raj Chetty, John Friedman, Jeffrey Hammer, Karthik Muralidhar, Jonah Rockoff, Amartya Sen, Venkatesh Sundararaman,
and others. It is now an empirical generalization – sound generalization – that good quality school teachers matter, and matter very
substantially, even in developed societies like the US, but the importance of qualified school teachers is even more acute and accentuated for a
society such as India.
6 7
cities of India, and therefore street
Contents
mall farmers. Majority of the
farmers (82%) borrow less than
Rs 5 lakhs, and 18% borrow
between Rs 5 – 10 lakhs on a
per annum basis. Most farmers
(65.79%) ar
Table source heading
Table 23: The Results of Mann-Whitney U Test for DOWJONES Index Daily ReturnsDr. Rosy Kalra
Mr. Piyuesh Pandey
References
References

Editorial from Dr. Gurumurthy KalyanaramISSN: 0971-1023 | NMIMS Management ReviewVolume XXXIII January 2017
Editorial from Dr. Gurumurthy KalyanaramISSN: 0971-1023 | NMIMS Management ReviewVolume XXXIII January 2017
Viable Approach / Program for India
We have consulted with many distinguished public servants: policy and political leaders, business leaders,
educationists, civic leaders, and philanthropists. Of course, we have reviewed the research and field work in this
domain. We have also carefully reviewed the two recent Tata Trust initiatives in school education: Hindi portal by
Khan Academy and Connected Learning (with TISS and MIT). Based on careful and detailed research, four inputs
and facts stand out.
1. Re-education and training of teachers is absolutely critical. While estimates vary, there are over 6 million
school teachers in India educating over 200 million students. All over the world, but particularly in India where
the authority of teachers is enhanced by directives and traditions, teachers are perhaps the most important
link in learning. This becomes even more compelling in disadvantaged and disenfranchised neighborhoods
which should be our focus if we want to improve the productivity and prosperity of India.
2. Re-education of teachers through mandates is not a productive approach. Re-education through self-learning
and self-guidance would be the best approach, particularly given the large heterogeneity in the knowledge-
level of teachers.
3. To have a realistic impact, the platform/program must be accessible and open.
4. The program must be completely indigenous (e.g., organization, platform and presentation) though content in
such domains such as Math and Science is evidently universal.
Exemplar Initiatives: Recent Tata Trust Initiatives in School Education
Teachers' Education and Training is not only synergistic with, but is also necessary for amplification and success of
two other recent School Education initiatives by Tata Trust: investment in Khan Academy to design a Hindi portal
for the learners; and Connected Learning Initiative by TISS and MIT.
Students/learners are more likely to use the Khan Academy material if his/her teacher at least is familiar with that
source and even uses it in teaching. Without such engagement, Khan Academy usage may be limited to urban and
privileged areas and students.
Similarly, the training of over 4,000 teachers by Connected Learning initiative will be amplified by this proposal,
which is scalable. Ultimately, we want to reach out to 6 million teachers – the more of them are educated and
trained, the more enriching will be the learning experience for the students.
Concluding Remarks
The objective must be to design an on-line portal for teachers. This will be open and universally accessible. This on-
line program/platform will be the learning and training source for teachers. While this will be open-source, it will
require login and individual identification.This portal will compose of various on-line learning sources for school
curriculum.
Dr. Gurumurthy Kalyanaram is the Editor of two prestigious scholarly journals of NMIMS: Management
Review and Economic and Public Policy Journal.
Dr. Kalyanaram is also currently advising MIT Global Startup Workshop, and its India and Asia initiatives. He
holds professorial affiliations with City University of New York (Part-time) and Tata Institute of Social
Sciences (Visiting Research Professor). He is also serving as the President of Global MIT South Asian Alumni
Association.
Dr. Kalyanaram's Educational Services include leadership in a school education project in India and digital
learning and counseling about colleges and universities.
Dr. Kalyanaram earned his Ph.D. in Management Science in 1989 from the Massachusetts Institute of
Technology (MIT). He holds an MBA from the University of Texas at Arlington and a BE in Electronics and
Communication Engineering from the University of Madras.
8 9
cities of India, and therefore street
Contents
mall farmers. Majority of the
farmers (82%) borrow less than
Rs 5 lakhs, and 18% borrow
between Rs 5 – 10 lakhs on a
per annum basis. Most farmers
(65.79%) ar
Table source heading
Table 23: The Results of Mann-Whitney U Test for DOWJONES Index Daily ReturnsDr. Rosy Kalra
Mr. Piyuesh Pandey
References
References

ISSN: 0971-1023 | NMIMS Management ReviewVolume XXXIII January 2017
ISSN: 0971-1023 | NMIMS Management ReviewVolume XXXIII January 2017
Stock Price Response to Earnings Newsin India: Investors' Learning Behaviour
under Uncertainty
Sachin Mathur
Anupam Rastogi
Abstract
This research paper examines the association of inter-
temporal variation in stock price response to quarterly
earnings surprise in India with relevant indicators of
changes in fundamental conditions. Earnings response
coefficients are higher during periods when the
economic conditions indicate lower systematic risk
and higher growth prospects, consistent with asset
pricing theory. However, there are differing
asymmetric effects of good and bad earnings news
depending upon recent market and macro-economic
conditions, especially for stocks associated with
greater information uncertainty. We conclude that the
evidence from earnings response supports predictions
of rational models of investors' learning behaviour
under uncertainty.
Keywords: Earnings response coefficients, information
uncertainty, stock prices, emerging markets
Stock Price Response to Earnings News in India:Investors' Learning Behaviour under Uncertainty
Stock Price Response to Earnings News in India:Investors' Learning Behaviour under Uncertainty
1. Introduction
In this research paper, we examine the influence of
changing macro-economic conditions on stock market
reaction to quarterly earnings news for a sample of
actively traded stocks in India. We test two hypotheses
in this paper. First, the earnings response coefficient
(ERC, the elasticity of stock price return to earnings
surprise) should increase directly with improving
economic growth prospects and decline in interest
rates. We call this equity valuation effect, since the
equity valuation models equate fair value of a stock
directly with future cash flows and inversely with
discount rates. Extending the present value equation,
and assuming that the earnings process has
persistence, it can be analytically established that the
earnings response coefficient would be an increasing
function of the expected growth opportunities and a
decreasing function of the discount rate (Collins and
Kothari 1989).
Second, we expect that the effect of changes in market
conditions should result in asymmetric earnings
response due to investors' learning process depending
upon whether the new earnings information is
consistent or inconsistent with the market trends.
When market conditions improve, the response would
be greater for firms announcing bad earnings news but
lesser for firms announcing good earnings news, and
vice versa when market conditions worsen. We call this
learning effect hypothesis, and it can be explained
using rational models of learning under uncertainty,
for example, the regime-shift model of Veronesi (1999)
or the model of learning under parametric uncertainty
of Lewellen and Shanken (2002).
Collins and Kothari (1989) empirically validated that
the earnings response coefficients are positively
associated with rising earnings growth and earnings
persistence, but decline with increase in the risk free
rate. Johnson (1999) confirmed the direct relationship
of earnings response with business cycles.
Conrad, Cornell and Landsman (2002) empirically
validated the regime shift effect, which is based on
investors' learning behaviour, for the US market. In the
same paper, the authors showed that market response
to bad earnings news is greater under relatively good
market conditions, and conversely, the market
response to good earnings news is greater under
relatively bad market conditions, the relative
conditions being defined by comparing the current
conditions with the average over the past 12 months.
However, the learning effect has not been tested so far
in an emerging market context and this paper is the
first to examine whether the investor response to
earnings news in India is associated with time variation
due to changing valuation, and also whether there is
evidence of investors' learning behaviour under
uncertainty.
In order to test the two hypotheses for the Indian
market, we identify seven relevant proxies based on
previous research that establish the relationship
between stock returns and business cycle indicators.
The selected variables include growth in the index of
industrial production, revision in economic growth
forecasts, short term Treasury Bill rates, term structure
of interest rates and three price multiples - the price to
earnings ratio, the price to dividend ratio and the price
to book value ratio. Previous research has established
the relationship of stock prices with the index of
industrial production (Pethe and Karnik 2000) and
interest rates (Panda 2008) in India.
As summary measures, we build an index of market
conditions (COND) using average standardized values
of these proxies and an index of relative market
conditions (RCOND) using average cyclical changes in
these proxy measures.
We find clear evidence of equity valuation effect. The
monthly ERCs based on cross-sectional regressions
10 11
cities of India, and therefore street
Contents
mall farmers. Majority of the
farmers (82%) borrow less than
Rs 5 lakhs, and 18% borrow
between Rs 5 – 10 lakhs on a
per annum basis. Most farmers
(65.79%) ar
Table source heading
Table 23: The Results of Mann-Whitney U Test for DOWJONES Index Daily ReturnsDr. Rosy Kalra
Mr. Piyuesh Pandey
References
References

have a statistically significant correlation across
proxies of market conditions and a Pearson's product
moment correlation of 0.51 with COND. In regressions
using larger sample of pooled data, we find that the
ERCs under strong COND are nearly four times as high
as those under weak COND in the case of both good
and bad earnings news, consistent with the equity
valuation effect.
We also test the learning effect with changing market
conditions, and our conclusions support the regime
shift model. Analysing the effect of conditions relative
to the average of the previous 12 months, using
RCOND index, which is derived from the COND index,
we find that ERCs in case of bad news under improving
relative conditions are more than four times as high as
when conditions are worsening, but the difference is
statistically insignificant in the case of good news due
to the offsetting effect of rise in the discount rate,
consistent with the predictions of the regime shift
model.
The learning effect is expected to be higher for firms
where information flow is constrained. Consequently,
we also test the effect of relative market conditions
across firms by characteristics such as size, analyst
coverage and stock return volatility. We find that the
learning effect indeed becomes stronger in the case of
stocks which are smaller, have lower analyst coverage,
and have more volatile returns.
2. Literature Review
The linkage of macro-economic conditions with asset
pricing is well-established in literature. Empirical asset
pricing models can be formed using a number of
macro-economic indicators that are related either to
aggregate growth in cash flows or to discount rates
(Chen, Roll and Ross 1986).
Macro-economic linkages can also be extended to the
earnings response context (Collins and Kothari 1989).
The authors use the equity valuation equation to
analytically establish the relationship between
abnormal stock returns and unexpected earnings. The
earnings response coefficient in their equation is a
function of the firm's earnings growth persistence, the
firm's earnings growth prospects, risk free rate and
systematic risks. They also validate these relationships
empirically for US stocks.
The same analysis of relating earnings response is
extended to business cycles (Johnson 1999). In her
framework, the relationship of ERC with future cash
flows is through macro-economic growth and not just
firm-specific growth. The author also empirically
confirms the relationship of ERCs with business cycle
stages and macro-economic proxies of discount rates.
The equity valuation effect, as discussed in the
previous section, pertains to the influence of market
conditions on ERCs through discount rates and
economic growth prospects. However, when market
conditions change, investors have to change their
assessment of discount rates and future cash flows.
Under the rational expectations framework, and given
complete information, investors conduct this
reassessment instantaneously. This framework
essentially assumes the presence of some informed
investors who know the true valuation process and are
able to perfectly arbitrage away any profit making
opportunities.
However, even if the investors are assumed to be
rational, they may face parametric uncertainty
because of incomplete information. Further, if we
presume that the investors are vulnerable to cognitive
biases, their reassessment of stock values may be
described more appropriately by models that
incorporate the effect of such biases.
In such a case, the learning process of investors may be
described by alternative models, which could be either
rational or behavioural. For instance, Conrad et al.
(2002) use the regime shifting model (Veronesi 1999)
and behavioural model of investor behaviour based on
conservatism and overconfidence (Barberis, Shleifer
and Vishny 1998) to explain the asymmetric response
to good and bad news depending upon the direction of
change in market conditions. The authors argue that
investors tend to extrapolate recent trends due to
behavioural biases, such as representativeness.
However, the investor behaviour on the arrival of
unexpected news can be explained using the rational
regime shift model.
The regime shift model (Veronesi 1999) predicts that
the effect of bad earnings news under perceived
strong conditions would be more than that estimated
by the present value model and that of good earnings
news under perceived weak conditions would be
lesser than the present value estimate. This is because
when investors believe that conditions are good but
are surprised by bad news, they not only change their
expectations of future cash flows but also require a
higher discount rate to compensate for the perceived
uncertainty regarding the true state of the market. The
arrival of good news under improved conditions
however has only a marginal impact on abnormal
returns, since investors do not need to change their
cash flow or discount rate expectations. Conversely,
good news during bad times also increases investor
uncertainty and therefore expected discount rate;
however, expected cash flows also increase, partly
offsetting this effect. Again, arrival of bad news during
bad times does not surprise the investors and results in
a marginal impact.
Therefore, the unexpected arrival of bad earnings
news when market conditions have a positive trend,
results in the double impact of downward revisions in
expected cash flows and upward revision in discount
rate due to heightened uncertainty. On the other hand,
the arrival of good news under worsening market
conditions results in upward revision in expected cash
flows but also in the discount rate due to increased
uncertainty. Since these effects are mutually
offsetting, the asymmetric response between good
and bad earnings news will be lesser when market
conditions worsen than when they improve.
The apparent extrapolation of recent market
conditions and revised inference based on firm-
specific news can also be supported by other models.
For example, the model of learning under parametric
uncertainty (Lewellen and Shanken 2002) is built on
the assumption that investors apply new learning to
update prior beliefs, but that they do not know the
true means and variances of firms' cash flows (in
contrast to the frequentist or econometrician-investor
assumed in the rational expectation framework).
Extending this model, we can argue that investors'
prior beliefs are influenced significantly by recent
economic trends, but they update their beliefs on the
arrival of firm-specific earnings news. However, like
Conrad et al., we build our hypothesis using the regime
shift model (rather than Lewellen and Shanken's
model) because it provides more specific predictions
in the context of asymmetric response to earnings
news.
A common thread among alternative models of
rational learning behaviour of investors (Veronesi
1999, Lewellen and Shanken 2002, and Brav and
Heaton 2002) is that they are based on the premise
that investors face parametric uncertainty regarding
future cash flows and discount rates. Intuitively, we
would therefore expect that delayed learning
response would be more apparent for firms which are
characterised by a greater degree of uncertainty
regarding their expected cash flows. This can be tested
in the cross-sectional context using data across firms
which differ in terms of the level of uncertainty
associated with their cash flows.
ISSN: 0971-1023 | NMIMS Management ReviewVolume XXXIII January 2017
ISSN: 0971-1023 | NMIMS Management ReviewVolume XXXIII January 2017
Stock Price Response to Earnings News in India:Investors' Learning Behaviour under Uncertainty
Stock Price Response to Earnings News in India:Investors' Learning Behaviour under Uncertainty12 13
cities of India, and therefore street
Contents
mall farmers. Majority of the
farmers (82%) borrow less than
Rs 5 lakhs, and 18% borrow
between Rs 5 – 10 lakhs on a
per annum basis. Most farmers
(65.79%) ar
Table source heading
Table 23: The Results of Mann-Whitney U Test for DOWJONES Index Daily ReturnsDr. Rosy Kalra
Mr. Piyuesh Pandey
References
References
3. Sample and Data
The analysis of firms' earnings announcements cover
200 large actively traded stocks that constituted the
S&P BSE 200 index and cumulatively accounted for 76
per cent of the market capitalisation of the Bombay
Stock Exchange at the end of March 2015.
The event window is the six-year period between April
2009 and March 2015. The sample covers 23 quarters
of announcements starting from the first quarter of
2009-10 to the third quarter of 2014-15. This
effectively provides 4,373 data points of firm-quarters.
The earnings data has been sourced from Capitaline
database, while the stock returns were estimated
using prices, bonus, splits and dividends data from the
website of the Bombay Stock Exchange (BSE),
www.bseindia.com. The earnings announcement
dates are also taken from the website of Bombay Stock
Exchange.
For analysing aggregate stock market conditions, we
compile the data from the SEBI Handbook of Statistics
and the monthly SEBI Bulletin published by the
Securities and Exchange Board of India (SEBI) on its
website, www.sebi.gov.in. The economic data related
to economic forecasts and interest rates are sourced
from the website of the Reserve Bank of India,
www.RBI.org, while data related to macro-economic
series including index of industrial production ((IIP),
gross domestic product (GDP), and wholesale price
inflation (WPI) are obtained from the website of
Ministry of Statistics and Programme Implementation,
India, www.mospi.nic.in.
4. Methodology
The methodology to study the equity valuation and
learning effects on earnings response involves
multivariate regression based on a pooled sample of
quarterly earnings announcements. Our basic model,
following Collins and Kothari (1989), measures the
earnings response coefficient as the elasticity of
abnormal stock returns to unexpected earnings.
However, we modify the basic earnings response
model by adding interaction terms that incorporate
the effect of market conditions and changes in market
conditions on ERC to study the equity valuation effect
and learning effect, respectively, on earnings
response.
We choose the indicators that represent market
conditions based on Chen, Roll and Ross (1986), while
we motivate the hypothesis of a relationship between
these indicators and earnings response based on the
findings of Collins and Kothari (1989).
Our empirical analysis of learning effect is based on the
theoretical regime shift model of Veronesi (1999). In
Veronesi's regime shift model, investors are uncertain
about the stock valuation parameters, including future
cash flows, as well as the discount rate. Learning
occurs by means of Bayesian updating, wherein
investors observe recent trends in dividends as
information signals indicating a switch between low
expected dividend growth and high expected dividend
growth regime. In our adaptation of Veronesi's model,
instead of dividend trends, investors observe the
recent trends in economic indicators and index
multiples, and use these to adjust their posterior
probabilities regarding the current regime prior to the
earnings season.
As earnings are announced during the earnings
season, investors revise these probabilities for each
stock, more significantly in the case of stocks where
the sign of unexpected earnings contradicts the
underlying regime expectation. When in a high growth
regime (good times), the earnings surprise is negative,
investors not only revise their future earnings
expectations downwards, the increased uncertainty
caused by the contradict ion between prior
expectation and the new signal also results in higher
return expectation and therefore, discount rates,
assuming that investors are risk averse. However, in a
low growth regime (bad times), positive earnings
surprise results in an upward shift in future earnings
expectation, but this is offset by a higher discount rate
resulting from increased uncertainty because of a
contradictory signal. Hence, the learning effect results
in apparent asymmetric behaviour wherein investors
appear to react strongly to bad earnings news during
good times but not to good earnings news during bad
times.
Though our empirical test of learning effect is
motivated by Veronesi's model, we use changes in
market conditions instead of trends in dividends as the
signal used by investors to adjust their posterior
probabilities. We justify the primacy of market-wide
information rather than firm-specific information,
based on prior research (Morck, Yeung and Yu, 2000)
that finds that stock prices in emerging markets
incorporate market-level information more than firm-
specific information.
5. Empirical Model
5.1 Unexpected earnings
The basic model of earnings response we have used
can be represented by the following equation:
AR = a + b1 UE + b2 Size + e (1)
In the above equation, AR stands for the abnormal
return upon earnings announcement, UE for
unexpected earnings and Size is a control variable. The
coefficient of UE, b1 in the above equation, is the
earnings response coefficient. Size is estimated as the
log of market capitalisation of each firm at the end of
the previous month.
For the purpose of this study, AR is measured as the
difference between stock returns and equally-
weighted returns of the benchmark size decile for the
stock. AR is arithmetically cumulated over a two-day
period including the announcement date and the next
trading day, represented as AR[0,1]. This is done to
take into account imprecise time of release of earnings
information, or its late release towards the end of the
trading period on the announcement date. We also
observe that maximum volatility in AR occurs during
these two days. UE is measured as follows:
UE = X – E(X )/P (2)t t t
In the above equation, X is the actual earnings per t
share and E(X ) is the forecasted earnings per share, t
further divided by the share price 6 days before the
announcement date, in order to standardise the UE, so
as to make it comparable across firms and events. For
estimating E(X), we use a simple measure based on
rolling seasonal random walk model. Thus,
UE = (X - X )/P (3)t t-4 t
Where X is the earnings per share in the t - 4
corresponding quarter of the previous year.
We also estimate and compare two other more
sophisticated measures, one based on a time series
model (Foster 1977), and the second, based on analyst
estimates. We find that the analyst estimates provide
the most accurate measure based on root mean
squared errors and mean absolute errors, but are
however, least correlated with actual market response
(abnormal returns on announcement) among the
three measures. The Foster's time series model has
ISSN: 0971-1023 | NMIMS Management ReviewVolume XXXIII January 2017
ISSN: 0971-1023 | NMIMS Management ReviewVolume XXXIII January 2017
Stock Price Response to Earnings News in India:Investors' Learning Behaviour under Uncertainty
Stock Price Response to Earnings News in India:Investors' Learning Behaviour under Uncertainty14 15
cities of India, and therefore street
Contents
mall farmers. Majority of the
farmers (82%) borrow less than
Rs 5 lakhs, and 18% borrow
between Rs 5 – 10 lakhs on a
per annum basis. Most farmers
(65.79%) ar
Table source heading
Table 23: The Results of Mann-Whitney U Test for DOWJONES Index Daily ReturnsDr. Rosy Kalra
Mr. Piyuesh Pandey
References
References

correlation with market response which is comparable
to the seasonal random walk estimate, but has only
marginally better accuracy. Hence, we select the
rolling seasonal random walk process as our measure
for UE, despite lower accuracy, due to its simplicity and
better representation of the investors' reaction.
There is an inherent pessimistic bias in our rolling
seasonal random walk model since it assumes no
growth; this was evident because UE was positive for
around two-third of the observations. To mitigate this
bias, we define good earnings news observations as
those that constitute the highest one-third in terms of
UE and record positive earnings surprise. Similarly, we
define bad earnings news observations as those that
constitute the lowest one-third in terms of UE and
record negative earnings surprise. We ignore the
middle one-third observations sorted by US.
In order to separately estimate the earnings response
to good and bad news, we modify equation (1) as
follows:
AR = a + b1 BadUE + b2 GoodUE + b3 Size + e (4)
In the above equation, BadUE is estimated as UE
multiplied by a dummy variable Bad which takes the
value of 1 in case of good earnings news observation
and 0 otherwise. Similarly GoodUE is estimated as UE
multiplied by Good which takes a value of 1 in case of
good news and 0 otherwise.
To test the effects of equity market conditions, and
conditions relative to recent trends, we identify proxy
measures and construct the indices COND, its
derivative RCOND respectively. We estimate ERCs b1
and b2 from equation (4) under alternative levels of
COND and RCOND.
Alternatively, we use values of COND and RCOND
directly as interaction terms by modifying equation (4)
as follows:
AR = a + b1BadUE + b2 GoodUE + b3BadUE*I +
b4GoodUE*I + b5 Size + e (5)
In the above equation, “I” stands for interaction term
and represents COND or RCOND as continuous
variables.
5.2 Identification of proxies of equity
market conditions
We use seven proxy variables to define the equity
market level and relative level. These include the three
price multiples and four business cycle indicators. The
estimates for the multiples, price to earnings (PE),
price to dividend (PD) and price to book value (PB), are
taken as trailing 12 months multiple of Nifty 50 stocks
as provided on the website of NSE. The four business
cycle indicators include growth in industrial
production (IIPG), revision in economic forecasts
(REV), yield on 91-day Treasury bill (TB) and term
structure of interest rate (TERM).
Since IIP growth figures are available with a two month
lag, we estimate the current IIP growth figures
assuming that two months moving average provides
the best estimate for one month forward IIP growth.
REV is based on the change in next year's economic
growth forecast in the most recent RBI's survey of
economic forecasters compared to the previous
survey. TB is the cut-off yield of each month's last
auction of 91-day Treasury bills. TERM is estimated as
the difference between the yields on 10-year
Government securities and 91 day Treasury bills.
We also create summary measures from these
categories by giving equal weights to the individual
variables within each category of price multiples and
business cycle indicators. We assign a negative sign to
TB due to its inverse relationship with other business
cycle indicators. We then combine all the proxy
variables into one index of equity market conditions
COND by giving equal weightage to the multiples and
to the economic categories.
Thus:
COND = 0.500 VAL + 0.500 ECO
VAL = 0.333 PE + 0.333 PD + 0.333 PB
ECO = 0.25 IIPG + 0.25 REV – 0.25 TB + 0.25 TERM
Hence,
COND = 0.167 PE + 0.167 PD + 0.167 PB + 0.125 IIPG +
0.125 REV – 0.125 TB + 0.125 TERM (6)
Table 2 provides the correlation matrix between the
proxy indicators of equity market conditions. The
correlations are statistically significant but moderate
on an average, which shows that no variable is
redundant.
Table 2
Correlations between Indicators of Equity Market Conditions
PE PD PB IIPG REV TB TERM
PE
PD 0.84
PB 0.47 0.57 IIPG 0.10 0.27 0.70
REV 0.25 0.28 0.37 0.34
TB 0.12 -0.03 -0.10 -0.20 -0.32 TERM 0.07 0.26 0.15 0.17 0.36 -0.92
COND 0.65 0.78 0.77 0.60 0.62 -0.47 0.59
PE: Price to earnings ratio ; PE: Price to dividend ratio ; PB: Price to book value ratio;
IIPG: Growth in index of industrial production; REV: Revision in annual economic
growth forecast; TB: Yield on 91 day T-Bill; TERM: Difference in yield between 10
year G-Sec and 1 year T-Bill
Note: Shaded cells denote statistically significant correlations
We also derive for each proxy variable a measure of
relative condition by subtracting past 12 months
moving average value. Similarly, we estimate a
summary measure RCOND for relative market
condition as follows:
Thus, we define changes in market conditions in terms
of comparing the recent month with the past 12-
month average as in Conrad et al. (2002). However,
whereas relative P/E level is used as the proxy variable
in Conrad et al. (2002), we repeat the tests using the
relative values of multiple alternative proxies of
market conditions as well as the RCOND index.
Table 3 shows the correlation matrix between relative
values of the proxy variables. As in the case of the
primary variable, most of the correlations are
statistically significant.
ISSN: 0971-1023 | NMIMS Management ReviewVolume XXXIII January 2017
ISSN: 0971-1023 | NMIMS Management ReviewVolume XXXIII January 2017
Stock Price Response to Earnings News in India:Investors' Learning Behaviour under Uncertainty
Stock Price Response to Earnings News in India:Investors' Learning Behaviour under Uncertainty16 17
cities of India, and therefore street
Contents
mall farmers. Majority of the
farmers (82%) borrow less than
Rs 5 lakhs, and 18% borrow
between Rs 5 – 10 lakhs on a
per annum basis. Most farmers
(65.79%) ar
Table source heading
Table 23: The Results of Mann-Whitney U Test for DOWJONES Index Daily ReturnsDr. Rosy Kalra
Mr. Piyuesh Pandey
References
References

We expect COND to co-vary with the cyclical component of stock index and RCOND to co-vary with index returns.
Figure 1 shows COND and RCOND against the detrended values of the Nifty50 stock index. COND has a
correlation of 0.86 with Nifty 50 index during the sample period (April 2009 to March 2015), while RCOND has a
statistically significant correlation of 0.32 with Nifty 50 returns.
Figure 1. Cycle of Nifty 50 with COND and RCOND indices
To analyse differences in behaviour at extreme and
middle values, we also run the tests using COND and
RCOND as categorical variables with three levels. For
example, we sort all the months in the sample period
by descending magnitude of COND and label the top
one-third of the months as periods with strong market
conditions, the middle one-third as normal market
conditions and the bottom one-third as weak market
conditions. Similarly, the three RCOND categories are
labelled as stronger, same and weaker relative
conditions.
6. Results
6.1 Equity Valuation Effect
In order to analyse the trend in average earnings
response coefficient, we estimate equation (1) cross-
sectionally across earnings announcement during
each month. As most of the announcements are
concentrated in the first two months of each quarter,
we drop the third month in each quarter. After
dropping all the months which have inadequate
number of cross-sectional observations, we have 44
cross-sectional estimates of the ERCs.
The monthly trend in ERCs is then compared with
COND as shown in Figure 2. From the chart, the
month-wise ERCs seem to be significantly correlated
with COND. This is confirmed by estimating the
correlation coefficients. The Pearson correlation
coefficient between monthly ERCs and COND was
0.51, which is highly significant (t stats = 3.82, p < 0.01).
The results are encouraging despite the limited
number of monthly observations, and we confirm the
results with further regressions using pooled sample
which have higher power due to expanded sample
size.
Figure 2.Trend in monthly ERCs with market conditions
We run pooled sample regressions using equations (4)
under alternative conditions, by using the three COND
levels. We further run the regressions using the
continuous variable COND directly in equation (5) as
an interaction term.
Table 4 shows the results using COND both as
continuous and categorical variable. The interaction
terms with COND are statistically significant for both
good and bad news. The ERCs increase as market
conditions improve, being nearly 4 times as high when
market conditions are strong as when they are weak in
the case of both bad and good earnings news. The
differences are also statistically significant in both the
cases.
ISSN: 0971-1023 | NMIMS Management ReviewVolume XXXIII January 2017
ISSN: 0971-1023 | NMIMS Management ReviewVolume XXXIII January 2017
Stock Price Response to Earnings News in India:Investors' Learning Behaviour under Uncertainty
Stock Price Response to Earnings News in India:Investors' Learning Behaviour under Uncertainty18 19
cities of India, and therefore street
Contents
mall farmers. Majority of the
farmers (82%) borrow less than
Rs 5 lakhs, and 18% borrow
between Rs 5 – 10 lakhs on a
per annum basis. Most farmers
(65.79%) ar
Table source heading
Table 23: The Results of Mann-Whitney U Test for DOWJONES Index Daily ReturnsDr. Rosy Kalra
Mr. Piyuesh Pandey
References
References

We also validate the results individually for each of the
four proxy variables of market conditions, by using
each variable in turn in the interaction term in place of
COND. The results, shown in Table 5, confirm the
equity valuation effect, wherein ERCs increase with
indicators of economic growth prospects and decrease
with indicators of systematic risk. We therefore expect
ERCs to rise with higher values of all the indicators
except TB, with which the relationship is inverse.
6.2 Learning Effect
In order to analyse the learning effect, we conduct
regressions testing the relation between stock returns
around announcements with earnings surprises under
changing market conditions. As in the case of valuation
effect, we first conduct monthly cross-sectional
regressions to obtain monthly ERCs. However, this
time we test equation (4) which has separate variables
for good and bad earnings news, because we are
interested in testing for asymmetric effects by sign of
earnings surprise. After dropping the months with
insufficient observations, we are left with 42 data
points. We correlate the coefficients of good and bad
UE with RCOND. The Pearson's correlation coefficient
is 0.30 for bad UE and -0.28 for good UE, both of which
are significant only at p<0.10. The signs of the
coefficients are as hypothesised and we test the
results with a pooled sample across firms and quarters
in order to increase the power of the tests.
We conduct regressions using Equation (4) with
RCOND (continuous variable) in the interaction term
and Equation (5) with RCOND (categorical variable) in
three interaction terms corresponding to relatively
stronger, same and weaker conditions.
The results are provided in Table 6. The results confirm
the predictions of asymmetric behaviour for good
versus bad earnings news. Thus, when relatively
stronger market conditions are followed by bad
earnings news, the effect is significantly greater than
under relatively weaker conditions. However, when
earnings news is good, the difference is not statistically
significant.
We also validate the prediction that the learning effect
would be more apparent for firms that have greater
information uncertainty. We expect firms that are
smaller, which have lower analyst coverage and
greater idiosyncratic return volatility to be associated
with greater information uncertainty.
We also expect the learning effect to be more apparent
in case of firms that announce results early (first
month after the quarter-ending) than those that
announce results later (second or third month after
the quarter-ending), even though we may associate
the former with better timeliness of information
disclosure. This is because in case of late-announcers,
the investors have the chance of revising their
expectations based on the trends in aggregate and
ISSN: 0971-1023 | NMIMS Management ReviewVolume XXXIII January 2017
ISSN: 0971-1023 | NMIMS Management ReviewVolume XXXIII January 2017
Stock Price Response to Earnings News in India:Investors' Learning Behaviour under Uncertainty
Stock Price Response to Earnings News in India:Investors' Learning Behaviour under Uncertainty20 21
cities of India, and therefore street
Contents
mall farmers. Majority of the
farmers (82%) borrow less than
Rs 5 lakhs, and 18% borrow
between Rs 5 – 10 lakhs on a
per annum basis. Most farmers
(65.79%) ar
Table source heading
Table 23: The Results of Mann-Whitney U Test for DOWJONES Index Daily ReturnsDr. Rosy Kalra
Mr. Piyuesh Pandey
References
References
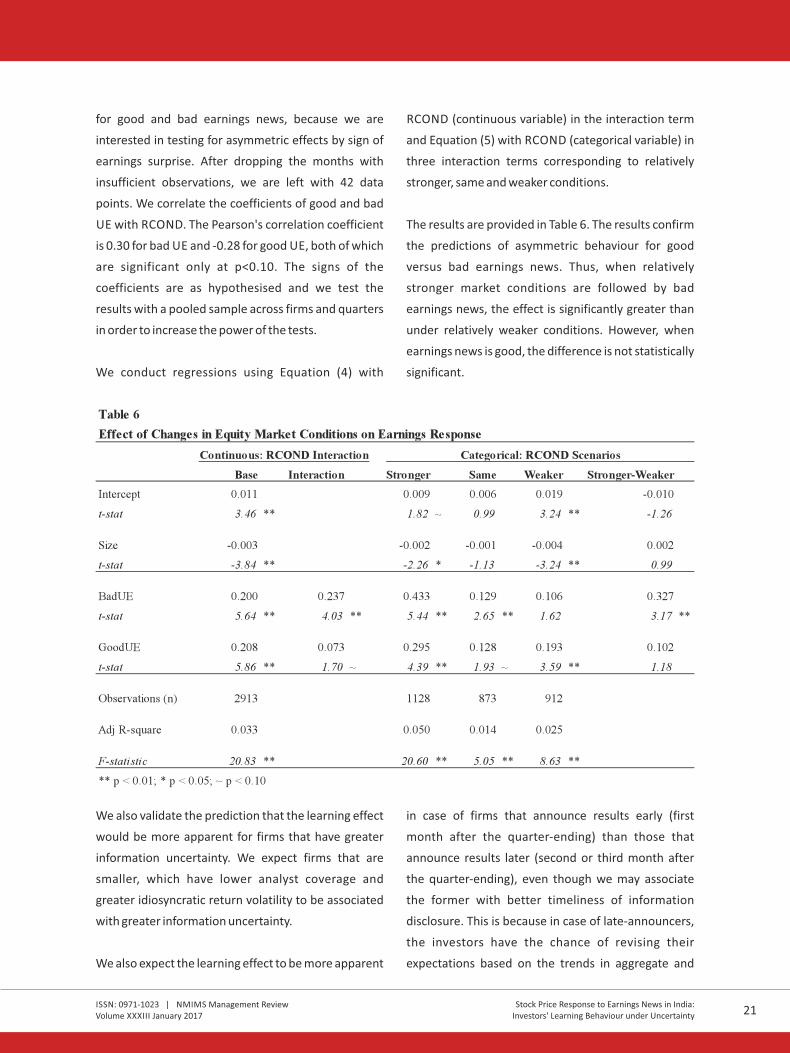
We also validate the results individually for each of the
four proxy variables of market conditions, by using
each variable in turn in the interaction term in place of
COND. The results, shown in Table 5, confirm the
equity valuation effect, wherein ERCs increase with
indicators of economic growth prospects and decrease
with indicators of systematic risk. We therefore expect
ERCs to rise with higher values of all the indicators
except TB, with which the relationship is inverse.
6.2 Learning Effect
In order to analyse the learning effect, we conduct
regressions testing the relation between stock returns
around announcements with earnings surprises under
changing market conditions. As in the case of valuation
effect, we first conduct monthly cross-sectional
regressions to obtain monthly ERCs. However, this
time we test equation (4) which has separate variables
for good and bad earnings news, because we are
interested in testing for asymmetric effects by sign of
earnings surprise. After dropping the months with
insufficient observations, we are left with 42 data
points. We correlate the coefficients of good and bad
UE with RCOND. The Pearson's correlation coefficient
is 0.30 for bad UE and -0.28 for good UE, both of which
are significant only at p<0.10. The signs of the
coefficients are as hypothesised and we test the
results with a pooled sample across firms and quarters
in order to increase the power of the tests.
We conduct regressions using Equation (4) with
RCOND (continuous variable) in the interaction term
and Equation (5) with RCOND (categorical variable) in
three interaction terms corresponding to relatively
stronger, same and weaker conditions.
The results are provided in Table 6. The results confirm
the predictions of asymmetric behaviour for good
versus bad earnings news. Thus, when relatively
stronger market conditions are followed by bad
earnings news, the effect is significantly greater than
under relatively weaker conditions. However, when
earnings news is good, the difference is not statistically
significant.
We also validate the prediction that the learning effect
would be more apparent for firms that have greater
information uncertainty. We expect firms that are
smaller, which have lower analyst coverage and
greater idiosyncratic return volatility to be associated
with greater information uncertainty.
We also expect the learning effect to be more apparent
in case of firms that announce results early (first
month after the quarter-ending) than those that
announce results later (second or third month after
the quarter-ending), even though we may associate
the former with better timeliness of information
disclosure. This is because in case of late-announcers,
the investors have the chance of revising their
expectations based on the trends in aggregate and
ISSN: 0971-1023 | NMIMS Management ReviewVolume XXXIII January 2017
ISSN: 0971-1023 | NMIMS Management ReviewVolume XXXIII January 2017
Stock Price Response to Earnings News in India:Investors' Learning Behaviour under Uncertainty
Stock Price Response to Earnings News in India:Investors' Learning Behaviour under Uncertainty20 21
cities of India, and therefore street
Contents
mall farmers. Majority of the
farmers (82%) borrow less than
Rs 5 lakhs, and 18% borrow
between Rs 5 – 10 lakhs on a
per annum basis. Most farmers
(65.79%) ar
Table source heading
Table 23: The Results of Mann-Whitney U Test for DOWJONES Index Daily ReturnsDr. Rosy Kalra
Mr. Piyuesh Pandey
References
References

sectoral earnings, once these become evident from
the results of the early-announcers. For example,
investors may be surprised by earnings of the first
information technology company which announces its
results. However, if there are common trends across
the earnings of all the information technology
companies, investors would be progressively less
surprised as more information technology companies
announce their results.
The results of observations divided by size, analyst
coverage, idiosyncratic volatility and announcement
timing are presented in Table 7. The results show that
for companies associated with greater information
uncertainty or delay, the effects of surprise are
stronger in the case of both bad and good earnings
news.
The results of the effect of change in each proxy
variable of market conditions are presented in Table 8.
For bad earnings news, the results are significant for
five out of the seven proxies in the case of small cap
stocks (except in the case of TB and TERM). Though,
the results under good earnings news are not
statistically significant in the case of individual proxies
(except in the case of IIP growth), the signs of the
coefficients are always consistent with the learning
effect in the case of small stocks, but not in the case of
large cap stocks.
This can be explained by the greater parametric
uncertainty associated with small cap stocks, whereas
the degree of uncertainty is not high enough in the
case of large cap stocks for the learning effect to
become apparent.
ISSN: 0971-1023 | NMIMS Management ReviewVolume XXXIII January 2017
ISSN: 0971-1023 | NMIMS Management ReviewVolume XXXIII January 2017
Stock Price Response to Earnings News in India:Investors' Learning Behaviour under Uncertainty
Stock Price Response to Earnings News in India:Investors' Learning Behaviour under Uncertainty22 23
cities of India, and therefore street
Contents
mall farmers. Majority of the
farmers (82%) borrow less than
Rs 5 lakhs, and 18% borrow
between Rs 5 – 10 lakhs on a
per annum basis. Most farmers
(65.79%) ar
Table source heading
Table 23: The Results of Mann-Whitney U Test for DOWJONES Index Daily ReturnsDr. Rosy Kalra
Mr. Piyuesh Pandey
References
References
7. Discussion
Our results indicate clear evidence of equity valuation
e f fe c t i n i nv e st o rs ' re s p o n s e t o e a r n i n g s
announcements. The earnings response coefficients
are much higher under strong market conditions than
under weak market conditions due to the double
impact of rising growth prospects and falling discount
rates. These findings are consistent with Collins and
Kothari (1989) and Johnson (1999).
Secondly, we find evidence of delayed learning. ERCs
for stocks associated with negative earnings surprises
are much higher when relative market conditions are
improving than when they are worsening. The
influence of relative conditions is not significant in the
case of stocks with positive earnings surprise. These
findings are consistent with the regime shift model of
Veronesi (1999) and are similar to those of Conrad et
al. (2002).
Our approach and findings however differ from other
empirical research on asymmetric stock price
response to earnings news that is motivated by
behavioural models. For example, Skinner and Sloan
(2002) base their empirical research of investors'
earnings response using the behavioural argument of
naive optimism for growth stocks, as proposed by
Lakonishok, Shleifer and Vishny (1994). They find large
and asymmetric response to negative earnings
surprises, especially in the case of growth stocks. The
results of our paper do not suggest a significant
difference in the coefficients of good and bad
unexpected earnings in general, although we do not
test the results separately for growth and value stocks.
Mian and Sankaraguruswamy (2012) extend the
argument of Baker and Wurgler (2007) that periods of
high sentiment are associated with optimistic
valuations and periods of low sentiment are
associated with pessimistic valuation to earnings
response. They test and establish that the earnings
response coefficients in the case of good news events
are higher when sentiment is high than when
sentiment is low, while the coefficients for bad news
events are higher when sentiment is low than when
sentiment is high. We, however, do not examine the
role of investor sentiment in this research, focussing
instead on the role of rational learning.
A limitation of our research is that while we assume
and test the validity of a simple learning model, we do
not analyse the behavioural foundations of this model.
Behavioural factors would not be relevant if we could
assume that the investor is subject to information
constraints, but behaves rationally given the limited
information. However, since the assumption of limited
information appears restrictive, if not unrealistic,
there is a need to question whether the investor's
selective use of information (only recent economic and
market-wide information in our model) is because of
limited attention (as described in Hirshleifer and Teoh,
2003), or because of recency bias, or some other
behavioural bias. This can be an agenda for future
research.
8. Conclusion
In this paper, we validate the equity valuation effect
and the learning effect for time series variations in the
earnings response coefficients of actively traded
stocks in India. We confirm the predictions of theories
of investor learning under parametric uncertainty. The
time series variation in elasticity of stock returns to
earnings surprises is therefore not only a function of
growth prospects and systematic risks as predicted by
classical finance, but also depends on the learning
behaviour of investors.
ISSN: 0971-1023 | NMIMS Management ReviewVolume XXXIII January 2017
ISSN: 0971-1023 | NMIMS Management ReviewVolume XXXIII January 2017
Stock Price Response to Earnings News in India:Investors' Learning Behaviour under Uncertainty
Stock Price Response to Earnings News in India:Investors' Learning Behaviour under Uncertainty
• Barberis, N., Shleifer, A., & Vishny, R. (1998).A model of investor sentiment. Journal of Financial Economics, 49
(3), 307-343.
• Brav, A., & Heaton, J. B. (2002).Competing theories of financial anomalies. Review of Financial Studies, 15(2),
575-606.
• Chen, N., Roll, R.,& Ross S.A. (1986).Economic forces and the stock market. Journal of Business, pp 383-403.
• Collins, D. W., & Kothari, S.P. (1989).An analysis of intertemporal and cross-sectional determinants of earnings
response coefficients. Journal of Accounting and Economics, 11(2), pp 143-181.
• Conrad, J. S., Cornell, B., & Landsman, W.R. (2002).When is bad news really bad news? The Journal of Finance,
57(6), pp 2507-2532.
• Foster, G. (1977). Quarterly accounting data: Time-series properties and predictive ability results. The
Accounting Review, pp 1-21.
• Hirshleifer, D., & Teoh, S. H. (2003). Limited attention, information disclosure, and financial reporting. Journal
of Accounting and Economics, 36(1), 337-386.
• Johnson, M. F. (1999).Business cycles and the relation between security returns and earnings. Review of
Accounting Studies, 4(2), pp 93-117.
• Lakonishok, J., Shleifer, A., & Vishny, R. W. (1994). Contrarian investment, extrapolation, and risk. The Journal of
Finance, 49(5), 1541-1578.
• Lewellen, J., & Shanken, J. (2002).Learning, asset-pricing tests, and market efficiency. The Journal of Finance,
57(3), 1113-1145.
• Mian, G. M., & Sankaraguruswamy, S. (2012). Investor sentiment and stock market response to earnings news.
The Accounting Review, 87(4), 1357-1384.
• Morck, R., Yeung, B., & Yu, W. (2000). The information content of stock markets: why do emerging markets have
synchronous stock price movements? Journal of Financial Economics, 58(1), 215-260.
• Panda, C. (2008).Do interest rates matter for stock markets? Economic and Political Weekly, Vol. 43, Issue No.
17, 26 Apr, 2008, pp 107-115.
• Pethe, A.,& Karnik, A. (2000). Do Indian stock markets matter? Stock market indices and macro-economic
variables. Economic and Political Weekly, Vol 35, Issue No. 05, 29 Jan, 2000, pp 349-356.
• Shleifer, A., & Vishny, R. W. (1997).The limits of arbitrage. The Journal of Finance, 52(1), 35-55.
• Skinner, D. J., & Sloan, R. G. (2002). Earnings surprises, growth expectations, and stock returns or don't let an
earnings torpedo sink your portfolio. Review of Accounting Studies, 7(2-3), 289-312.
• Veronesi, P. (1999).Stock market overreactions to bad news in good times: Arational expectations equilibrium
model, Review of Financial Studies, 12(5), pp 975-1007.
References
24 25
cities of India, and therefore street
Contents
mall farmers. Majority of the
farmers (82%) borrow less than
Rs 5 lakhs, and 18% borrow
between Rs 5 – 10 lakhs on a
per annum basis. Most farmers
(65.79%) ar
Table source heading
Table 23: The Results of Mann-Whitney U Test for DOWJONES Index Daily ReturnsDr. Rosy Kalra
Mr. Piyuesh Pandey
References
References

Sachin Mathur is a Faculty Member in Finance at the IBS Business School, Mumbai, and a Ph.D. scholar at
the Narsee Monjee Institute of Management Studies, Mumbai. His areas of research include asset pricing,
investment analysis and behavioural finance. He has extensive experience in financial research and credit
ratings. He holds B.Tech. in Chemical Engineering from the Institute of Technology, BHU, Varanasi, M.M.S.
(Finance) from the Narsee Monjee Institute of Management Studies, Mumbai and a CFA charter from the
CFA Institute, US. He can be reached at [email protected]
Anupam Rastogi is a Senior Professor of Finance at the Narsee Munjee Institute of Management Studies,
Mumbai. His area of research includes strategic corporate finance, project finance, infrastructure
development and finance, and emerging market economies. He has published extensively on infrastructure
financing, economic modeling, capital markets and exchange rate mechanisms. He has been a consultant
to the Asian Development Bank and other international firms. He holds B.E. (Hons) in Mechanical
Engineering from the BITS, Pilani, M.Sc. (Economics) from the London School of Economics and Ph.D. from
the University of Liverpool. He can be reached at [email protected]
ISSN: 0971-1023 | NMIMS Management ReviewVolume XXXIII January 2017
ISSN: 0971-1023 | NMIMS Management ReviewVolume XXXIII January 2017
Stock Price Response to Earnings News in India:Investors' Learning Behaviour under Uncertainty
Strategy Performance Evaluation of a PortOrganisation based on Multi-Criteria
Decision Making using Fuzzy Logic Method
M. Ramachandran
Vishal Fegade
P.P. Raichurkar
Abstract
The importance of measurement of strategy
performance has long been acknowledged by
researchers and industrial experts from various
organisations. A better approach would be to focus on
the performance measurement system design rather
than details of specific measures. Measuring the
strategy of an organisation can help in terms of
strategy reformulation while implementation pertains
to better growth of the organisation. This perspective
validates the fundamental approach to organisational
control design involving design effort at various levels
of the organisation. A multi-criteria decision making
analysis using fuzzy logic is an effective tool to measure
the industry performance strategy. This measurement
system includes both financial and non-financial
performance with multi-criteria decision making. This
can help improve the organisational set up of the
industry and provide the ability to change and adopt.
This approach will consider the preferences of port
organisations regarding strategic objectives. The main
aim of this paper is to design a strategy performance
measurement system for port organisations using
MATLAB. The result shows that multi-criteria decision
making analysis using the fuzzy logic system designed
by MATLAB works effectively and the results provided
by the analysis are consistent. This design is the best
tool to help a port organisation evaluate and revise its
strategy and to adopt a modern management
approach. This design can be modified for various
organisat ions depending on their st rategy
performance.
Keywords: fuzzy logic; Multi-Criteria Decision Making;
strategy performance; port organisation; MATLAB
Strategy Performance Evaluation of a Port Organisation based onMulti-Criteria Decision Making using Fuzzy Logic Method26 27
cities of India, and therefore street
Contents
mall farmers. Majority of the
farmers (82%) borrow less than
Rs 5 lakhs, and 18% borrow
between Rs 5 – 10 lakhs on a
per annum basis. Most farmers
(65.79%) ar
Table source heading
Table 23: The Results of Mann-Whitney U Test for DOWJONES Index Daily ReturnsDr. Rosy Kalra
Mr. Piyuesh Pandey
References
References
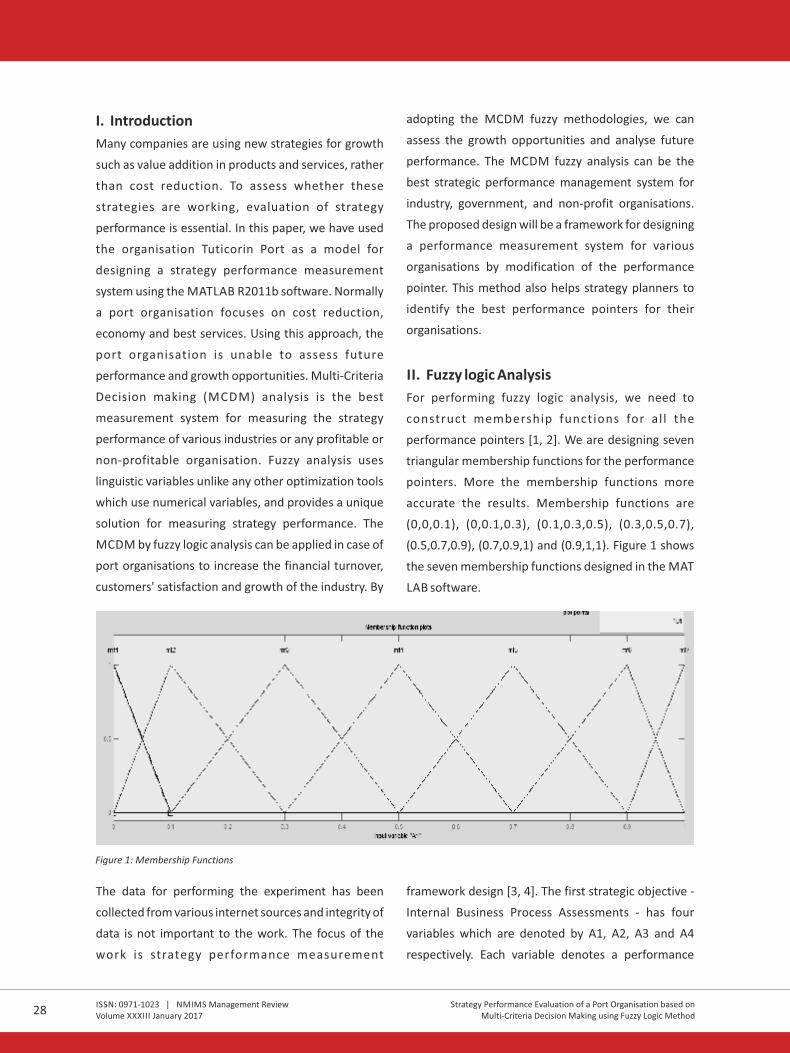
ISSN: 0971-1023 | NMIMS Management ReviewVolume XXXIII January 2017
ISSN: 0971-1023 | NMIMS Management ReviewVolume XXXIII January 2017
Strategy Performance Evaluation of a Port Organisation based onMulti-Criteria Decision Making using Fuzzy Logic Method
Strategy Performance Evaluation of a Port Organisation based onMulti-Criteria Decision Making using Fuzzy Logic Method
I. Introduction
Many companies are using new strategies for growth
such as value addition in products and services, rather
than cost reduction. To assess whether these
strategies are working, evaluation of strategy
performance is essential. In this paper, we have used
the organisation Tuticorin Port as a model for
designing a strategy performance measurement
system using the MATLAB R2011b software. Normally
a port organisation focuses on cost reduction,
economy and best services. Using this approach, the
port organisation is unable to assess future
performance and growth opportunities. Multi-Criteria
Decision making (MCDM) analysis is the best
measurement system for measuring the strategy
performance of various industries or any profitable or
non-profitable organisation. Fuzzy analysis uses
linguistic variables unlike any other optimization tools
which use numerical variables, and provides a unique
solution for measuring strategy performance. The
MCDM by fuzzy logic analysis can be applied in case of
port organisations to increase the financial turnover,
customers' satisfaction and growth of the industry. By
adopting the MCDM fuzzy methodologies, we can
assess the growth opportunities and analyse future
performance. The MCDM fuzzy analysis can be the
best strategic performance management system for
industry, government, and non-profit organisations.
The proposed design will be a framework for designing
a performance measurement system for various
organisations by modification of the performance
pointer. This method also helps strategy planners to
identify the best performance pointers for their
organisations.
II. Fuzzy logic Analysis
For performing fuzzy logic analysis, we need to
construct membership functions for al l the
performance pointers [1, 2]. We are designing seven
triangular membership functions for the performance
pointers. More the membership functions more
accurate the results. Membership functions are
(0,0,0.1), (0,0.1,0.3), (0.1,0.3,0.5), (0.3,0.5,0.7),
(0.5,0.7,0.9), (0.7,0.9,1) and (0.9,1,1). Figure 1 shows
the seven membership functions designed in the MAT
LAB software.
Figure 1: Membership Functions
III. Strategic objectives and constraints
The Multi-Criteria Decision Making analysis suggests
that we can assess an organisation from four strategic
objectives -Learning & Growth assessments, Internal
Business assessments, Customer assessments and
Financial assessments [9]. For each strategic objective,
four main performance pointers are developed using
decision makers [10]. In this measurement system,
decision makers play a vital role to assess the
organisation's efficiency. The strategic objectives for
the analysis are developed for Tuticorin port
organisation based on the organisation's strategy.
Tuticorin port organisation has focus on its long term
financial viability. Since Tuticorin Port organisation is a
public sector organisation, profitability and short term
financial results are not a major concern for the
organisation [11,12]. By keeping in focus the
organisation's long term financial viability, we
chooseoperating revenues to assets ratio, current
ratio, inventory turnover and operating expense to
revenue ratio as financial assessment performance
pointers. Tuticorin Port organisation's main role is
The data for performing the experiment has been
collected from various internet sources and integrity of
data is not important to the work. The focus of the
work is strategy performance measurement
framework design [3, 4]. The first strategic objective -
Internal Business Process Assessments - has four
variables which are denoted by A1, A2, A3 and A4
respectively. Each variable denotes a performance
pointer of Internal Business Process Assessments. All
the performance pointer values of Internal Business
Process Assessments are calculated in percentage
values. Similarly performance pointers of financial
assessment are denoted by B1, B2, B3 and B4
respectively. All the performance pointer values of
financial assessment are calculated in ratios. The
performance pointers of customer assessment are
denoted by C1, C2, C3 and C4 respectively. C1 and C3
performance pointer values of financial assessment
are calculated in percentages and C2 and C4
performance pointer values of financial assessment
are calculated in time. The performance pointers of
learning and growth assessment are denoted by D1,
D2, D3 and D4 respectively. All the performance
pointer values of learning and growth assessment are
calculated in percentage values. For standardizing all
the values of the performance pointer, we are
providing the fuzzy numbers (0.3, 0.5, 0.7, and 0.9).
The lowest values over four years carries 0.3 and the
highest value over four years carries 0.9 and 0.5 and
0.7 fuzzy numbers given to the second and third
highest respectively [5,6]. The value shows that all the
variables follow random distribution making it very
difficult to understand the overall improvement of the
Internal Business Process Assessments. Table 1, 2, 3
and 4 show the values of all performance pointers of
strategic objectives and their fuzzy numbers. The
Multi-criteria Decision making fuzzy Analysis is
designed in the MATLAB software. The membership
functions are designed in the software for all
performance pointers of strategic objectives. A
simulated model is designed in the MATLAB software
with the entire variable to verify the analysis. Figure 2
shows the simulated model of performance
measurement system design. The simulated model
consists of four components - variable input, mux with
four in and one out, fuzzy logic rule solver and display
screen. The variable input components are used to
provide the variable data to the model. The mux with
four in and one out are used to combine the input and
provided to the fuzzy logic rule solver. The fuzzy logic
rule solver is used to analyze the input parameter and
provide the fuzzy score [7, 8]. The fuzzy logic rule
solver has 238 rules framed as per the decision maker's
decision to analyze the input data. The screen is used
to show the final fuzzy score of the analysis. All the
variable inputs have inputs from 0 to 1. In the
simulated model, the four fuzzy logic rule solvers
namely IBPA, FA, CA and LGA are taken for four
strategic objectives - Internal Business assessments,
Financial assessments, Customer assessments and
Learning & Growth assessments respectively. Each
fuzzy logic rule solver gets input from the Mux with
four in and one out, which is further connected to four
input variables. The fuzzy optimization fuzzy logic rule
solver takes input from four strategic objectives
through Mux and the output is connected to the
display.
28 29
cities of India, and therefore street
Contents
mall farmers. Majority of the
farmers (82%) borrow less than
Rs 5 lakhs, and 18% borrow
between Rs 5 – 10 lakhs on a
per annum basis. Most farmers
(65.79%) ar
Table source heading
Table 23: The Results of Mann-Whitney U Test for DOWJONES Index Daily ReturnsDr. Rosy Kalra
Mr. Piyuesh Pandey
References
References
ISSN: 0971-1023 | NMIMS Management ReviewVolume XXXIII January 2017
ISSN: 0971-1023 | NMIMS Management ReviewVolume XXXIII January 2017
Strategy Performance Evaluation of a Port Organisation based onMulti-Criteria Decision Making using Fuzzy Logic Method
Strategy Performance Evaluation of a Port Organisation based onMulti-Criteria Decision Making using Fuzzy Logic Method
I. Introduction
Many companies are using new strategies for growth
such as value addition in products and services, rather
than cost reduction. To assess whether these
strategies are working, evaluation of strategy
performance is essential. In this paper, we have used
the organisation Tuticorin Port as a model for
designing a strategy performance measurement
system using the MATLAB R2011b software. Normally
a port organisation focuses on cost reduction,
economy and best services. Using this approach, the
port organisation is unable to assess future
performance and growth opportunities. Multi-Criteria
Decision making (MCDM) analysis is the best
measurement system for measuring the strategy
performance of various industries or any profitable or
non-profitable organisation. Fuzzy analysis uses
linguistic variables unlike any other optimization tools
which use numerical variables, and provides a unique
solution for measuring strategy performance. The
MCDM by fuzzy logic analysis can be applied in case of
port organisations to increase the financial turnover,
customers' satisfaction and growth of the industry. By
adopting the MCDM fuzzy methodologies, we can
assess the growth opportunities and analyse future
performance. The MCDM fuzzy analysis can be the
best strategic performance management system for
industry, government, and non-profit organisations.
The proposed design will be a framework for designing
a performance measurement system for various
organisations by modification of the performance
pointer. This method also helps strategy planners to
identify the best performance pointers for their
organisations.
II. Fuzzy logic Analysis
For performing fuzzy logic analysis, we need to
construct membership functions for al l the
performance pointers [1, 2]. We are designing seven
triangular membership functions for the performance
pointers. More the membership functions more
accurate the results. Membership functions are
(0,0,0.1), (0,0.1,0.3), (0.1,0.3,0.5), (0.3,0.5,0.7),
(0.5,0.7,0.9), (0.7,0.9,1) and (0.9,1,1). Figure 1 shows
the seven membership functions designed in the MAT
LAB software.
Figure 1: Membership Functions
III. Strategic objectives and constraints
The Multi-Criteria Decision Making analysis suggests
that we can assess an organisation from four strategic
objectives -Learning & Growth assessments, Internal
Business assessments, Customer assessments and
Financial assessments [9]. For each strategic objective,
four main performance pointers are developed using
decision makers [10]. In this measurement system,
decision makers play a vital role to assess the
organisation's efficiency. The strategic objectives for
the analysis are developed for Tuticorin port
organisation based on the organisation's strategy.
Tuticorin port organisation has focus on its long term
financial viability. Since Tuticorin Port organisation is a
public sector organisation, profitability and short term
financial results are not a major concern for the
organisation [11,12]. By keeping in focus the
organisation's long term financial viability, we
chooseoperating revenues to assets ratio, current
ratio, inventory turnover and operating expense to
revenue ratio as financial assessment performance
pointers. Tuticorin Port organisation's main role is
The data for performing the experiment has been
collected from various internet sources and integrity of
data is not important to the work. The focus of the
work is strategy performance measurement
framework design [3, 4]. The first strategic objective -
Internal Business Process Assessments - has four
variables which are denoted by A1, A2, A3 and A4
respectively. Each variable denotes a performance
pointer of Internal Business Process Assessments. All
the performance pointer values of Internal Business
Process Assessments are calculated in percentage
values. Similarly performance pointers of financial
assessment are denoted by B1, B2, B3 and B4
respectively. All the performance pointer values of
financial assessment are calculated in ratios. The
performance pointers of customer assessment are
denoted by C1, C2, C3 and C4 respectively. C1 and C3
performance pointer values of financial assessment
are calculated in percentages and C2 and C4
performance pointer values of financial assessment
are calculated in time. The performance pointers of
learning and growth assessment are denoted by D1,
D2, D3 and D4 respectively. All the performance
pointer values of learning and growth assessment are
calculated in percentage values. For standardizing all
the values of the performance pointer, we are
providing the fuzzy numbers (0.3, 0.5, 0.7, and 0.9).
The lowest values over four years carries 0.3 and the
highest value over four years carries 0.9 and 0.5 and
0.7 fuzzy numbers given to the second and third
highest respectively [5,6]. The value shows that all the
variables follow random distribution making it very
difficult to understand the overall improvement of the
Internal Business Process Assessments. Table 1, 2, 3
and 4 show the values of all performance pointers of
strategic objectives and their fuzzy numbers. The
Multi-criteria Decision making fuzzy Analysis is
designed in the MATLAB software. The membership
functions are designed in the software for all
performance pointers of strategic objectives. A
simulated model is designed in the MATLAB software
with the entire variable to verify the analysis. Figure 2
shows the simulated model of performance
measurement system design. The simulated model
consists of four components - variable input, mux with
four in and one out, fuzzy logic rule solver and display
screen. The variable input components are used to
provide the variable data to the model. The mux with
four in and one out are used to combine the input and
provided to the fuzzy logic rule solver. The fuzzy logic
rule solver is used to analyze the input parameter and
provide the fuzzy score [7, 8]. The fuzzy logic rule
solver has 238 rules framed as per the decision maker's
decision to analyze the input data. The screen is used
to show the final fuzzy score of the analysis. All the
variable inputs have inputs from 0 to 1. In the
simulated model, the four fuzzy logic rule solvers
namely IBPA, FA, CA and LGA are taken for four
strategic objectives - Internal Business assessments,
Financial assessments, Customer assessments and
Learning & Growth assessments respectively. Each
fuzzy logic rule solver gets input from the Mux with
four in and one out, which is further connected to four
input variables. The fuzzy optimization fuzzy logic rule
solver takes input from four strategic objectives
through Mux and the output is connected to the
display.
28 29
cities of India, and therefore street
Contents
mall farmers. Majority of the
farmers (82%) borrow less than
Rs 5 lakhs, and 18% borrow
between Rs 5 – 10 lakhs on a
per annum basis. Most farmers
(65.79%) ar
Table source heading
Table 23: The Results of Mann-Whitney U Test for DOWJONES Index Daily ReturnsDr. Rosy Kalra
Mr. Piyuesh Pandey
References
References

being a service provider for ship trading;customer
assessments are a greater focus on the strategic
objectives. In this context, the ship satisfaction index,
average anchorage time, percentages of cargo
operation and average time of cargo operation are
taken as performance pointers for customer
assessments. For providing better quality services and
smooth running of the organisation, internal business
process should be well monitored; this is one of the
strategic objectives of service sector organisations. By
focusing on the objective, we have choosen employee
satisfaction index, employee retention index,
employee absenteeism index andberth occupied ratio
as the performance pointers for internal business
process assessment. Last but not the least, growth of
the organisation is one of its important strategic
objectives. The growth of the organisation directly
depends on the workers' ability and utilisation of new
technology. By focusing on the above objective, we
have choosen a budget allotted for new technology,
resource allocation for information technology,
workers who have attended training sessions and
conferences as performance pointers for learning and
growth assessment. In our work, we measured the
performance pointers on a yearly basis from 2012 to
2015.
Figure 2: Simulated Model of Performance Measurement System
IV. Case Study- Tuticorin Port Trust
Tuticorin Port is one of the 12 major ports in India. It
was declared to be a major port on 11 July 1974. It is
the second-largest port in Tamil Nadu and the fourth-
largest container terminal in India. It is an artificial port
and the third international port in Tamil Nadu; it's the
second all-weather port [13, 14]. Tuticorin Port's traffic
handling has crossed 10 million tons and is growing at
the rate of 12.08 per cent. The inner harbour consists
of 14 berths including 2 container and 3 coal and oil
jetties [15].
Table 1: Internal Business Process Assessments
Performance pointer 2012 2013 2014 2015
Value
Fuzzy no
Value
Fuzzy no
Value
Fuzzy no
Value Fuzzy no
A1
Employee satisfaction index
65%
0.5
71%
0.9
70%
0.7
71% 0.9
A2
Employee absenteeism index
3%
0.7
4%
0.5
3%
0.7
7% 0.3
A3
Surplus inventory
5%
0.3
3%
0.7
4%
0.5
3% 0.7
A4 Berth occupied ratio 84% 0.9 80% 0.3 82% 0.5 83% 0.7
Table 2: Financial Assessments
Performance pointer 2012 2013 2014 2015
Value
Fuzzy no
Value
Fuzzy no
Value
Fuzzy no Value Fuzzy no
B1
Operating revenues to assets ratio
0.62
0.3
0.63
0.5
0.65
0.9 0.64 0.7
B2
Current ratio
0.69
0.7
0.68
0.5
0.66
0.3 0.64 0.9
B3
Inventory turnover
20.
0.9
19.8
0.7
18.8
0.3 19.5 0.5
B4 Operating expense to revenue ratio 0.256 0.7 0.24 0.3 0.251 0.5 0.253 0.9
Table 3: Customer Assessments
Performance pointer 2012 2013 2014 2015
Value Fuzzy no Value Fuzzy no Value Fuzzy no Value Fuzzy no
C1
Ship satisfaction index
55%
0.5
59%
0.7
60%
0.7
65% 0.9
C2
Average anchorage time
2hrs
0.5
2hrs
0.5
1hr
0.9
1.5 hr 0.7
C3
Percentages of cargo
operation
5%
0.5
6%
0.7
8%
0.9
8% 0.9
C4
Average time of cargo
operation
4day
0.5
5day
0.7
6day
0.9
5day 0.7
Table 4: Learning and Growth Assessments
Performance pointer 2012 2013 2014 2015
Value
Fuzzy no
Value
Fuzzy no
Value
Fuzzy no
Value Fuzzy no
D1
Budget allotted for new
technology in %
25%
0.5
25%
0.5
35%
0.9
30% 0.7
D2
Resource allocation for
information technology in %
15%
0.7
20%
0.9
12%
0.3
14% 0.5
D3
Workers trained in %
35%
0.7
40%
0.9
32%
0.3
33% 0.5
D4
Workers who have a ttended
conferences in %
72%
0.3
84%
0.7
85%
0.7
87% 0.9
ISSN: 0971-1023 | NMIMS Management ReviewVolume XXXIII January 2017
ISSN: 0971-1023 | NMIMS Management ReviewVolume XXXIII January 2017
Strategy Performance Evaluation of a Port Organisation based onMulti-Criteria Decision Making using Fuzzy Logic Method
Strategy Performance Evaluation of a Port Organisation based onMulti-Criteria Decision Making using Fuzzy Logic Method30 31
cities of India, and therefore street
Contents
mall farmers. Majority of the
farmers (82%) borrow less than
Rs 5 lakhs, and 18% borrow
between Rs 5 – 10 lakhs on a
per annum basis. Most farmers
(65.79%) ar
Table source heading
Table 23: The Results of Mann-Whitney U Test for DOWJONES Index Daily ReturnsDr. Rosy Kalra
Mr. Piyuesh Pandey
References
References

Table 5: Final Fuzzy Score
S.No Year Fuzzy score
1
2012
0.5000
2
2013
0.8320
3
2014
0.8333
4 2015 0.8329
The values of performance pointers of all the strategic
objectives are entered in the variable input for the
particular year and the final fuzzy score is taken from
the display screen [16, 17]. Similarly for all years, final
fuzzy scores' value scores are taken. Table 5 shows the
final fuzzy score values for all the years under
assessment from 2012 to 2015. The result shows that
the strategic performance of the organisation has
significantly improved from 2012 to 2014. There is very
high improvement from 2012 to 2013; this is because
of the organisation focussing on infrastructure
development. However, in 2015, there is a slight
reduction in the organisation's performance.
V. Conclusions
The proposed strategy performance measurement
system using Multi-criteria Decision making fuzzy logic
analysisdesign takes into account distinguished
characteristicssuch as less competition, social
character of organisations, more focus on fulfilling its
mission, and to achieve longterm finanicial results,
which is the main strategic objective of the public
sector. The proposed methodologyis applied in the
current work for a port organisation, mainly because
the Tuticorin Port Trust has no earlier experience
withstrategic performance management tools. Based
on presented data, there is significant improvement in
Tuticorin Port's strategy performance from 2012 to
2013even though it isslightly lower in the last year,
2015. This proposed strategy performance
measurement system can be used for any profitable
and non-profitable organisations like schools, colleges,
universities and hospitals with slight modifications in
the rules and performance pointers. However, the
proposed design mainly depends on the decision
makers' opinion about the analysis; this can be
overcome by having more decision makers.
References
• Pulkit Purohit, M. Ramachandran, Selection of Flywheel Material using Multicriteria Decision Making Fuzzy
Topsis, Indian Journal of Science and Technology 2015; 8(33): 1-5.
• Salkind, A. J., Fennie, C., Singh, P., Atwater, T., & Reisner, D. E. (1999). Determination of state-of-charge and
state-of-health of batteries by fuzzy logic methodology. Journal of Power Sources, 80(1), 293-300.
• R. Kaplan, R., D. Norton, D. The Balanced Scorecard: measures that drive performance, Harvard Business
Review, pp.71 – 79, 1992.
• Wu, Shwu-Ing, and Jr-Ming Hung. "The performance measurement of cause-related marketing by balance
scorecard." Total Quality Management & Business Excellence 18, no. 7 (2007): 771-791.
• Kumar S, Ramachandran M. A novel approach for the vendor selection in the refrigeration industry.
International Journal of Applied Engineering Research 2015; 10(11):10119–22.
• Okumus, Fevzi. "A framework to implement strategies in organizations." Management Decision 41, no. 9
(2003): 871-882.
• Jain M, Ramachandran M. Buy/Make decision making framework for pump product development with multi
criteria decision making. International Journal of Applied Engineering Research 2015; 10(11):10486–9.
• Huang, Hao-Chen. "Designing a knowledge-based system for strategic planning: A balanced scorecard
perspective." Expert Systems with Applications36, no. 1 (2009): 209-218.
• Gautreau, Andrew, and Brian H. Kleiner. "Recent trends in performance measurement systems-the balanced
scorecard approach." Management Research News 24, no. 3/4 (2001): 153-156.
• Patil Chetan Vitthal, Chaudhary Saurabh Sanjay, Bhavna R Sharma, M. Ramachandran, Need of Biomedical
Waste Management in Rural Hospitals in India. Int. J. Pharm. Sci. Rev. Res. 2015; 35(1): 175-179.
• Haralambides, h.e., and r. Behrens. “Port restructuring in a global economy: an Indian perspective.”
International Journal of Transport Economics / Rivista Internazionale Di Economia Dei Trasporti, vol. 27, no. 1,
2000, pp. 19–39.
• Sheth, A., Sanyal, S., Jaiswal, A., & Gandhi, P. (2006). Effects of the December 2004 Indian Ocean tsunami on
the Indian mainland. Earthquake spectra, 22(S3), 435-473.
• Nagarajan, B., Suresh, I., Sundar, D., Sharma, R., Lal, A. K., Neetu, S., & Shankar, D. (2006). The Great Tsunami of
26 December 2004: A description based on tide-gauge data from the Indian subcontinent and surrounding
areas. Earth, planets and space, 58(2), 211-215.
• Natesan, M., Venkatachari, G., & Palaniswamy, N. (2005). Corrosivity and durability maps of India. Corrosion
Prevention and Control, 52(2), 43-55.
• Thomas, B. J. (1995). Manpower and employment issues. Maritime Policy and Management, 22(3), 239-253.
• Carlucci, Daniela, Bernard Marr, and Gianni Schiuma. "The knowledge value chain: how intellectual capital
impacts on business performance." International Journal of Technology Management 27, no. 6-7 (2004): 575-
590.
• Lodha S, Ramachandran M. Need of multi criteria decision making in vendor selection for the automobile
industry. International Journal of Applied Engineering Research 2015; 10 (11):10301–4.
ISSN: 0971-1023 | NMIMS Management ReviewVolume XXXIII January 2017
ISSN: 0971-1023 | NMIMS Management ReviewVolume XXXIII January 2017
Strategy Performance Evaluation of a Port Organisation based onMulti-Criteria Decision Making using Fuzzy Logic Method
Strategy Performance Evaluation of a Port Organisation based onMulti-Criteria Decision Making using Fuzzy Logic Method32 33
cities of India, and therefore street
Contents
mall farmers. Majority of the
farmers (82%) borrow less than
Rs 5 lakhs, and 18% borrow
between Rs 5 – 10 lakhs on a
per annum basis. Most farmers
(65.79%) ar
Table source heading
Table 23: The Results of Mann-Whitney U Test for DOWJONES Index Daily ReturnsDr. Rosy Kalra
Mr. Piyuesh Pandey
References
References

M. Ramachandran is an Assistant Professor at Mukesh Patel School of Technology Management and
Engineering, NMIMS, Shirpur Campus. He has published more than 50 research papers and articles in
reputed national and international publications. He is pursuing his doctorate from Nirma University,
Ahmedabad. He is the Executive Editor for International Journal on the Textile Engineering and Processes
which is Published by NMIMS. He is a recipient of the Sentinels of Science Award. He is also a reviewer for
various journals like Indian Journal of Engineering & Materials Sciences (NISCAIR Journal), Society of
Automotive Engineers and Cogent OA (Taylor & Francis Journal). He is a life member at prestigious bodies
such as IEI, ISTE and MRSI. He can be reached at [email protected]
Vishal Fegade is an Associate Professor at Mukesh Patel School of Technology Management and
Engineering, NMIMS, Shirpur Campus. He has published a number of research papers and articles in
international and national publications. He is pursuing his doctorate from R.T.M Nagpur University. He is
a recipient of the Best Faculty Award from NMIMS. He is the Executive Editor for REST Journal on
Emerging trends in Modelling and Manufacturing. He can be reached at [email protected]
P.P. Raichurkar, Ph.D., is the Associate Dean of Centre for Textile Functions at Mukesh Patel School of
Technology Management and Engineering, NMIMS, Shirpur Campus. He has published 60 research
papers and articles in international and national publications. He has a judicious blend of industrial and
academic experience spanning over 32 years. He is the Editor In Chief for the International Journal on
Textile Engineering and Processes, which is published by NMIMS. He is Technical Expert for ITTAMA,
ITME India and TMMA Association. He is a life member of bodies like ISTE, JTA and MRSI. He can be
reached at [email protected]
Emotional intelligence - the moderator ofleadership styles and performance
Dhruv Desai
Manjari Srivastava
Abstract
By applying emotional intelligence (EI), a manager can
make a positive impact on the performance of the
organization. The leader or manager should
understand EI and the need of the employees. The
objective of the study is to predict whether the
leadership style and emotional intelligence assists in
predicting the performance of an organization.
Quantitative methodology was applied in the study.
Primary data was collected through an online survey
among 222 branch managers working in a large
banking and financial sector company. Data collected
was analysed through the application of statistical
techniques l ike exploratory factor analysis,
confirmatory factor analysis and structural equation
modelling. Results of the study show that attributes
such as passive defensive leadership style negatively
impact the organization's performance and attributes
of emotional intelligence positively moderate the
relationship between leadership style and the
organization's performance.
Keywords: Leadership style, Emotional Intelligence,
Performance
ISSN: 0971-1023 | NMIMS Management ReviewVolume XXXIII January 2017
ISSN: 0971-1023 | NMIMS Management ReviewVolume XXXIII January 2017
Strategy Performance Evaluation of a Port Organisation based onMulti-Criteria Decision Making using Fuzzy Logic Method
Emotional intelligence - the moderator of leadership styles and performance34 35
cities of India, and therefore street
Contents
mall farmers. Majority of the
farmers (82%) borrow less than
Rs 5 lakhs, and 18% borrow
between Rs 5 – 10 lakhs on a
per annum basis. Most farmers
(65.79%) ar
Table source heading
Table 23: The Results of Mann-Whitney U Test for DOWJONES Index Daily ReturnsDr. Rosy Kalra
Mr. Piyuesh Pandey
References
References

ISSN: 0971-1023 | NMIMS Management ReviewVolume XXXIII January 2017
ISSN: 0971-1023 | NMIMS Management ReviewVolume XXXIII January 2017
Emotional intelligence - the moderator of leadership styles and performance Emotional intelligence - the moderator of leadership styles and performance
Introduction
The present-world organizations have unanimously
recognized and appreciated the undefeatable
importance of the ability and performance of their
human resources, as an addition to essential
technology and tools, for the overall progress of the
entities (Butler & Chinowsky, 2006).
Leadership has been recognised in the distant past as
playing an important role in human development and
bringing about major changes throughout an
organization and its membership, which significantly
focused on pushing an organization towards its
common goals and objectives (Slack, 1997). The crucial
position occupied by leaders in organizations has
resulted in the adoption of various styles of leadership
in the organization, such as democratic, people or
relationship-centred approach, or autocratic,
production-centred method, etc. for achieving
organizational effectiveness (Cheong, 2008; Chiang &
Wang, 2012; Clark, Hartline, & Jones, 2009).
The positive association between Emotional
Intelligence and leadership, and its further impact on
the organizational culture, is claimed to eventually
result in enhancement of capability of the organization
to change. This is asserted to have positive
improvement prospects for the organization in terms
o f i t s c o m p e t i t i v e n e s s a n d p e r f o r m a n c e
(organizational / financial) (Sin and Yazdanifard, 2013).
Thus, l iterature has rigorously reviewed the
relationship between such organizational factors,
which has significantly meant that there is a strong
correlation between the leadership style and the
associated efficiency attained in mobilization,
allocation, and utilization of the resources (Saasongu,
2015), which ultimately enhances the organizational
performance.
Furthermore, there is a role of emotional intelligence,
where a leader should manage his or her emotion and
that of others. As a result, it would assist the leader in
developing a relationship with employees and
subordinates, which in turn, will make an impact on
organizational performance (Ovans, 2015).
Why this study?
In the present competitive corporate world,
organizations must endeavour to manage their
resources. The concept of human capital as a factor in
an organization's financial performance has recently
become an area of interest in research. Human capital
has been defined as the knowledge and proficiency
employees acquire over time with an organization;
researchers have highlighted the importance of the
component of people in the firm's reputation and
performance (Abbott & Banerji, 2003; (Abbott, 2003;
Bontis & Fitz-enz, 2002).
The study serves as a valuable source of knowledge
about the interplay between the most important and
influential variables related to the daily functioning of
the firm, involving leaders and employees. It can
provide insights for the managers, leaders, or any
person in the firm who is in charge of a team of
employees, to take rational decisions and adopt
behaviour which is in favour of the organization's
performance. Also, according to Eeden, Cilliers, and
Deventer (2008), understanding the framework of
leadership and the cultural impact of the various kinds
of leadership in the organization, is of utmost
importance in the present competitive world. Such a
study is specifically a good source of encouragement
for public organizations where employee engagement
and commitment is general ly seen to be a
questionable area.
The pool of research conducted so far, seems to focus
on the inter-relationship between two variables and
their impact on a third variable. For instance,
researchers such as Igbinovia and Popoola (2016) who
studied the organizational culture and emotional
intelligence as predictors of job performance among
the library personnel in Nigeria, and research by
Akhtar et al. (2015) which involved a study of the
impact of organizational culture and emotional
intelligence on educational sector performance in
Pakistan, etc. involved a study of one or two variables
and their impact on the job culture or performance. A
latest study by Chatterjee and Kulakli (2015) argues
that leadership theory and empirical findings fail to
adequately substantiate how leaders' emotions
influence their effectiveness. They argue that even
though there exists a considerable body of research as
regards leadership and leadership styles, literature is
rather scarce as regards the relationship between
leadership style and emotional intelligence.
Given the significance of leadership style and
emotional intelligence, this study aims to offer a more
comprehensive view of the organizational scenario. It
provides an overview of the inter-relationships
between three variables; leadership styles, emotional
intelligence, and financial performance of an
organization.
The research concern is to understand the relationship
between various styles of leadership, the emotional
intelligence of managers and the precise manner in
which these factors influence the performance of an
organisation. Therefore, the following research
questions were raised:
1. Do the leaders' styles of management impact the
financial performance of an organization?
2. Given the leadership style, does emotional
intelligence of leaders enhance the organization's
performance?
Literature Review
Organizational Performance
Also referred to as organizational success or
organizational effectiveness, organizational
performance is central to what capitalistic for-profit
companies global ly pursue. "Organizational
performance is the outcome of the organizational
context, interaction of strategy, and individual
behavior" (Myers, 1996, p. 2). From a social
perspective, when people collaborate to execute a
strategy at work, organizational performance is
achieved. Organizations define valuable actions as the
ones used to achieve their goal of making money that
is sought by them.
In general, organizational performance has found its
definition among financial terms. For example, it can
be the much-desired profits that are the excess
revenue on the balance sheet after deduction of
expenses. Successful financial performance is a
concern for both researchers and organizational
leaders, including boards of directors, chief executive
officers, and financial managers of organizations,
regardless of industry. For instance, economists and
operating managers alike continually assess the
variables impacting profitability (e.g., Gumbus,
Bellhouse & Lyons, 2003; Yavas & ShemwelL, 2001). As
McGahan & Porter (2002) succinctly noted,
"Researchers in the economics and strategy fields have
long been interested in understanding the
determinants of firm profitability" (p. 834).
Literature highlights that successful financial
performance is a concern for both researchers and
organizational leaders, including boards of directors,
chief executive officers, and financial managers of
organizations, regardless of industry. In the present
study, the financial performance of the organization
was considered as an important dependent variable.
The organizational performance was construed in
terms of revenue, productivity and operating margin.
Revenue is understood as the value received in
exchange of goods or services. It is a key component
for calculating profit margin.
36 37
cities of India, and therefore street
Contents
mall farmers. Majority of the
farmers (82%) borrow less than
Rs 5 lakhs, and 18% borrow
between Rs 5 – 10 lakhs on a
per annum basis. Most farmers
(65.79%) ar
Table source heading
Table 23: The Results of Mann-Whitney U Test for DOWJONES Index Daily ReturnsDr. Rosy Kalra
Mr. Piyuesh Pandey
References
References
ISSN: 0971-1023 | NMIMS Management ReviewVolume XXXIII January 2017
ISSN: 0971-1023 | NMIMS Management ReviewVolume XXXIII January 2017
Emotional intelligence - the moderator of leadership styles and performance Emotional intelligence - the moderator of leadership styles and performance
Introduction
The present-world organizations have unanimously
recognized and appreciated the undefeatable
importance of the ability and performance of their
human resources, as an addition to essential
technology and tools, for the overall progress of the
entities (Butler & Chinowsky, 2006).
Leadership has been recognised in the distant past as
playing an important role in human development and
bringing about major changes throughout an
organization and its membership, which significantly
focused on pushing an organization towards its
common goals and objectives (Slack, 1997). The crucial
position occupied by leaders in organizations has
resulted in the adoption of various styles of leadership
in the organization, such as democratic, people or
relationship-centred approach, or autocratic,
production-centred method, etc. for achieving
organizational effectiveness (Cheong, 2008; Chiang &
Wang, 2012; Clark, Hartline, & Jones, 2009).
The positive association between Emotional
Intelligence and leadership, and its further impact on
the organizational culture, is claimed to eventually
result in enhancement of capability of the organization
to change. This is asserted to have positive
improvement prospects for the organization in terms
o f i t s c o m p e t i t i v e n e s s a n d p e r f o r m a n c e
(organizational / financial) (Sin and Yazdanifard, 2013).
Thus, l iterature has rigorously reviewed the
relationship between such organizational factors,
which has significantly meant that there is a strong
correlation between the leadership style and the
associated efficiency attained in mobilization,
allocation, and utilization of the resources (Saasongu,
2015), which ultimately enhances the organizational
performance.
Furthermore, there is a role of emotional intelligence,
where a leader should manage his or her emotion and
that of others. As a result, it would assist the leader in
developing a relationship with employees and
subordinates, which in turn, will make an impact on
organizational performance (Ovans, 2015).
Why this study?
In the present competitive corporate world,
organizations must endeavour to manage their
resources. The concept of human capital as a factor in
an organization's financial performance has recently
become an area of interest in research. Human capital
has been defined as the knowledge and proficiency
employees acquire over time with an organization;
researchers have highlighted the importance of the
component of people in the firm's reputation and
performance (Abbott & Banerji, 2003; (Abbott, 2003;
Bontis & Fitz-enz, 2002).
The study serves as a valuable source of knowledge
about the interplay between the most important and
influential variables related to the daily functioning of
the firm, involving leaders and employees. It can
provide insights for the managers, leaders, or any
person in the firm who is in charge of a team of
employees, to take rational decisions and adopt
behaviour which is in favour of the organization's
performance. Also, according to Eeden, Cilliers, and
Deventer (2008), understanding the framework of
leadership and the cultural impact of the various kinds
of leadership in the organization, is of utmost
importance in the present competitive world. Such a
study is specifically a good source of encouragement
for public organizations where employee engagement
and commitment is general ly seen to be a
questionable area.
The pool of research conducted so far, seems to focus
on the inter-relationship between two variables and
their impact on a third variable. For instance,
researchers such as Igbinovia and Popoola (2016) who
studied the organizational culture and emotional
intelligence as predictors of job performance among
the library personnel in Nigeria, and research by
Akhtar et al. (2015) which involved a study of the
impact of organizational culture and emotional
intelligence on educational sector performance in
Pakistan, etc. involved a study of one or two variables
and their impact on the job culture or performance. A
latest study by Chatterjee and Kulakli (2015) argues
that leadership theory and empirical findings fail to
adequately substantiate how leaders' emotions
influence their effectiveness. They argue that even
though there exists a considerable body of research as
regards leadership and leadership styles, literature is
rather scarce as regards the relationship between
leadership style and emotional intelligence.
Given the significance of leadership style and
emotional intelligence, this study aims to offer a more
comprehensive view of the organizational scenario. It
provides an overview of the inter-relationships
between three variables; leadership styles, emotional
intelligence, and financial performance of an
organization.
The research concern is to understand the relationship
between various styles of leadership, the emotional
intelligence of managers and the precise manner in
which these factors influence the performance of an
organisation. Therefore, the following research
questions were raised:
1. Do the leaders' styles of management impact the
financial performance of an organization?
2. Given the leadership style, does emotional
intelligence of leaders enhance the organization's
performance?
Literature Review
Organizational Performance
Also referred to as organizational success or
organizational effectiveness, organizational
performance is central to what capitalistic for-profit
companies global ly pursue. "Organizational
performance is the outcome of the organizational
context, interaction of strategy, and individual
behavior" (Myers, 1996, p. 2). From a social
perspective, when people collaborate to execute a
strategy at work, organizational performance is
achieved. Organizations define valuable actions as the
ones used to achieve their goal of making money that
is sought by them.
In general, organizational performance has found its
definition among financial terms. For example, it can
be the much-desired profits that are the excess
revenue on the balance sheet after deduction of
expenses. Successful financial performance is a
concern for both researchers and organizational
leaders, including boards of directors, chief executive
officers, and financial managers of organizations,
regardless of industry. For instance, economists and
operating managers alike continually assess the
variables impacting profitability (e.g., Gumbus,
Bellhouse & Lyons, 2003; Yavas & ShemwelL, 2001). As
McGahan & Porter (2002) succinctly noted,
"Researchers in the economics and strategy fields have
long been interested in understanding the
determinants of firm profitability" (p. 834).
Literature highlights that successful financial
performance is a concern for both researchers and
organizational leaders, including boards of directors,
chief executive officers, and financial managers of
organizations, regardless of industry. In the present
study, the financial performance of the organization
was considered as an important dependent variable.
The organizational performance was construed in
terms of revenue, productivity and operating margin.
Revenue is understood as the value received in
exchange of goods or services. It is a key component
for calculating profit margin.
36 37
cities of India, and therefore street
Contents
mall farmers. Majority of the
farmers (82%) borrow less than
Rs 5 lakhs, and 18% borrow
between Rs 5 – 10 lakhs on a
per annum basis. Most farmers
(65.79%) ar
Table source heading
Table 23: The Results of Mann-Whitney U Test for DOWJONES Index Daily ReturnsDr. Rosy Kalra
Mr. Piyuesh Pandey
References
References

For the purpose of this study, revenue is considered as
one of the differentiators of performance of the Branch
Unit. The measure 'productivity calculation' is
achieved by dividing the total sales by the total cost.
Operating margin was calculated by dividing the
company's operating income (also called the
"Operating Profit") for a given time period by its net
sales during the same period.
Leadership style and Organization
Performance
The relationship between leadership and performance
has received considerable scholarly attention.
Behavioural scientists, psychologists, and others have
been studying and writing about leaders and
leadership for many years. Their studies have evolved
from a focus on leadership traits to a desire to better
understand "the experiences, the contexts, and the
circumstances within which leadership emerges and
performs with productive effect" (Clark & Clark, 1990).
In the past few decades, most studies about the
relationship between transactional leadership and
o rga n i za t i o n a l p e r fo r m a n c e h av e y i e l d e d
disappointing findings. However, when Bass (1985)
Multifactor Leadership Questionnaire (MLQ) was
used, a high correlation was found between the
leader's transformational style and the organizational
performance level. Wang, Law, Hackett, Wang, and
Chen (2005) suggested the leader member exchange
(LMX) theory (Graen, & Uhl-Bien, 1995) as a good
explanation for a mediating role between leadership
styles (especially transformational leadership) and
organizational performance as well as organizational
citizenship behaviour (OCB). In many respects, the
LMX theory is in line with Vroom's (1964) expectancy
theory and Blau's (1964) exchange theory that call for a
stronger balance between managers and employees.
According to these theories, better performance can
be achieved only when there is a reasonable level of
expectation-fit and when the social exchange between
managers and employees is fair and equal. Further, the
contingency theories of leadership enlighten that
there is no best way to predict the organization's
performance. The best organizational form or
leadership style is contingent upon its appropriateness
to a situation or environment (Fiedler, 1978; Lawrence
and Lorshe, 1969).
For any organization to achieve its set objectives and
goals, there must be a 'high' relationship between the
(management) leaders and employees. However, for
productivity to be a reality in an organization, there
should be superior employee performance which
solely depends on the leadership style (Babatunde &
Ikenga, 2015). Unfortunately, workplace surveys
suggest that satisfied employees are becoming
increasingly rare; this reflects on the issue of job
satisfaction, which has a moderate and positive impact
on job performance. People who experience higher
levels of job satisfaction tend to have higher levels of
task performance, higher levels of citizenship
behaviour and lower levels of counterproductive
behaviour (Jason ., 2015, p. 116). et al
Leadership style is a suitable behavioural pattern
applied to the process of guidance of and influence on
employees (Rezaeian, 2007). In fact, in the work
culture and according to the characteristics of people
in the organization, the role of leadership and
management can be effective in promoting and
improving the level of productivity of people and
organizations.
Kukandeh and Del (2015) undertook a study to
evaluate the relationship that transformational
leadership exercised on organizational performance.
The research methodology employed was a
descriptive correlation study sample, consisting of 164
staff, experts in the field and health centres. The survey
conclusively established the existence of a positive
relationship between transformational leadership and
organizational performance.
Lo et al. (2013) conducted a study to explore the
relationship between leadership practices and
organisational performance in the financial services
sector. Data was collected from financial services
companies comprising commercial banks, investment
banks, unit trust management companies and
insurance companies. The study implemented
SmartPLS 2.0 (M3) for hypothesis testing that
comprised both transformational and transactional
leadership styles. The study findings revealed the
importance of leadership in achieving better
organisational performance.
As per the study by Carter (2015), CEOs and their
boards intuitively understand the important role
leadership behaviour has on financial performance.
Two recent studies by Boston Consulting Group (BCG)
and McKinsey provide strong proof of the crucial link
between financial performance with leadership, talent
management and organizational health. BCG's study
found that leadership and talent management
capabilities had a surprisingly strong correlation with
financial performance, while McKinsey's study proved
that the healthiest companies are more than twice as
likely to have an operating profit margin (based on
earnings before interest, tax, depreciation and
amortization) above their industry mean. In an
another study by Dele et al. (2015) that examined the
effect of leadership style on organizational
performance of banks in Nigeria, leadership style was
found to be a positive contributor of organization
performance. The study recommended that banks
should apply appropriate leadership style to achieve
the desired organizational performance.
Emotional Intelligence and Organization
performance
The term Emotional Intelligence (EI) was originally
introduced by Salovey and Mayer (1990), though
questionably, forms of what would later become
known as emotional intelligence date back to as early
as (Gardner, 1983; Thorndike, 1920). Salovey and
Mayer (1990) formulated a distinct form of intelligence
that was related with mental abilities which focused
specifically on understanding and managing one's
emotions, and being separate from other distinct
intelligence. Salovey and Mayer (1990) defined EI as
“the ability to monitor one's own and others' feelings
and emotions, to discriminate among them and to use
this information to guide one's thinking and actions”
(p. 186). Popular press also came out quoting the
significance of emotional intelligence. Goleman
(1998), in his writings, mentioned that real leaders
have a high degree of emotional intelligence which
includes self-awareness, self-regulation, motivation,
empathy, and social skill. Emotional intelligence
requires understanding your own and other people's
emotional makeup well enough to move people in the
direction of accomplishing your company's goals. In his
study, Goleman (1998) found Emotional Intelligence to
be more than twice as predictive of business
performance, than purely cognitive intelligence, and
was more predictive of business performance than
employee skill, knowledge and expertise. The study
findings revealed that leaders scoring higher in key
aspects of emotional intelligence were expected to be
highly profitable.
The study conducted by Lee (2015) states that work
teams with high emotional awareness and strong
management skills achieve more positive results
because of improved ability to exchange information,
problem-solve respectfully to make decisions and
engage in productive conflict negotiation. The
combination of exceptional emotional awareness and
management capability is what drives positive
ISSN: 0971-1023 | NMIMS Management ReviewVolume XXXIII January 2017
ISSN: 0971-1023 | NMIMS Management ReviewVolume XXXIII January 2017
Emotional intelligence - the moderator of leadership styles and performance Emotional intelligence - the moderator of leadership styles and performance38 39
cities of India, and therefore street
Contents
mall farmers. Majority of the
farmers (82%) borrow less than
Rs 5 lakhs, and 18% borrow
between Rs 5 – 10 lakhs on a
per annum basis. Most farmers
(65.79%) ar
Table source heading
Table 23: The Results of Mann-Whitney U Test for DOWJONES Index Daily ReturnsDr. Rosy Kalra
Mr. Piyuesh Pandey
References
References

business results. There is mounting evidence that
emotional intelligence is a factor distinguishing the
best business leaders from the rest of the pack.
Examining effectiveness of management teams in
Fortune 500 companies, the late David McClelland
found that when senior managers had high emotional
intelligence capabilities, their divisions outperformed
consistently every year.
Pryke et al. (2015) carried out a study to understand
the effect of emotional intelligence (EI) of a project
manager on the nature and quality of communications
with his or her subordinates. The fact is that the EI of a
project manager, with its related emotional
competencies, are accepted as crucial in establishing
and maintaining good relations with other members of
a project team. The study findings demonstrated that a
project manager's emotional sensitivity and
expressiveness may be indicative of the subtle
variations in the type of relations between leader and
follower. Another study by Issa and Mahmood (2016)
attempted to ascertain the relationship between
emotional intell igence and transformational
leadership among academic leaders in eighteen
Malaysian public universities. The study finding
inferred that emotional intelligence has the ability to
predict transformational leadership behaviour and
thereby inculcate a suitable organizational culture.
Again, an organization should have a suitable
organizational culture for the relationship to develop.
From the literature, it is evident that studying the link
between a manager's emotional intelligence,
leadership styles and performance might be
beneficial. Specifically, identification of increased
performance is measured based on the degree of
contribution by each individual component of
leadership styles and emotional intelligence. The
current study defines and inspects these relationships
and their impact on Organizational Performance in
terms of revenue, productivity and operating margin.
For this study, the research hypotheses were as
follows:
• The relationship between leadership style and
organization revenue is affected by emotional
intelligence of a leader.
• The relationship between leadership style and
organization productivity is affected by emotional
intelligence of a leader.
The operating margin of an organization is more a
matter of emotional intelligence of managers than
their leadership style.
Research Methodology
This study adopted quantitative methodology. The
primary data was collected through valid and reliable
tools like Mayer Salovey Carusco (MSCEIT) and Life
Style Inventory (LSI). Data was collected through
online means within one organization in the BFSI
sector. 312 branches in this sector were selected as a
part of the data collection process. Among those, the
managers involved in managing independent profit
and loss (PnL) responsibilities of branch units having
one year of experience, were selected. Questionnaires
were sent to them out of which 222 branch managers
responded.
Tools for data collection - The framework of constructs
for this study include the thinking and behavioural
styles measured by the LSI. The LSI measures the
extent to which individuals perceive that they exhibit
these styles. The 12 different thinking styles are
postulated to fall into three clusters: Constructive,
Passive/Defensive, or Aggressive/Defensive. It also
identifies four areas of Concern: Task/Satisfaction,
People/Satisfaction, Task/Security, and People/
Security (Cooke & Lafferty, 1982).
Another tool - MSCEIT - by Mayer et al. (2002) contains
the detailed information in the user's manual. Mayer
et al.'s (2000) definition of emotional intelligence is
“the ability to perceive and express emotion,
assimilate emotion in thought, understand and reason
with emotion, and regulate emotion in self and others”
(p. 396). In other words, a better understanding of
emotion leads to better problem solving in an
individual's emotional life. Their definition is further
defined in a four-branch model (Salovey & Sluyter,
1997, p. 11). The first branch, Perceiving Emotions,
represents the perception, appraisal, and expression
of emotion. The second branch, Facilitating Thought,
represents the emotional facilitation of thinking. The
third branch, Understanding Emotion, represents
understanding and analyzing emotions as well as
employing emotional knowledge. The fourth branch,
Managing Emotion, represents the regulation of
emotion.
The data gathered was subjected to various types of
analyses. Exploratory factor analysis was done to
optimize and evaluate a number of latent factors.
Another method was to explore a set of interrelated
variables without imposing any preconceived
structure on the outcome. Similarly, confirmatory
factor analysis was conducted to test the correlation
between observed variables and latent factors. In
addition, this analysis was done to determine the
model fit to the data. Structural equation modelling
analysis technique was applied to evaluate the validity
of the substantive model with empirical data.
Moderation test and analysis technique was
implemented to test and compare invariance of the
model.
The data was collected from different demographic
profiles of the respondents, where they were from
different age groups, geography/zones, tenures, and
management levels. However, the data related to
select demographic variables is presented as 'Sample
Demographics' in Table 1.
Table 1: Sample Demographics
East
East
Total
North
North
Total
South
South
Total
West
West
Total
Grand
Total
Tenure
Labels
(years)
Vertical
Male
Male
Male
Female Male
1 B 2 2 21 21 4 4 2 39 41 68
M 6 6 2 2 2 8 10 18
S 7 7 1 6 7 14
2 B 12 12 6 6 12 12 30
M 8 8 5 5 15 15 28
S 3 3 3 3 10 10 16
3 B
1
1
8
8
10
10
29 29
48
M
2
2
12
12
8
8
20 20
42
S
2
2
2
2
2
2
5
5 11
Grand Total 7 7 79 79 40 40 5 144 149 275
Note: M – Management, S - Sales and B - Branch
Managers
It may be inferred from the table that the western
region constituted 149 participants, North 70, East 7
and South 40; the group from the west dominated the
current study. Only 5 participants in the said role were
women.
The following statistical techniques were used in the
analysis of the data. Table 2 indicates the techniques
used along with their purpose.
ISSN: 0971-1023 | NMIMS Management ReviewVolume XXXIII January 2017
ISSN: 0971-1023 | NMIMS Management ReviewVolume XXXIII January 2017
Emotional intelligence - the moderator of leadership styles and performance Emotional intelligence - the moderator of leadership styles and performance40 41
cities of India, and therefore street
Contents
mall farmers. Majority of the
farmers (82%) borrow less than
Rs 5 lakhs, and 18% borrow
between Rs 5 – 10 lakhs on a
per annum basis. Most farmers
(65.79%) ar
Table source heading
Table 23: The Results of Mann-Whitney U Test for DOWJONES Index Daily ReturnsDr. Rosy Kalra
Mr. Piyuesh Pandey
References
References
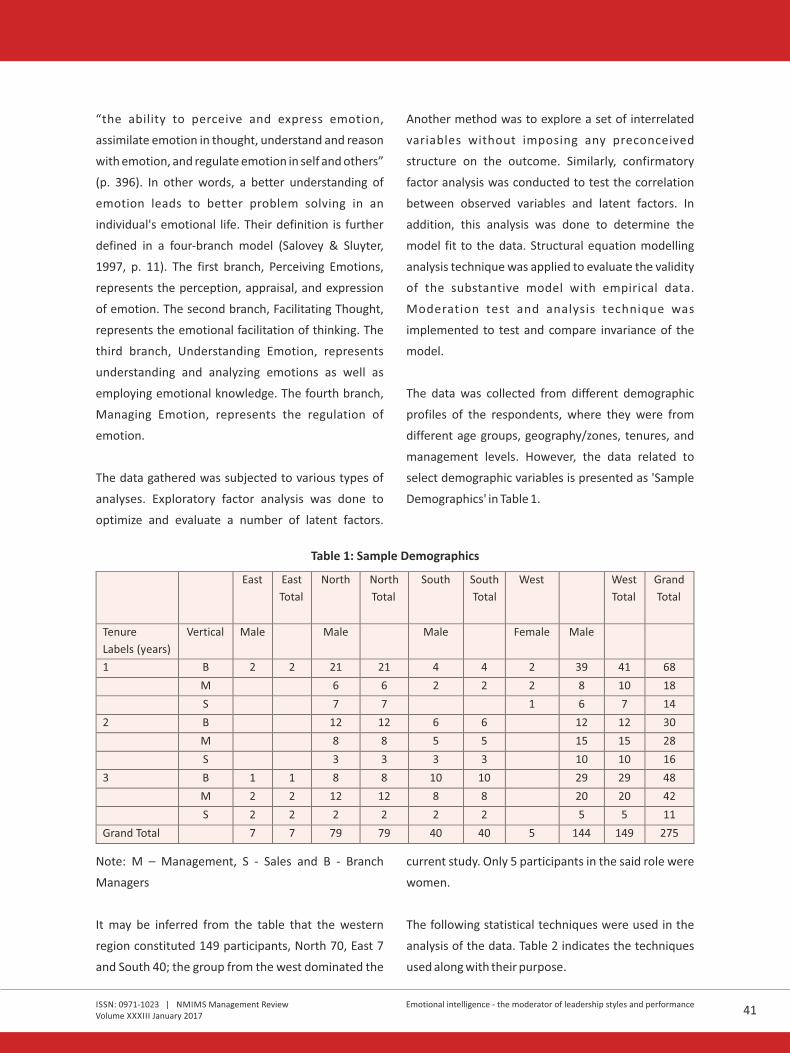
business results. There is mounting evidence that
emotional intelligence is a factor distinguishing the
best business leaders from the rest of the pack.
Examining effectiveness of management teams in
Fortune 500 companies, the late David McClelland
found that when senior managers had high emotional
intelligence capabilities, their divisions outperformed
consistently every year.
Pryke et al. (2015) carried out a study to understand
the effect of emotional intelligence (EI) of a project
manager on the nature and quality of communications
with his or her subordinates. The fact is that the EI of a
project manager, with its related emotional
competencies, are accepted as crucial in establishing
and maintaining good relations with other members of
a project team. The study findings demonstrated that a
project manager's emotional sensitivity and
expressiveness may be indicative of the subtle
variations in the type of relations between leader and
follower. Another study by Issa and Mahmood (2016)
attempted to ascertain the relationship between
emotional intell igence and transformational
leadership among academic leaders in eighteen
Malaysian public universities. The study finding
inferred that emotional intelligence has the ability to
predict transformational leadership behaviour and
thereby inculcate a suitable organizational culture.
Again, an organization should have a suitable
organizational culture for the relationship to develop.
From the literature, it is evident that studying the link
between a manager's emotional intelligence,
leadership styles and performance might be
beneficial. Specifically, identification of increased
performance is measured based on the degree of
contribution by each individual component of
leadership styles and emotional intelligence. The
current study defines and inspects these relationships
and their impact on Organizational Performance in
terms of revenue, productivity and operating margin.
For this study, the research hypotheses were as
follows:
• The relationship between leadership style and
organization revenue is affected by emotional
intelligence of a leader.
• The relationship between leadership style and
organization productivity is affected by emotional
intelligence of a leader.
The operating margin of an organization is more a
matter of emotional intelligence of managers than
their leadership style.
Research Methodology
This study adopted quantitative methodology. The
primary data was collected through valid and reliable
tools like Mayer Salovey Carusco (MSCEIT) and Life
Style Inventory (LSI). Data was collected through
online means within one organization in the BFSI
sector. 312 branches in this sector were selected as a
part of the data collection process. Among those, the
managers involved in managing independent profit
and loss (PnL) responsibilities of branch units having
one year of experience, were selected. Questionnaires
were sent to them out of which 222 branch managers
responded.
Tools for data collection - The framework of constructs
for this study include the thinking and behavioural
styles measured by the LSI. The LSI measures the
extent to which individuals perceive that they exhibit
these styles. The 12 different thinking styles are
postulated to fall into three clusters: Constructive,
Passive/Defensive, or Aggressive/Defensive. It also
identifies four areas of Concern: Task/Satisfaction,
People/Satisfaction, Task/Security, and People/
Security (Cooke & Lafferty, 1982).
Another tool - MSCEIT - by Mayer et al. (2002) contains
the detailed information in the user's manual. Mayer
et al.'s (2000) definition of emotional intelligence is
“the ability to perceive and express emotion,
assimilate emotion in thought, understand and reason
with emotion, and regulate emotion in self and others”
(p. 396). In other words, a better understanding of
emotion leads to better problem solving in an
individual's emotional life. Their definition is further
defined in a four-branch model (Salovey & Sluyter,
1997, p. 11). The first branch, Perceiving Emotions,
represents the perception, appraisal, and expression
of emotion. The second branch, Facilitating Thought,
represents the emotional facilitation of thinking. The
third branch, Understanding Emotion, represents
understanding and analyzing emotions as well as
employing emotional knowledge. The fourth branch,
Managing Emotion, represents the regulation of
emotion.
The data gathered was subjected to various types of
analyses. Exploratory factor analysis was done to
optimize and evaluate a number of latent factors.
Another method was to explore a set of interrelated
variables without imposing any preconceived
structure on the outcome. Similarly, confirmatory
factor analysis was conducted to test the correlation
between observed variables and latent factors. In
addition, this analysis was done to determine the
model fit to the data. Structural equation modelling
analysis technique was applied to evaluate the validity
of the substantive model with empirical data.
Moderation test and analysis technique was
implemented to test and compare invariance of the
model.
The data was collected from different demographic
profiles of the respondents, where they were from
different age groups, geography/zones, tenures, and
management levels. However, the data related to
select demographic variables is presented as 'Sample
Demographics' in Table 1.
Table 1: Sample Demographics
East
East
Total
North
North
Total
South
South
Total
West
West
Total
Grand
Total
Tenure
Labels
(years)
Vertical
Male
Male
Male
Female Male
1 B 2 2 21 21 4 4 2 39 41 68
M 6 6 2 2 2 8 10 18
S 7 7 1 6 7 14
2 B 12 12 6 6 12 12 30
M 8 8 5 5 15 15 28
S 3 3 3 3 10 10 16
3 B
1
1
8
8
10
10
29 29
48
M
2
2
12
12
8
8
20 20
42
S
2
2
2
2
2
2
5
5 11
Grand Total 7 7 79 79 40 40 5 144 149 275
Note: M – Management, S - Sales and B - Branch
Managers
It may be inferred from the table that the western
region constituted 149 participants, North 70, East 7
and South 40; the group from the west dominated the
current study. Only 5 participants in the said role were
women.
The following statistical techniques were used in the
analysis of the data. Table 2 indicates the techniques
used along with their purpose.
ISSN: 0971-1023 | NMIMS Management ReviewVolume XXXIII January 2017
ISSN: 0971-1023 | NMIMS Management ReviewVolume XXXIII January 2017
Emotional intelligence - the moderator of leadership styles and performance Emotional intelligence - the moderator of leadership styles and performance40 41
cities of India, and therefore street
Contents
mall farmers. Majority of the
farmers (82%) borrow less than
Rs 5 lakhs, and 18% borrow
between Rs 5 – 10 lakhs on a
per annum basis. Most farmers
(65.79%) ar
Table source heading
Table 23: The Results of Mann-Whitney U Test for DOWJONES Index Daily ReturnsDr. Rosy Kalra
Mr. Piyuesh Pandey
References
References
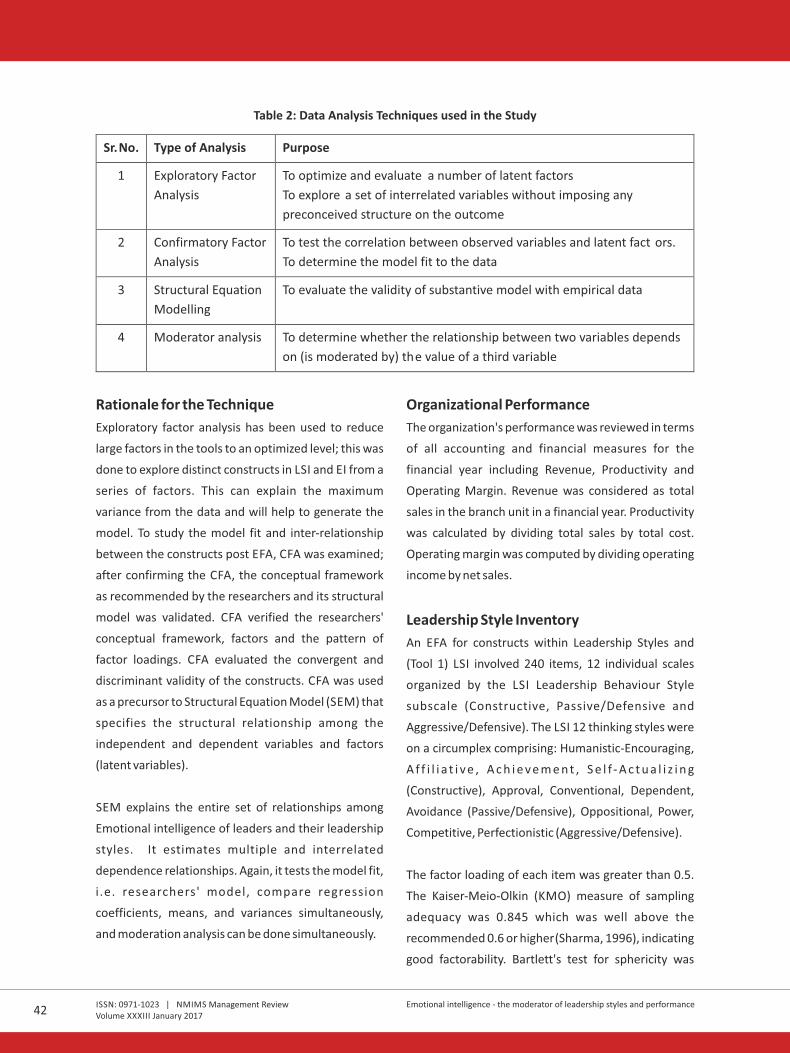
Table 2: Data Analysis Techniques used in the Study
Sr.No. Type of Analysis Purpose
1 Exploratory Factor
Analysis
To optimize and evaluate a number of latent factors
To explore a set of interrelated variables without imposing any
preconceived structure on the outcome
2 Confirmatory Factor
Analysis
To test the correlation between observed variables and latent fact ors.
To determine the model fit to the data
3 Structural Equation
Modelling
To evaluate the validity of substantive model with empirical data
4 Moderator analysis To determine whether the relationship between two variables depends
on (is moderated by) the value of a third variable
Rationale for the Technique
Exploratory factor analysis has been used to reduce
large factors in the tools to an optimized level; this was
done to explore distinct constructs in LSI and EI from a
series of factors. This can explain the maximum
variance from the data and will help to generate the
model. To study the model fit and inter-relationship
between the constructs post EFA, CFA was examined;
after confirming the CFA, the conceptual framework
as recommended by the researchers and its structural
model was validated. CFA verified the researchers'
conceptual framework, factors and the pattern of
factor loadings. CFA evaluated the convergent and
discriminant validity of the constructs. CFA was used
as a precursor to Structural Equation Model (SEM) that
specifies the structural relationship among the
independent and dependent variables and factors
(latent variables).
SEM explains the entire set of relationships among
Emotional intelligence of leaders and their leadership
styles. It estimates multiple and interrelated
dependence relationships. Again, it tests the model fit,
i .e. researchers' model, compare regression
coefficients, means, and variances simultaneously,
and moderation analysis can be done simultaneously.
Organizational Performance
The organization's performance was reviewed in terms
of all accounting and financial measures for the
financial year including Revenue, Productivity and
Operating Margin. Revenue was considered as total
sales in the branch unit in a financial year. Productivity
was calculated by dividing total sales by total cost.
Operating margin was computed by dividing operating
income by net sales.
Leadership Style Inventory
An EFA for constructs within Leadership Styles and
(Tool 1) LSI involved 240 items, 12 individual scales
organized by the LSI Leadership Behaviour Style
subscale (Constructive, Passive/Defensive and
Aggressive/Defensive). The LSI 12 thinking styles were
on a circumplex comprising: Humanistic-Encouraging,
A f f i l i a t i v e , A c h i e v e m e n t , S e l f - A c t u a l i z i n g
(Constructive), Approval, Conventional, Dependent,
Avoidance (Passive/Defensive), Oppositional, Power,
Competitive, Perfectionistic (Aggressive/Defensive).
The factor loading of each item was greater than 0.5.
The Kaiser-Meio-Olkin (KMO) measure of sampling
adequacy was 0.845 which was well above the
recommended 0.6 or higher (Sharma, 1996), indicating
good factorability. Bartlett's test for sphericity was
significant, which indicated that the variables
correlated with each other. The high factor loadings
indicate that the measures describe the same factor
(convergent validity), whereas high Cronbach's alpha
shows high inter-correlations among these items,
which was 0.824. This indicates that optimized items
used in this study were suitable to describe two
constructs, namely (a) LSI Constructive and (b)
Moderately Defensive. EFA revealed (Table 3) the two
factors having Eigenvalues greater than 1 explaining
74.64 % of variance in the data.
Mayer-Salovey-Caruso Emotional
Intelligence Test (MSCEIT)
The Mayer-Salovey-Caruso Emotional Intelligence Test
(Tool 3) has 141 items and employs 8 task level scores,
based on factor analysis, clustered around four
branches namely: Emotional Perception, Emotional
Facilitation, Emotional Understanding, and Emotional
Management.
These four made up the four MSCEIT branches. The
factor loading of each item was greater than 0.358. The
Kaiser-Meio-Olkin (KMO) measure of sampling
adequacy was 0.862 again above the recommended
0.6 or higher. Bartlett's test for sphericity was
significant, which indicated that the variables
correlated with each other. The two distinct factors
were obtained through factor analysis. The high
Cronbach's alpha shows high inter-correlations among
these items, which was 0.860. This indicates that
optimized items used in this study were suitable to
describe two constructs based on EFA, namely (a)
Perceived facilitation; (b) Managed reasoning. EFA
revealed (Table 3) the two factors having Eigenvalues
greater than 1 explaining 46% of the variance for
MSCEIT.
Table 3: Exploratory Factor Analyses (EFA)
ISSN: 0971-1023 | NMIMS Management ReviewVolume XXXIII January 2017
ISSN: 0971-1023 | NMIMS Management ReviewVolume XXXIII January 2017
Emotional intelligence - the moderator of leadership styles and performance Emotional intelligence - the moderator of leadership styles and performance42 43
cities of India, and therefore street
Contents
mall farmers. Majority of the
farmers (82%) borrow less than
Rs 5 lakhs, and 18% borrow
between Rs 5 – 10 lakhs on a
per annum basis. Most farmers
(65.79%) ar
Table source heading
Table 23: The Results of Mann-Whitney U Test for DOWJONES Index Daily ReturnsDr. Rosy Kalra
Mr. Piyuesh Pandey
References
References

Conceptual Model
The conceptual model was tested in order to establish
nomological validity. The LSI Constructive, Moderately
Defensive and Perceived facilitation and Managed
Reasoning of EI were all exogenous constructs.
The structural model provided the causal relationship
between the constructs. This structural model was
tested by using the goodness of fit index. The basic
SEM model was further refined by trimming the
measured items that had high modification index both
in covariance and regression weights, and insignificant
paths. Faces (.263), had squared multiple correlation
(SMC) below the cut-off 0.5, but was retained as at
least two variables were needed in a construct
(Perceived facilitations), which is shown in Figure 1.
Figure 1: Conceptual Map
Leadership Styles
Performance
Emotional Intelligence
Following are the fit indices (Table 4) of the structural model. Table 4: SEM Model Fit Values
Chi
Square
Df Chi-
sq/df
GFI AGFI NFI CFI RFI IFI TLI
320.752 132 2.430 .878 .824 .886 .929 .853 .930 .908
Standardised RMSEA=.080, p=0.000, RMR=7.162 LO 90=0.069, HI 90 =0.092, PCLOSE=0.000
Most of the fit measures met the recommended values indicating that the model was acceptable.
Reliability and Validity of the Instrument
Reliability and validity of the measurement was established and confirmed for the trimmed measurement model.
Table 6 shows Cronbach's alpha Composite Reliability and Average Variance Extracted (AVE) for the constructs in
the study.
Table 5: Summary of the Reliability and Validity Measures
Construct Cronbach's alpha AVE Composite Reliability
Managed Reasoning 0.868 0.696 0.873
LSI Constructive 0.892 0.811 0.895
LSI Moderately Defensive
0.915
0.791
0.919
Perceived Facilitation
0.665
0.600
0.734
All constructs satisfied the conditions stated above in
the trimmed measurement model. In this study,
construct validity was examined by finding convergent
and discriminant validity.
Convergent Validity
Convergent validity was examined to find whether the
items of the same construct are correlated and
discriminant validity was used to find whether items of
a construct do not correlate on other constructs. Table
6 shows the factor loadings and Squared Multiple
Correlation (SMC) for the items used in the trimmed
measurement model.
Convergent Validity of the trimmed measurement
model was established by using three criteria.
ü Factor Loading
ü Average Variance Extracted (AVE)
ü Construct Reliability / Composite Reliability
To calculate Construct Reliability, Average Variance
Extracted, Maximum Share Variance and Average
Shared Variance, the James Gaskin Tool package was
used. By substituting Correlation and Standardised
Regression Weights, the desired values were obtained
which are shown in Table 7
Table 6: Factor Loadings and Item Reliability
Constructs Factor
Loadings
Item
Reliability (SMC)
EI Facilitation <--- Perceived
Facilitation
0.961 0.924
Emotional_relation <--- Managed
Reasoning
0.841 0.708
Emotion_mgmt <--- Managed
Reasoning
0.874 0.765
Blends <--- Managed
Reasoning
0.786 0.617
Faces
<---
Perceived
Facilitation
0.526
0.277
ISSN: 0971-1023 | NMIMS Management ReviewVolume XXXIII January 2017
ISSN: 0971-1023 | NMIMS Management ReviewVolume XXXIII January 2017
Emotional intelligence - the moderator of leadership styles and performance Emotional intelligence - the moderator of leadership styles and performance44 45
cities of India, and therefore street
Contents
mall farmers. Majority of the
farmers (82%) borrow less than
Rs 5 lakhs, and 18% borrow
between Rs 5 – 10 lakhs on a
per annum basis. Most farmers
(65.79%) ar
Table source heading
Table 23: The Results of Mann-Whitney U Test for DOWJONES Index Daily ReturnsDr. Rosy Kalra
Mr. Piyuesh Pandey
References
References
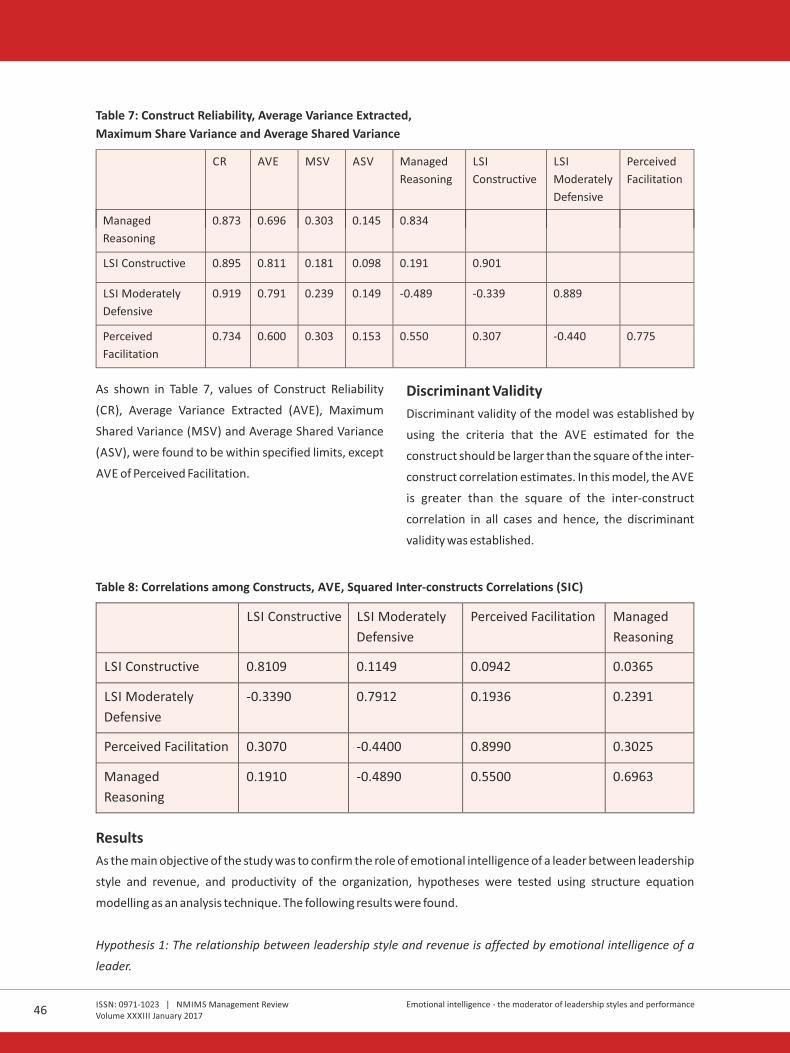
Table 7: Construct Reliability, Average Variance Extracted,
Maximum Share Variance and Average Shared Variance
CR AVE MSV ASV Managed Reasoning
LSI
Constructive
LSI
Moderately
Defensive
Perceived
Facilitation
Managed
Reasoning
0.873 0.696
0.303
0.145
0.834
LSI Constructive
0.895
0.811
0.181
0.098
0.191
0.901
LSI Moderately
Defensive
0.919
0.791
0.239
0.149
-0.489
-0.339
0.889
Perceived
Facilitation
0.734
0.600
0.303
0.153
0.550
0.307
-0.440
0.775
As shown in Table 7, values of Construct Reliability
(CR), Average Variance Extracted (AVE), Maximum
Shared Variance (MSV) and Average Shared Variance
(ASV), were found to be within specified limits, except
AVE of Perceived Facilitation.
Discriminant Validity
Discriminant validity of the model was established by
using the criteria that the AVE estimated for the
construct should be larger than the square of the inter-
construct correlation estimates. In this model, the AVE
is greater than the square of the inter-construct
correlation in all cases and hence, the discriminant
validity was established.
Table 8: Correlations among Constructs, AVE, Squared Inter-constructs Correlations (SIC)
LSI Constructive LSI Moderately
Defensive
Perceived Facilitation Managed
Reasoning
LSI Constructive 0.8109 0.1149 0.0942 0.0365
LSI Moderately Defensive
-0.3390 0.7912 0.1936 0.2391
Perceived Facilitation 0.3070 -0.4400 0.8990 0.3025
Managed Reasoning
0.1910 -0.4890 0.5500 0.6963
Results
As the main objective of the study was to confirm the role of emotional intelligence of a leader between leadership
style and revenue, and productivity of the organization, hypotheses were tested using structure equation
modelling as an analysis technique. The following results were found.
Hypothesis 1: The relationship between leadership style and revenue is affected by emotional intelligence of a
leader.
Table 9: Association between LSI and Revenue when moderating on EI
Model Unstandardized
Coefficients
Adjusted
R-square
t-value p-value
Beta SE
1 (Constant) 555342.130 247455.160 0.098 2.244 0.026
LSIconc -24553.744 6045.022 -3.978 0.001**
LSIpasdef -17202.025 4363.295 -3.942 0.000**
2 (Constant) -4858.123 244166.011 0.242 -0.020 0.984
LSIconc 6129.101 5583.388 1.098 0.274
LSIpasdef -10413.478 4161.179 -2.503 0.013**
Perfac
165.630
2370.648
0.070
0.944
Reaarea
16528.926
2590.712
6.380
0.000**
Dependent Variable: Revenue, **p<0.01, *p<0.05
Code expansion (ReaArea=Managed Reasoning,
PerFac = Perceived Facilitation, LSModdef=LSI
Moderately Aggressive, LSIconc = Constructive)
Table 9 presents the association between LSI on
revenue when moderating on EI. The variable revenue
is considered as a dependent variable. The variables
LSIconc and LSIpasdef are considered as independent
variables, while EI constructs 'perfac and Reaarea' are
moderated variables. In Block 1, only independent
variables are entered in which LSIpasdef ( =-β
17202.025, t=-3.942, p<0.01) is found to have a
negatively significant impact on revenue. Independent
variables together accounted for 10 percent variation
on revenue. In Block 2, the moderator variable perfac
and Reaarea are added; there is no change in
independent variables. LSIpasdef ( =-10413.478, t=-β
2.503, p=0.013<0.01) has a negative significant impact
on revenue. While moderator variable Reaarea
( =16528.926, t=6.380, p<0.01) has a positive β
significant impact on revenue. Independent and
moderator variables together accounted for 24
percent variation on revenue. Hence, we conclude that
passive defensive leadership style has an impact on the
revenue of an organization and the emotional
intelligence construct of managed reasoning
moderates the relationship between leadership style
and revenue.
Hypothesis 2: The relationship between leadership
style and productivity is affected by emotional
intelligence of a leader.
ISSN: 0971-1023 | NMIMS Management ReviewVolume XXXIII January 2017
ISSN: 0971-1023 | NMIMS Management ReviewVolume XXXIII January 2017
Emotional intelligence - the moderator of leadership styles and performance Emotional intelligence - the moderator of leadership styles and performance46 47
cities of India, and therefore street
Contents
mall farmers. Majority of the
farmers (82%) borrow less than
Rs 5 lakhs, and 18% borrow
between Rs 5 – 10 lakhs on a
per annum basis. Most farmers
(65.79%) ar
Table source heading
Table 23: The Results of Mann-Whitney U Test for DOWJONES Index Daily ReturnsDr. Rosy Kalra
Mr. Piyuesh Pandey
References
References

Table 10: Association between LSI and Productivity when moderating on EI
Model Unstandardized
Coefficients
Adjusted
R-square
t-value p-value
Beta SE
1 (Constant) 1.763 0.459 0.004 3.841 0.000
LSIconc -0.005 0.011 -0.432 0.666
LSIpasdef -0.009 0.008 -1.161 0.247
2 (Constant) 1.615 0.491 0.015 3.288 0.001
LSIconc -0.007 0.011 -0.645 0.520
LSIpasdef -0.007 0.008 -0.839 0.403
perfac
0.010
0.005
2.117
0.035*
Reaarea
-0.002
0.005
-0.408
0.684
Dependent Variable: Productivity, *p<0.05
Code expansion (ReaArea=Managed Reasoning,
PerFac = Perceived Facilitation, LSModdef=LSI
Moderately Aggressive, LSIconc = Constructive)
Table 10 presents the association between LSI on
productivity when moderating on EI. The variable
productivity is considered as a dependent variable.
The variables LSIconc and LSIpasdef are considered as
independent variables, while emotional intelligence
constructs 'perfac and Reaarea' are moderated
variables. In Block 1, only independent variables are
entered which shows there is no significant impact on
productivity. In Block 2, the moderator variables perfac
and Reaarea are added; moderator variable perfac
(β=0.010, t=2.117, p=0.04<0.05) has positive impact
on productivity. Independent and moderator variables
together accounted for 2 percent variation on
productivity with 'perfac' having the minimal impact
(p=.035). Hence we conclude that the hypothesis, EI
moderates the relationship between LS I and
productivity is rejected. There is a similar finding from
the study by (Azadehdel & Avakh, 2015).
Hypothesis 3: The operating margin of an organization
is more a matter of emotional intelligence of managers
than their leadership style.
Table 11: Association between LSI, and Operating Margin(OPM) when moderating on EI
Model Unstandardized
Coefficients
Adjusted
R-square
t-value p-value
Beta SE
1 (Constant) 0.817 0.301 -0.015 2.717 0.007
LSIconc -0.003 0.007 -0.363 0.717
LSIpasdef -0.003 0.005 -0.475 0.635
2 (Constant) 0.784 0.318 0.018 2.463 0.015
LSIconc
-0.001
0.007
-0.194
0.846
LSIpasdef
-0.003
0.005
-0.482
0.631
perfac
-0.008
0.003
-2.734
0.007**
Reaarea
0.006
0.003
1.902
0.059
Dependent Variable: OPM, **p<0.01
Code expansion (Rea Area=Managed Reasoning,
PerFac = Perceived Facilitation, LSModdef=LSI
Moderately Aggressive, LSIconc = Constructive)
Table 11 presents the association between leadership
style and operating margin when moderating on
emotional intelligence. The variable OPM is
considered as dependent variable. In Block 1 none of
the independent variables were significant. In Block 2
the moderator variable perfac and Reaarea were
added, in which perfac (β=-0.008, t=-2.734,
p=0.01<0.05) is negatively impact on OPM. Moderator
variable accounted 2 percent variation on OPM.
Hence, we conclude that the impact of perceived
facilitation (EI construct) as a moderator is negatively
significant on the relationship between independent
and dependent variables. The variability being very
low, the relationship between LSI and organizational
performance is affected by EI is partially accepted and
the finding is also supported by the research from
Ahuja (2015).
Model Unstandardized
Coefficients
Adjusted
R-square
t-value p-value
Beta SE
Discussion of results
The leadership style adopted by the leader is said to
have a significant impact on the relationship between
leader, employee and the organization performance.
Studies have shown that the emotional intelligence of
a leader is important too. In the present study the
purpose was to understand the connections between
the constituents of Emotional Intelligence, Leadership
Styles, and Performance. Further, performance was
selected because Unit Managers are involved in
managing independent profit and loss (PnL)
responsibilities of branch units, and can affect the
overall organization's overall performance in the Retail
Financial services industry.
Moderation test was conducted among the attributes
like leadership styles, emotional intelligence, and
organization financial performance. First assessment
was to find out aassociation between LSI and Revenue
when moderating on EI. Second assessment was to
find out relation between LSI and Productivity
including EI as moderator. Third assessment was to
identify how attributes like LSI and operating margin
get moderated through EI. In this regard, three
hypotheis were tested.
It could be concluded from the hypothesis test that
moderately defensive style of a leader which is found
in individuals characterized by self-promoting thinking
and behaviour that promotes the fulfilment of security
needs through interaction with people, have a
negative influence on the revenue as a performance
measure. It may reflect that the more the leaders
reflect self interests the poorer it shows on the
ISSN: 0971-1023 | NMIMS Management ReviewVolume XXXIII January 2017
ISSN: 0971-1023 | NMIMS Management ReviewVolume XXXIII January 2017
Emotional intelligence - the moderator of leadership styles and performance Emotional intelligence - the moderator of leadership styles and performance48 49
cities of India, and therefore street
Contents
mall farmers. Majority of the
farmers (82%) borrow less than
Rs 5 lakhs, and 18% borrow
between Rs 5 – 10 lakhs on a
per annum basis. Most farmers
(65.79%) ar
Table source heading
Table 23: The Results of Mann-Whitney U Test for DOWJONES Index Daily ReturnsDr. Rosy Kalra
Mr. Piyuesh Pandey
References
References
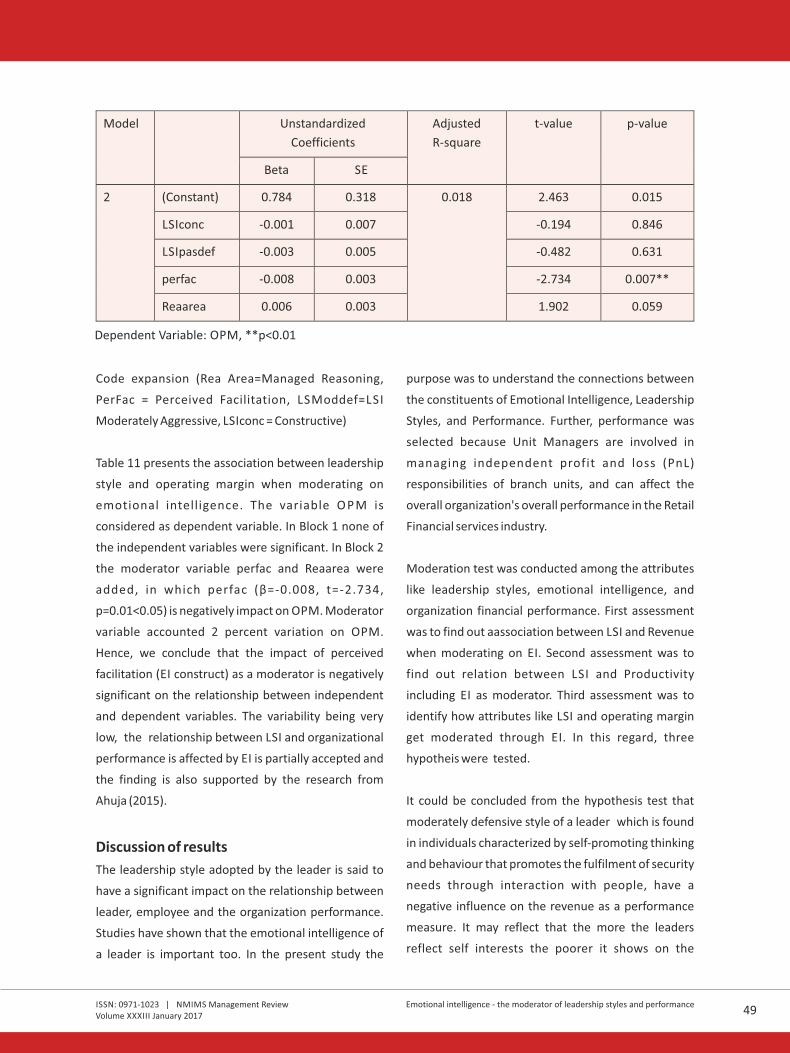
Table 10: Association between LSI and Productivity when moderating on EI
Model Unstandardized
Coefficients
Adjusted
R-square
t-value p-value
Beta SE
1 (Constant) 1.763 0.459 0.004 3.841 0.000
LSIconc -0.005 0.011 -0.432 0.666
LSIpasdef -0.009 0.008 -1.161 0.247
2 (Constant) 1.615 0.491 0.015 3.288 0.001
LSIconc -0.007 0.011 -0.645 0.520
LSIpasdef -0.007 0.008 -0.839 0.403
perfac
0.010
0.005
2.117
0.035*
Reaarea
-0.002
0.005
-0.408
0.684
Dependent Variable: Productivity, *p<0.05
Code expansion (ReaArea=Managed Reasoning,
PerFac = Perceived Facilitation, LSModdef=LSI
Moderately Aggressive, LSIconc = Constructive)
Table 10 presents the association between LSI on
productivity when moderating on EI. The variable
productivity is considered as a dependent variable.
The variables LSIconc and LSIpasdef are considered as
independent variables, while emotional intelligence
constructs 'perfac and Reaarea' are moderated
variables. In Block 1, only independent variables are
entered which shows there is no significant impact on
productivity. In Block 2, the moderator variables perfac
and Reaarea are added; moderator variable perfac
(β=0.010, t=2.117, p=0.04<0.05) has positive impact
on productivity. Independent and moderator variables
together accounted for 2 percent variation on
productivity with 'perfac' having the minimal impact
(p=.035). Hence we conclude that the hypothesis, EI
moderates the relationship between LS I and
productivity is rejected. There is a similar finding from
the study by (Azadehdel & Avakh, 2015).
Hypothesis 3: The operating margin of an organization
is more a matter of emotional intelligence of managers
than their leadership style.
Table 11: Association between LSI, and Operating Margin(OPM) when moderating on EI
Model Unstandardized
Coefficients
Adjusted
R-square
t-value p-value
Beta SE
1 (Constant) 0.817 0.301 -0.015 2.717 0.007
LSIconc -0.003 0.007 -0.363 0.717
LSIpasdef -0.003 0.005 -0.475 0.635
2 (Constant) 0.784 0.318 0.018 2.463 0.015
LSIconc
-0.001
0.007
-0.194
0.846
LSIpasdef
-0.003
0.005
-0.482
0.631
perfac
-0.008
0.003
-2.734
0.007**
Reaarea
0.006
0.003
1.902
0.059
Dependent Variable: OPM, **p<0.01
Code expansion (Rea Area=Managed Reasoning,
PerFac = Perceived Facilitation, LSModdef=LSI
Moderately Aggressive, LSIconc = Constructive)
Table 11 presents the association between leadership
style and operating margin when moderating on
emotional intelligence. The variable OPM is
considered as dependent variable. In Block 1 none of
the independent variables were significant. In Block 2
the moderator variable perfac and Reaarea were
added, in which perfac (β=-0.008, t=-2.734,
p=0.01<0.05) is negatively impact on OPM. Moderator
variable accounted 2 percent variation on OPM.
Hence, we conclude that the impact of perceived
facilitation (EI construct) as a moderator is negatively
significant on the relationship between independent
and dependent variables. The variability being very
low, the relationship between LSI and organizational
performance is affected by EI is partially accepted and
the finding is also supported by the research from
Ahuja (2015).
Model Unstandardized
Coefficients
Adjusted
R-square
t-value p-value
Beta SE
Discussion of results
The leadership style adopted by the leader is said to
have a significant impact on the relationship between
leader, employee and the organization performance.
Studies have shown that the emotional intelligence of
a leader is important too. In the present study the
purpose was to understand the connections between
the constituents of Emotional Intelligence, Leadership
Styles, and Performance. Further, performance was
selected because Unit Managers are involved in
managing independent profit and loss (PnL)
responsibilities of branch units, and can affect the
overall organization's overall performance in the Retail
Financial services industry.
Moderation test was conducted among the attributes
like leadership styles, emotional intelligence, and
organization financial performance. First assessment
was to find out aassociation between LSI and Revenue
when moderating on EI. Second assessment was to
find out relation between LSI and Productivity
including EI as moderator. Third assessment was to
identify how attributes like LSI and operating margin
get moderated through EI. In this regard, three
hypotheis were tested.
It could be concluded from the hypothesis test that
moderately defensive style of a leader which is found
in individuals characterized by self-promoting thinking
and behaviour that promotes the fulfilment of security
needs through interaction with people, have a
negative influence on the revenue as a performance
measure. It may reflect that the more the leaders
reflect self interests the poorer it shows on the
ISSN: 0971-1023 | NMIMS Management ReviewVolume XXXIII January 2017
ISSN: 0971-1023 | NMIMS Management ReviewVolume XXXIII January 2017
Emotional intelligence - the moderator of leadership styles and performance Emotional intelligence - the moderator of leadership styles and performance48 49
cities of India, and therefore street
Contents
mall farmers. Majority of the
farmers (82%) borrow less than
Rs 5 lakhs, and 18% borrow
between Rs 5 – 10 lakhs on a
per annum basis. Most farmers
(65.79%) ar
Table source heading
Table 23: The Results of Mann-Whitney U Test for DOWJONES Index Daily ReturnsDr. Rosy Kalra
Mr. Piyuesh Pandey
References
References

revenue of the organization. The constructive
lea d ers h ip st y le w h ic h enta i l s in d iv id u a l s
characterized by self-enhancing thinking and
behaviour that contributes to an individual's level of
satisfaction ability to develop healthy relationships,
working effectively with people and proficiency at
accomplishing tasks did not emerge significant enough
to make contribution towards organization's revenue.
There could be other important factors other than a
particular leadership style that needs to be studied.
Another outcome of the result is that emotional
intelligence understood as 'perceived facilitation' of
managers has a little but significant negative impact on
product iv i ty as a measure of organizat ion
performance. That means if leaders are not seen in
positive light it may impact productivity negatively. A
study on the impact on organization performance is
evidenced by Sharma et al (2016). However, 'managed
reasoning' of leaders seems to be a stronger predictor
than leadership style in impacting the revenue of the
organization. (Pfeffer & Sutton, 2006). Moderately
defensive leadership style has a significant impact on
performance. Managed reasoning of Managers has a
significant impact on performance. A clear indication
that if mangers are good at emotion management and
emotional relations it could be beneficial for the
organization. The constructive leadership style has
not emerged as a contributor to organization
performance .
The study overall discussed about leadership style and
leader's emotional intelligence, how these impacts
organization's performance. Leaders do require
understanding the emotions of followers or
subordinates. Leaders should use emotion as a tool to
diagnose whether followers appreciate the work
assigned to them or not. Thus, it reflects about the
relationship between leaders and emotional
intelligence (Ugoani, 2015)
8. Conclusion
It is well accepted that understanding leadership is
important. The phenomena of leadership are
manifested in organizations in different forms and
different contexts. Mitchell et al (1970) opined that
outcome is contingent upon the leadership styles and
the situations that are favourable to the leaders.
Drawing on contingency theories of leadership that
emphasize the significance of situational variables in
altering the effectiveness of a particular leader's
behaviour and leadership style (Trimizi, 2002), the
current research emphasizes the importance of
emotional intelligence between leadership style and
organizat ion performance. The premise of
contingency theory in the present study is that it
represents a change in leadership research by firstly,
by focusing on passive defensive style of leadership
that may contribute to organizational performance
negatively, secondly, it is rather more important to
say that leadership style matters in the situations
when the leaders show the attributes of emotional
intelligence. The study thus makes an academic
contribution by creating a model that highlights the
importance of not only passive defensive style of
leadership but more of the aspects of emotional
intelligence for an organization. The way leader or
manager uses emotional intelligence has relevance to
organizational performance. Hence, it could be
inferred that emotional intelligence makes impact on
performance especially in the banking and financial
industry (Ahuja 2015). Managers in the organizations
are required to be cognizant of their role as a leader.
Further, the emotional intelligence of managers assists
in influencing other employees, i.e. leadership styles
thereby combined emotional intelligence compels to
contribute towards organization goals. This is how
organizational performance gets boosted. The study
by Boyatzis (2006),has also emphasized the
importance of emotional intelligence and other
cognitive competencies in predicting financial
performance of an organization.
Contribution through Human Capital Based
Performance (HCBP) Model:
The focus of human capital is on individual and
organization. Key attributes of this model are
leadership skill, organizational culture, and emotional
intelligence. Thus, leader understands on emotional
intelligence of employees maters. Moreover, leader
must have the potential to read the EI prevail among
the employees, which in turn would help in leading the
team in better way. Hence, leader's investment on
tracking the employees as per their requirement
would in turn lead to more productivity.
Study limitations and Scope for further
research
The limitation of the study is that the research study
was carried out only in single banking and financial
company including its 222 branch units. This can also
be considered as strength as the entire data came from
a specific context. Having said so, there are so many
industries apart from these that require researchers'
attention. Moreover, the survey was conducted
online. Otherwise, face-to-face interviews might have
come up with some other findings. Thus, the study
findings can't be applicable to other industries. Hence,
there is ample scope for further research to be carried
out in other industries. The study recommends that
organizations into service industry should focus on
Emotional Intelligence, where the role of leader or
manager becomes pivotal to understand the
emotional needs of employees. As a result, it would
lead to better financial growth.
ISSN: 0971-1023 | NMIMS Management ReviewVolume XXXIII January 2017
ISSN: 0971-1023 | NMIMS Management ReviewVolume XXXIII January 2017
Emotional intelligence - the moderator of leadership styles and performance Emotional intelligence - the moderator of leadership styles and performance50 51
cities of India, and therefore street
Contents
mall farmers. Majority of the
farmers (82%) borrow less than
Rs 5 lakhs, and 18% borrow
between Rs 5 – 10 lakhs on a
per annum basis. Most farmers
(65.79%) ar
Table source heading
Table 23: The Results of Mann-Whitney U Test for DOWJONES Index Daily ReturnsDr. Rosy Kalra
Mr. Piyuesh Pandey
References
References
References
• Abbett L., Coldham A., Whisnant R. (2010). Organizational culture and the success of corporate sustainability
initiatives: An empirical analysis using the competing values framework (unpublished M.Sc dissertation)
University of Michigan.
• Abbott, A., & Banerji, K. (2003). Strategic flexibility and firm performance: the case of US based transnational
corporations. Global Journal of Flexible Systems Management, 4(1/2), 1.
• Ahuja, S. (2015). Job performance: Getting influenced by emotional intelligence. American International
Journal of Research in Humanities, Arts and Social Sciences, 15(1), 258-263.
• Akhtar, S., Ibrahim, M., Riaz, M., & Hussain, S.M. (2015). Impact of organizational culture and emotional
intelligence on educational sector performance. Research on Humanities and Social Sciences, 5(15), 91-95.
• Babatunde, O. & Ikenga, E. (2015). The Impact of Leadership Style on Employee's Performance in an
Organization. Public Policy and Administration Research. 5 (1). pp. 193–205.
• Balaz, L. (2015). Study of emotional intelligence patterns with teachers working in public education. Practice
and Theory in Systems of Education, 10(1), 46-56.
• Bass, B. M. (1985). Leadership and performance beyond expectations. Free Press; Collier Macmillan.
• Blau, P. M. (1964). Exchange and power in social life. Transaction Publishers.
• Bontis, N., & Fitz-Enz, J. (2002). Intellectual capital ROI: a causal map of human capital antecedents and
consequents. Journal of Intellectual capital, 3(3), 223-247.
• Boyatzis, R. E. (2006). Using tipping points of emotional intelligence and cognitive competencies to predict
financial performance of leaders. Psicothema, 18(1), 124-131.
• Butler, C. J., & Chinowsky, P. S. (2006). Emotional intelligence and leadership behavior in construction
executives. Journal of Management in Engineering, 22 (3), 119-125.
• Carter, R. (2015). Connecting financial performance with effective leadership. [Online]. Available from:
https://www.aim.com.au/blog/connecting-financial-performance-effective-leadership.
• Choudhary, A., Akhtar, S., & Zaheer, A. (2013). Impact of transformational and servant leadership on
organizational performance: A comparative analysis. Journal of Business Ethics, 116(2), 433-440. doi:
10.1007/s10551-012-1470-8
• Cooke, R. A. & Szumal, J. L. (1993). Measuring normative beliefs and shared behavioral expectations in
organizations: The reliability and validity of the organizational culture inventory. Psychological Reports, 72, pp.
1299-1330.
• Cooke, R. A. & Lafferty, J.C. (1982). Level I: Life styles inventory an instrument for assessing and changing
the self-concept of organizational members. Plymouth, Michigan: Human Synergistics.
• Danaeefard H., Salehi A., Hasiri A., Noruzi M.R. (2012). How emotional intelligence and organizational culture
contribute to shaping learning organization in public service organization. African Journal of Business
Management, 6 (5) 1921 – 1931.
• Danaeefard, H., Salehi, A., Hasiri, A., & Noruzi, M. R. (2012). How emotional intelligence and organizational
culture contribute to shaping learning organization in public service organizations. African Journal of Business
Management, 6 (5), 1921-1931.
• Dwirantwi E.A. (2012). Organizational culture and its effect on productivity: The case study of La Community
Bank (thesis for commonwealth executive masters of Public Administration) Kwame Nkrumah University of
Science and Technology.
• Erkutlu, H. (2008). The impact of transformational leadership on organizational and leadership effectiveness:
The Turkish case. Journal of Management Development. Vol. 27 No. 7. pp. 708-726.
• Fiedler, F. E. (1978). The contingency model and the dynamics of the leadership process. Advances in
experimental social psychology, 11, 59-112.
• Goleman, D. (1998). Working With Emotional Intelligence. New York: Bantam.
• Goleman D, Boyatzis R, McKee A (2002). “Primal leadership: Realizing the power of emotional intelligence”,
Harvard Business School Press, Boston, 2002.
• Graen, G. B., & Uhl-Bien, M. (1995). Relationship-based approach to leadership: Development of leader-
member exchange (LMX) theory of leadership over 25 years: Applying a multi-level multi-domain perspective.
The leadership quarterly, 6(2), 219-247.
• Gumbus, A., Bellhouse, D. E., & Lyons, B. (2003). A three year journey to organizational and financial health
using the balanced scorecard: a case study at a Yale New Haven health system hospital. The Journal of Business
and Economic Studies, 9(2), 54.
• Hernandez, J. (2015). How do managers handle organizational rumors effectively, and does emotional
inte l l igence help? A qual i tat ive inquiry . [Onl ine] . Capel la Univers i ty. Avai lable f rom:
http://webcache.googleusercontent.com/search?q=cache:http://gradworks.umi.com/36/82/3682577.html
&gws_rd=cr&ei=KHtqV6-7GMHN0gTS_I-wBA.
• Higgs, M.J. & McGuire, M. 2001, 'Emotional intelligence and culture: An exploration of the relationship
between individual emotional intelligence and organisational culture', Working Paper Series. Greenlands,
Henley on Thames: Henley Management College.
• Higgs, M. (2004). A study of the relationship between emotional intelligence and performance in UK call
centers. Journal of Managerial Psychology, Vol. 19, pp. 442-54.
• Hoxha, A. (2015). Empowerment and trust as mediators of the relationship between transformational
leadership and organizational effectiveness. European Journal of Economic & Political Studies, 8(1), 43-60.
http://www.ejeps.com/index.php/ejeps
• Igbinovia, M. O., & Popoola, S.O. (2016). Organizational Culture and Emotional Intelligence as Predictors of Job
Performance among Library Personnel in Academic Libraries in Edo State, Nigeria. Journal of Information
Science Theory and Practice, 4(2): 34-52.
• Danquah E. (2014). The effects of elements of culture and personality on emotional intelligence levels in
service delivery: A banking service provider's perspective. International Journal of Business Management and
Research, 4 (3) 23 – 40.
• Dele, A.O., Adegboyega, O.I. & Taiwo, A.K. (2015). An Empirical Investigation of Leadership Styles and Their
Effect on Organisational Performance of Banks in Ado Ekiti, Nigeria.
• Downey L. A., Papageorgiou V., Stough C. (2006). Examining the relationship between leadership, emotional
intelligence and intuition in senior female managers. Leadership and Organization Development Journal, 27
(4) 250 – 264.
ISSN: 0971-1023 | NMIMS Management ReviewVolume XXXIII January 2017
ISSN: 0971-1023 | NMIMS Management ReviewVolume XXXIII January 2017
Emotional intelligence - the moderator of leadership styles and performance Emotional intelligence - the moderator of leadership styles and performance52 53
cities of India, and therefore street
Contents
mall farmers. Majority of the
farmers (82%) borrow less than
Rs 5 lakhs, and 18% borrow
between Rs 5 – 10 lakhs on a
per annum basis. Most farmers
(65.79%) ar
Table source heading
Table 23: The Results of Mann-Whitney U Test for DOWJONES Index Daily ReturnsDr. Rosy Kalra
Mr. Piyuesh Pandey
References
References

References
• Abbett L., Coldham A., Whisnant R. (2010). Organizational culture and the success of corporate sustainability
initiatives: An empirical analysis using the competing values framework (unpublished M.Sc dissertation)
University of Michigan.
• Abbott, A., & Banerji, K. (2003). Strategic flexibility and firm performance: the case of US based transnational
corporations. Global Journal of Flexible Systems Management, 4(1/2), 1.
• Ahuja, S. (2015). Job performance: Getting influenced by emotional intelligence. American International
Journal of Research in Humanities, Arts and Social Sciences, 15(1), 258-263.
• Akhtar, S., Ibrahim, M., Riaz, M., & Hussain, S.M. (2015). Impact of organizational culture and emotional
intelligence on educational sector performance. Research on Humanities and Social Sciences, 5(15), 91-95.
• Babatunde, O. & Ikenga, E. (2015). The Impact of Leadership Style on Employee's Performance in an
Organization. Public Policy and Administration Research. 5 (1). pp. 193–205.
• Balaz, L. (2015). Study of emotional intelligence patterns with teachers working in public education. Practice
and Theory in Systems of Education, 10(1), 46-56.
• Bass, B. M. (1985). Leadership and performance beyond expectations. Free Press; Collier Macmillan.
• Blau, P. M. (1964). Exchange and power in social life. Transaction Publishers.
• Bontis, N., & Fitz-Enz, J. (2002). Intellectual capital ROI: a causal map of human capital antecedents and
consequents. Journal of Intellectual capital, 3(3), 223-247.
• Boyatzis, R. E. (2006). Using tipping points of emotional intelligence and cognitive competencies to predict
financial performance of leaders. Psicothema, 18(1), 124-131.
• Butler, C. J., & Chinowsky, P. S. (2006). Emotional intelligence and leadership behavior in construction
executives. Journal of Management in Engineering, 22 (3), 119-125.
• Carter, R. (2015). Connecting financial performance with effective leadership. [Online]. Available from:
https://www.aim.com.au/blog/connecting-financial-performance-effective-leadership.
• Choudhary, A., Akhtar, S., & Zaheer, A. (2013). Impact of transformational and servant leadership on
organizational performance: A comparative analysis. Journal of Business Ethics, 116(2), 433-440. doi:
10.1007/s10551-012-1470-8
• Cooke, R. A. & Szumal, J. L. (1993). Measuring normative beliefs and shared behavioral expectations in
organizations: The reliability and validity of the organizational culture inventory. Psychological Reports, 72, pp.
1299-1330.
• Cooke, R. A. & Lafferty, J.C. (1982). Level I: Life styles inventory an instrument for assessing and changing
the self-concept of organizational members. Plymouth, Michigan: Human Synergistics.
• Danaeefard H., Salehi A., Hasiri A., Noruzi M.R. (2012). How emotional intelligence and organizational culture
contribute to shaping learning organization in public service organization. African Journal of Business
Management, 6 (5) 1921 – 1931.
• Danaeefard, H., Salehi, A., Hasiri, A., & Noruzi, M. R. (2012). How emotional intelligence and organizational
culture contribute to shaping learning organization in public service organizations. African Journal of Business
Management, 6 (5), 1921-1931.
• Dwirantwi E.A. (2012). Organizational culture and its effect on productivity: The case study of La Community
Bank (thesis for commonwealth executive masters of Public Administration) Kwame Nkrumah University of
Science and Technology.
• Erkutlu, H. (2008). The impact of transformational leadership on organizational and leadership effectiveness:
The Turkish case. Journal of Management Development. Vol. 27 No. 7. pp. 708-726.
• Fiedler, F. E. (1978). The contingency model and the dynamics of the leadership process. Advances in
experimental social psychology, 11, 59-112.
• Goleman, D. (1998). Working With Emotional Intelligence. New York: Bantam.
• Goleman D, Boyatzis R, McKee A (2002). “Primal leadership: Realizing the power of emotional intelligence”,
Harvard Business School Press, Boston, 2002.
• Graen, G. B., & Uhl-Bien, M. (1995). Relationship-based approach to leadership: Development of leader-
member exchange (LMX) theory of leadership over 25 years: Applying a multi-level multi-domain perspective.
The leadership quarterly, 6(2), 219-247.
• Gumbus, A., Bellhouse, D. E., & Lyons, B. (2003). A three year journey to organizational and financial health
using the balanced scorecard: a case study at a Yale New Haven health system hospital. The Journal of Business
and Economic Studies, 9(2), 54.
• Hernandez, J. (2015). How do managers handle organizational rumors effectively, and does emotional
inte l l igence help? A qual i tat ive inquiry . [Onl ine] . Capel la Univers i ty. Avai lable f rom:
http://webcache.googleusercontent.com/search?q=cache:http://gradworks.umi.com/36/82/3682577.html
&gws_rd=cr&ei=KHtqV6-7GMHN0gTS_I-wBA.
• Higgs, M.J. & McGuire, M. 2001, 'Emotional intelligence and culture: An exploration of the relationship
between individual emotional intelligence and organisational culture', Working Paper Series. Greenlands,
Henley on Thames: Henley Management College.
• Higgs, M. (2004). A study of the relationship between emotional intelligence and performance in UK call
centers. Journal of Managerial Psychology, Vol. 19, pp. 442-54.
• Hoxha, A. (2015). Empowerment and trust as mediators of the relationship between transformational
leadership and organizational effectiveness. European Journal of Economic & Political Studies, 8(1), 43-60.
http://www.ejeps.com/index.php/ejeps
• Igbinovia, M. O., & Popoola, S.O. (2016). Organizational Culture and Emotional Intelligence as Predictors of Job
Performance among Library Personnel in Academic Libraries in Edo State, Nigeria. Journal of Information
Science Theory and Practice, 4(2): 34-52.
• Danquah E. (2014). The effects of elements of culture and personality on emotional intelligence levels in
service delivery: A banking service provider's perspective. International Journal of Business Management and
Research, 4 (3) 23 – 40.
• Dele, A.O., Adegboyega, O.I. & Taiwo, A.K. (2015). An Empirical Investigation of Leadership Styles and Their
Effect on Organisational Performance of Banks in Ado Ekiti, Nigeria.
• Downey L. A., Papageorgiou V., Stough C. (2006). Examining the relationship between leadership, emotional
intelligence and intuition in senior female managers. Leadership and Organization Development Journal, 27
(4) 250 – 264.
ISSN: 0971-1023 | NMIMS Management ReviewVolume XXXIII January 2017
ISSN: 0971-1023 | NMIMS Management ReviewVolume XXXIII January 2017
Emotional intelligence - the moderator of leadership styles and performance Emotional intelligence - the moderator of leadership styles and performance52 53
cities of India, and therefore street
Contents
mall farmers. Majority of the
farmers (82%) borrow less than
Rs 5 lakhs, and 18% borrow
between Rs 5 – 10 lakhs on a
per annum basis. Most farmers
(65.79%) ar
Table source heading
Table 23: The Results of Mann-Whitney U Test for DOWJONES Index Daily ReturnsDr. Rosy Kalra
Mr. Piyuesh Pandey
References
References
• Jordan P. J., Ashkanasy N. M., Härtel C. E. (2002). Emotional intelligence as a moderator of emotional and
behavioral reactions to job insecurity. Academy of Management Review, 273, 361 – 372
• Kukandeh, J.E. & Del, M.R.A. (2015). The Relationship between Transformational Leadership and
Organizational Performance (Case Study: Hospitals and Therapeutic Centers of Hormozgan). Journal of
Applied Environmental and Biological Sciences. [Online]. 5 (4). pp. 37–39. Available from:
http://www.textroad.com/pdf/JAEBS/J. Appl. Environ. Biol. Sci., 5(4S)37-39, 2015.pdf.
• Lawrence, P. R., & Lorsch, J. W. (1969). Developing Organizations: Diagnosis and Action.
• Leonard, M. (2011). Leadership Styles And Its Effect On Corporate Culture.
• Lee, K. (2015). Going Through the Emotions: How Emotional Intelligence Skills Can Boost Business Results.
Workforce. [Online]. 1 December. Available from: http://www.workforce.com/2015/12/01/going-through-
the-emotions-how-emotional-intelligence-skills-can-boost-business-results/.
• Lo, M., Ramayah, T., Isa, A.H.M. & Jais, M. (2013). Leadership styles and financial services performance.
International Journal of Management Practice. 6 (4). pp. 299–319.
• Lindebaum, D., & Cartwright, S. (2010). A critical examination of the relationship between emotional
intelligence and transformational leadership. Journal of Management Studies, 47 (7), 1317-1342.
• Liptak, J. (2005). Using emotional intelligence to help college students succeed in the workplace. Journal of
Employment Counseling, 42(4), 171-178.
• Mayer, J. D., Salovey, P., & Caruso, D. R. (2002). Mayer-Salovey-Caruso Emotional Intelligence Test, MSCEIT
User's Manual. New York: Multi-Health Systems, Inc.
• Mayer, J. D., Salovey, P., & Caruso, D. R. (2000). Models of emotional intelligence. In R. Sternberg (Ed.),
Handbook of intelligence (pp. 396-420). Cambridge, MA: Cambridge University Press.
• McGahan, A. M., & Porter, M. E. (2002). What do we know about variance in accounting profitability?
Management Science, 48(7), 834-851.
• Nelson, D., & Low, G., “Emotional intelligence: Achieving academic and career excellence (2nd ed.)”, Prentice
Hall, Upper Saddle River, NJ, 2011.
• Obiwuru, T. C., Okwu, A.T., Akpa, V.O., & Nwankwere, I.A. (2011). Effects of Leadership Style on Organisational
Performance: Journal of Business and Management Research, l.1(7),100-111.
• Ovans, A. (2015). How Emotional Intelligence Became a Key Leadership Skill. Harvard Business Review.
[Online]. Available from: https://hbr.org/2015/04/how-emotional-intelligence-became-a-key-leadership-
skill.
• Overall, J. (2015). A conceptual framework of innovation and performance: The importance of leadership,
• Saasongu, N. (2015). Effects of Leadership Style on Organizational Performance in Small and Medium Scale
Enterprises (SMES) in Nigeria. , 2(2). International Journal of Research in Management & Business Studies
• Salovey, P., & Sluyter, D. (Eds.) (1997). Emotional development and emotional intelligence. New York: Basic
Books.
• Schein, E. H. (2010). (4th Ed.). San Francisco: Jossey-Bass.Organizational culture and leadership
• Sin J.L.K., Yazdanifard R. (2014). The relationship between emotional intelligence, transformational leadership
and organizational culture.
• Slack, T. (1997). Understanding sport organizations: The application of organization theory. Champaign, IL:
Human Kinetics.
• Stone, A. G., Russell, R. F., & Patterson, K. (2004). Transformational versus servant leadership: A difference in
leader focus. 25(4), 349-361. Leadership & Organization Development Journal,
• The Ken Blanchard Companies, “Critical leadership skills: Key traits that can make or break today's leaders”,
[Electronic Version]. http://www.kenblanchard.com/img/pub/pdf_critical_leadership_skills.pdf 2006
• Trmal, S.A., Bustamam, U.S.A., & Mohamed, Z.A. (2015). The effect of transformational leadership in achieving
high performance workforce that exceeds organizational expectation: A study from a global and Islamic
perspective. 7(2), 88-94. http://www.gbmr.ioksp.com/Global Business & Management Research,
• Ugoani, J. N. N. (2015). Emotional Intelligence and Transformation of Management Education for
Organizational Profitability (Ijm&P), 6(4).. Independent Journal of Management & Production
• Van Eeden, R., Cilliers, F., & van Deventer, V. (2008). Leadership styles and associated personality traits: Support
for the conceptualisation of transactional and transformational leadership. [Article]. South African Journal of
Psychology, 38(2), 253-267.
• Vroom, V. H. (1964). Work and motivation. New York: Wiley.
• Wang, H., Law, K. S., Hackett, R. D., Wang, D., & Chen, Z. X. (2005). Leader-member exchange as a mediator of
the relationship between transformational leadership and followers' performance and organizational
citizenship behavior. , (3), 420-432.Academy of Management Journal 48
• Weinberger, L. A. (2003). An examination of the relationship between emotional intelligence, leadership style,
and perceived leadership effectiveness. Dissertation Abstracts International, 64(11), 5828.
• Yavas, U., & Shemwell, D. J. (2001). Modified importance-performance analysis: an application to hospitals.
• Issa, H.-E. Al & Mahmood, R. (2016). Emotional Intelligence and Transformational Leadership: The Moderating
Effect of Organizational Culture. The International Journal Of Business & Management. [Online]. 4 (4). pp.
212–221. Available from: http://www.theijbm.com/wp-content/uploads/2016/04/28.-BM1604-071.pdf.
• Jason A, C., Jeffery A, L. & Wesson, M.J. (2015). Organizational behavior: Improving performance and
commitment in the workplace. New York, NY: McGraw-Hill Education.
• Jacques, E. T. (2009). The Relationships between Emotional Intelligence and the Academic Performance
and Selection of a Major of College Students. Retrieved July 13. 2010, from PreQuest database.
relationship quality, and knowledge management. Academy of Entrepreneurship Journal, 21(2), 41-54.
http://www.alliedacademies.org/academy-of-entrepreneurship-journal/
• Peteraf, M. (1993). The cornerstones of competitive advantage: A resource-based view. Strategic
Management Journal, 14(3), 179–191.
• Pizer M. , Härtel C. E. J (2005). For better or for worse: Organizational culture and emotions, Lawrence Erlbaum
Associates Mahwah, NJ.
• Pryke, S., Lunic, D. & Badi, S. (2015). The effect of leader emotional intelligence on leader–follower chemistry:
a study of construction project managers. Construction Management and Economics. [Online]. 33 (8). pp.
603–624. Available from: http://www.tandfonline.com/doi/full/10.1080/01446193.2015.1078901.
• Rezaeian, A. (2007). Principles of organization and management. 10th Ed. Tehran: SAMT Publication.
ISSN: 0971-1023 | NMIMS Management ReviewVolume XXXIII January 2017
ISSN: 0971-1023 | NMIMS Management ReviewVolume XXXIII January 2017
Emotional intelligence - the moderator of leadership styles and performance Emotional intelligence - the moderator of leadership styles and performance54 55
cities of India, and therefore street
Contents
mall farmers. Majority of the
farmers (82%) borrow less than
Rs 5 lakhs, and 18% borrow
between Rs 5 – 10 lakhs on a
per annum basis. Most farmers
(65.79%) ar
Table source heading
Table 23: The Results of Mann-Whitney U Test for DOWJONES Index Daily ReturnsDr. Rosy Kalra
Mr. Piyuesh Pandey
References
References

Dhruv Desai is a Ph.D. scholar whose background spans many industries and cultures, including
Technology, Aviation, Telecom, and BFSI & IT/ES consulting. Dhruv is a strategic thinker and a proven
problem solver with a thorough understanding of the dynamic role that talent management must play in
the 21st Century workforce. He is a versatalist with expertise and laurels in the fields of HRD, Leadership,
Team building, Strategic planning, Change management, Executive coaching, Business consulting,
Performance management, CRM and Quality management. He has constantly maintained his
grounding in academics as a Research scholar at NMIMS University where he has worked on his Ph.D.
thesis in areas including Leadership, Competencies, empowerment and Operational excellence. Dhruv
has been honoured with many Awards and Accolades such as HR Leadership Award in February 2015 by
Global HR Excellence Conference, HR Achiever of the Year Award in February 2014 by Dream Companies
to Work For, HR Leadership Award in February 2013 by ET NOW News Channel, etc. He can be reached at
Manjari Srivastava is a Professor in Human Resource Management and Behavioural Sciences at School
of Business Management, NMIMS University, Mumbai. She has Masters in Psychology and holds Ph.D.
in the area of Organizational Behaviour. With work experience of 18 years, Manjari is deeply involved
with teaching, training, mentoring and research activities. Manjari has published vastly both in national
and international journals, and has participated in various conferences both nationally and
internationally. She has also published cases with Ivey publishers Canada, one of the world's leading
business case publishers. She can be reached at [email protected]
International Journal of Health Care Quality Assurance, 14(3), 104-110.
• Yilmaz, C. & Ergun, E. (2008). Organizational culture and firm effectiveness: An examination of relative effects
of culture traits and the balanced culture hypothesis in an emerging economy. , 43, Journal of World Business
290–306.
ISSN: 0971-1023 | NMIMS Management ReviewVolume XXXIII January 2017
Emotional intelligence - the moderator of leadership styles and performance56
cities of India, and therefore street
Contents
mall farmers. Majority of the
farmers (82%) borrow less than
Rs 5 lakhs, and 18% borrow
between Rs 5 – 10 lakhs on a
per annum basis. Most farmers
(65.79%) ar
Table source heading
Table 23: The Results of Mann-Whitney U Test for DOWJONES Index Daily ReturnsDr. Rosy Kalra
Mr. Piyuesh Pandey
References
References

ISSN: 0971-1023 | NMIMS Management ReviewVolume XXXIII January 2017
Abstract
Over a long period of time, stocks with low beta have
cons istent ly outperformed their h igh beta
counterparts across developed and emerging markets
alike. We explore the presence of low beta anomaly
and its robustness after controlling for size, value and
momentum factors in the Indian stock markets. We
have chosen the universe of past and present
constituent stocks of the Nifty 500 index in our study
for the period 2001 to 2014. We study relative risk-
adjusted performance and portfolio characteristics of
three different zero-cost, long-short beta arbitrage
strategies including beta neutral and negative net beta
version of strategies. We find all the beta arbitrage
strategies deliver superior risk adjusted performance
in the Indian markets, though of different magnitude,
with a clear tilt away from the value factor and towards
the momentum factor. However, we don't find any tilt
towards size factor. Our study provides the framework
for choosing an implementable beta arbitrage strategy
consistent with the investor's investment objective.
JEL classification: G11, G12, G14, G15
Keywords: market efficiency, betting against beta, low
risk anomaly, volatility effect
Beta Anomaly and ComparativeAnalysis of Beta Arbitrage Strategies
Nehal Joshipura
Mayank Joshipura
Beta Anomaly and Comparative Analysis of Beta Arbitrage Strategies57
cities of India, and therefore street
Contents
mall farmers. Majority of the
farmers (82%) borrow less than
Rs 5 lakhs, and 18% borrow
between Rs 5 – 10 lakhs on a
per annum basis. Most farmers
(65.79%) ar
Table sub source heading
** p < .01 + Reliability coefficie
References
Table 23: The Results of Mann-Whitney U Test for DOWJONES Index Daily Returns

Beta Anomaly and Comparative Analysis of Beta Arbitrage Strategies ISSN: 0971-1023 | NMIMS Management ReviewVolume XXXIII January 2017
ISSN: 0971-1023 | NMIMS Management ReviewVolume XXXIII January 2017
Beta Anomaly and Comparative Analysis of Beta Arbitrage Strategies
1. Introduction
An investment strategy based on investing in a
portfolio that consists of low risk, stable stocks that
consistently outperforms a matching portfolio of high
risk, volatile stocks as well as market portfolio on risk
adjusted basis. This phenomenon is widely known as
risk anomaly or volatility puzzle.
In this study, we explore the presence of low beta
anomaly and its robustness, after controlling for size,
value and momentum factors, in the Indian stock
markets. We have chosen the past and present
constituent stocks of the Nifty 500 index for our study
over a period 2001 to 2014.
We answer the following questions with respect to the
Indian equity markets:
1. Does beta anomaly exist after removing small and
illiquid stocks from the universe?
2. Does beta anomaly remain robust after controlling
for size, value and momentum factors?
3. What are the alternative ways of implementing
beta arbitrage strategies and how to compare
different beta arbitrage strategies?
We establish the following: (a) Beta anomaly is robust
even after eliminating small and illiquid stocks from
the universe. (b) Beta anomaly is robust after
controlling for size, value and momentum factors, and
is not proxy for any other factors. (c) We compare
relative attractiveness of alternative beta arbitrage
strategies and we find that all beta arbitrage strategies
deliver different magnitudes of superior risk-adjusted
performance in Indian markets with a clear tilt away
from the value factor and towards the momentum
factor. We don't find any tilt towards size factor. (d)
While all strategies offer superior risk-adjusted
performance, they have very different ex-post beta
and therefore, choice of strategy is a function of the
investment objective.
This study highlights key differences in characteristics
of alternative beta arbitrage strategies and it provides
a simple framework for choosing an implementable
beta arbitrage strategy consistent with the investment
objective.
Risk anomaly is one of the strongest anomalies. It has
remained largely unexplored by researchers and
under-exploited by practitioners till the dawn of the
twenty first century. This anomaly is against the very
spirit of a strictly positive relationship between risk
and return depicted by classical asset pricing theories
like the capital asset pricing model (CAPM). According
to CAPM, systematic risk as measured by beta is the
sole driver of the expected return. In the CAPM world,
market portfolio is the portfolio with the highest
Sharpe ratio, which implies excess return per unit of
risk. Rational investors must hold a combination of
market portfolio and long/short position in risk-free
asset to meet their unique risk preferences. Risk-
averse investors de-lever their holding in the market
portfolio by investing a fraction of their capital in the
market portfolio and remaining capital in risk-free
assets. On the contrary, investors with a higher risk
appetite use leverage - by borrowing money to
increase expected returns on the market portfolio. In
the imperfect real world outside the C A P M
framework, various categories of investors including
retail investors, mutual funds and pension funds may
not have unconstrained access to leverage. Such
investors tend to exhibit preference for high beta
security in anticipation to earn higher expected
returns compared to the market portfolio.
Early evidence of low risk anomaly and flatter security
market line for US stocks can be traced back to the
early 1970s. Black (1972) and Black, Jensen and
Scholes (1972) first highlight that the security market
line is much flatter than predicted by CAPM, because
of the borrowing restrictions resulting in low beta
stocks having a positive and higher alpha. Haugen and
Heins (1975) were among the first to show that stocks
with low volatility of historical returns tend to
outperform those with higher volatility. However,
during hay days of market efficiency and CAPM, these
results were dubbed as a data mining exercise or an
aberration.
Subsequently after a long gap, research on risk
anomaly has picked up and since the beginning of the
twenty first century, many researchers have explored
low risk anomaly using various approaches. Studies
differ mainly on two counts - choice of risk measure
and method of portfolio construction approach. While
popular risk measures include idiosyncratic volatility,
standard deviation and beta, two popular portfolio
construction approaches are portfolio construction
based on ranking stocks using a risk measure and
constructing a minimum variance portfolio using
modern portfol io theory Markowitz (1952)
framework. More recent literature is focused on
finding rational and behavioral explanations to explain
the risk anomaly or to explain it away. Ang, Hodrick,
Xing and Zhang ((2006), (2009)) use idiosyncratic
volatility calculated as standard deviation of residuals
of daily stock returns regressed upon proxies for
market, size, value and momentum factors as defined
by Fama and French (1992) and Carhart (1997). They
report an inverse relationship between idiosyncratic
risk and expected returns across global markets.
Clarke, De Silva and Thorley (2006) report that
minimum variance portfolio in US markets provides
comparable or better-than-market returns with 25%
reduction in volatility. Blitz and Vliet (2007) find that
volatility effect is stronger than beta effect. They
further establish that volatility effect is a distinct effect
and is by no means disguised in other classic effects
such as size, value and momentum.
Baker and Haugen (2012), Blitz and Vliet (2007), and
Blitz, Pang and Vliet (2013) demonstrate that risk
anomaly is a global phenomenon. Baker, Bradley and
Wurgler (2011) use beta as well as volatility sorting,
using only large cap stocks in US market and
demonstrate that low beta-high alpha and high beta-
low alpha phenomenon persists even in large cap
stocks. They offer a series of explanations, rational as
well as behavioural, to explain persistence of such
anomaly. They argue that institutional investors'
mandate to focus on beating a benchmark, coupled
with borrowing and short-selling restrictions, hinders
their ability to exploit a low beta, high alpha
opportunity. As a result, they take exposure to high
beta, low alpha stocks.
Moreover, behavioural biases such as preference for
lottery, overconfidence and representativeness cause
investors to chase high beta stocks. This leads to price
increase in high beta stocks leading to lower returns in
the subsequent periods. Bali and Cakici (2008) argue
that the negative relationship shown by Ang, Hodrick,
Xing and Zhang (2006) between idiosyncratic volatility
and expected return is due to small, illiquid stocks only.
If these small stocks are excluded from the sample, a
puzzling negative relationship between idiosyncratic
volatility and expected returns turns insignificant. Bali,
Cakici and Whitelaw (2011) create a variable to
capture lottery-like payoff and show that an inverted
risk-return relationship between idiosyncratic risk and
expected return is due to investors' preference for
lottery-like payoffs. They also demonstrate that such
inverted relationship between risk and return cannot
be explained by skewness in distribution of returns. Fu
(2009) argues that an inverted relationship between
idiosyncratic risk and expected return is due to short
term reversals. In line with Black (1993), Frazzini and
Pedersen (2010), and Hong and Sraer (2012) also
attribute an anomalous flat-to-negative relationship
between risk and return to borrowing restrictions and
short selling constraints. Brennan (1993), Karceski
(2002), Falkenstein (2009), Blitz, Pang and Vliet (2013)
and Baker and Haugen (2012) argue that there is an
agency problem associated with delegated portfolio
management and also argue that the call option-like
58 59
cities of India, and therefore street
Contents
mall farmers. Majority of the
farmers (82%) borrow less than
Rs 5 lakhs, and 18% borrow
between Rs 5 – 10 lakhs on a
per annum basis. Most farmers
(65.79%) ar
Table sub source heading
** p < .01 + Reliability coefficie
References
Table 23: The Results of Mann-Whitney U Test for DOWJONES Index Daily Returns

fund manager's compensation structure tilts their
preference towards high risk stocks. Clarke, De Silva
and Thorley (2010) construct an additional factor
based on idiosyncratic volatility 'volatile-minus-stable
(VMS)' after controlling size effect and show that VMS
is an important factor in explaining a cross-section of
security returns.
While there are several strands of research emerging
on this exquisite anomaly of markets, we extend the
strand of beta arbitrage based investment strategy.
Black, Jensen and Scholes (1972) and Black (1993) first
provide a framework and evidence on how
unconstrained investors can exploit a flatter-than-
expected security market line. More recently, Frazzini
and Pedersen (2014), in their seminal work, extend the
scope of beta arbitrage by constructing betting against
beta (BAB) portfolios across several asset classes and
markets. They report large and significant risk-
adjusted returns. By design, 'betting against beta'
portfolios are market neutral on ex-ante basis because
of active use of levering of low beta portfolios and de-
levering of high beta portfolios. Asness, Frazzini and
Pedersen (2014) demonstrate that betting against
beta strategies are not merely industry bets as
suspected by many. They establish it by constructing
industry neutral BAB factor.
The rest of the paper is organized as follows. Section 2
discusses data and methodology, Section 3 discusses
results and Section 4 offers the conclusion.
2. Empirical Model
We follow Baker, Bradley and Wurgler (2011), Blitz,
Pang and Vliet (2013), Frazzini and Pedersen (2014)
and Garcia-Feijoo, Kochard, Sullivan and Wang (2015)
to build our empirical model.
3 . Data and Methodology
3.1. Data
We obtained adjusted monthly closing stock price,
earnings to price, market cap, trading volume and
turnover data from Capitaline database for all past and
present constituents of Nifty 500 index for the period
of January 2001 to December 2014. Nifty 500 stocks
cover close to 95% of free float market capitalization of
the stocks listed on NSE. These stocks represent
almost the full universe of the Indian market and at the
same time, exclude penny and highly illiquid stocks
from the sample. We have taken Fama-French and
Momentum factors for the Indian Stock markets and
risk-free rate for Indian markets from the IIM
Ahmedabad data library from its website (Agarwalla,
Jacob, & Varma, 2013).
3.2. Methodology
3.2.1. Univariate Analysis
We calculate average returns for each quintile
portfolio for month t + 1 for the beta sorted quintile
portfolios constructed at the end of period t. We
repeat this process every month. We then measure
returns, standard deviation, ex-post beta, CAPM style,
single factor alpha and Sharpe ratio for the resultant
time series of quintile portfolios over the entire study
period.
3.2.2. Bivariate Analysis
We perform bivariate analysis using double sort, a
robust non-parametric technique to evaluate whether
the beta effect is indeed a separate effect or the one
which is disguised in one of the other well-known
effects such as value, size and momentum. We first
sort stocks on one of the control factors (size, value or
momentum) and construct quintile portfolios. Then,
we sort stocks on beta within each control factor
quintile portfolio. We construct our factor neutral beta
quintile portfolios that represent every quintile of
control factor.
3.2.3. Fama-French three factor and Fama-French-
Carhart four factor regressions.
We compare performance of all three long-short, beta
arbitrage portfolios using single factor CAPM style
alpha, calculated using equation and Fama-French,
three-factor alpha and Fama-French-Carhart, four-
factor alpha using equations 5 and 6 respectively. We
also analyze factor loadings of alternative beta
arbitrage strategies.
Beta Anomaly and Comparative Analysis of Beta Arbitrage Strategies ISSN: 0971-1023 | NMIMS Management ReviewVolume XXXIII January 2017
ISSN: 0971-1023 | NMIMS Management ReviewVolume XXXIII January 2017
Beta Anomaly and Comparative Analysis of Beta Arbitrage Strategies60 61
cities of India, and therefore street
Contents
mall farmers. Majority of the
farmers (82%) borrow less than
Rs 5 lakhs, and 18% borrow
between Rs 5 – 10 lakhs on a
per annum basis. Most farmers
(65.79%) ar
Table sub source heading
** p < .01 + Reliability coefficie
References
Table 23: The Results of Mann-Whitney U Test for DOWJONES Index Daily Returns

4. Empirical Results
We discuss results of our study in this section.
Appendix 1 reports summary statistics of number of
stocks used for each iteration in the study with their
median price to earnings multiple and median market
capitalization.
4.1. Univariate Analysis
Table 1 reports performance of beta quintile
portfolios, zero cost, low beta minus high beta
portfolio and universe portfolio.
Table 1: Main results (Annualized) for quintile portfolios based on historical beta
This table reports beta-sorted calendar-time portfolio
returns. At the beginning of each month, stocks are
sorted in ascending order based on their ex-ante beta
at the end of the previous month. The ranked stocks
are assigned to one of the five quintile portfolios. The
portfolios are rebalanced every month. The first five
columns report results of beta sorted quintile
portfolios; the sixth column reports the result of zero
cost, low-beta minus high-beta portfolio return, that
is, long the low beta portfolio and short the high beta
portfolio. The last column reports results of universe
portfolio, which is an equally weighted portfolio of all
the stocks. All the beta quintile portfolios are equally
weighted by design. The first two rows report
annualized excess returns and standard deviation of
excess returns. Subsequent rows report Sharpe ratios
for beta quintile portfolios, followed by t-value
showing the difference between Sharpe ratio of the
beta quintile portfolios over universe. The next two
rows show average estimated beta (ex-ante) at the
portfolio construction stage, beta (realized) is realized
loading on the universe portfolio. CAPM-style alpha is
the intercept in a regression on monthly excess return
is annualized and reported with corresponding t-
statistics for all portfolios.
P1
(low beta)
P2 P3 P4 P5
(high beta)
low-beta minus
high-beta
Universe (EWI)
Excess return (Annualized %)
6.30% 6.16% 3.11% -0.04% -8.84% 15.15% 1.34%
Standard Deviation %
22.55% 28.98% 33.19% 38.33% 45.80% 27.88% 33.18%
Sharpe ratio 0.28 0.21 0.09 0.00 -0.19 0.54 0.04
(t-value for difference over Universe)
8.12 9.53 5.15 -4.48 -9.71 2.97
Beta (ex-ante) 0.47 0.76 0.96 1.20 1.61 -1.14
Beta (realized) 0.65 0.86 1.00 1.16 1.35 -0.70 1.00
CAPM-style alpha
1.22% -0.60% -4.56% -9.00% -19.36% 20.58%
(t-value) 0.51 -0.33 -3.74 -6.73 -5.14 3.51
The first two rows report annualized returns over risk-
free return and corresponding standard deviation of
excess returns. Excess returns and standard deviations
show a definite trend as we move from top quintile,
low beta portfolio to bottom quintile, high beta
portfolio. Annualized excess return of low beta
portfolio is 6.3% and that is monotonically declining as
we move towards high beta portfolio. High beta
portfolio observes an annualized excess return of -
8.84%. The trend is exactly the reverse for standard
deviation. Annualized standard deviation of excess
returns for low beta portfolio is 22.55% and it keeps on
increasing, and the corresponding standard deviation
of high beta portfolio is as high as 45.8%. Zero cost, low
beta minus high beta, long-short portfolio reports an
annualized excess return of 15.5% and standard
deviation of 27.88%. Universe, a proxy for market
portfolio reports annualized excess return of 1.34%
and standard deviation of 33.88%. Clearly, a low beta
portfolio turns out to be a high-return, low-risk
portfolio. High beta portfolio turns out to be a low
return, high risk portfolio. Low beta portfolio is a
superior portfolio and dominates both high beta
portfolio as well as universe portfolio.
The following two rows report Sharpe ratios and
corresponding t-values showing significance of such
Sharpe ratio in comparison to Sharpe ratio of universe
portfolio. Sharpe ratio for low beta portfolio is 0.28,
which is the highest among beta quintile portfolios
with corresponding t-value of 8.12. Sharpe ratio keeps
on declining. A high-beta portfolio has Sharpe ratio of -
0.19 and corresponding t-value of -9.71%. The low
beta portfolio registers superior risk-adjusted
performance, whereas the high beta portfolio
registers inferior risk-adjusted performance over the
universe portfolio. Higher excess return and lower
standard deviation both contribute to superior
performance of low beta portfolio; converse is the case
with high beta portfolio, where lower excess return
and higher standard deviation both contribute to
inferior performance. The stark difference in the
performance of low beta portfolio and high beta
portfolio is captured in zero-cost, long low beta and
short high beta portfolio. Low beta minus high beta
portfolio registers Sharpe ratio of 0.54, which is
significantly higher compared to low beta portfolio.
However, such long-short portfolio is out of sync with
the market. It has a negative correlation of returns, -
0.82 in our sample. The next rows report both ex-ante
beta (beta calculated for ranking purpose) and ex-post
or realized beta of resultant time series of monthly
rebalanced quintile portfolios. Ex-ante beta for low
beta portfolio is 0.47, whereas realized beta is 0.65. For
a high beta portfolio, ex-ante beta is 1.65, whereas
realized beta is 1.35. It is evident that across quintile
variation in realized betas is much lesser than ex-ante
betas. However, it is worth noting that the low beta
portfolio constructed using ex-ante beta ranking
continues to have lowest realized beta and high beta
portfolio constructed using ex-ante beta ranking
continues to have the highest realized beta. The
pattern remains the same for other quintile portfolios
as well. The difference between the realized beta for
the low beta and high beta, portfolio is -0.7, which is
large and significant. These results indicate that betas
predicted from past returns are a strong predictor of
future betas.
The final two rows report CAPM-style single factor
alpha for beta quintile portfolios and zero-cost low
beta minus h igh beta port fo l io as wel l as
corresponding t-values. Single factor alpha for low
beta portfolio is 6.75% with corresponding t-value of
3.59, which is large and significant. Alpha declines
consistently as we move from low beta portfolio to
high beta portfolio. Alpha for high beta portfolio is -
10.65% with t-value of -3.41 that is substantially
negative and significant. Zero-cost, long low beta and
short high beta portfolio registers alpha of 16.08 with
corresponding t-value of 3.41. This clearly shows that
Beta Anomaly and Comparative Analysis of Beta Arbitrage Strategies ISSN: 0971-1023 | NMIMS Management ReviewVolume XXXIII January 2017
ISSN: 0971-1023 | NMIMS Management ReviewVolume XXXIII January 2017
Beta Anomaly and Comparative Analysis of Beta Arbitrage Strategies62 63
cities of India, and therefore street
Contents
mall farmers. Majority of the
farmers (82%) borrow less than
Rs 5 lakhs, and 18% borrow
between Rs 5 – 10 lakhs on a
per annum basis. Most farmers
(65.79%) ar
Table sub source heading
** p < .01 + Reliability coefficie
References
Table 23: The Results of Mann-Whitney U Test for DOWJONES Index Daily Returns
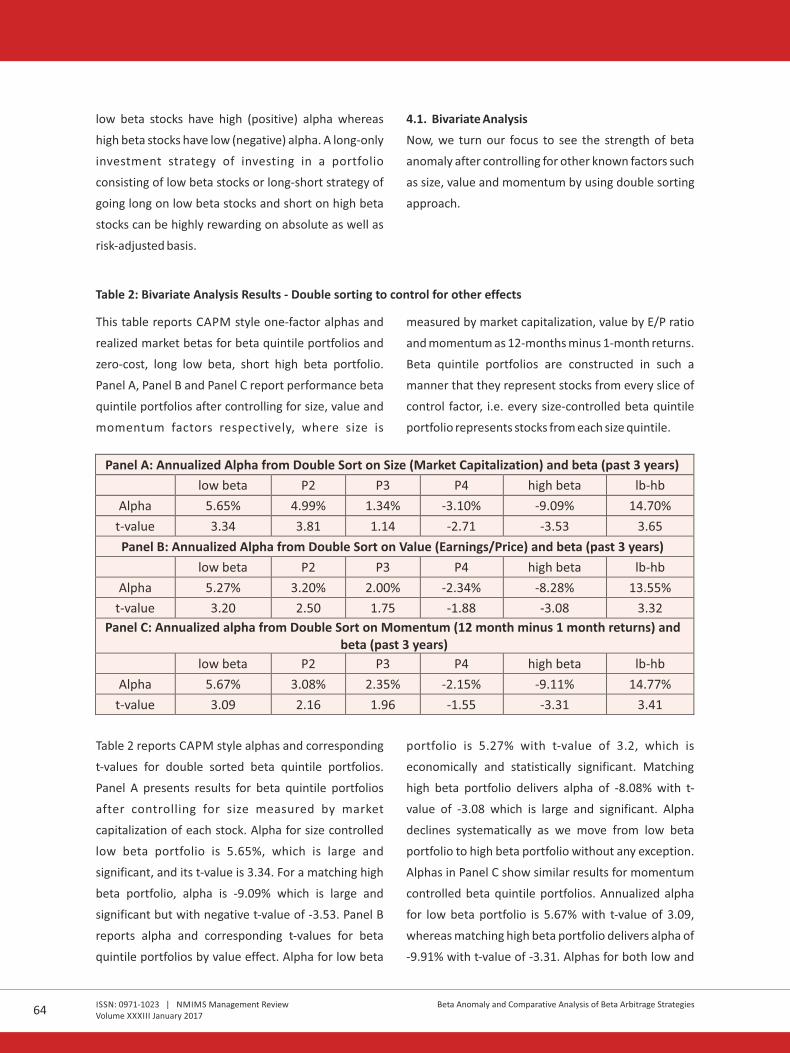
low beta stocks have high (positive) alpha whereas
high beta stocks have low (negative) alpha. A long-only
investment strategy of investing in a portfolio
consisting of low beta stocks or long-short strategy of
going long on low beta stocks and short on high beta
stocks can be highly rewarding on absolute as well as
risk-adjusted basis.
4 .1. Bivariate Analysis
Now, we turn our focus to see the strength of beta
anomaly after controlling for other known factors such
as size, value and momentum by using double sorting
approach.
Table 2: Bivariate Analysis Results - Double sorting to control for other effects
This table reports CAPM style one-factor alphas and
realized market betas for beta quintile portfolios and
zero-cost, long low beta, short high beta portfolio.
Panel A, Panel B and Panel C report performance beta
quintile portfolios after controlling for size, value and
momentum factors respectively, where size is
measured by market capitalization, value by E/P ratio
and momentum as 12-months minus 1-month returns.
Beta quintile portfolios are constructed in such a
manner that they represent stocks from every slice of
control factor, i.e. every size-controlled beta quintile
portfolio represents stocks from each size quintile.
Panel A: Annualized Alpha from Double Sort on Size (Market Capitalization) and beta (past 3 years)
low beta P2 P3 P4 high beta lb-hb
Alpha 5.65% 4.99% 1.34% -3.10% -9.09% 14.70%
t-value 3.34 3.81 1.14 -2.71 -3.53 3.65
Panel B: Annualized Alpha from Double Sort on Value (Earnings/Price) and beta (past 3 years)
low beta P2 P3 P4 high beta lb-hb
Alpha 5.27% 3.20% 2.00% -2.34% -8.28% 13.55%
t-value 3.20 2.50 1.75 -1.88 -3.08 3.32
Panel C: Annualized alpha from Double Sort on Momentum (12 month minus 1 month returns) and beta (past 3 years)
low beta P2 P3 P4 high beta lb-hb
Alpha 5.67% 3.08% 2.35% -2.15% -9.11% 14.77%
t-value 3.09 2.16 1.96 -1.55 -3.31 3.41
Table 2 reports CAPM style alphas and corresponding
t-values for double sorted beta quintile portfolios.
Panel A presents results for beta quintile portfolios
after controlling for size measured by market
capitalization of each stock. Alpha for size controlled
low beta portfolio is 5.65%, which is large and
significant, and its t-value is 3.34. For a matching high
beta portfolio, alpha is -9.09% which is large and
significant but with negative t-value of -3.53. Panel B
reports alpha and corresponding t-values for beta
quintile portfolios by value effect. Alpha for low beta
portfolio is 5.27% with t-value of 3.2, which is
economically and statistically significant. Matching
high beta portfolio delivers alpha of -8.08% with t-
value of -3.08 which is large and significant. Alpha
declines systematically as we move from low beta
portfolio to high beta portfolio without any exception.
Alphas in Panel C show similar results for momentum
controlled beta quintile portfolios. Annualized alpha
for low beta portfolio is 5.67% with t-value of 3.09,
whereas matching high beta portfolio delivers alpha of
-9.91% with t-value of -3.31. Alphas for both low and
high beta portfolios are large and significant but have
opposite signs. Alphas for zero cost, low-beta minus
high beta portfolio for size, value and momentum
factors are 14.70% (t-value of 3.65), 13.55% (t-value of
3.32) and 14.77% (t-value of 3.41) respectively; all are
large and significant. These alphas are not materially
different from one another. They are also not
materially different from alpha of a matching portfolio
without factor control. This shows that beta effect is
robust, economically large and statistically significant
after controlling for size, value and momentum effects.
After establishing the robustness of beta anomaly
using univariate and bivariate analysis, we look at
relative performance of various long low-beta short
high-beta arbitrage strategies. As we can see from
Table 1, zero-cost, long-short, lb-hb portfolio, delivers
large annualized alpha of 16.08%. However, it has the
market beta of -0.7. The portfolio has zero cost but it is
not a beta-neutral portfolio. From a practical
perspective, such high negative beta may be an
undesirable trait for most investors unless such
portfolio is considered as a separate asset class and is
used as an effective hedge to overall market facing
portfolio.
Table 3: Performance of various beta arbitrage strategies
This table reports CAPM style one-factor alpha,
realized market betas, 3-factor alphas controlling for
size and value factor and 4-factor alphas after
controlling for size, value and momentum factors for
different zero-cost, beta arbitrage strategies. While lb-
hb portfolio is zero-cost portfolio, it is not beta neutral,
whereas both BAB and Alt-BAB are constructed by
making them beta neutral on ex-ante basis at the end
of each month.
lb-hb BAB Alt-BAB CAPM style alpha 16.08% 16.06% 10.81% (t-value) 3.39 3.35 3.31 beta (realized) -0.70 -0.05 -0.03 3-factor alpha
20.22%
19.63%
13.26%
t-value 4.70
4.36
4.33
4-factor alpha
16.37%
15.48%
10.43%
t-value 4.27 3.89 3.85
We report and analyze results of zero-cost, negative
beta, long-short portfolio, with two alternative zero-
cost, ex-ante, beta-neutral, long-short portfolios: BAB
(betting against beta portfolio) constructed in the
spirit of Frazzini and Pedersen (2014) and Alt-BAB
(Alternative bett ing against beta) portfol io
constructed in line with Garcia-Feijoo, Kochard,
Sullivan and Wang (2015). The difference in the
construction process of two beta-neutral portfolios is
explained in the methodology section.
Table 3 reports market beta and one-factor, three-
factor and four-factor alphas with corresponding t-
values for all the three zero-cost long-short portfolios.
CAPM-style one-factor alpha for long low-beta minus
short high-beta portfolio is 16.08% with economically
large and statically significant t-value of3.31. However,
it has beta of -0.7 and that may not be consistent with
many professional investment mandates. On the other
end, BAB portfolio has one-factor alpha of 16.06% (t-
value 3.35), which is very similar to the alpha of lb-hb
portfolio, both in terms of magnitude and statistical
significance. However, BAB has realized beta of -0.05
and it is largely beta-neutral.
Beta Anomaly and Comparative Analysis of Beta Arbitrage Strategies ISSN: 0971-1023 | NMIMS Management ReviewVolume XXXIII January 2017
ISSN: 0971-1023 | NMIMS Management ReviewVolume XXXIII January 2017
Beta Anomaly and Comparative Analysis of Beta Arbitrage Strategies64 65
cities of India, and therefore street
Contents
mall farmers. Majority of the
farmers (82%) borrow less than
Rs 5 lakhs, and 18% borrow
between Rs 5 – 10 lakhs on a
per annum basis. Most farmers
(65.79%) ar
Table sub source heading
** p < .01 + Reliability coefficie
References
Table 23: The Results of Mann-Whitney U Test for DOWJONES Index Daily Returns

Table 4: Output of Three and Four factors calendar time regression analysis
This table reports coefficients and corresponding t-
values for three and four factor regressions for beta
arbitrage portfolios lb-hb, BAB and Alt-BAB, and
excess returns of low beta and high beta portfolios to
understand the characteristics of beta arbitrage and
low and high beta portfolios in terms of strength of
their alpha and factor tilt towards classic size, value
and momentum factors.
lb-hb BAB Alt-BAB lb-rf hb-rf
Coefficient t-value Coefficient t-value Coefficient t-value coefficient t-value coefficient t-value
4-factor alpha
(annualized)
16.37%
4.27
15.48%
3.89
10.43%
3.85
5.08%
3.03
-11.29% -4.49
rm-rf
-0.45
-10.22
0.18
4.10
0.13
4.11
0.74
39.28
1.19 41.79
SMB
-0.04
-0.48
-0.05
-0.65
-0.04
-0.83
-0.03
-0.90
0.01 0.13
HML
-0.40
-6.27
-0.34
-5.18
-0.23
-5.12
-0.12
-4.44
0.27 6.60
WML
0.31
6.19
0.33
6.44
0.23
6.43
0.13
6.15
-0.17 -5.33
lb-hb
BAB
Alt-BAB
lb-rf
hb-rf
Coefficient
t-value
Coefficient
t-value
Coefficient
t-value
coefficient
t-value
coefficient t-value
3-factor alpha
(Annualized)
20.22%
4.70
19.63%
4.36
13.26%
4.33
6.76%
3.59
-13.47% -4.92
rm-rf -0.55 -12.01 0.07 1.54 0.05 1.55 0.70 35.24 1.25 43.09
SMB -0.02 -0.24 -0.03 -0.37 -0.03 -0.54 -0.02 -0.61 0.00 -0.04
HML -0.38 -5.27 -0.32 -4.26 -0.22 -4.21 -0.12 -3.66 0.26 5.77
The practical difficulty in constructing a BAB portfolio
is that it requires active and dynamic lending and
borrowing to push both low beta and high beta
portfolios to unity in order to achieve beta-neutrality
on ex-ante basis. This is an extremely difficult and
expensive process to follow in emerging markets like
India. An easier to implement Alt-BAB portfolio
reports one-factor alpha of 10.81% (t-value = 3.31),
that is large and statistically significant, but lower in
economic terms compared to alphas of lb-hb and BAB
portfolios. The results are robust when we look at
three-factor alphas of all the three portfolios after
controlling for Fama-French factors of size and value.
Three factor alphas for lb-hb, BAB and Alt-BAB
portfolios are 20.22% (t-value = 4.7), 19.63% (t-value =
4.36) and 13.26% respectively. It is worth noting that 3-
factor alphas are greater economically and more
significant statistically than corresponding one-factor
alphas for all three beta arbitrage portfolios.
We also report four-factor alphas controlling for
momentum factor in addition to size and value factors
in the spirit of Carhart. Four-factor alphas of lb-hb, BAB
and Alt-BAB factors are 16.37% (t-value = 4.27),
15.48% (t-value = 3.89) and 10.43% (t-value = 3.85)
respectively. All are very similar to corresponding one-
factor alphas in terms of their value with even greater
statistical significance. These results show that low
beta anomaly is unique and classic. Value, size and
momentum factors combined together don't affect
the strength or the statistical significance of the
anomaly. On the contrary, three-factor alphas for all
the three long-short, beta arbitrage portfolios are
greater than their corresponding one-factor alphas.
This encourages us to look at the characteristics of our
beta arbitrage portfolios in terms of their size, value
and momentum tilt.
Table 4 reports results of three-factor and four-factor
regressions to understand the portfolio characteristics
of lb-hb, BAB and Alt-BAB portfolios. Looking at the
output of three and four-factor regressions, we can
clearly witness that none of the three portfolios have
any size tilt towards small stocks with SMB factor
loading near zero, with a negative sign and statistically
insignificant. However, the same is not the case with
value factor. There is a clear tilt away from value stocks
evident in all the three portfolios. HML factor loading
of all the three portfolios is substantially large with a
negative sign, and is statistically significant. Similarly,
looking at four-factor regressions, we can clearly see
that all the three portfolios have a clear momentum tilt
with large and positive WML factor loading and it is
highly significant statistically in each case.
These results are quite interesting. While none of the
beta arbitrage long-short portfolios have any tilt
towards size factor, these portfolios have clear
negative tilt away from value factor and positive tilt for
momentum factor. As we know, all these portfolios are
a combination of long low-beta and short high-beta
portfolios. It is important to see characteristics of both
low and high-beta portfolios individually. This will help
us understand which portfolio contributes to the size,
value and momentum tilt of zero cost, long-short beta
arbitrage portfolios. Both three-factor and four-factor
loadings of low beta portfolios show that low beta
portfolio has no size tilt. However, it is dominated by
growth and winner stocks with negative HML factor
loading and positive WML factor loading. Both HML
and WML coefficients are similar in value and
statistically significant, but with opposite sign. On the
other end, a high-beta portfolio too has no size tilt, but
has clear value tilt with large positive HML factor
loading both in terms of size and statistical significance
and negative WML factor loading, similarly large and
significant. This clearly shows that a high-beta
portfolio is dominated by value and loser or negative
momentum stocks. We just want to highlight that HML
loading is more significant than WML loading.
Therefore, a long position in low-beta portfolio and
short high-beta portfolio, both contribute to large and
negative HML factor loading and comparably large but
positive momentum factor loading of all zero-cost,
beta arbitrage portfolios.
5. Limitations and Potential future work
This study compares alternative beta arbitrage
strategies using portfolio level analysis only. Stock level
analysis can provide valuable insights in explaining
differences in performance and characteristics of
alternative beta arbitrage strategies. Besides, this
study uses equal weighting scheme while constructing
beta quintile portfolios. Results with alternative
weighting schemes such as value weighting scheme
would add to the robustness of the results. In addition,
this study does not analyze performance of beta
arbitrage strategies in markets with borrowing
constraints and changing liquidity scenarios.
Future work on beta arbitrage strategies may focus on
stock level analysis of beta quintile portfolios and
evaluating robustness of results to change in weighting
schemes while constructing beta quintile portfolios.
Besides, studying the impact of borrowing restrictions
and varying liquidity scenarios on performance of beta
arbitrage strategies in the Indian context will explain
the difference in performance of beta arbitrage
portfolios in different phases of the market cycle.
Future work should focus on interaction of BAB factor
with other known factors such as value, size and
momentum to gain further insights into combining
beta arbitrage strategies with other factor investment
strategies to generate superior risk-adjusted returns.
2. Conclusion
Our results show clear evidence for beta anomaly in
Indian stock markets. A low-beta portfolio delivers
positive alpha and a high-beta portfolio delivers
negative alpha. Beta anomaly is robust after
controlling for size, value and momentum factors
individually and collectively. Our comparison of three
Beta Anomaly and Comparative Analysis of Beta Arbitrage Strategies ISSN: 0971-1023 | NMIMS Management ReviewVolume XXXIII January 2017
ISSN: 0971-1023 | NMIMS Management ReviewVolume XXXIII January 2017
Beta Anomaly and Comparative Analysis of Beta Arbitrage Strategies66 67
cities of India, and therefore street
Contents
mall farmers. Majority of the
farmers (82%) borrow less than
Rs 5 lakhs, and 18% borrow
between Rs 5 – 10 lakhs on a
per annum basis. Most farmers
(65.79%) ar
Table sub source heading
** p < .01 + Reliability coefficie
References
Table 23: The Results of Mann-Whitney U Test for DOWJONES Index Daily Returns

different versions of beta arbitrage portfolio
establishes that all the portfolios deliver substantial
alphas contributed by both long and short side of the
portfolios. Moreover, all the portfolios have a clear tilt
towards momentum and away from value factor, and
no significant loading for size factor. While alphas of lb-
hb and BAB portfolios are similar, BAB portfolio is
largely beta-neutral, whereas lb-hb portfolio has large
negative beta. Alt-BAB has comparatively lower alpha,
but it turns out to be the best implementable strategy
in emerging markets like India with short selling and
borrowing restrictions along with funding constraints.
References
• Agarwalla, S. K., Jacob, J., & Varma, J. R. (2013). Fama French and Momentum Factors: Data Library for Indian
Market. Retrieved 2015, from IIM Ahmedabad: http://www.iimahd.ernet.in/~iffm/Indian-Fama-French-
Momentum/
• Ang, A., Hodrick, R., Xing, Y., & Zhang, X. (2006). The Cross Section of Volatility and Expected Return. Journal of
Finance, 61 (1), 259-299.
• Ang, Hodrick, Xing, &Zhang. (2009). High Idiosyncratic Volatility and Low Returns: International and Further
U.S. Evidence. (1), 1-23.Journal of Financial Economics, 91
• Asness, C. S., Frazzini, A., & Pedersen, L. H. (2014). Low-risk investing without industry bets. Financial Analysts
Journal, 70 (4), 24-41.
• Baker, M., Bradley, B., & Wurgler, J. (2011). Benchmarks as Limits to Arbitrage: Understanding the Low-
Volatility Anomaly. (1), 40-54.Financial Analysts Journal, 67
• Baker, N., & Haugen, R. (2012). Low Risk Stocks Outperform within All Observable Markets of the World.
Journal of Portfolio Management, 17 (3), 35-40.
• Bali, T. G., Cakici, N., & Whitelaw, R. F. (2011). Maxing out: Stocks as lotteries and the cross-section of expected
returns. , 427-446.Journal of Financial Economics, 99
• Bali, T., & Cakici, N. (2008). Idiosyncratic Volatility and the Cross Section of Expected Returns. Journal of
Financial and Quantitative Analysis, 43 (1), 29-58.
• Black, F. (1993). Beta and Return: Announcements of the 'Death of Beta' seem premature. The Journal of
Portfolio Management, 20 (1), 11-18.
• Black, F. (1972). Capital Market Equilibrium with Restricted Borrowing. (3), 444-455.Journal of Business, 4
• Black, Jensen, & Scholes. (1972). The Capital Asset Pricing Model: Some Empirical Tests. In Studies in the Theory
of Capital Markets, Michael C. Jensen,ed, 79-121.
• Blitz, D. C., & Vliet, P. V. (2007). The Volatility Effect. (Fall), 102-113.The Journal of Portfolio Management, 34
• Blitz, D., Pang, J., & Vliet, P. V. (2013). The Volatility Effect in Emerging Markets. , Emerging Markets Review, 16
31-45.
• Carhart. (1997). On Persistence in Mutual Fund Performance. , 57–82.The Journal of Finance, 52
• Clarke, R. G., De Silva, H., & Thorley, S. (2010). Know your VMS exposure. The Journal of Portfolio Management,
36 (2), 52-59.
• Falkenstein. (2009). Risk and Return in General: Theory and Evidence. .SSRN Working paper
• Fama, E. F., & French, K. R. (1992). The Cross-section of Expected Stock Returns. (2), 424-Journal of Finance, 47
465.
• Frazzini, A., & Pedersen, L. (2014). Betting against beta. (1), 1-25.Journal of Financial Economics, 111
• Frazzini, A., & Pedersen, L. H. (2010, October). Betting against Beta. .Working paper, New York University
• Fu, F. (2009). Idiosyncratic Risk and the Cross-Section of Expected Returns. Journal of Financial Economics, 91
(1), 24-37.
• Garcia-Feijoo, Kochard, Sullivan & Wang (2015). Low-volatility cycles: The influence of valuation and
momentum on low-volatility portfolios. (3), 47-60.Financial Analysts Journal, 71
• Haugen, R. A., & Heins, A. J. (1975). Risk and the Rate of Return on Financial Assets: Some Old Wine in New
Bottles. (5), 775-784.Journal of Financial and Quantitative Analysis, 10
• Hong, H., & Sraer, D. A. (2012). Speculative Betas. .NBER working paper
• Karceski, J. (2002). Returns-Chasing Behavior, Mutual Funds, and Beta's Death. Journal of Financial and
Quantitative Analysis, 37 (4), 559-594.
• Markowitz, H. (1952). Portfolio Selection. (1), 77-91.Journal of Finance, 7
• Minimum-Variance Portfolio in the U.S. Equity Market (2006). 10-24.The Journal of Portfolio Management, 33,
• Vasicek, O. A. (1973). A Note on Using Cross-Sectional Information in Bayesian Estimation of Security Betas.
The Journal of Finance, 28, 1233–1239.
Beta Anomaly and Comparative Analysis of Beta Arbitrage Strategies ISSN: 0971-1023 | NMIMS Management ReviewVolume XXXIII January 2017
ISSN: 0971-1023 | NMIMS Management ReviewVolume XXXIII January 2017
Beta Anomaly and Comparative Analysis of Beta Arbitrage Strategies68 69
cities of India, and therefore street
Contents
mall farmers. Majority of the
farmers (82%) borrow less than
Rs 5 lakhs, and 18% borrow
between Rs 5 – 10 lakhs on a
per annum basis. Most farmers
(65.79%) ar
Table sub source heading
** p < .01 + Reliability coefficie
References
Table 23: The Results of Mann-Whitney U Test for DOWJONES Index Daily Returns

Appendix 1: Summary statistics
This table reports the number of eligible stocks for each iteration with their median price to earnings multiple and
median market capitalization.
Year-
Month
No of
stocks
Median
PE
Median
Market-cap
(million INR)
200401 465 11.61 3209.5
200402 468 9.57 2911.1
200403 471 9.12 2734.7
200404 471 8.72 2630.9
200405 476 9.24 2876.9
200406 478
7.98
2568.5
200407 479
8.24
2510.2
200408 485
8.69
2859.1
200409 484
9.54
3213.4
200410 486
10.35
3553
200411 487
9.93
3586.5
200412 490
11.32 4210.1
200501 488
12.91
4585.4
200502 489
12.11
4856
200503 490
12.56
5013.2
200504 489
12.36
5263.4
200505 486
12.76
5191.1
200506 485
14.23
5470.2
200507 487
14.80
5699.8
200508 488 14.62 6191.5
200509 487 16.18 7065.7
200510 489 16.50 7342.2
200511 486 13.92 6818.4
200512 488 15.81 7556
200601 488 16.73 8062.1
200602 487 17.26 8605.8
Year-
Month
No of
stocks
Median
PE
Median
Market-cap
(million INR)
Year-
Month
No of
stocks
Median
PE
Median
Market-cap
(million INR)
Year-
Month
No of
stocks
Median
PE
Median
Market-cap
(million INR)
200603 488 17.14 8569.5
200604
490
18.10
8918.8
200605 489 19.46 9909.8
200606 491 16.49 8418.9
200607 492 14.79 7516.5
200608 489 13.28 7689
200609 491 14.82 8514
200610 483 15.50 8906.3
200611 484 15.51 9607.1
200612 490 15.12 9665.7
200701 497 15.56 10411.7
200702 500 15.32 10664.2
200703 502 14.10 9614.6
200704 505
13.46
9085.3
200705 508
14.38
10221
200706 512
15.35
10633.6
200707 514
15.93
10375.8
200708 516
14.47
10873
200709 519
14.05
11064.3
200710 524
15.41
12198
200711 524 14.96 13157.2
200712 526
15.62
14177.3
200801 526
18.46
17079
200802 524
13.87
12929.6
200803 521
13.94
13285.3
200804 526
11.94
10934.4
200805 531
13.13
12363.7
200806 533 12.75 11829
200807 538 10.51 9923.1
200808 546 10.27 10282.3
200809 547 10.64 10478.9
200810 547 8.85 8476.4
200811 547 5.98 5779.6
200812 547 5.25 4940.8
200901 550 6.01 5740.9
200902 557 5.78 5033.7
200903 561 5.49 4729.6
200904 570 5.94 5338.4
200905 575 7.57 6494.1
200906 576 11.35 9560.6
200907 580 11.34 9448.2
200908 581 10.96 10575.6
200909 583 11.84 11775.7
200910 590 12.84 12784.5
200911 593
11.20
11247
200912 599
12.53
12488.7
201001 605
13.51
13840.2
201002 610
13.09
13715.3
201003 616
13.10
13176.8
201004 625
14.03
14432.6
201005 630
13.75
15055.9
201006 636 13.11 14744.4
201007 637
14.22
15705.1
201008 640
14.26
15980.2
201009 643
14.45
16738
201010 644
15.32
18071.7
201011 650
15.55
18573.6
201012 654
14.47
17380.1
201101 660
14.54
17879.7
201102 660 12.68 16109.9
201103 665 11.82 14004.7
201104 667 13.02 15545.7
201105 669 13.33 16680.2
201106 671 12.71 15531.4
201107 671 12.85 15267.9
201108 675 12.66 15482.1
201109 674 11.49 13593
201110 674 11.20 13176.3
201111
678
11.37
13743.2
201112
678 10.11 12340.2
201201 678 9.12 10668.6
201202 678 10.41 12901.9
201203 678 11.47 13786.1
201204 676 11.05 13371.7
201205 674 11.74 13145.1
201206 673 11.07 11838.6
201207 674 11.78 12536.5
201208 676 10.64 12044.4
201209 677 10.61 11785
201210 680 11.62 13412.5
201211 681
11.69
13470
201212 685
12.18
13249.3
201301 688
12.59
14517.4
201302 696
12.32
14650.1
201303 700
10.87
12177.1
201304 701
9.96
11880
201305 702
11.10
12600.5
201306 700
10.94
12202.6
201307 699 10.53 11363.2
201308 696
8.96
10060.7
201309 697
8.36
9992.2
201310 699
9.17
10364.1
201311 702
9.61
11386
201312 703
9.86
11883.6
201401 701
10.61
13471.9
201402 700
10.27
12745
201403 700
10.60
12772.5
201404 702 11.58 14553
201405 701 12.89 15120.2
201406 705 14.97 18413.2
201407 704 16.75 22120.3
201408 702 15.48 21312.5
201409 705 16.18 21465.1
201410 706 16.46 21569.7
201411 708 16.32 21632.9
201412 709 16.59 22677.6
Beta Anomaly and Comparative Analysis of Beta Arbitrage Strategies ISSN: 0971-1023 | NMIMS Management ReviewVolume XXXIII January 2017
ISSN: 0971-1023 | NMIMS Management ReviewVolume XXXIII January 2017
Beta Anomaly and Comparative Analysis of Beta Arbitrage Strategies70 71
cities of India, and therefore street
Contents
mall farmers. Majority of the
farmers (82%) borrow less than
Rs 5 lakhs, and 18% borrow
between Rs 5 – 10 lakhs on a
per annum basis. Most farmers
(65.79%) ar
Table sub source heading
** p < .01 + Reliability coefficie
References
Table 23: The Results of Mann-Whitney U Test for DOWJONES Index Daily Returns

Nehal Joshipura, MBA (Finance),MCA, Ph.D., isAssistant Professor, DurgadeviSaraf Institute of
Management Studies, Mumbai. Her research interests are in the areas of market anomalies and factor
investing strategies. She has published papers in refereed management journals including ABDC listed
international Journals, Asian Journal of Finance & Accounting and Applied Finance Letters. In addition,
she has presented papers at national and international conferences and won the best paper prizes at
conferences like NICOM at Nirma University and Great Lakes – Union Bank Finance Conference. She is also
a SEBI registered investment advisor. She can be reached at [email protected]
Mayank Joshipura, Professor & Chairperson (Finance), SBM-NMIMS, Mumbai, has research interests in
the areas of capital markets, test of market efficiency, market anomalies and their rational and
behavioural explanations, predicting cross section of equity returns using multifactor models with special
focus on low risk anomaly and its interaction with momentum and value factors. Dr. Joshipura has
published articles and cases in reputed international journals and case publishing houses. He won the
“Best finance Professor Award” for the year 2015 at 23rdDevang Mehta National Awards. He can be
reached at [email protected]
ISSN: 0971-1023 | NMIMS Management ReviewVolume XXXIII January 2017
Abstract
The orthopaedic device market is a booming market
globally. The growing elderly population, risk of
osteoporosis, osteoarthritis, bone injuries and obesity
are major factors that are contributing to the growth of
this market. The projected market size by 2021 is $
45.36 billion. There is a wide scope of growth for this
market mainly in Middle East, China, India and other
Asian countries.
The study was conducted to understand the
perceptions of orthopaedic surgeons towards 7
leading implant brands in India. Major factors for the
study were identified from literature review and
expert opinion of 7 leading orthopaedic surgeons.
This research has three objectives: a) To understand
the significance of various factors considered by
orthopaedic surgeons for choosing an orthopaedic
implant. b) To understand perceptions of orthopaedic
surgeons with respect to 7 leading orthopaedic
implant brands available in the Indian market. c) To
understand the preferred source of information of
orthopaedic surgeons for selecting/ prescribing
orthopaedic implant brands.
Primary data was collected by surveying 61
orthopaedic surgeons practicing in Mumbai city using
a structured questionnaire. A perceptual map of
various factors was developed and analyzed to
understand the gap between selected implant brands.
Data was analyzed using SPSS. It was found that
quality is perceived as the most important factor by
orthopaedic surgeons followed by sharing of
appropriate clinical trial data by the company,
durability of the implant and the value for money of
the implant brand. Brands which were considered high
on these factors were perceived better by orthopaedic
surgeons.
Keywords: Medical Devices, Orthopaedic Implant
Brands, Brand Perception, Perceptual Mapping,
Factors affecting, Zimmer, DePuy, Biomet, Exactech,
Link, Maxx, Smith & Nephew
Study of the factors affecting the selectionof orthopaedic implant brands and their
perceptual mapping in Mumbai city
Haresh Raulgaonkar
Aishwarya Wagle
Henna Shah
Anshul Garg
Yugal Sikri
Study of the factors affecting the selection of orthopaedic implantbrands and their perceptual mapping in Mumbai city
Beta Anomaly and Comparative Analysis of Beta Arbitrage StrategiesISSN: 0971-1023 | NMIMS Management ReviewVolume XXXIII January 201772 73
cities of India, and therefore street
Contents
mall farmers. Majority of the
farmers (82%) borrow less than
Rs 5 lakhs, and 18% borrow
between Rs 5 – 10 lakhs on a
per annum basis. Most farmers
(65.79%) ar
Table sub source heading
** p < .01 + Reliability coefficie
References
Table 23: The Results of Mann-Whitney U Test for DOWJONES Index Daily Returns

ISSN: 0971-1023 | NMIMS Management ReviewVolume XXXIII January 2017
Study of the factors affecting the selection of orthopaedic implantbrands and their perceptual mapping in Mumbai city
ISSN: 0971-1023 | NMIMS Management ReviewVolume XXXIII January 2017
Study of the factors affecting the selection of orthopaedic implantbrands and their perceptual mapping in Mumbai city
Introduction
Joints in the human body undergo deterioration/
damage due to causes like disease, injury or
osteoarthritis. World over, the geriatric population is
most vulnerable to such deterioration/damage of
joints. Various orthopaedic implants are used in
reconstructive surgeries of such joints, relieving pain,
offering stability and also restoring movements of the
patient (Research and Markets - Hip and Knee
Orthopedic Surgical Implants: Market Shares,
Strategies, and Forecasts, Worldwide, 2016-2022,
2016).
The global orthopaedic device market is booming. The
growing elderly population, risk of osteoporosis,
osteoarthritis, bone injuries and obesity are major
factors that contribute to the growth of this market. In
2015, the global market for hip and knee surgical
implants was valued at $ 17 billion. In the US alone,
over 324,000 opted for hip replacement in
2015(Research and Markets - Hip and Knee Orthopedic
Surgical Implants: Market Shares, Strategies, and
Forecasts, Worldwide, 2016-2022 , 2016). The global
market revenue is projected to be $ 45.36 billion by
2021(Executive Summary - The Orthopedic Industry
Annual Report, 2013).
Although the US, Europe and Japan account for at least
80% of the global orthopaedic market, almost 80% of
the world's population live outside these areas. Hence,
the future focus of the orthopaedic industry would
obviously revolve around this 80% population which is
from the underdeveloped and developing countries in
Africa and Asia. People in this upcoming market will
need musculoskeletal care throughout their lives and
the real challenge lies in making the implants
affordable to the masses (Executive Summary - The
Orthopedic Industry Annual Report, 2013).
Focusing on India, the orthopaedic device market is a
fast growing market and is rapidly gaining ground with
an increase in arthritic population and economic
growth. An increase in the ageing population,
sedentary lifestyle, growing economy, better
healthcare infrastructure and opening up of the
insurance sector are the factors that have contributed
tremendously to the growth of this sector. There are
more than 70,000 hip and knee surgeries performed
every year and with rising awareness about the impact
of joint problems and the surgical treatments, this
market will emerge as the most lucrative market in the
overall Indian medical device market (Tara Shelton,
2014).
Globally, around 200 companies sell joint replacement
products. Figure 1 gives a snapshot of market share of
key players in the joint replacement industry. Zimmer
with 23% market share is leading the joint replacement
industry followed by DePuy with 20% market share
(Executive Summary - The Orthopedic Industry Annual
Report, 2013).
Figure 1
Figure 2 shows commonly preferred brands by
orthopaedic surgeons in the city of Mumbai, India.
1) Zimmer 2) DePuy 3) Exactech
4) Biomet 5) Link 6) Maxx
7) Smith & Nephew
Figure 2
Preferred Orthopedic Implant Brands In Mumbai, India
This research focuses on these 7 brands. A brief
introduction to these 7 brands is given below:
1) ZIMMER
The famous Persona knee belongs to Zimmer
Company headquartered at Warsaw, USA. It is a global
leader in knee replacement products. Zimmer designs
and creates innovat ive, personal ized jo int
replacement technologies (Zimmer : Personal fit and
renewed life, n.d.).
2) BIOMET
Biomet is a medical device company headquartered in
Warsaw, U S A . The company spec ia l i zes in
reconstructive products for orthopaedics and
neurosurgery. In 2015, it has become Zimmer Biomet.
The product range encompasses implants of hip, knee,
shoulder, as well as spinal and dental implants (Rupali
Mukharjee, 2015).
3) DePUY
DePuy Synthes is a Johnson & Johnson company
established in UK and Switzerland. It is involved in
design, manufacturing and marketing of products for
the reconstruction of damaged or diseased joints and
also for traumatic skeletal injuries (About DePuy
Synthes, 2015).
4) EXACTECH
Exactech is situated in Florida, USA. It mainly deals in
design and manufacturing of joint replacement
systems like knee, shoulder and hip implants. It also
manufactures bone cement required during surgeries
(Exactech Inc. Home page).
5) WALDERMAR LINK
Waldermar Link is a German company that provides
products like cementable and cement-less implants
and instrumentation for primary and revision
surgeries. It has products like hip, knee, shoulder and
also some custom made products in case of tumours
(Waldemar LINK home page).
6) MAXX
MAXX Medical is based out of India and has offices in
USA and Singapore. After around 20 years of presence
in India, operating from Ahmedabad, the company has
achieved sales and regulatory approvals in USA, EU
and other countries during the last 5 years. Now Maxx
Medical manufactures and markets innovative
medical devices on an international scale.
The company's tag line is 'Pursue Life' and the product
for knee replacement is called 'Freedom knee'
(Maxxmed Home Page).
7) SMITH & NEPHEW
It is a British multinational medical equipment
manufacturing company headquartered in London. Its
products are sold in over 100 countries. The company's
stated mission is to support Healthcare Professionals
around the world in their daily efforts to improve
patients' lives following a pioneering approach in the
design of the company's products and services(Smith-
nephew Home page).
74 75
cities of India, and therefore street
Contents
mall farmers. Majority of the
farmers (82%) borrow less than
Rs 5 lakhs, and 18% borrow
between Rs 5 – 10 lakhs on a
per annum basis. Most farmers
(65.79%) ar
Table sub source heading
** p < .01 + Reliability coefficie
References
Table 23: The Results of Mann-Whitney U Test for DOWJONES Index Daily Returns

Review of Literature
An orthopaedic implant device is a combination of
different materials which include a body metal
component, a porous metal surface layer for intimate
contact with bone and a polymer casing preferably
polyareletherketone (USA Patent No. US 5443512 A,
1995).
The orthopaedic implants such as hip (Figure 3) or
knee joint (Figure 4) prosthesis are used to replicate
the joint articulation of skeletal structure following
implantation in the patient. These implants are usually
made up of cobalt chrome, titanium or stainless steel.
The selection of materials is usually based on
considerations of biocompatibility. Stainless steel is
the least corrosion-resistant and hence, it is used for
temporary implants only (IRENA GOTMAN, 2009).
Figure 3: DePuy hip
Figure 4: Stryker Knee joint
Figure 5: Picture of X- ray showing compressed knee
due to osteoarthritis
Figure 6: Scoliosis: Spine condition
Figure 7: Major factors affecting the Indianmedical devices market.
Medical Devices Industry
• Economics-based factors
• U n m e t c l i n i c a l n e e d s d u e t o
technology mismatch and existing
economy
• Regulatory environment
• Reimbursement policies
• Healthcare providers
• Local market sentiments
Conditions requiring implant surgeries
There is an increase in prevalence of osteoarthritis
which leads to more demand of arthroplasty (Figure
5).
Osteoarthritis is a degenerative disease caused due to
increase in age, genetic disorders, nutritional factors
or trauma. It also occurs due to obesity. Estimates
suggest that 27 million adults in USA suffer from
arthritis (Montserrat Nunez, 2010). Treatment with
medication like NSAIDs, exercise and physiotherapy
are suggested to patients at an initial stage, but most of
them have to opt for joint replacement.
Obesity is another disorder which may lead an
individual to orthopaedic surgery. Accidents resulting
in trauma to the bones require surgical intervention to
help the union of bones. Bone problems like scoliosis
also require surgery to help the spine regain its original
shape (Figure 6).
Musculoskeletal conditions are the most common
cause of chronic disability. It is also seen that
conditions like infective arthritis, rheumatoid arthritis,
hip fracture, back problems, dislocations, etc. know no
age bounds and hence, can affect patients of any age
(Executive Summary - The Orthopedic Industry Annual
Report, 2013).
Challenges faced by Indian orthopaedic implant
market
Despite a growth-oriented market with huge
potential, this industry also has to face many
challenges.
1. Willingness to opt for surgery:
Patients hesitate to opt for surgery due to many
reasons such as prolonged recovery period, availability
of non-surgical options like yoga, physiotherapy,
medication and also due to the fear of infection or
failure of implants(Tara Shelton, 2014).
2. Low awareness amongst Indian patients:
Surveys conducted in urban areas show that only 10%
of the population is actually aware about the detection
and prevention of joint problems like osteoporosis
(Tara Shelton, 2014).
3. Affordability:
The American Academy of Orthopedic Surgeons
(AAOS) believes that the cost of implant must be
balanced between the outcomes and the affordability
for the patient. In other words, higher priced implants
must establish superior outcome to justify the
additional cost to the patient. This aspect is very
c r i t i ca l w h e n i t co m e s to d eve l o p i n g a n d
underdeve loped countr ies ( A A O S Pos i t ion
statement).
4. Improper regulatory environment:
Orthopaedic implants in India are considered as
'drugs' under the Drug and Cosmetic Act of 1940 which
obviously is not favourable to the existing implant
industry. The cost of orthopaedic implants is very high
since most of them are imported (Mukherjee, 2015).
5. Reluctance to try indigenous products:
Orthopaedic surgeons are reluctant to try indigenous
brands of implants. In fact, around 75% of medical
devices are imported.
Following are some other challenges faced by the
industry:
• Inadequate quality standards hamper the image of
Indian-made products.
• High import dependency
• Lack of tax incentives to promote indigenous
products
• Inadequacy of skill / talent required in this precision
industry
ISSN: 0971-1023 | NMIMS Management ReviewVolume XXXIII January 2017
Study of the factors affecting the selection of orthopaedic implantbrands and their perceptual mapping in Mumbai city
ISSN: 0971-1023 | NMIMS Management ReviewVolume XXXIII January 2017
Study of the factors affecting the selection of orthopaedic implantbrands and their perceptual mapping in Mumbai city76 77
cities of India, and therefore street
Contents
mall farmers. Majority of the
farmers (82%) borrow less than
Rs 5 lakhs, and 18% borrow
between Rs 5 – 10 lakhs on a
per annum basis. Most farmers
(65.79%) ar
Table sub source heading
** p < .01 + Reliability coefficie
References
Table 23: The Results of Mann-Whitney U Test for DOWJONES Index Daily Returns

Current strategies used to promote implants include
tying up with health insurance firms, focusing on bulk
buying hospitals and improving supply chain
capabilities for faster deliveries with least costs
(Dinesh Peter, Infosys Consulting, 2015).
Future Growth
With increase in life span and ailments like
osteoporosis, arthritis, accidents and lifestyle
disorders like obesity, the orthopaedic device industry
is set to experience considerable growth in the coming
years.
With the emergence of the internet and social media,
awareness about bone problems has increased
amongst patients and their families. The spending
capacity, with the help of health insurance, has
increased due to which more people are opting for
surgery. Reduced price of implants will also open gates
for more people to opt for treatment.
Although orthopaedic surgeons in India are reluctant
to use Indian brands as they are unsure of their efficacy
in the long run, there are chances that with time, usage
of indigenous implants will be done on a large scale
(Vora, 2012).
The government's 'Make in India' campaign aiming to
make India a manufacturing hub will help in reduction
of costs of orthopaedic implants thereby helping the
deprived to avail treatment. But unfortunately, the
government's taxation policies favour importing when
it comes to medical devices. The implant market in
India is estimated at Rs1,250 crores out of which 85%
constitute imported brands (Nagrajan, 2014).
Factors affecting the Industry
Figure 7 highlights the factors affecting the Indian
medical devices market and the strategies that will
help in the development of this industry (Dinesh Peter,
Infosys Consulting, 2015).
As a result of the government's motivation to local
manufacturers, Indian orthopaedic implant brands like
Indus and Inor will establish themselves in this highly
import-dominated market (Donoghoe, Gupta, Linden,
Mitra, & Von Morgenstern, 2012).
The Indian government also unveiled a draft proposal
for a separate authority to handle the medical device
department. The objectives of creating this body
include discouraging the tendency to overcharge for
the implants and also to further support the local
industries to deepen their roots in the Indian market
(Enriquez, 2015).
With advancements in technology, techniques like 3D
printing are also booming, which will further provide
good quality custom made implants at a comparatively
reasonable rate to the patient (PR Newswire, 2014).
A l s o , m o d e r n b i o m a t e r i a l s d e r i v e d f r o m
biotechnology and nanotechnology for prosthesis is
helpful in making durable and cost effective implants.
The fusion of biotechnology and nanotechnology
could open up a market worth an estimated $1trillion
(Marcelo Kropf, 2014).
Factors considered by orthopaedic surgeons
for selection of implants
A majority of patients rely on their surgeons for the
choice of implants and are of the opinion that the
doctor should be the decision maker in such cases.
Although the overall awareness about the implants
has increased among people with exposure to the
internet and social media, patients have given the
power to the physicians to choose amongst the brands
(CPT Dionisio Ortiz III, 2014). Hence, it is necessary to
find the factors considered by surgeons while selecting
a brand of orthopaedic implants.
The most important factors on the basis of which
orthopaedic surgeons select the implant brand for
patients are quality and cost; 97.1% opted for quality
whereas only 2.9% chose cost (Peter F. Sharkey, 1999).
Clinical results for the implants are critical as most
implants are designed for biological fixation and to stay
in the patient's body forever without causing any
serious issues to the patient. The reliability of an
implant gets established through focused clinical
studies. The clinical reports of such studies give
surgeons the required confidence before trying newly
introduced implants. CA Engh, JD Bobyn, AH Glassman
published results of their clinical studies involving the
use of porous coated implants for hip replacement.
They evaluated 307 patients for two years and 89
patients after five years, and concluded that factors
like age, sex and disease did not influence clinical
results. The implants had no deterioration even after a
period of 5 years and fixation by bone ingrowth or of
fibrous tissue both appeared to be stable, but bone
ingrowth gave better clinical results (CA Engh, 1987).
Durability of implants is an important factor for
surgeons for obvious reasons. Researchers and
manufacturers across the globe strive to improve the
durability of orthopaedic implants. Eberhardt, C and
colleagues, in their study to evaluate the effects of
systematic treatment with bisphosphonate
ibandronate, concluded that such treatment improves
durability of cement-less metal orthopaedic implants
(Eberhardt, 2006).
The choice of implant brand by an orthopaedic
surgeon depends on (a) His/ her expertise with a
particular implant (b) The patient's diagnosed
condition and (c) The fitment of the chosen implant
with the patient (Research and Markets - Hip and Knee
Orthopedic Surgical Implants: Market Shares,
Strategies, and Forecasts, Worldwide, 2016-2022 ,
2016).
Doctors' reasons for change in the implant brand were:
Improved clinical outcome (for 47.1% doctors),
reduced costs of the implant (for 42.4% doctors) and
ease of surgery (for 21.8% doctors). 19.4% of the
doctors would likely change their brand as per the
hospital norms (Peter F. Sharkey, 1999).
Fitting or installing of the implant is a task that needs
skill and certain medical instruments like hammers,
drill bits, cutting blocks as well as some specialized
instrumentation, etc.
Orthopaedic implant manufacturers provide medical
instruments to aid in the proper fixation of the implant
during surgery. This is also a factor which is taken into
consideration while selecting an orthopaedic implant.
The ease of surgery with the instruments is hence, an
essential factor while selecting an implant brand
(Alfred J. Tria, 2014).
One of the biggest problems that arise during a surgical
procedure is the chance of infection to the patient.
Due to excessive bleeding during surgery, chances of
infection due to contaminants are very high. For this,
proper surgical techniques have to be followed and
proper instruments are to be used; sharp instruments
should be avoided and replaced with blunt ones
wherever possible (Montserrat Nunez, 2010).
Expert opinions of leading orthopaedic
surgeons:
Expert opinions of 7 leading orthopaedic surgeons
were sought with the prime motive of verifying the
shortlisted factors of the study and also to capture any
missing factors which are considered important in the
selection/ prescription of orthopaedic implants by
orthopaedic surgeons.
ISSN: 0971-1023 | NMIMS Management ReviewVolume XXXIII January 2017
Study of the factors affecting the selection of orthopaedic implantbrands and their perceptual mapping in Mumbai city
ISSN: 0971-1023 | NMIMS Management ReviewVolume XXXIII January 2017
Study of the factors affecting the selection of orthopaedic implantbrands and their perceptual mapping in Mumbai city78 79
cities of India, and therefore street
Contents
mall farmers. Majority of the
farmers (82%) borrow less than
Rs 5 lakhs, and 18% borrow
between Rs 5 – 10 lakhs on a
per annum basis. Most farmers
(65.79%) ar
Table sub source heading
** p < .01 + Reliability coefficie
References
Table 23: The Results of Mann-Whitney U Test for DOWJONES Index Daily Returns

List of factors affecting selection of orthopaedic
implants by orthopaedic surgeons on the basis of
literature review and expert opinion, post diagnosis
1) Ease of surgery while fixing the implant brand
2) Availability of the implant brand with a short lead
time
3) Quality of the implant brand
4) Cost / value for money to the patient
5) Durability of the implant brand
6) Clinical outcome of the procedure
7) Proven clinical track record of the implant brand
8) Advice of the key opinion leaders or senior
surgeons regarding performance of a specific
implant brand
9) Reliability of the implant brand
10) Type of tools and instruments required for fixing
the implant brand
11) Patient's awareness / preference due to increased
use of social media and internet to gather current
knowledge with respect to various implant
brands available
12) Availability of indigenous implant brands of
equivalent quality compared to implant brands of
foreign origin
Research Objectives
a) To understand the statistical significance of factors
affecting the selection of implant brands by
orthopaedic surgeons in Mumbai.
b) To understand the preferred source of information
by orthopaedic surgeons for selecting/ prescribing
orthopaedic implant brands.
c) Perceptual mapping of orthopaedic implant
brands with respect to the selected parameters
using preferences given by orthopaedic surgeons
practicing in Mumbai.
Research Methodology
• Research Area : Mumbai
• Sampling Method : Purposive/ Snowball Sampling
• Sample size : 61 orthopaedic surgeons
• Survey Method : Face-to-face meeting with
surgeons
• Survey Instrument : Structured Questionnaire
• Sampling Unit : Orthopaedic surgeons
• Selection of analysis tools:
• We used one sample T test based hypothesis
testing to analyse selected parameters.
• Attribute based Perceptual mapping using
discriminant analysis was deployed to get the
perceptual map. John Hauser and Frank
Koppelman in their article of 1979 indicated that
discriminant analysis is comparable to factor
analysis and better than Multi-dimensional
S c a l i n g ( M D S ) c o n s i d e r i n g c r i t e r i a o f
Interpretation and ease of use (Koppelman, 1979).
MDS was not suitable as it requires a market with
brands having strongly differentiating market
posit ions strengthened by using aggressive
promotional and advertising campaigns by competing
organizations, which is not the case in the orthopaedic
implant market (John Hauser, 1979).
Factor analysis was not used for perceptual mapping
due to requirement of very high sample size for the
study. Robert C. MacCallum, Keith F. Widaman , Shobo
Zhang and Sehee Hong in their paper titled 'Sample
size in Factor Analysis' referred to work by Comrey and
Lee ( 1992) which offers a rough rating scale for
adequate sample sizes in factor analysis: 100 = poor,
200 = fair, 300 = good, 500 = very good, 1000 or more =
excellent (Robert C. MacCallum, 1999).The amount of
efforts required in getting sufficiently higher sample
size considering the sample unit was 'Practicing
orthopaedic surgeons in city of Mumbai' was not
justified.
Data Analysis
Using IBM SPSS 21, the following analysis was carried
out:
a) Analysis of significance for selected parameters
through hypothesis testing using one sample T test
at 95% confidence level.
b) Ranking analysis of orthopaedic surgeons'
preferred sources of information.
c) Attribute based perceptual mapping using
discriminant analysis.
Analysis, Interpretation and conclusions
A) Hypothesis testing using T test:
Null Hypothesis, Ho: Neutral perception with respect
to parameter
Alternate Hypothesis, H1: Non-neutral perception
with respect to parameter
Level of significance: 5%.
The scale used is 7-point agreement scale: 1) Strongly
Agree 2) Agree 3) Agree somewhat 4) Neutral 5)
Disagree somewhat 6) Disagree 7) Strongly disagree.
Refer to Table 1 for the T test results.
Table 1: Hypothesis testing of individual parameters
Parameter P value Mean
The selection of implants depends on the clinical results and
information provided. 0 2.082
Opinion of experienced seniors/colleagues is essential for selection of
an implant. 0 2.508
Quality is directly proportional to cost of implants. 0.041 3.541
Social media plays an essential role in Indian patient’s decision for
surgery.
0
2.967
Preference is always given to highly reliable supplier.
0
1.934
Quality of indigenous implants is at par with the imported implants.
0.159
Parameter not
Significant
Brand preference of implants differs with government and private
hospitals.
0
2.77
Implants which require less surgical procedure are preferred.
0
2.491
Implants that require standard and limited instrumentation are
preferred. 0
2.409
ISSN: 0971-1023 | NMIMS Management ReviewVolume XXXIII January 2017
Study of the factors affecting the selection of orthopaedic implantbrands and their perceptual mapping in Mumbai city
ISSN: 0971-1023 | NMIMS Management ReviewVolume XXXIII January 2017
Study of the factors affecting the selection of orthopaedic implantbrands and their perceptual mapping in Mumbai city80 81
cities of India, and therefore street
Contents
mall farmers. Majority of the
farmers (82%) borrow less than
Rs 5 lakhs, and 18% borrow
between Rs 5 – 10 lakhs on a
per annum basis. Most farmers
(65.79%) ar
Table sub source heading
** p < .01 + Reliability coefficie
References
Table 23: The Results of Mann-Whitney U Test for DOWJONES Index Daily Returns
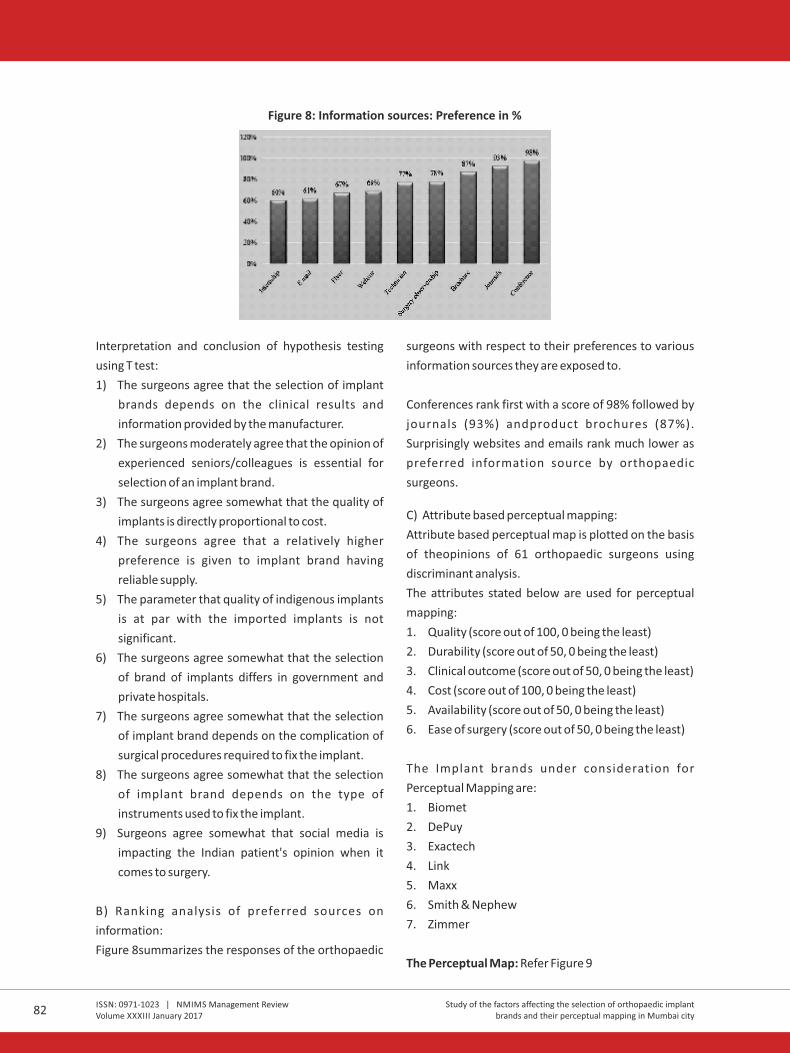
Figure 8: Information sources: Preference in %
Interpretation and conclusion of hypothesis testing
using T test:
1) The surgeons agree that the selection of implant
brands depends on the clinical results and
information provided by the manufacturer.
2) The surgeons moderately agree that the opinion of
experienced seniors/colleagues is essential for
selection of an implant brand.
3) The surgeons agree somewhat that the quality of
implants is directly proportional to cost.
4) The surgeons agree that a relatively higher
preference is given to implant brand having
reliable supply.
5) The parameter that quality of indigenous implants
is at par with the imported implants is not
significant.
6) The surgeons agree somewhat that the selection
of brand of implants differs in government and
private hospitals.
7) The surgeons agree somewhat that the selection
of implant brand depends on the complication of
surgical procedures required to fix the implant.
8) The surgeons agree somewhat that the selection
of implant brand depends on the type of
instruments used to fix the implant.
9) Surgeons agree somewhat that social media is
impacting the Indian patient's opinion when it
comes to surgery.
B) Ranking analysis of preferred sources on
information:
Figure 8summarizes the responses of the orthopaedic
surgeons with respect to their preferences to various
information sources they are exposed to.
Conferences rank first with a score of 98% followed by
journals (93%) andproduct brochures (87%).
Surprisingly websites and emails rank much lower as
preferred information source by orthopaedic
surgeons.
C) Attribute based perceptual mapping:
Attribute based perceptual map is plotted on the basis
of theopinions of 61 orthopaedic surgeons using
discriminant analysis.
The attributes stated below are used for perceptual
mapping:
1. Quality (score out of 100, 0 being the least)
2. Durability (score out of 50, 0 being the least)
3. Clinical outcome (score out of 50, 0 being the least)
4. Cost (score out of 100, 0 being the least)
5. Availability (score out of 50, 0 being the least)
6. Ease of surgery (score out of 50, 0 being the least)
The Implant brands under consideration for
Perceptual Mapping are:
1. Biomet
2. DePuy
3. Exactech
4. Link
5. Maxx
6. Smith & Nephew
7. Zimmer
The Perceptual Map: Refer Figure 9
Figure 9: Perceptual Map of Orthopedic Implant Brands
Interpretation and Conclusions:
• X axis is dominated by the attribute 'Quality' of the
implants.
• Y axis is dominated by three attributes viz
‘Durability', 'Clinical outcome' and 'Value for
money'
– ve Y axis is dominated by Availability and Ease
of Surgery.
The perception of the brands in the minds of the
orthopaedic surgeons as seen in the perceptual map
(Figure 9: Perceptual map with SPSS output values) is
as follows:
1) Zimmer is perceived to have the best quality.
2) Link ranks the highest for durability, clinical
outcome and value for money.
3) DePuy is strong on Quality and follows Zimmer.
4) Zimmer, Depuy, Smith & Nephew, Biomet and
Exactech scores almost same on value for money
and clinical outcomes.
5) Maxx scores low on both the axis.
Managerial Implications and
Recommendations:
The content of this research is novel, being the first-of-
its-kind analysis involving selected orthopaedic
implant brands. The study identifies various critical
factors considered by orthopaedic surgeons in their
selection of implant brand.
The perceptual map brings out some of the critical
actionable insights for the manufacturers/ marketers
ISSN: 0971-1023 | NMIMS Management ReviewVolume XXXIII January 2017
Study of the factors affecting the selection of orthopaedic implantbrands and their perceptual mapping in Mumbai city
ISSN: 0971-1023 | NMIMS Management ReviewVolume XXXIII January 2017
Study of the factors affecting the selection of orthopaedic implantbrands and their perceptual mapping in Mumbai city82 83
cities of India, and therefore street
Contents
mall farmers. Majority of the
farmers (82%) borrow less than
Rs 5 lakhs, and 18% borrow
between Rs 5 – 10 lakhs on a
per annum basis. Most farmers
(65.79%) ar
Table sub source heading
** p < .01 + Reliability coefficie
References
Table 23: The Results of Mann-Whitney U Test for DOWJONES Index Daily Returns

of the implants. For example, there is no brand out of
the seven selected top brands which is perceived to
optimally satisfy all the factors considered important
by orthopaedic surgeons, opening new opportunities
for the existing players to revisit their marketing
c o m m u n i c a t i o n s t ra t e g y o r e v e n p ro d u c t
development as the case may be. This is indeed an
opportunity for both existing players as well as the new
players to design their offering accordingly.
Limitations of the study
Although the study achieved its intention, there were
some limitations. The sampling technique used for the
study was purposive sampling, which does not rule out
selection bias, the possibility of socially desirable
responses, and probable variation in data collection.
The study was limited to a specific geographical area
i.e. Mumbai. In addition, the responses given by
orthopaedic surgeons were limited to only seven
international implant brands. Overcoming these
limitations is required for generalization of the results
obtained.
Scope for future research
Going forward, there are several ways to enhance this
study:
• A comparative study of Indian and international
implant brands can be done to understand the
overall market scenario.
• As a precedent has yet to be established
concerning the generalization of the factors
affecting the perception of orthopaedic surgeons
in tier I and tier II cities, this study can further be
extended to tier II cities.
• The new generation of orthopaedic implants,
being researched, are expected to offer
supplementary features including promoting
osteoconduction and angiogenesis as well as
osteogenecity and antibacterial properties.
Hence, these forms of implants can also be
included in future studies (Bagherifard, 2016),
(Xiao Lin, 2017).
References
• Xiao Lin, S. Y. (2017, January 1). Orthopedic implant biomaterials with both osteogenic and anti-infection
capacities and associated in vivoevaluation methods. Nanomedicine: Nanotechnology, Biology and Medicine,
123-142.
• (2013). Executive Summary - The Orthopedic Industry Annual Report. Executive Summary, Orthoworld, Ohio,
USA.
• PR Newswire. (2014, Nov 12). Retrieved July 15, 2015, from Over 3,000 4WEB Medical 3D-Printed Orthopedic
Truss Implants Used By Surgeons: http://www.prnewswire.com/news-releases/over-3000-4web-medical-3d-
printed-orthopedic-truss-implants-used-by-surgeons-282418411.html#
• About DePuy Synthes. (2015, August 20). Retrieved August 20, 2015, from https://www.depuysynthes.com:
http://emea.depuysynthes.com/about
• (2016, Aug 31). Research and Markets - Hip and Knee Orthopedic Surgical Implants: Market Shares, Strategies,
and Forecasts, Worldwide, 2016-2022 - Zimmer is the Market Leader. Dublin, New York: PR Newswire
Association, LLC.
• AAOS Position statement. (n.d.). Retrieved 7 15, 2015, from aaos.org: http://www.aaos.org/
CustomTemplates/Content.aspx?id=5602
• Eberhardt. (2006, March 8). Ibandronate treatment may improve durability of cementless metal orthopedic
implants. Biotech Week, 78.
• Enriquez, J. (2015, June 15). India To Form Independent Medical Device Regulation Body. Retrieved July 15,
2016, from Meddeviceonline: http://www.meddeviceonline.com/doc/india-to-form-independent-medical-
device-regulation-body-0001
• Exactech Inc . Home page . (n .d . ) . Retr ieved 7 13, 2015, f rom https ://www.exac .com:
http://www.exac.com/front-page#
• Fran Bursic. (2013). Executive Summary -7 , The Orthopaedic Industry Annual Report. Ohio USA: ORthoworld
Inc.
• IRENA GOTMAN, P. D. (2009, March 30). Characteristics of Metals used in Implants. Journal of Endourology,
11(6), 383-389.
• Jack E. Parr, R. D. (1995). Patent No. US 5443512 A. USA.
• John Hauser, F. K. (1979, November). Alternative perceptual mapping techniques : Relative Accuracy and
Usefulnss. Journal of Marketing Research, Vol XVI, 495-506.
• Koppelman, J. R. (1979, November). Alternative Perceptual Mapping Techniques: Relative Accuracy and
Usefulness. Journal of Marketing Research, XVI, 495-506.
• Marcelo Kropf, A. M. (2014, December). New Orthopedic Prosthetic Devices as an Innovation Opportunity in
Health in Brazil. Business Management Review(Special Issue - V/4/N/3).
• Maxxmed Home Page. (n.d.). Retrieved 7 14, 2015, from http://www.maxxmed.com/us/about-maxx-
medical.html
• Montserrat Nunez, E. N. (2010, August). Quality of Life after joint replacement for osteoarthritis. Future
Medicine, 6(4), 481-494.
• Mukherjee, R. (2015, 6 23). Govt may cap orthopaedic implant prices. Times of India- India Business.
• Nagrajan, R. (2014, 9 30). Higher duties hit local mfg of medical devices. Retrieved 7 15, 2015, from Times of
ISSN: 0971-1023 | NMIMS Management ReviewVolume XXXIII January 2017
Study of the factors affecting the selection of orthopaedic implantbrands and their perceptual mapping in Mumbai city
ISSN: 0971-1023 | NMIMS Management ReviewVolume XXXIII January 2017
Study of the factors affecting the selection of orthopaedic implantbrands and their perceptual mapping in Mumbai city
• Alfred J. Tria, J. M. (2014, April). Minimally invasive total knee arthoplasty: The importance of instrumentation.
Orthopedic Clinics, 35(2), 227-234.
• Bagherifard, S. (2016, November 5). Mediating bone regenerationby means of drug eluting implants: from
passive to smart strategies. (E. Lavernia, Ed.) Material Science and Engineering : C.
• CA Engh, J. B. (1987, January 1). Porous-coated hip replacement. The factors governing bone ingrowth, stress
shielding, and clinical results. The Bone & Joint Journal, 69- B(1), 45-55.
• CPT Dionisio Ortiz III, M. U. (2014). Patient Perceptions of Surgeon–Industry Relations. Military Medicine,
179(12), 1469-1473.
• Dinesh Peter, Infosys Consulting. (2015). VIEWPOINT. Retrieved 7 25, 2015, from Indian Medical Device
Industry: https://www.infosys.com/consulting/insights/Documents/indian-medical-device-industry.pdf
• Donoghoe, N., Gupta, A., Linden, R., Mitra, P., & Von Morgenstern, I. B. (2012, June). Medical device growth in
Emerging Markets: Lessons from other Industries. IN VIVO, 30(6), pp. 48-56.
• Eberhardt. (2006, March 8). Ibandronate treatment may improve durability of cementless metal orthopedic
implants. Biotech Week, 78.
84 85
cities of India, and therefore street
Contents
mall farmers. Majority of the
farmers (82%) borrow less than
Rs 5 lakhs, and 18% borrow
between Rs 5 – 10 lakhs on a
per annum basis. Most farmers
(65.79%) ar
Table sub source heading
** p < .01 + Reliability coefficie
References
Table 23: The Results of Mann-Whitney U Test for DOWJONES Index Daily Returns
India: http://timesofindia.indiatimes.com/business/india-business/Higher-duties-hit-local-mfg-of-medical-
devices/articleshow/43834255.cms
• Peter F. Sharkey, M. ,. (1999, April). Factors influencing choice of implants in total hip arthroplasty and total
knee arthroplasty: Perspectives of surgeons and patients. The Journal of Arthoplasty, 14(3), 281-287.
• Robert C. MacCallum, K. F. (1999). Sample size in Factor Analysis. Psychological Methods, 4(1), 84-99.
• Rupali Mukharjee. (2015, June 23). Govt may cap orthopedic implant prices. Times of INDIA.
• Smith-nephew Home page. (n.d.). Retrieved 8 13, 2016, from Delivering advanced medical technologies:
https://www.smith-nephew.com/investor-centre/about-us/improving-quality-of-life/
• Tara Shelton. (2014). Analysis of the Global Orthopedic Implant Market. Frost & Sullivan.
• Vora, P. (2012, 12 11). Costs that bring you to your knees. Retrieved 7 15, 2015, from Hindustan Times:
h t t p : / / w w w. h i n d u sta n t i m e s . c o m / m u m b a i /c o st s - t h a t- b r i n g -yo u - to -yo u r- k n e e s /s to r y-
QJaIKwO1HdjvD31LLC1ONN.html
• Wa l d e m a r L I N K h o m e p a g e . ( n . d . ) . R e t r i e v e d 7 1 2 , 2 0 1 5 , f r o m L i n ko r t h o p a e d i c s :
http://www.linkorthopaedics.in/us/for-the-physician/products/index.html
• Xiao Lin, S. Y. (2017, January 1). Orthopedic Implant biomaterials with both osteognic and anti-infection
capacities and associated in vivoevaluation methods. Nanomedicine: Nanotechnology, Biology and Medicine,
13(1), 123-142.
• Zimmer : Personal fit and renewed life. (n.d.). Retrieved July 21, 2016, from Zimmer: http://www.zimmer.com/
Haresh Raulgaonkar, Assistant Professor (Technology Management) at SVKM's NMIMS Shobhaben
Pratapbhai Patel School of Pharmacy & Technology Management, has 19 years of rich and diverse
experience in Petrochemicals, Biscuits, Soft drinks, Edible oils and Ginning industries, including a 7-year stint
in Africa. After this phase, he started his academic journey and over the last 9 years, has been teaching in
various reputed institutes of Mumbai. Currently he is pursuing Ph.D. from Mumbai University. He is also a
certified SAS professional with Global certifications of BASE SAS, Visual Analytics and Predictive Analytics.
His areas of interest are Quantitative Techniques, Marketing Research, Operations Management and
Business Analytics. He can be reached at [email protected]
Aishwarya Wagle, a 5th year student of B. Pharm + MBA (Pharma Tech), SVKM's NMIMS Shobhaben
Pratapbhai Patel School of Pharmacy & Technology Management, has done her internship at Glaxo Smith
Kline Pharmaceuticals, Mumbai. Her interest in the orthopaedic implants market motivated her to perform
this market research study under the guidance of Prof. Haresh Raulgaonkar. She can be reached at
Henna Shah, a 5th year student of B. Pharm + MBA (Pharma Tech)
SVKM's NMIMS Shobhaben Pratapbhai Patel School of Pharmacy & Technology Management, has done her
technical internship in the manufacturing department at Cipla India Limited and management training from
ISSN: 0971-1023 | NMIMS Management ReviewVolume XXXIII January 2017
Study of the factors affecting the selection of orthopaedic implantbrands and their perceptual mapping in Mumbai city
ISSN: 0971-1023 | NMIMS Management ReviewVolume XXXIII January 2017
Study of the factors affecting the selection of orthopaedic implantbrands and their perceptual mapping in Mumbai city
Zenovis Life Sciences. Henna has presented a research paper which focused on an in-depth analysis of
doctors' perception for treatment of breast cancer. She is an active participant in many extracurricular
activities and is a silver medalist in National Level Quiz Competition (Absolute Pharmaceutical Intellect)
organized by NMIMS SPPSPTM. She is head of the Public Relations Department and a member of “Isthmus-
Urjja” annual cultural festival of NMIMS, SPP SPTM and at Kshamta (SRF of NMIMS, SPP SPTM). She can
be reached at [email protected]
Anshul Garg, Assistant Professor (Technology Management) at SVKM's NMIMS Shobhaben Pratapbhai
Patel School of Pharmacy & Technology Management, has more than six years of experience in industry and
academics. She has worked as a Research and Academic Associate at Indian Institute of Management Indore
and S.P. Jain Institute of Management and Research, Mumbai, in the area of Strategic Management &
Marketing Management. She has gained corporate experience by serving Central India's leading advertising
agency in the client servicing department. She has co-authored and presented several research papers in
national and international conferences. Having done her MBA in advertising & public relations with a
distinction, she has an excellent academic record backed with experience of the advertising field. Her
research interest areas are Brand Management, Strategic Management & Consumer Behaviour. She can be
reached at [email protected]
Yugal Sikri, Chairman, Pharmaceutical Management at SVKM's NMIMS School of Business Management
and Director, Pharmaceutical Technology Management at SVKM's NMIMS Shobhaben Pratapbhai Patel
School of Pharmacy and Technology Management, is a senior pharma industry professional with 35+ years
of rich experience in managing products, people and overall businesses in diverse and global corporate
settings i.e. MNCs of European, American and Japanese origin or home grown Indian companies,
successfully managing large businesses and building mega-brands. He has been a recipient of a number of
awards, both global and national, a member of the Steering Committee of McKinsey's India 2020 publication
and speaker at the McKinsey CEO forum. He has also been the Vice-Chair of OPPI Marketing Committee. His
pedigree includes education from leading universities / institutes i.e. Delhi, IIT-BHU, Jamnalal Bajaj,
Thunderbird and Harvard and work experiences in companies as Glaxo SmithKline, Warner Lambert/Parke
Davis/Pfizer, Novartis, RPG and Ranbaxy. His last corporate assignments include Global Head, Marketing
(Commercial Functions) and Region Head, India, Sri Lanka and Nepal at Ranbaxy, Mumbai. He is also an
Independent Director on the Boards of RPG life Sciences and Global Space Technologies. He can be reached
86 87
cities of India, and therefore street
Contents
mall farmers. Majority of the
farmers (82%) borrow less than
Rs 5 lakhs, and 18% borrow
between Rs 5 – 10 lakhs on a
per annum basis. Most farmers
(65.79%) ar
Table sub source heading
** p < .01 + Reliability coefficie
References
Table 23: The Results of Mann-Whitney U Test for DOWJONES Index Daily Returns

ISSN: 0971-1023 | NMIMS Management ReviewVolume XXXIII January 2017
ISSN: 0971-1023 | NMIMS Management ReviewVolume XXXIII January 2017
Expiration Day Impact on the Indian Spot Market Volatility
Abstract
This paper examines the impact of expiration of
derivatives on the spot market volatility. The study
uses daily data of National Stock Exchange of India
from June 12, 2000 to December 31, 2015. It is noticed
that in Indian stock exchanges, the expiration effect is
not restricted to expiration days; it impacts the entire
expiration week. To examine this attribute, the
expiration day and the expiration weeks are taken into
consideration to find out the volatility in the
underlying spot market. The results of the GARCH,
TGARCH, EGARCH indicate that for the entire period
undertaken for study, the derivatives expiration
days/weeks are considerable factors in enhancing the
volatility of the spot market. It is observed that the
expiration day impact is primarily owing to increased
volumes in near-month contracts and following the
cash based settlement system. The observations may
be applied by the investors to strategize their
investments in the derivatives and the spot market
respectively and also by the policy makers to consider
upon a more appropriate settlement system.
Key Words: Expiration Day Effects, Volatility, GARCH
(1,1), TGARCH, EGARCH
JEL classification: G12, G14.
Expiration Day Impact on the Indian
Spot Market Volatility
Sangeeta Wats
Expiration Day Impact on the Indian Spot Market Volatility
1. Introduction
Spot market volatility dynamics is recognized to be
influenced by the expiration day effect on the
expiration of derivative contracts. It is identified to be
triggered by trading strategies of arbitrageurs and
speculators, and is documented by the settlement
procedure followed in a specific market. Increased
volatility reduces the effectiveness of a hedge made by
arbitrageurs as they unwind their position in
proportion to the volume traded during the relevant
period, which cannot be estimated specifically in
advance. If numerous arbitrageurs liquidate around
the same time and in the similar direction, price effects
are probable. A further potential explanation for
expiration day price effects is the conscious attempts
to manipulate prices wherein a speculator with a
naked position in an expiring contract might have a
considerable financial interest in the contract's
settlement price and thereby willing to place small
cash market trades at non-equilibrium prices to
influence the index in a constructive direction. It is
observed that around and during expiration days
during the settlement of derivative contracts, there is a
significant increase in volume and volatility across the
exchanges.
This paper examines the expiration effects on the
market index as opposed to prices of individual stocks
thereby extenuating problems that may occur due to
information that affects prices of individual stocks
considerably more than a broader market index. The
market indices are likely to be affected less by liquidity
effects than the prices of individual stocks.
Furthermore, the turnover in the index derivatives
markets is significantly greater than that in the market
for derivatives products related with individual stocks.
Hence, expiration day effects are likely to be much
more prominent for market indices than for individual
stocks. In this study, the GARCH model and the
asymmetric GARCH model like TGARCH and EGARCH
are applied to capture the expiration day/week effects.
The present study examines the expiration day effects
and the expiration week effects on the spot market
volatility during the post-derivatives period taking into
account the longest time period of study in the Indian
context.
2. REVIEW OF LITERATURE
Empirical literature relating to the impact of expiration
day of financial derivatives i.e. both futures and
options, on the stock market, has received enormous
attention of the regulators and has consequently
generated interest on such effects within the research
community. This facet is broadly segregated into two
components i.e. the studies undertaken in the
international arena and in India, which are
enumerated below:
The consequence of derivative expirations on the spot
market has been studied in the past. The series of
studies done by Stoll and Whaley (1986, 1987, and
1991) inspected expiration-day effects of U.S. index
derivatives. Prior to June 1987, all US stock index
futures and options were cash-settled at closing index
levels. Stoll and Whaley (1986, 1987) investigated the
impact of expiration-day for this period and
established abnormally high index stock trading
volume and small stock price movements in the last
hour of trading on quarterly expiration days when all
index derivative contracts expired simultaneously. On
non-quarterly expirations, fewer index contracts
expired and, consequently, trading volumes were not
as high and price effects were smaller.
Edwards (1988) investigated the volatility of the S&P
500 index and the Value Line Composite Index (VLCI)
indices previous to and after the introduction of the
corresponding futures using daily data from the period
1973-1987. However, it was concluded that there is no
extended impact of index futures trading on spot
market volatility. It was instituted that a higher short-
te r m vo l at i l i t y o f t h e s p o t m a r ket ex i st s ,
88 89
cities of India, and therefore street
Contents
mall farmers. Majority of the
farmers (82%) borrow less than
Rs 5 lakhs, and 18% borrow
between Rs 5 – 10 lakhs on a
per annum basis. Most farmers
(65.79%) ar
Table sub source heading
** p < .01 + Reliability coefficie
References
Table 23: The Results of Mann-Whitney U Test for DOWJONES Index Daily Returns

ISSN: 0971-1023 | NMIMS Management ReviewVolume XXXIII January 2017
ISSN: 0971-1023 | NMIMS Management ReviewVolume XXXIII January 2017
Expiration Day Impact on the Indian Spot Market Volatility Expiration Day Impact on the Indian Spot Market Volatility
predominantly on the expiration days of index futures
contracts.
Herbst and Maberly (1990) investigated whether the
change of the expiration settlement procedures for the
S&P 500 in June 1987 lowered the spot expiration
volatility. They found the change in triple witching
hour volatility and expected price reversal, in two
different studies respectively, before and after the new
settlement procedure. The outcome of their study was
consistent with the observations of Stoll and Whaley
(1991). They identified that the volatility on the
expiration days has been significantly reduced, but the
volatility has been shifted within a day together with a
significant increase in the first hour volatility.
Hancock (1991) applied minute-by-minute S&P 500
index values for the period from April 30, 1987 to July
24, 1989 to investigate the triple witching hour effect.
He established that there was no expiration-day effect
in the underlying spot market. He further designated
that the remarkable increase or decrease in the
underlying spot market volatility around the triple
witching hour in the US may be ascribed to investors'
reaction to new information, especially vital economic
news which is generally disclosed on Fridays, that is,
the identical day as the expiration of the futures
contracts.
Pope and Yadav (1992), Schlag (1996) Karolyi (1996)
observed a strong influence of the expiration day
effects. Karolyi (1996) studied anomalous price and
volume effects for Japanese stocks during the period
May 1988 through November 1991. He recognized
abnormally large trading volume during expiration and
small but economically insignificant price effect
reversals of 0.20%.
Stoll and Whaley (1997) established identical
inferences for the SFE's (Sydney Futures Exchange)
AOI futures and options. He observed that the volume
in the last half-hour of trading was 30.81% of the total
daily volume on expiration days as evaluated with
21.07% during non-expiration days. They observed
considerable volume effects on account of expiration
days and did not observe any significant price effect on
expiration days.
Bollen and Whaley (1999) investigated the price and
volume changes during expirations of the Hong Kong
Futures Exchange's Hang Seng Index (HSI) derivative
contracts and observed no confirmation of augmented
stock market volatility. They also established that
volatility increased during expiration week but was not
significantly dissimilar from non-expiration week.
Corredor, Lechon and Santamaria (2001) studied the
effect of expiration of the IBEX-35 Index derivatives
and the first four stock options traded in the Spanish
Equity Derivatives Exchange on the return, conditional
volatility and trading volume of the underlying assets.
The period of study was from January 1992 to
December 1995. On applying the GARCH (1, 1) model
they found that there was a downward pressure on
prices, a decline in the volatility level in the week prior
to the expiration date and a noteworthy rise in the
trading volume during the expiration date.
Kan (2001) observed the stock market of Hong Kong for
the period March 1989 to December 1992. He did not
find any impact of expiration day effect, neither on the
whole expiration day nor instantaneously prior to the
close. Kan recommended that the disparity in market
microstructure between North America and Hong
Kong could clarify the inconsistency in the outcomes.
The variation in the market microstructure comprised
of dissimilar expiration days, the distinction in the
calculation of the settlement price, the variation in the
trading mechanism of the underlying spot markets,
the differentiation in short selling restrictions and the
lack of program trading in Hong Kong. Kan
recommended that distinct macroeconomic factors
may be the factors for the dissimilar consequences.
Chow, Yung and Zhang (2003) analyzed the evidence of
the expiration of Hang Sang Index (HIS) derivatives on
the underlying spot market in Hong Kong. They used
the Comparison Period Approach, from 1990 to 1999
and confirmed that expiration days in Hong Kong may
be associated with some return volatility on the
underlying stock market and a negative price effect.
They observed that there was no abnormal trading
volume on the expiration day or price reversal after
expiration. Hence, the survival of expiration day effects
was not recognized in the Hong Kong exchange.
Hagelin, Niclas & Alkeback, Per (2004) analyzed the
index futures and options expiration day effects on the
Swedish market and confirmed that the trading
volumes on the spot market are considerably
increased on expiration days as compared to other
days. The study found no evidence of price distortions.
Lien and Yang (2005) examined the expiration day
effect of the stock options traded in Australian Stock
Exchange (ASX) on volatility, return and the price
changes of individual stocks from 1993 to 1997 and
inferred that the switch of a futures contract from cash
settlement to physical delivery promoted the
expiration effect on volatility and return, and had a
leveraged impact on the temporary price changes on
expiration days.
Fung, Joseph K.W. and Yung, Haynes (2007) did not
observe any significant price compression patterns or
price reversal. However, they observed order
imbalance pattern on some expiration days. The
outcomes showed no relationship between order
imbalance pattern and the next-day return. They
observed no price reversal pattern on the following
day.
There are studies related to the impact of the
expiration day effect on the Indian stock market which
are enumerated below:
Thenmozhi and Thomas (2004) had undertaken a
study period from June 2000 to August 2003 to study
the expiration effects and applied the GARCH (1,1)
model. They concluded that expiration day effect is
irrelevant in explaining the spot market volatility;
however, in the sub-period of their study which
included the trading of all the derivative products, they
inferred that expiration day is a vital factor in
explaining the spot market volatility. They observed an
increase in the volatility on expiration days and
expiration weeks.
Vipul (2005) used 14 equity shares to examine the
impact of expiration day in the Indian stock market.
The stocks were chosen in a manner that simulated a
series of different liquidities for the associated
derivative products. The volatility, price and volume of
the underlying shares in the spot segment were
examined by using the Wilcoxon matched-pairs
signed-rank test. He concluded that prices in the spot
market were slightly low a day before the expiration on
the der ivat ive contracts and strengthened
considerably the day after the expiration. He inferred
that several shares do not result in price reversals and
the trading volumes are higher on expiration days
rather than on non-expiration days.
Singh and Bhatia (2006) confirmed that there was
absence of any unfavourable effect of expiration day
on the spot market volatility. Their analyses
demonstrated a significant, however small, decrease
in volatility on expiration days.
Bhaumik and Bose (2007) applied the daily data of
Nifty from June 2000 to September 2006 for their
study and applied the AR-GARCH model. They
concluded that the trading volumes were notably high
90 91
cities of India, and therefore street
Contents
mall farmers. Majority of the
farmers (82%) borrow less than
Rs 5 lakhs, and 18% borrow
between Rs 5 – 10 lakhs on a
per annum basis. Most farmers
(65.79%) ar
Table sub source heading
** p < .01 + Reliability coefficie
References
Table 23: The Results of Mann-Whitney U Test for DOWJONES Index Daily Returns

on expiration day and during the expiration week. They
observed a considerable expiration day impact on daily
returns of the market index and also on the volatility of
these returns.
Mukherjee and Mishra (2007) investigated on the
option expiration day effect and observed that the
option expiration effect did not happen exactly on the
expiration date. They observed that the impact began
from the previous five days till the date of expiration.
Jindal and Bodla (2007) found the existence of an
abnormally high volume and volatility on expiration
day, confirming that manipulating and arbitrage
activities took place in the market and that positions
are unwound at the time of expiration. They observed
that the unwinding of arbitrage positions did not cause
any major price deformation at expiration, since there
is no momentous change in the return on stocks during
the expiration day.
Maniar, Bhatt and Maniar (2009) studied the
expiration hour effect of futures and options markets
on the cash market. They applied the daily and high
frequency data on S&P CNX Nifty Index. They observed
that although there is no downward or upward
pressure on index returns, the volatility was
considerably influenced by the contracts expirations.
However, no such effect was observed in the daily
data.
Bodla and Jindal (2008), Debasish (2010), Tripathy
(2010) have found significant volume effects on
account of expiration days.
It is found that various researchers have observed
unusual action in the underlying markets on the
expiration of the derivatives contract. The researchers
also claim that the alterations in the volatility on
expiration day may be owing to issues such as some
economic news revealed on the same day of the
expiration of the derivatives contract.
This study examines the dynamics of expiration
day/week effect in the Indian context. The study is
unique as it takes into account the longest period for
studying this aspect and used the econometric
technique - both the symmetric GARCH model and the
asymmetric GARCH model - namely TGARCH and
EGARCH.
3. METHODOLOGY
This study evaluates the expiration days/weeks effects
during the period from June 12, 2000 to December 31,
2015. The data used in this study has been taken from
the National Stock Exchange website and includes
daily observations for the closing price of S&P CNX
Nifty. It is observed that in the Indian stock market, the
expiration effect is not restricted to expiration days; it
is noticed in the entire expiration week. To investigate
this feature, the expiration weeks are also taken into
account to find out the volatility in the underlying spot
market. Expiration day and expiration week effects are
wholly associated with the post derivatives trading.
For evaluating the structure of volatility, the GARCH
class of models is used due to the time varying nature
of volatility, which also provides an avenue for
verifying the presence of endogenous drivers of
volatility shifts.
The mean equation is estimated as follows:
6
R = β + β R + β R + Σ β DAY + ε , ε |Φ ~N(0,h ) (1)nifty, t 0 1 nifty junior, t 2 SP500, t –1 j j t t t –1 t
J=3
where R the daily change in natural log prices for S&P CNX Nifty Index. nifty, t is
R is the daily changes in natural log prices for CNX Nifty Junior Index. nifty junior, t
ISSN: 0971-1023 | NMIMS Management ReviewVolume XXXIII January 2017
ISSN: 0971-1023 | NMIMS Management ReviewVolume XXXIII January 2017
Expiration Day Impact on the Indian Spot Market Volatility Expiration Day Impact on the Indian Spot Market Volatility
R is the daily changes in natural log prices for SP500, t –1
lagged S&P 500 Index. DAY are day-of-week dummy j
variables for Tuesday to Friday. A significant β β β β 0, 3, 4, 5,
β demonstrates that Nifty returns display Monday 6
effect, Tuesday effect, Wednesday effect, Thursday
effect and Friday effect respectively. As the proxy
variables eliminates the market wide influences,
world market influences and day-of-the-week effect,
the error term captures the impact of factors specific
to the market on which the futures contract is written
and the variance of ε offers a measure of volatility t
precisely to the introduction of derivatives.
2h = α + α ε + α h + α D (2)t 0 1 t-1 2 t-1 3 ED
2h = α + α ε + α h + α D (3)t 0 1 t-1 2 t-1 3 EW
where h is the conditional volatility.t
α α α are parameters to be estimated, α >0, α ≥00, 1, 2 0 1 ,
α ≥0.2
The stationary condition for GARCH (1,1) is α + α <1. If 1 2
this stipulation is satisfied, it confirms that the
conditional variance is finite. The parameters α and α 1 2
establishes the short run dynamics of the resulting
volatility of the time series. Outsized GARCH lag
coefficient α signifies that shocks to conditional 2
variance take a long time to fade out, so volatility is
'incessant'. Large GARCH error coefficient α shows 1
that volat i l i ty responds strongly to market
movements, so if α is comparatively high and α is 1 2
reasonably low, then volatility tends to be further
spiky.
D is a dummy variable. It has the value of one on ED
expiration days of derivatives contracts and 0 for other
days. Likewise, D is a dummy variable having the EW
value of one on all the days in an expiration week of
derivatives contracts and 0 for other days.
A positive value for α suggests an increase in volatility 3
and a negative value entails decline in volatility. If the
coefficient of the dummy is statistically significant,
then there is an expiration day effect and the
expiration week effect on the spot market volatility.
GARCH models display some confines in capturing the
stylized characteristics of the data like volatility
clustering, leverage effect and heavy tails. The most
noteworthy characteristic is the leverage effect which
results as predictable volatility increases significantly
due to unexpected drop in price due to bad news than
unexpected increase in price due to good news of
matching scale. A fall in price accentuates financial
leverage, which makes the stock riskier and enhances
its volatility. Researchers treat leverage effect identical
to asymmetric volatility. The asymmetric effect is
captured using three models, namely, EGARCH model
and TGARCH model.
4. Results
The expiration day effect on volatility is discussed first,
followed by the evidence on volatility and expiration
week effect.
4.1 Expiration Day Effect on Spot Market Volatility
The results of the impact of Nifty index derivatives
expiration days on the volatility of the spot market is
reported in Exhibit 1. It is evident that for the entire
period undertaken for study, the expiration days is a
significant factor in explaining the volatility of the spot
market. A significant positive α3 implies that there is
an increase in the volatility on expiration days. Hence,
the null hypothesis that Nifty index derivatives
expiration days do not affect spot market volatility is
rejected.
92 93
cities of India, and therefore street
Contents
mall farmers. Majority of the
farmers (82%) borrow less than
Rs 5 lakhs, and 18% borrow
between Rs 5 – 10 lakhs on a
per annum basis. Most farmers
(65.79%) ar
Table sub source heading
** p < .01 + Reliability coefficie
References
Table 23: The Results of Mann-Whitney U Test for DOWJONES Index Daily Returns

Exhibit 1: Estimates of GARCH (1,1) Model ,TGARCH (1,1), EGARCH(1,1) Amplified with Expiration Day Effects
Parameters Entire - Period (June 2000- December 2015)
Estimates
β0 Intercept 0.000135
β1 Nifty Junior Return 0.752863**
β2 Lagged S&P 500 0.118545**
β3 Tuesday Dummy 0.000291
β4 Wednesday Dummy
-0.000468
β5 Thursday Dummy
0.000589
β
6
Friday Dummy
0.000298
α0
ARCH0
1.24E-06
α1
ARCH1
0.058894**
α2
GARCH (1,1)
0.709128**
TGARCH (1,1)
0.082712**
EGARCH(1,1)
0.041821**
α3
Expiration Day Dummy
1.86E-05**
N
Expiration Days
Adjusted R-squared
Unconditional Variance
Persistence of Volatility
3967 187
0.755826
0.00002648
0.984892
Note: ** Significant at 5% level of significance
4.2 Expiration Week Effect on Spot Market Volatility
The effect of Nifty index derivatives expiration weeks
on the volatility of the spot market is illustrated in
Exhibit 2. It is observed that expiration week effect for
the entire period plays an insignificant role on the spot
market. A positive α3 denotes that there is an increase
in the volatility on expiration weeks. Thus, the null
hypothesis that Nifty index derivatives expiration
weeks do not affect spot market volatility is rejected.
ISSN: 0971-1023 | NMIMS Management ReviewVolume XXXIII January 2017
ISSN: 0971-1023 | NMIMS Management ReviewVolume XXXIII January 2017
Expiration Day Impact on the Indian Spot Market Volatility Expiration Day Impact on the Indian Spot Market Volatility
Exhibit 2: Estimates of GARCH (1,1) Model ,TGARCH(1,1), EGARCH (1,1) Amplified with Expiration Week Effects
Parameters
Entire -
Period
(June 2000-
December 2015)
Estimates
β0
Intercept
0.000158
β1
Nifty Junior Return
0.768608**
β2
Lagged S&P 500
0.124896**
β3
Tuesday Dummy
0.000379
β4
Wednesday Dummy
-0.000584
β5
Thursday Dummy
0.000968
β 6
Friday Dummy
0.000236
α0
ARCH0
1.72E-06**
α1
ARCH1
0.066137**
α2
GARCH(1,1)
0.808712**
TGARCH(1,1)
0.909871**
EGARCH(1,1) 0.721824**
α3 Expiration Week Dummy 2.36E-06
N
Expiration Weeks
Adjusted R-squared
Unconditional Variance
Persistence of Volatility
3967
920
0.782411
0.00005308
0.975539
Note: ** Significant at 5% level of significance
5. Conclusion
The analysis of the post derivatives period confirms
that the effect of both the expiration days and
expiration weeks on the spot market volatility is very
significant. Volatility on expiration and expiration days
designates that investors are unsure and desire to roll
over their position. It may be owing to manipulative
activities. The temporary increase in volatility cannot
destabilize the markets in the long run. It can be
concluded that due to the introduction of futures and
options of the near month, the spot market volatility
has increased in the expiration days and expiration
weeks. The manipulation by speculators may be the
central basis behind high volatility during and
subsequent to expiry of these contracts. The effect of
expiry day volume on return and volatility shows that
affirmative and significant causality is running from
volume to volatility and return which focuses on the
fact that prices are speculative and the traders take
large spot positions to cover their risk thereby
accentuating the volatility during the expiration
period.
It is concluded that volumes in near-month contracts
should be regulated in order to avoid such an anomaly.
The regulators must take essential actions to curb
volatility whenever volumes rise to a level higher than
normal level during expiration. One of the measures
which may be taken is by familiarizing the far-month
contracts and also by taking measures l ike
implementing physical settlement rather than going
for cash settlement.
94 95
cities of India, and therefore street
Contents
mall farmers. Majority of the
farmers (82%) borrow less than
Rs 5 lakhs, and 18% borrow
between Rs 5 – 10 lakhs on a
per annum basis. Most farmers
(65.79%) ar
Table sub source heading
** p < .01 + Reliability coefficie
References
Table 23: The Results of Mann-Whitney U Test for DOWJONES Index Daily Returns
The potential future work which may be undertaken in
this domain is to examine the impact of the expiration
day by using high frequency intra-day data to capture
the information displayed in the opening trading
section and across the trading windows which will
bring out explicitly the potential factors accountable
for the market anomalies of the expiration day effects.
References
• Bhaumik S and Bose S (2007), “Impact of Derivatives Trading on Emerging Capital Markets: A Note on Expiration
Day Effects in India”, William Davidson Institute, Working Paper Number 863, www.ssrn.com.
• B. S. Bodla and K. Jindal, “Equity derivatives in India: growth pattern and trading volume effects,” ICFAI Journal
of Derivatives Markets, vol. 5, pp. 62–82, 2008.
• Bollen N P B and Whaley R E (1999), “Do Expirations of Hang Seng Index Derivatives Affect Stock Market
Volatility?” Pacific Basin Finance Journal, Vol.7, pp. 453-470.
• C. Schlag, “Expiration-day effects of stock index derivatives in Germany,” European Financial Management, vol.
2, pp. 69–95, 1996.
• Chow Y F, Yung H H M and Zhang H (2003), “Expiration Day Effects: The Case of Hong Kong”, The Journal of
Futures Market, Vol.23, No.1, pp.67-86.
• Corredor P, Lechon P and Santamaria R (2001), “Option Expiration Effects in Small Markets: The Spanish Stock
Market”, The Journal of Futures Market, Vol.21, Iss. 10, pg. 905-928.
• Edwards F R (1988), “Does Futures Trading Increase Stock Market Volatility?”, Financial Analysts Journal,
Vol.44, No.1, pp.63-69.
• Fung, Joseph K.W. and Yung, Haynes, 2007, ―Expiration –Day Effects-An Asian
• Twist, HKIMR Working Paper No. 1/2007. Available at SSRNhttp://ssrn.com/abstract=1007150
• Hagelin, Niclas &Alkeback, Per., 2004, ―Expiration day Effects of Index Futures and options: Evidence from a
Market with a Long Settlement Period, Applied Financial Economics, Vol. 14, pp. 385-396, Available at SSRN:
http://ssrn.com/abstract=432560
• Hancock G D (1991), “Futures Option Expirations and Volatility in the Stock Index Futures Market,” Journal of
Futures Markets, Vol.11, No.3, pp.319-330.
• Herbst A F and Maberly E D (1990), “Stock Index Futures, Expiration Day Volatility and the “Special” Friday
Opening: A Note”, Journal of Futures Markets, Vol.10, No.3 pp.323-325.
• Jindal K and Bodla B S (2007),“Expiration Day Effect of Stock Derivatives on the Volatility, Return and Trading
Volume of Underlying Stocks”, Vol. IV No.2 pp 46-57.
• Kan A C N (2001), “Expiration day effects: Evidence from High Frequency Data in the Hong Kong Stock Market”,
Applied Financial Economics, Vol.11, No.1, pp.107-118.
• Karolyi A G (1996), “Stock Market Volatility around expiration days in Japan”, Journal of Derivatives, Vol. 4,
pp.23-43.
ISSN: 0971-1023 | NMIMS Management ReviewVolume XXXIII January 2017
ISSN: 0971-1023 | NMIMS Management ReviewVolume XXXIII January 2017
Expiration Day Impact on the Indian Spot Market Volatility Expiration Day Impact on the Indian Spot Market Volatility
• Lien D and Yang L (2005), “Availability and Settlement of Individual Stock Futures and Options Expirations
Effects: Evidence from High-Frequency Data”, www.ssrn.com.
• Maniar H M, Bhatt R and Maniyar D M (2009), “Expiration Hour Effect of Futures and Options Markets on Stock
Market”- A Case Study on NSE (National Stock Exchange of India), International Review of Economics &
Finance, Vol.18, pp. 381-391.
• Mukherjee K and Mishra R K (2007), “Effect of Option Trading in Indian Cash Market: Further Evidence from Non
Price Variables”, The Indian Journal of Commerce, Vol. 60, No.4, pp. 1-15.
• N. Tripathy, “Expiration and week effect: empirical evidence from the Indian derivative market,” International
Review of Business Research Papers, vol. 6, pp. 209–219, 2010.
• P. F. Pope and P. K. Yadav, “The impact of option expiration on underlying stocks: the UK evidence,” Journal of
Business Finance & Accounting, vol. 19, pp. 329–344, 1992.
• S. S. Debasish, “Investigating expiration day effects in stock index futures in India,” Journal of Economics and
Behavioral Studies, vol. 1, pp. 9–19, 2010.
• Singh Y P and Bhatia S (2006), “Does Futures Trading Impact Spot Market Volatility? Evidence from Indian
Financial Markets”, Decision, Vol.33, No.2, pp.41-62.
• Stoll H R and Whaley R E (1997), “Expiration Day Effects of the All Ordinary Share Price Index Futures: Empirical
Evidence and Alternative Settlement Procedures,” Australian Journal of Management, Vol. 22, pp.139-174.
• Stoll H R and Whaley R E (1991), “Expiration Day Effects: What has Changed?” Financial Analysts Journal, Vol.47,
pp.58-72.
• Stoll H R and Whaley R E (1987), “Program Trading and Expiration Day Effects”, Financial Analysts Journal,
Vol.43, pp.16-28.
• Stoll H R and Whaley R E (1986), “Expiration Day Effects of Index Options and Futures”, Monograph Series in
Finance and Economics, Monograph-3.
• Thenmozhi M and Thomas M S (2004), “Impact of Index Derivatives on S&P CNX Nifty Volatility: Information
Efficiency and Expiration Effects”, The ICFAI Journal of Applied Finance, Vol. 8, No.8 pp. 36-55.
• Vipul (2005), “Futures and Options Expiration-Day Effects: The Indian Evidence”, The Journal of Futures
Markets, Vol.25, No.11, pp.1045-1065.
Dr. Sangeeta Wats is an Associate Professor in the finance area in SBM, NMIMS. She is Ph.D. in Finance from
Banaras Hindu University (BHU). She has industry and academic experience of fourteen years. Her areas of
interest in teaching include Risk Management and Derivatives, Security Analysis and Portfolio Management
and Corporate Finance. She has to her credit publications in international and national journals. Her research
paper has been adjudicated as the best research papers in international and national conferences. She can be
reached at [email protected] or [email protected]
96 97
cities of India, and therefore street
Contents
mall farmers. Majority of the
farmers (82%) borrow less than
Rs 5 lakhs, and 18% borrow
between Rs 5 – 10 lakhs on a
per annum basis. Most farmers
(65.79%) ar
Table sub source heading
** p < .01 + Reliability coefficie
References
Table 23: The Results of Mann-Whitney U Test for DOWJONES Index Daily Returns

Mo
saic
Des
ign
Idea
s: +
91
-22
-64
50
90
21
V. L. Mehta Road, Vile Parle (W), Mumbai-400 056 INDIAT: +91-22-4235 5555 E: [email protected] W: www.nmims.edu| |
(Declared as Deemed to be University under Section 3 of the UGC Act, 1956)
Narsee Monjee Institute of Management StudiesSVKM’s
cities of India, and therefore street
Contents
mall farmers. Majority of the
farmers (82%) borrow less than
Rs 5 lakhs, and 18% borrow
between Rs 5 – 10 lakhs on a
per annum basis. Most farmers
(65.79%) ar
Table sub source heading
** p < .01 + Reliability coefficie
References
Table 23: The Results of Mann-Whitney U Test for DOWJONES Index Daily Returns