stockholders’ quarterly financial report for the quarter ... · the amount of abe loans...
TRANSCRIPT

1
Stockholders’ Quarterly Financial Report
For the Quarter Ended June 30, 2018


3
SOUTHERN AGCREDIT, ACA MANAGEMENT’S DISCUSSION AND ANALYSIS
The following commentary reviews the financial performance of Southern AgCredit, ACA (Agricultural Credit Association), referred to as the association, for the quarter ended June 30, 2018. These comments should be read in conjunction with the accompanying financial statements and the December 31, 2017 Annual Report to Stockholders. The association is a member of the Farm Credit System (System), a nationwide network of cooperatively owned financial institutions established by and subject to the provisions of the Farm Credit Act of 1971, as amended, and the regulations of the Farm Credit Administration (FCA) promulgated thereunder. The consolidated financial statements comprise the operations of the ACA and its wholly-owned subsidiaries. The consolidated financial statements were prepared under the oversight of the association’s audit committee. Significant Events: In December 2017, the association’s board of directors declared a patronage in the amount of $17,899,898 to stockholders, including $9,502,359 to be paid in cash, and $8,397,539 in the form of non-qualified allocated equity on behalf of the individual stockholders and retained by the association. Nonqualified allocated equities are not taxable to the stockholder. The cash patronage was disbursed to the association stockholders in February 2018. The 2017 cash patronage represents a record return of earnings to the stockholders of the association. The association continues to provide its members with quality financial services. The board of directors and management remain committed to maintaining the financial integrity of the association while offering competitive loan products that meet the financial needs of agricultural producers. Loan Portfolio: Total loans outstanding at June 30, 2018, including nonaccrual loans and sales contracts, were $1,027,953,231 compared to $1,023,298,902 at December 31, 2017, reflecting an increase of 0.5 percent. Nonaccrual loans as a percentage of total loans outstanding were 0.3 percent at June 30, 2018 and December 31, 2017. The association recorded no in recoveries or charge-offs for the quarter ended June 30, 2018, or for the same period in 2017. The association’s allowance for loan losses was 0.1 percent of total loans outstanding as of June 30, 2018, and December 31, 2017. Agribusiness Loan Program
The Association utilizes the Mississippi Development Authority’s Agribusiness Enterprise Loan Program (ABE) to lower the cost of financing for its borrowers. The ABE loan program is designed to provide a percentage of low-cost state financing that is combined with private financial lending institutions’ loan proceeds to encourage loans to the agribusiness industry in the state.
The Association guarantees payment of the borrower’s ABE loan to the Mississippi Development Authority (MDA) and, therefore, the amount of ABE loans outstanding and due to MDA is included in “Loans” on the consolidated balance sheet with an offsetting liability at “Guaranteed obligations to government entities.” ABE loans totaled $15,972,750 and $16,573,976 as of June 30, 2018 and December 31, 2017, respectively. Risk Exposure: High-risk assets include nonaccrual loans, loans that are past due 90 days or more and still accruing interest, formally restructured loans and other property owned. The following table illustrates the association’s components and trends of high-risk assets.
Amount % Amount %Nonaccrual 2,855,815$ 32.6% 3,283,762$ 34.9%Formally restructured 294,058 3.4% 535,519 5.7%Other property owned, net 5,597,118 64.0% 5,597,118 59.4%
Total 8,746,991$ 100.0% 9,416,399$ 100.0%
December 31, 2017June 30, 2018

4
The balance of nonaccrual volume as of June 30, 2018 is primarily secured by real estate with a total specific allowance of $23,262 related to one loan. The decrease in nonaccrual volume since the prior year end is primarily related to loans to one borrower with a loan balance of $1,141,089 which paid off in the first quarter of 2018. The balance of other property owned as of June 30, 2018 is primarily related to the foreclosure of a large complex of loans to a group of borrowers originated in 2006, and recognized as nonperforming in the first quarter of 2008. Upon completion of the foreclosure, the association recognized an increase in other property owned related to the value of the acquired collateral from these loans of $11,145,692, and $8,563,039, as received in years 2010 and 2011, respectively. Subsequent decreases in value include property liquidations and market value adjustments. Investments: During the first quarter of 2010, the association exchanged $35,192,440 of mortgage loans that previously were covered under a long-term standby commitment to purchase agreement with Federal Agricultural Mortgage Corporation (Farmer Mac) for a Farmer Mac guaranteed agricultural mortgage-backed security. No gain or loss was recognized in the financial statements upon completion of the exchange transaction. The association continues to service the loans included in this transaction. These investments in guaranteed securities, with a remaining balance of $6,252,360, are included in this report’s Consolidated Balance Sheet as investments – held-to-maturity. Results of Operations: The association had net income of $5,040,189 and $10,444,026 for the three and six months ended June 30, 2018, as compared to net income of $4,594,047 and $9,040,102 for the same period in 2017, reflecting an increase of 9.7 and 15.5 percent primarily due to a refund from the Farm Credit System Insurance Corp (FCSIC). Net interest income was $6,552,194 and $13,159,633 for the three and six months ended June 30, 2018, compared to $6,392,313 and $12,672,315 for the same period in 2017.
Average AverageBalance Interest Balance Interest
Loans 1,021,744,834$ 24,026,792$ 976,262,050$ 21,578,713$ Investments 6,372,200 146,626 8,286,816 175,227 Total interest-earning assets 1,028,117,034 24,173,418 984,548,866 21,753,940
Interest-bearing liabilities 882,667,554 11,013,785 850,905,791 9,081,625 Impact of capital 145,449,480$ 133,643,075$ Net interest income 13,159,633$ 12,672,315$
Yield on loansYield on investments
Total yield on interest- earning assets Cost of interest-bearing liabilities Interest rate spread
Net interest income as a percentage of average earning assets
Six months ended: June 30, June 30,
2018 2017
4.74% 4.46%
2.58% 2.60%
2.52% 2.15%2.22% 2.31%
2018 2017
4.26%4.46%
Average Yield
4.64%
Average Yield4.74%

5
Interest income for the three and six months ended June 30, 2018, increased by $1,146,862 and $2,419,478, or 10.3 and 11.1 percent respectively, from the same period of 2017, primarily due to increase in earning assets and a marginal increase in loan yield. Interest expense for the three and six months ended June 30, 2018, increased by $159,811 and $487,318, or 2.5 and 3.9 percent, from the same period of 2017 due to an increase in interest-bearing liabilities, with a relative increase in rates on interest bearing liabilities. Average loan volume for the second quarter of 2018 was $1,021,744,834, compared to $976,262,050 in the second quarter of 2017. The average net interest rate spread on the loan portfolio for the second quarter of 2018 was 2.22 percent, compared to 2.31 percent in the second quarter of 2017. The association’s return on average assets for the six months ended June 30, 2018, was 1.97 percent compared to 1.78 percent for the same period in 2017. The association’s return on average equity for the six months ended June 30, 2018, was 13.34 percent, compared to 12.26 percent for the same period in 2017. Liquidity and Funding Sources: The association secures the majority of its lendable funds from the Farm Credit Bank of Texas (the bank), which obtains its funds through the issuance of System-wide obligations and with lendable equity. The following schedule summarizes the association’s borrowings.
The association operates under a general financing agreement (GFA) with the bank. The current GFA is effective through September 30, 2020. The primary source of liquidity and funding for the association is a direct loan from the bank. The outstanding balance of $888,086,846 as of June 30, 2018, is recorded as a liability on the association’s balance sheet. The note carried a weighted average interest rate of 2.60 percent at June 30, 2018. The indebtedness is collateralized by a pledge of substantially all of the association’s assets to the bank and is governed by the general financing agreement. The increase in note payable to the bank and related accrued interest payable since December 31, 2017, is due to the association’s increase in association’s loan growth. The association’s own funds, which represent the amount of the association’s loan portfolio funded by the association’s equity, were $126,206,102 at June 30, 2018. The maximum amount the association may borrow from the bank as of June 30, 2018, was $1,019,296,669 as defined by the general financing agreement. The indebtedness continues in effect until the expiration date of the general financing agreement, which is September 30, 2020, unless sooner terminated by the bank upon the occurrence of an event of default, or by the association, in the event of a breach of this agreement by the bank, upon giving the bank 30 calendar days’ prior written notice, or in all other circumstances, upon giving the bank 120 days’ prior written notice. Capital Resources: The association’s capital position increased by $10,477,564 at June 30, 2018, compared to December 31, 2017. The association’s debt as a percentage of members’ equity was 5.62:1 as of June 30, 2018, compared to 6.05:1 as of December 31, 2017. Farm Credit Administration regulations require us to maintain minimums for various regulatory capital ratios. New regulations became effective January 1, 2017, which replaced the previously required core surplus and total surplus ratios with common equity tier 1, tier 1 capital, and total capital risk-based capital ratios. The new regulations also added tier 1 leverage and unallocated retained earnings and equivalents (UREE) ratios. The permanent capital ratio continues to remain in effect, with some modifications to align with the new regulations. As of March 31, 2018, the association exceeded all regulatory capital requirements. See Note 4 to the consolidated financial statements for required disclosures regarding regulatory capital ratios.
Volume Rate TotalInterest income - loans 1,005,321$ 1,442,758$ 2,448,079$ Interest income - investments (40,485) 11,884 (28,601) Total interest income 964,836 1,454,642 2,419,478 Interest expense 338,995 1,593,165 1,932,160 Net interest income 625,841$ (138,523)$ 487,318$
June 30, 2018 vs. June 30, 2017Increase (decrease) due to
Three months ended:
June 30, December 31,2018 2017
Note payable to the bank 888,086,846$ 881,449,875$ Accrued interest on note payable 1,904,585 1,755,661
Total 889,991,431$ 883,205,536$

6
Significant Recent Accounting Pronouncements: Information regarding significant recent accounting pronouncements, required to be disclosed, is incorporated herein by reference to Note 1 to the consolidated financial statements, “Organization and Significant Accounting Policies,” included in this quarterly report. Relationship With the Farm Credit Bank of Texas: The association’s financial condition may be impacted by factors that affect the bank. The financial condition and results of operations of the bank may materially affect the stockholder’s investment in the association. The Management’s Discussion and Analysis and Notes to Financial Statements contained in the 2017 Annual Report of Association New Model more fully describe the association’s relationship with the bank. The Texas Farm Credit District’s (district) annual and quarterly stockholder reports, as well as those of the bank, are available free of charge, upon request. These reports can be obtained by writing to Farm Credit Bank of Texas, The Ag Agency, P.O. Box 202590, Austin, Texas 78720, or by calling (512) 483-9204. Copies of the district’s quarterly and annual stockholder reports also can be requested by e-mail at [email protected]. The annual and quarterly stockholder reports for the bank and the district are also available on its website at www.farmcreditbank.com. The association’s quarterly stockholder reports are also available free of charge, upon request. These reports can be obtained by writing to Southern AgCredit, ACA, 402 West Parkway Place, Ridgeland, MS 39157 or calling 601-499-2820. The annual and quarterly stockholder reports for the association are also available on its website at www.southernagcredit.com. Copies of the association’s quarterly stockholder reports can also be requested by e-mailing [email protected].
7
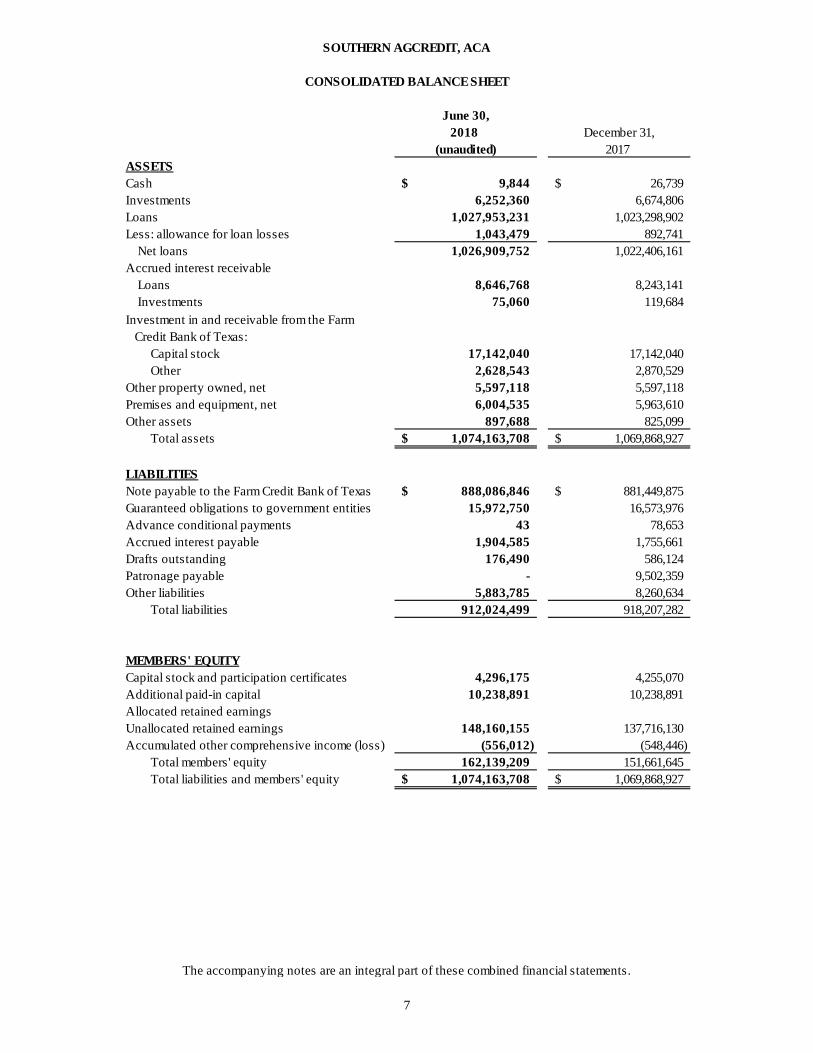
June 30,2018 December 31,
(unaudited) 2017ASSETSCash 9,844$ 26,739$ Investments 6,252,360 6,674,806 Loans 1,027,953,231 1,023,298,902 Less: allowance for loan losses 1,043,479 892,741
Net loans 1,026,909,752 1,022,406,161 Accrued interest receivable
Loans 8,646,768 8,243,141 Investments 75,060 119,684
Capital stock 17,142,040 17,142,040 Other 2,628,543 2,870,529
Other property owned, net 5,597,118 5,597,118 Premises and equipment, net 6,004,535 5,963,610 Other assets 897,688 825,099
Total assets 1,074,163,708$ 1,069,868,927$
LIABILITIESNote payable to the Farm Credit Bank of Texas 888,086,846$ 881,449,875$ Guaranteed obligations to government entities 15,972,750 16,573,976 Advance conditional payments 43 78,653 Accrued interest payable 1,904,585 1,755,661 Drafts outstanding 176,490 586,124 Patronage payable - 9,502,359 Other liabilities 5,883,785 8,260,634
Total liabilities 912,024,499 918,207,282
MEMBERS' EQUITYCapital stock and participation certificates 4,296,175 4,255,070 Additional paid-in capital 10,238,891 10,238,891 Allocated retained earningsUnallocated retained earnings 148,160,155 137,716,130 Accumulated other comprehensive income (loss) (556,012) (548,446)
Total members' equity 162,139,209 151,661,645 Total liabilities and members' equity 1,074,163,708$ 1,069,868,927$
SOUTHERN AGCREDIT, ACA
CONSOLIDATED BALANCE SHEET
The accompanying notes are an integral part of these combined financial statements.
Investment in and receivable from the Farm Credit Bank of Texas:
8
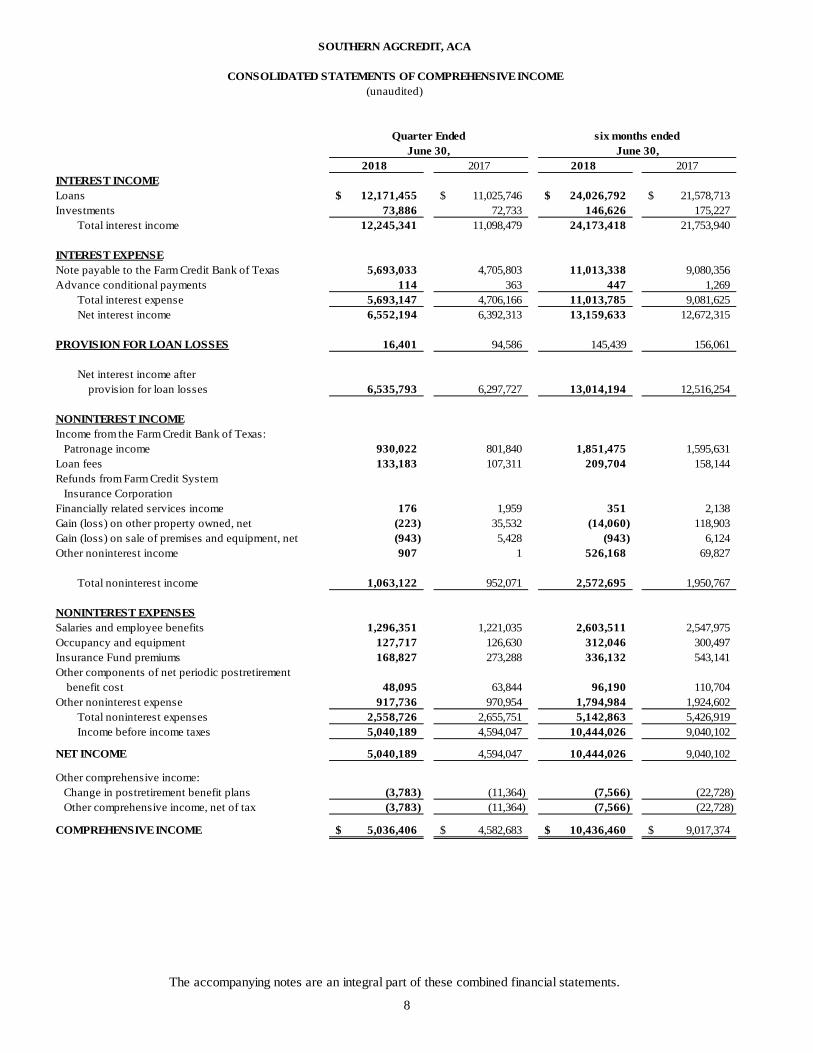
2018 2017 2018 2017INTEREST INCOMELoans 12,171,455$ 11,025,746$ 24,026,792$ 21,578,713$ Investments 73,886 72,733 146,626 175,227
Total interest income 12,245,341 11,098,479 24,173,418 21,753,940
INTEREST EXPENSENote payable to the Farm Credit Bank of Texas 5,693,033 4,705,803 11,013,338 9,080,356 Advance conditional payments 114 363 447 1,269
Total interest expense 5,693,147 4,706,166 11,013,785 9,081,625 Net interest income 6,552,194 6,392,313 13,159,633 12,672,315
PROVISION FOR LOAN LOSSES 16,401 94,586 145,439 156,061
Net interest income after provision for loan losses 6,535,793 6,297,727 13,014,194 12,516,254
NONINTEREST INCOMEIncome from the Farm Credit Bank of Texas: Patronage income 930,022 801,840 1,851,475 1,595,631 Loan fees 133,183 107,311 209,704 158,144 Refunds from Farm Credit System Insurance CorporationFinancially related services income 176 1,959 351 2,138 Gain (loss) on other property owned, net (223) 35,532 (14,060) 118,903 Gain (loss) on sale of premises and equipment, net (943) 5,428 (943) 6,124 Other noninterest income 907 1 526,168 69,827
Total noninterest income 1,063,122 952,071 2,572,695 1,950,767
NONINTEREST EXPENSESSalaries and employee benefits 1,296,351 1,221,035 2,603,511 2,547,975 Occupancy and equipment 127,717 126,630 312,046 300,497 Insurance Fund premiums 168,827 273,288 336,132 543,141 Other components of net periodic postretirement
benefit cost 48,095 63,844 96,190 110,704 Other noninterest expense 917,736 970,954 1,794,984 1,924,602
Total noninterest expenses 2,558,726 2,655,751 5,142,863 5,426,919 Income before income taxes 5,040,189 4,594,047 10,444,026 9,040,102
NET INCOME 5,040,189 4,594,047 10,444,026 9,040,102
Other comprehensive income: Change in postretirement benefit plans (3,783) (11,364) (7,566) (22,728) Other comprehensive income, net of tax (3,783) (11,364) (7,566) (22,728)
COMPREHENSIVE INCOME 5,036,406$ 4,582,683$ 10,436,460$ 9,017,374$
The accompanying notes are an integral part of these combined financial statements.
SOUTHERN AGCREDIT, ACA
CONSOLIDATED STATEMENTS OF COMPREHENSIVE INCOME
Quarter Ended six months endedJune 30, June 30,
(unaudited)

9
AccumulatedCapital Stock/ Other TotalParticipation Additional Comprehensive Members'Certificates Paid-in-Capital Unallocated Income (Loss) Equity
Balance at December 31, 2016 4,107,855$ 10,238,891$ 129,181,915$ (140,142)$ 143,388,519$ Comprehensive income - - 9,040,102 (22,728) 9,017,374
379,620 379,620
(279,005) (279,005) Balance at June 30, 2017 4,208,470$ 10,238,891$ 138,222,017$ (162,870)$ 152,506,508$
Balance at December 31, 2017 4,255,070$ 10,238,891$ 137,716,130$ (548,446)$ 151,661,645$ Comprehensive income - - 10,444,026 (7,566) 10,436,460
316,600 316,600
(275,496) (275,496) Balance at June 30, 2018 4,296,174$ 10,238,891$ 148,160,156$ (556,012)$ 162,139,209$
Retained Earnings
SOUTHERN AGCREDIT, ACA
CONSOLIDATED STATEMENT OF CHANGES IN MEMBERS' EQUITY(unaudited)
The accompanying notes are an integral part of these combined financial statements.
Capital stock/participation certificates and allocated retained earnings issuedCapital stock/participation certificates and allocated retained earnings retired
Capital stock/participation certificates and allocated retained earnings issuedCapital stock/participation certificates and allocated retained earnings retired

10
SOUTHERN AGCREDIT, ACA NOTES TO THE CONSOLIDATED FINANCIAL STATEMENTS
(UNAUDITED)
NOTE 1 — ORGANIZATION AND SIGNIFICANT ACCOUNTING POLICIES: Southern AgCredit, ACA, including its wholly-owned subsidiaries, Southern AgCredit, PCA and Southern AgCredit, FLCA (collectively called “the association”), is a member-owned cooperative which provides credit and credit-related services to, or for the benefit of, eligible borrowers/stockholders for qualified agricultural purposes in the counties of Adams, Amite, Carroll, Claiborne, Clarke, Copiah, Covington, Forrest, Franklin, George, Greene, Grenada, Hancock, Harrison, Hinds, Holmes, Humphreys, Issaquena, Jackson, Jasper, Jefferson, Jefferson Davis, Jones, Kemper, Lamar, Lauderdale, Lawrence, Leake, Leflore, Lincoln, Madison, Marion, Montgomery, Neshoba, Newton, Pearl River, Perry, Pike, Rankin, Scott, Sharkey, Simpson, Smith, Stone, Walthall, Warren, Washington, Wayne, Wilkinson and Yazoo in the state of Mississippi, as well as the parishes of Bienville, Bossier, Caddo, Claiborne, DeSoto, Jackson, Lincoln, Ouachita (west of Ouachita River), Red River, Union and Webster in the state of Louisiana. In addition, the association is the single owner of Parkway Place Investments, LLC, which was organized for the purpose of holding and managing foreclosed property for which the assets, liabilities and results of operation have been consolidated in the association’s financial statements. The association is a lending institution of the Farm Credit System (the System), which was established by Acts of Congress to meet the needs of American agriculture. The accompanying unaudited financial statements have been prepared in accordance with accounting principles generally accepted in the U.S. (GAAP) for interim financial information. Accordingly, they do not include all of the disclosures required by GAAP for annual financial statements and should be read in conjunction with the audited financial statements as of and for the year ended December 31, 2017, as contained in the 2017 Annual Report to Stockholders. In the opinion of management, the accompanying consolidated financial statements contain all adjustments necessary for a fair presentation of the interim financial condition and results of operations and conform with generally accepted accounting principles (GAAP), except for the inclusion of a statement of cash flows. GAAP require a business enterprise that provides a set of financial statements reporting both financial position and results of operations to also provide a statement of cash flows for each period for which results of operations are provided. In regulations issued by FCA, associations have the option to exclude statements of cash flows in interim financial statements. Therefore, the association has elected not to include a statement of cash flows in these consolidated financial statements. These interim financial statements should be read in conjunction with the audited financial statements as of and for the year ended December 31, 2017, as contained in the 2017 Annual Report to Stockholders. The preparation of financial statements in accordance with GAAP requires management to make estimates and assumptions that affect the amounts reported in the financial statements and accompanying notes. Actual results could differ from those estimates. The results of operations for interim periods are not necessarily indicative of the results to be expected for the full year ending December 31, 2017. Descriptions of the significant accounting policies are included in the 2017 Annual Report to Stockholders. In the opinion of management, these policies and the presentation of the interim financial condition and results of operations conform with GAAP and prevailing practices within the banking industry. In February 2018, the Financial Accounting Standards Board (FASB) issued guidance entitled “Income Statement — Reporting Comprehensive Income — Reclassification of Certain Tax Effects from Accumulated Other Comprehensive Income.” This guidance allows for the reclassification from accumulated other comprehensive income to retained earnings for stranded tax effects resulting from the recently issued tax legislation, Tax Cuts and Jobs Act (TCJA) that lowered the federal corporate tax rate from 35% to 21%. The amount of the reclassification shall include the effect of the change in the tax rate on gross deferred tax amounts and related valuation allowances at the date of enactment of the TCJA related to items remaining in accumulated other comprehensive income. The guidance becomes effective for financial statements issued for fiscal years beginning after December 15, 2018, and interim periods within those fiscal years. Early adoption is permitted. The Association is evaluating the impact of adoption on the Association’s financial condition and its results of operations. In August 2017, the Financial Accounting Standards Board (FASB) issued guidance entitled “Targeted Improvements to Accounting for Hedging Activities.” The guidance better aligns an entity’s risk management activities and financial reporting for hedging relationships through changes to both the designation and measurement guidance for qualifying hedging relationships and the presentation of hedge results. The amendments in this guidance require an entity to present the earnings effect of the hedging instrument in the same income statement line item in which the earnings effect of the hedged item is reported. This guidance also addresses the timing of effectiveness testing, qualitative and quantitative effectiveness testing and components that can be excluded from effectiveness testing. This guidance becomes effective for interim and annual periods beginning after December 15, 2018. The Association is evaluating the impact of adoption on the Association’s financial condition and its results of operations. In March 2017, the FASB issued guidance entitled “Improving the Presentation of Net Periodic Pension Cost and Net Periodic Postretirement Cost.” The guidance requires that an employer report the service cost component in the same line item or items as

11
other compensation costs arising from services rendered by the pertinent employees during the period. Other components are required to be presented in the income statement separately from the service cost component and outside a subtotal of income from operations, if one is presented. This guidance becomes effective for interim and annual periods beginning after December 15, 2017. The adoption of this guidance did not impact the Association’s financial condition but did change the classification of certain items in the results of operations. In August 2016, the FASB issued guidance entitled “Classification of Certain Cash Receipts and Cash Payments.” The guidance addresses specific cash flow issues with the objective of reducing the diversity in the classification of these cash flows. Included in the cash flow issues are debt prepayment or debt extinguishment costs and settlement of zero-coupon debt instruments or other debt instruments with coupon interest rates that are insignificant in relation to the effective interest rate of the borrowing. This guidance becomes effective for interim and annual periods beginning after December 15, 2017. The adoption of this guidance did not impact the Association’s financial condition or its results of operations but did change the classification of certain items in the statement of cash flows. In June 2016, FASB issued guidance entitled “Measurement of Credit Losses on Financial Instruments.” The guidance replaces the current incurred loss impairment methodology with a methodology that reflects expected credit losses and requires consideration of a broader range of reasonable and supportable information to inform credit loss estimates. Credit losses relating to available-for-sale securities would also be recorded through an allowance for credit losses. For public business entities that are not U.S. Securities and Exchange Commission filers this guidance becomes effective for interim and annual periods beginning after December 15, 2020, with early application permitted. The Association is evaluating the impact of adoption on its financial condition and results of operations. In February 2016, the FASB issued guidance entitled “Leases.” The guidance requires the recognition by lessees of lease assets and lease liabilities on the balance sheet for the rights and obligations created by those leases. Leases with lease terms of more than 12 months are impacted by this guidance. This guidance becomes effective for interim and annual periods beginning after December 15, 2018, with early application permitted. The Association is evaluating the impact of adoption on its financial condition and results of operations. In January 2016, the FASB issued guidance entitled “Recognition and Measurement of Financial Assets and Liabilities.” This guidance affects, among other things, the presentation and disclosure requirements for financial instruments. For public entities, the guidance eliminates the requirement to disclose the methods and significant assumptions used to estimate the fair value of financial instruments carried at amortized cost. This guidance becomes effective for interim and annual periods beginning after December 15, 2017. The adoption of this guidance did not impact the Association’s financial condition or its results of operations but did impact the Association's fair value disclosures. In May 2014, the FASB issued guidance entitled, “Revenue from Contracts with Customers.” The guidance governs revenue recognition from contracts with customers and requires an entity to recognize revenue to depict the transfer of promised goods or services to customers in an amount that reflects the consideration to which the entity expects to be entitled in exchange for those goods or services. Financial instruments and other contractual rights within the scope of other guidance issued by the FASB are excluded from the scope of this new revenue recognition guidance. The guidance sets forth the requirement for new and enhanced disclosures. The Association has determined that the effect of the adoption is not material to its financial condition or results of operations and will not change its current recognition practices. The consolidated financial statements comprise the operations of the ACA and its wholly-owned subsidiaries. The preparation of these consolidated financial statements requires the use of management’s estimates. The results for the quarter ended March 31, 2018, are not necessarily indicative of the results to be expected for the year ended December 31, 2017. Certain amounts in the prior period’s financial statements have been reclassified to conform to current financial statement presentation.
12
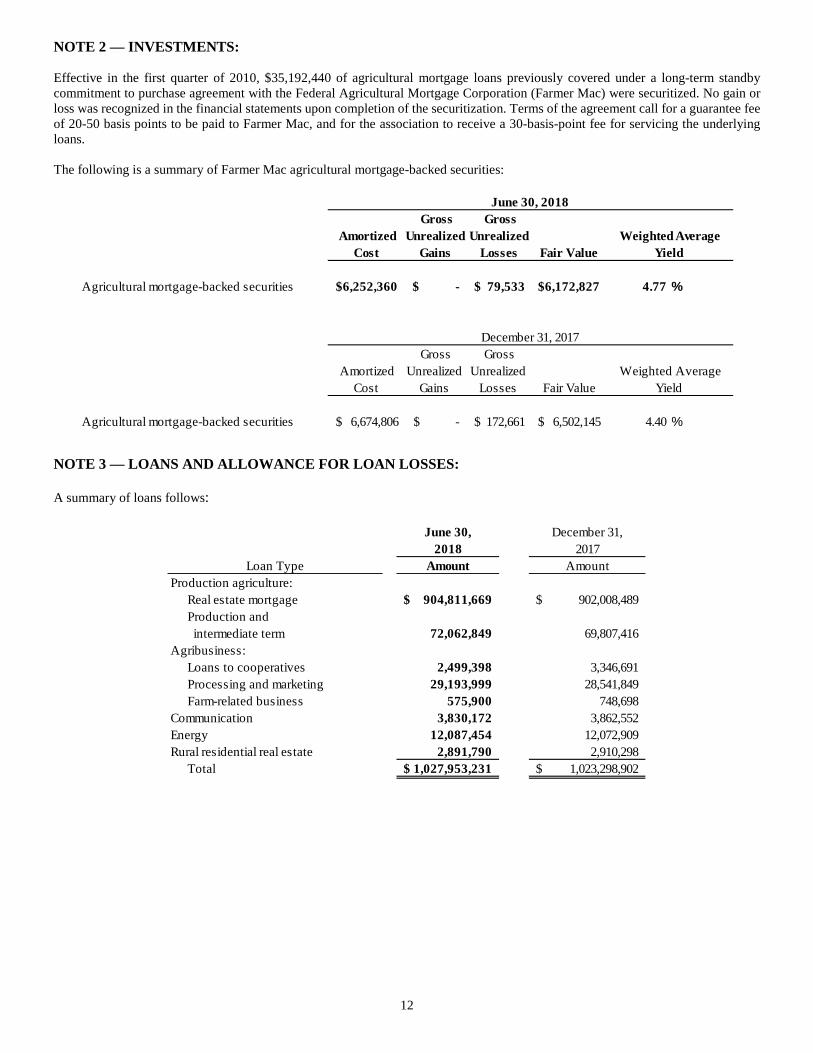
NOTE 2 — INVESTMENTS: Effective in the first quarter of 2010, $35,192,440 of agricultural mortgage loans previously covered under a long-term standby commitment to purchase agreement with the Federal Agricultural Mortgage Corporation (Farmer Mac) were securitized. No gain or loss was recognized in the financial statements upon completion of the securitization. Terms of the agreement call for a guarantee fee of 20-50 basis points to be paid to Farmer Mac, and for the association to receive a 30-basis-point fee for servicing the underlying loans. The following is a summary of Farmer Mac agricultural mortgage-backed securities:
NOTE 3 — LOANS AND ALLOWANCE FOR LOAN LOSSES: A summary of loans follows:
Amortized Cost
Gross Unrealized
Gains
Gross Unrealized
Losses Fair Value
Agricultural mortgage-backed securities $6,252,360 $ - $ 79,533 $6,172,827 4.77 %
Amortized Cost
Gross Unrealized
Gains
Gross Unrealized
Losses Fair Value
Agricultural mortgage-backed securities $ 6,674,806 $ - $ 172,661 $ 6,502,145 4.40 %
June 30, 2018
Weighted Average Yield
Weighted Average Yield
December 31, 2017
June 30, December 31,2018 2017
Amount AmountProduction agriculture:
Real estate mortgage 904,811,669$ 902,008,489$ Production and intermediate term 72,062,849 69,807,416
Agribusiness: Loans to cooperatives 2,499,398 3,346,691 Processing and marketing 29,193,999 28,541,849 Farm-related business 575,900 748,698
Communication 3,830,172 3,862,552 Energy 12,087,454 12,072,909 Rural residential real estate 2,891,790 2,910,298
Total 1,027,953,231$ 1,023,298,902$
Loan Type

13
The association purchases or sells participation interests with other parties in order to diversify risk, manage loan volume and comply with Farm Credit Administration regulations. The following table presents information regarding the balances of participations purchased and sold at June 30, 2018:
The Association also utilizes the Mississippi Development Authority’s Agribusiness Enterprise Loan Program (ABE), which is designed to provide a percentage of low-cost state financing combined with private financial lending institutions’ loan proceeds to encourage loans to the agribusiness industry in the state. ABE loans totaled $15,972,750 and $16,573,976 as of March 31, 2018 and December 31, 2017, respectively. The association is authorized under the Farm Credit Act to accept “advance conditional payments” (ACPs) from borrowers. To the extent the borrower’s access to such ACPs is restricted and the legal right of setoff exists, the ACPs are netted against the borrower’s related loan balance. Unrestricted advance conditional payments are included in other liabilities. ACPs are not insured, and interest is generally paid by the association on such balances. Balances of ACPs were $43 and $78,653 at June 30, 2018, and December 31, 2017, respectively. Nonperforming assets (including related accrued interest) and related credit quality statistics are as follows:
One credit quality indicator utilized by the association is the Farm Credit Administration Uniform Loan Classification System that categorizes loans into five categories. The categories are defined as follows:
• Acceptable – assets are expected to be fully collectible and represent the highest quality; • Other assets especially mentioned (OAEM) – assets are currently collectible but exhibit some potential weakness; • Substandard – assets exhibit some serious weakness in repayment capacity, equity and/or collateral pledged on the loan; • Doubtful – assets exhibit similar weaknesses to substandard assets; however, doubtful assets have additional weaknesses in
existing factors, conditions and values that make collection in full highly questionable; and • Loss – assets are considered uncollectible.
Participations Participations Participations Participations Participations ParticipationsPurchased Sold Purchased Sold Purchased Sold
Real estate mortgage 1,896,931$ 50,145,333$ 415,052$ -$ 2,311,983$ 50,145,333$ Production and intermediate term 3,935,126 21,060,123 67,089 - 4,002,215 21,060,123 Agribusiness 31,835,123 - - - 31,835,123 - Communication 3,830,172 - - - 3,830,172 - Energy 12,087,454 - - - 12,087,454 -
Total 53,584,806$ 71,205,456$ 482,141$ -$ 54,066,947$ 71,205,456$
Other Farm Credit Institutions Non-Farm Credit Institutions Total
June 30, December 31,2018 2017
Nonaccrual loans:Real estate mortgage 2,259,311$ 2,581,318$ Production and intermediate term 596,504 702,444 Total nonaccrual loans 2,855,815 3,283,762
Accruing restructured loans:Real estate mortgage 213,808 455,491 Production and intermediate term 80,250 80,028 Total accruing restructured loans 294,058 535,519
Total nonperforming loans 3,149,873 3,819,281 Other property owned 5,597,118 5,597,118 Total nonperforming assets 8,746,991$ 9,416,399$

14
The following table shows loans and related accrued interest as a percentage of total loans and related accrued interest receivable by loan type as of:
June 30, December 31,2018 2017
Real estate mortgageAcceptable 98.33 % 98.18 %OAEM 1.10 1.18 Substandard/doubtful 0.57 0.64
100.00 100.00 Production and intermediate term
Acceptable 98.60 98.31 OAEM 0.03 0.13 Substandard/doubtful 1.37 1.56
100.00 100.00 Loans to cooperatives
Acceptable 100.00 100.00 OAEM - - Substandard/doubtful - -
100.00 100.00 Processing and marketing
Acceptable 100.00 100.00 OAEM - - Substandard/doubtful - -
100.00 100.00 Farm-related business
Acceptable 100.00 100.00 OAEM - - Substandard/doubtful - -
100.00 100.00 Communication
Acceptable 100.00 100.00 OAEM - - Substandard/doubtful - -
100.00 100.00 Energy
Acceptable 100.00 100.00 OAEM - -Substandard/doubtful - -
100.00 100.00 Rural residential real estate
Acceptable 100.00 100.00 OAEM - -Substandard/doubtful - -
100.00 100.00 Total loans
Acceptable 98.43 98.28 OAEM 0.97 1.05 Substandard/doubtful 0.60 0.67
100.00 % 100.00 %

15
The following tables provide an age analysis of past due loans (including accrued interest) as of:
Note: The recorded investment in the receivable is the face amount increased or decreased by applicable accrued interest and unamortized premium, discount, finance charges or acquisition costs, and may also reflect a previous direct write-down of the investment. A restructuring of a debt constitutes a troubled debt restructuring if the creditor for economic or legal reasons related to the debtor’s financial difficulties grants a concession to the debtor that it would not otherwise consider. Troubled debt restructurings are undertaken in order to improve the likelihood of recovery on the loan and may include, but are not limited to, forgiveness of principal or interest, interest rate reductions that are lower than the current market rate for new debt with similar risk, or significant term or payment extensions. As of June 30, 2018, the total recorded investment of troubled debt restructured loans was $478,459, including $184,401 classified as nonaccrual and $294,058 classified as accrual, with specific allowance for loan losses of $0. There was no commitments to lend funds to borrowers whose loan terms have been modified in a troubled debt restructurings as of June 30, 2018 and December 31, 2017.
June 30, 2018 30-89 90 Days Total Not Past Due orDays or More Past Less Than 30 Total
Past Due Past Due Due Days Past Due LoansReal estate mortgage 5,976,016$ 1,107,496$ 7,083,512$ 905,196,254$ 912,279,766$ Production and intermediate term 608,853 - 608,853 72,428,295 73,037,148 Loans to cooperatives - - - 2,500,347 2,500,347 Processing and marketing - - - 29,213,795 29,213,795 Farm-related business - - - 580,345 580,345 Communication - - - 3,831,156 3,831,156 Energy - - - 12,257,856 12,257,856 Rural residential real estate - - - 2,899,586 2,899,586
Total 6,584,869$ 1,107,496$ 7,692,365$ 1,028,907,634$ 1,036,599,999$
December 31, 2017 30-89 90 Days Total Not Past Due orDays or More Past Less Than 30 Total
Past Due Past Due Due Days Past Due LoansReal estate mortgage 7,291,228$ 768,612$ 8,059,840$ 901,186,020$ 909,245,860$ Production and intermediate term 12,324 - 12,324 70,579,134 70,591,458 Loans to cooperatives - - - 3,347,965 3,347,965 Processing and marketing - - - 28,567,925 28,567,925 Farm-related business - - - 749,582 749,582 Communication - - - 3,872,601 3,872,601 Energy - - - 12,247,322 12,247,322 Rural residential real estate - - - 2,919,330 2,919,330
Total 7,303,552$ 768,612$ 8,072,164$ 1,023,469,879$ 1,031,542,043$

16
The following tables present additional information regarding troubled debt restructurings, which includes both accrual and nonaccrual loans with troubled debt restructuring designation, that occurred during the six months ended June 30, 2018. The premodification outstanding recorded investment represents the recorded investment of the loans as of the quarter end prior to the restructuring. The postmodification outstanding recorded investment represents the recorded investment of the loans as of the quarter end the restructuring occurred. Loans formally restructured prior to January 1, 2018, were $728,163.
In restructurings where principal is forgiven, the amount of the forgiveness is immediately charged off. In restructurings where accrued interest is forgiven, the interest is reversed (if current year interest) or charged off (if prior year interest). Charge-offs recorded at the modification date were $0 for the quarter ending June 30, 2018. The predominant form of concession granted for troubled debt restructuring includes extension of terms and interest rate decreases. Other types of modifications include extension of the term, principal or accrued interest reductions, interest rate decreases and delayed payments, among others. At times, these terms might be offset with incremental payments, additional collateral or new borrower guarantees, in which case we assess all of the modified terms to determine if the overall modification qualifies as a troubled debt restructuring. The following table provides information on outstanding loans restructured in troubled debt restructurings at period end. These loans are included as impaired loans in the impaired loan table at:
Premodification Outstanding Postmodification OutstandingRecorded Investment Recorded Investment
Troubled debt restructurings:Real estate mortgage -$ -$
Total -$ -$
Premodification Outstanding Postmodification OutstandingRecorded Investment Recorded Investment
Troubled debt restructurings:Real estate mortgage 1,320,180$ 1,378,471$
Total 1,320,180$ 1,378,471$
For the Six Months EndedJune 30, 2018
For the Six Months EndedJune 30, 2017
June 30, 2018December 31,
2017 June 30, 2018December 31,
2017Real estate mortgage 398,209$ 648,135$ 184,401$ 192,643$ Production and intermediate term 80,250 80,028 - - Total 478,459$ 728,163$ 184,401$ 192,643$
*represents the portion of loans modified as TDRs that are in nonaccrual status
TDRs in Nonaccrual Status* Loans Modified as TDRs
17
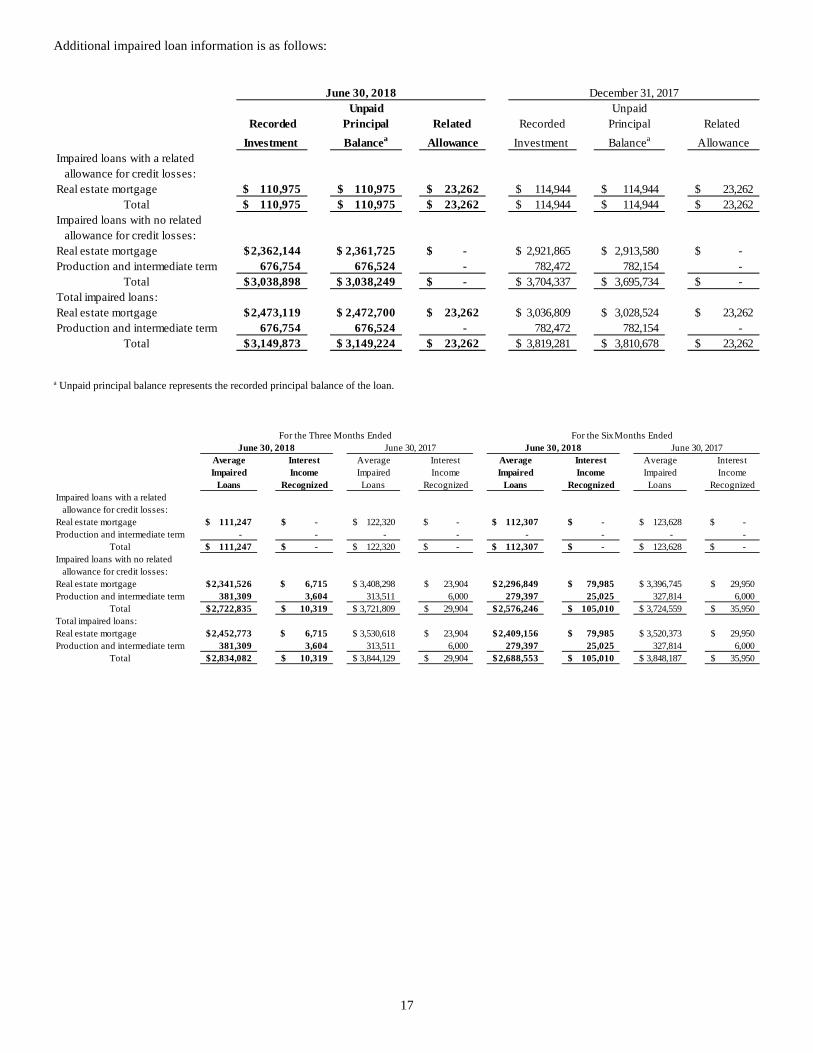
Additional impaired loan information is as follows:
a Unpaid principal balance represents the recorded principal balance of the loan.
Unpaid UnpaidRecorded Principal Related Recorded Principal Related
Investment Balancea Allowance Investment Balancea AllowanceImpaired loans with a related allowance for credit losses:Real estate mortgage 110,975$ 110,975$ 23,262$ 114,944$ 114,944$ 23,262$
Total 110,975$ 110,975$ 23,262$ 114,944$ 114,944$ 23,262$ Impaired loans with no related allowance for credit losses:Real estate mortgage 2,362,144$ 2,361,725$ -$ 2,921,865$ 2,913,580$ -$ Production and intermediate term 676,754 676,524 - 782,472 782,154 -
Total 3,038,898$ 3,038,249$ -$ 3,704,337$ 3,695,734$ -$ Total impaired loans:Real estate mortgage 2,473,119$ 2,472,700$ 23,262$ 3,036,809$ 3,028,524$ 23,262$ Production and intermediate term 676,754 676,524 - 782,472 782,154 -
Total 3,149,873$ 3,149,224$ 23,262$ 3,819,281$ 3,810,678$ 23,262$
December 31, 2017June 30, 2018
Average Interest Average Interest Average Interest Average InterestImpaired Income Impaired Income Impaired Income Impaired Income
Loans Recognized Loans Recognized Loans Recognized Loans RecognizedImpaired loans with a related allowance for credit losses:Real estate mortgage 111,247$ -$ 122,320$ -$ 112,307$ -$ 123,628$ -$ Production and intermediate term - - - - - - - -
Total 111,247$ -$ 122,320$ -$ 112,307$ -$ 123,628$ -$ Impaired loans with no related allowance for credit losses:Real estate mortgage 2,341,526$ 6,715$ 3,408,298$ 23,904$ 2,296,849$ 79,985$ 3,396,745$ 29,950$ Production and intermediate term 381,309 3,604 313,511 6,000 279,397 25,025 327,814 6,000
Total 2,722,835$ 10,319$ 3,721,809$ 29,904$ 2,576,246$ 105,010$ 3,724,559$ 35,950$ Total impaired loans:Real estate mortgage 2,452,773$ 6,715$ 3,530,618$ 23,904$ 2,409,156$ 79,985$ 3,520,373$ 29,950$ Production and intermediate term 381,309 3,604 313,511 6,000 279,397 25,025 327,814 6,000
Total 2,834,082$ 10,319$ 3,844,129$ 29,904$ 2,688,553$ 105,010$ 3,848,187$ 35,950$
June 30, 2018For the Three Months Ended For the Six Months Ended
June 30, 2018June 30, 2017 June 30, 2017

18
A summary of changes in the allowance for loan losses and period end recorded investment in loans is as follows:
Production and Energy and RuralReal Estate Intermediate Water/Waste ResidentialMortgage Term Agribusiness Communications Water Real Estate Total
Allowance for Credit Losses:
Balance at March 31, 2018 828,430$ 145,773$ 35,364$ 8,229$ 7,668$ 3,030$ 1,028,494$ Charge-offs - - - - - - - Recoveries - - - - - - - Provision for loan losses 52,595 (42,658) 858 1 4,938 667 16,401 Other 1 3,592 (769) - (4,240) - (1,416) Balance at June 30, 2018 881,026$ 106,707$ 35,453$ 8,230$ 8,366$ 3,697$ 1,043,479$
Balance at December 31, 2017 759,757$ 76,000$ 36,074$ 8,969$ 9,334$ 2,607$ 892,741$ Charge-offs - - - - - - - Recoveries - - - - - - - Provision for loan losses 121,247 27,003 (2,723) (690) (488) 1,090 145,439 Other 22 3,704 2,102 (49) (480) - 5,299 Balance at June 30, 2018 881,026$ 106,707$ 35,453$ 8,230$ 8,366$ 3,697$ 1,043,479$
Ending Balance: Individually evaluated for impairment 23,262$ -$ -$ -$ -$ -$ 23,262$ Collectively evaluated for impairment 857,764 106,707 35,453 8,230 8,366 3,697 1,020,217 Balance at June 30, 2018 881,026$ 106,707$ 35,453$ 8,230$ 8,366$ 3,697$ 1,043,479$
Balance at March 31, 2017 661,877$ 68,619$ 24,347$ 13,363$ 15,547$ 2,155$ 785,908$ Charge-offs - - - - - - - Recoveries - - - - - - - Provision for loan losses 68,587 32,147 1,269 (3,373) (4,066) 22 94,586 Other (11) 310 (4,245) 776 3,906 - 736 Balance at June 30, 2017 730,453$ 101,076$ 21,371$ 10,766$ 15,387$ 2,177$ 881,230$
Balance at December 31, 2016 621,167$ 69,216$ 24,537$ 21,864$ 12,278$ 3,895$ 752,957$ Charge-offs - - - - - - - Recoveries - - - - - - - Provision for loan losses 109,347 50,261 5,937 (12,315) 4,589 (1,758) 156,061 Other (61) (18,401) (9,103) 1,217 (1,480) 40 (27,788) Balance at June 30, 2017 730,453$ 101,076$ 21,371$ 10,766$ 15,387$ 2,177$ 881,230$
Ending Balance: Individually evaluated for impairment 31,005$ -$ -$ -$ -$ -$ 31,005$ Collectively evaluated for impairment 699,448 101,076 21,371 10,766 15,387 2,177 850,225 Balance at June 30, 2017 730,453$ 101,076$ 21,371$ 10,766$ 15,387$ 2,177$ 881,230$

19
NOTE 4 –– CAPITAL: The association’s board of directors has established a Capital Adequacy Plan (Plan) that includes the capital targets that are necessary to achieve the institution's capital adequacy goals as well as the minimum permanent capital standards. The Plan monitors projected dividends, equity retirements and other actions that may decrease the association’s permanent capital. In addition to factors that must be considered in meeting the minimum standards, the board of directors also monitors the following factors: capability of management; quality of operating policies, procedures and internal controls; quality and quantity of earnings; asset quality and the adequacy of the allowance for losses to absorb potential loss within the loan and lease portfolios; sufficiency of liquid funds; needs of an institution's customer base; and any other risk-oriented activities, such as funding and interest rate risk, potential obligations under joint and several liability, contingent and off-balance-sheet liabilities or other conditions warranting additional capital. At least quarterly, management reviews the association's goals and objectives with the board. Regulatory Capitalization Requirements
RegulatoryConservation As ofRisk-adjusted: Minimums Buffer Total June 30, 2018
Common equity tier 1 ratio 4.50% 2.50% 7.00% 14.31%Tier 1 capital ratio 6.00% 2.50% 8.50% 14.31%Total capital ratio 8.00% 2.50% 10.50% 14.41%Permanent capital ratio 7.00% 0.00% 7.00% 14.32%
Non-risk-adjusted:Tier 1 leverage ratio 4.00% 1.00% 5.00% 13.51%UREE leverage ratio 1.50% 0.00% 1.50% 10.26%
Risk-adjusted assets have been defined by FCA Regulations as the Statement of Condition assets and off-balance-sheet commitments adjusted by various percentages, depending on the level of risk inherent in the various types of assets. The primary changes which generally have the impact of increasing risk-adjusted assets (decreasing risk-based regulatory capital ratios) were as follows:
• Inclusion of off-balance-sheet commitments less than 14 months • Increased risk-weighting of most loans 90 days past due or in nonaccrual status
Risk-adjusted assets is calculated differently for the permanent capital ratio (referred herein as PCR risk-adjusted assets) compared to the other risk-based capital ratios. The primary difference is the deduction of the allowance for loan losses from risk-adjusted assets for the permanent capital ratio. The ratios are based on a three-month average daily balance in accordance with FCA regulations and are calculated as follows:
Production and Energy and RuralReal Estate Intermediate Water/Waste ResidentialMortgage Term Agribusiness Communications Water Real Estate Total
Recorded Investmentsin Loans Outstanding:Ending Balance at
June 30, 2018 912,279,766$ 73,037,148$ 32,294,487$ 3,831,156$ 12,257,856$ 2,899,586$ 1,036,599,999$ Individually evaluated for impairment 2,472,067$ 676,414$ -$ -$ -$ -$ 3,148,481$ Collectively evaluated for impairment 909,807,699$ 72,360,734$ 32,294,487$ 3,831,156$ 12,257,856$ 2,899,586$ 1,033,451,518$
Ending Balance at June 30, 2017 885,353,216$ 68,831,003$ 27,802,323$ 4,421,611$ 12,329,907$ 2,735,956$ 1,001,474,016$
Individually evaluated for impairment 3,425,706$ 311,779$ -$ -$ -$ -$ 3,737,485$ Collectively evaluated for impairment 881,927,510$ 68,519,224$ 27,802,323$ 4,421,611$ 12,329,907$ 2,735,956$ 997,736,531$

20
• Common equity tier 1 ratio is statutory minimum purchased borrower stock, other required borrower stock held for a
minimum of 7 years, allocated equities held for a minimum of 7 years or not subject to revolvement, unallocated retained earnings, paid-in capital, less certain regulatory required deductions including the amount of allocated investments in other System institutions, and the amount of purchased investments in other System institutions under the corresponding deduction approach, divided by average risk-adjusted assets.
• Tier 1 capital ratio is common equity tier 1 plus non-cumulative perpetual preferred stock, divided by average risk-adjusted assets.
• Total capital is tier 1 capital plus other required borrower stock held for a minimum of 5 years, allocated equities held for a minimum of 5 years, subordinated debt and limited-life preferred stock greater than 5 years to maturity at issuance subject to certain limitations, allowance and reserve for credit losses under certain limitations less certain investments in other System institutions under the corresponding deduction approach, divided by average risk-adjusted assets.
• Permanent capital ratio (PCR) is all at-risk borrower stock, any allocated excess stock, unallocated retained earnings, paid-in capital, subordinated debt and preferred subject to certain limitations, less certain allocated and purchased investments in other System institutions, divided by PCR risk-adjusted assets.
• Tier 1 leverage ratio is tier 1 capital, including regulatory deductions, divided by average assets less regulatory deductions
subject to tier 1 capital.
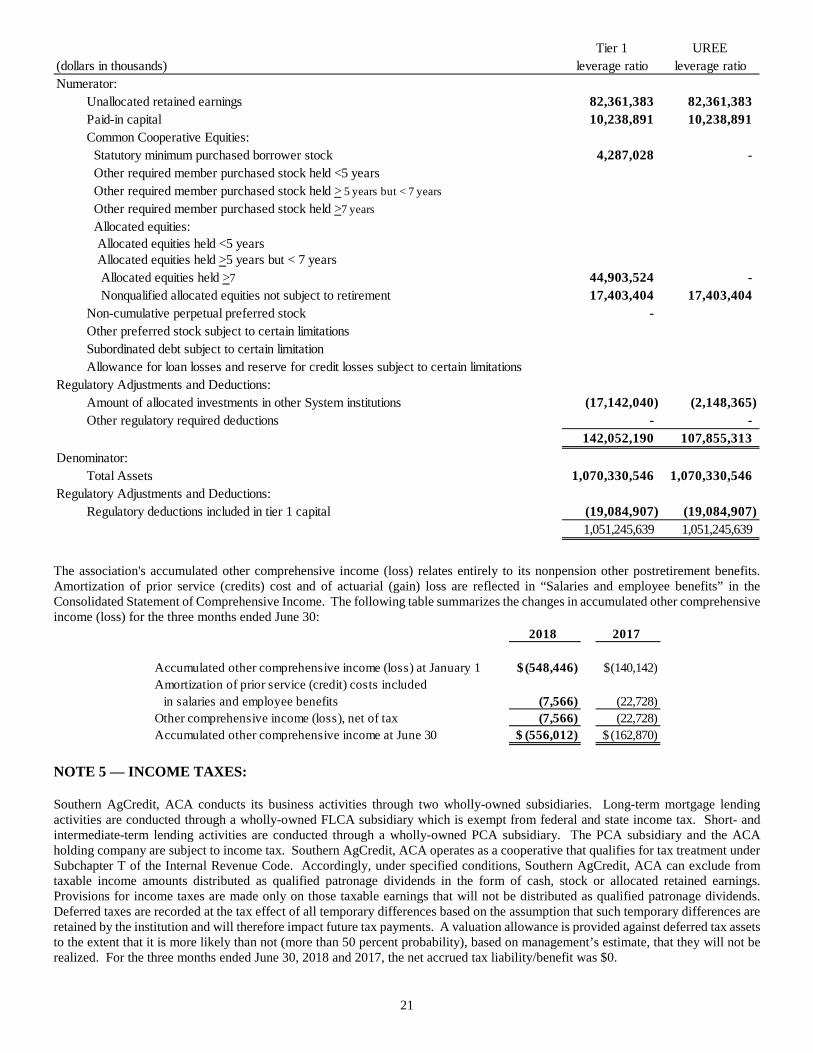
• UREE leverage ratio is unallocated retained earnings, paid-in capital, allocated surplus not subject to revolvement less certain regulatory required deductions including the amount of allocated investments in other System institutions divided by average assets less regulatory deductions subject to tier 1 capital.
If the capital ratios fall below the minimum regulatory requirements, including the capital conservation and leverage buffer amounts, capital distributions (equity redemptions, dividends, and patronage) and discretionary bonus payments to senior offices are restricted or prohibited without prior FCA approval.
Commonequity Tier 1 Total capital Permanent
(dollars in thousands) tier 1 ratio capital ratio ratio capital ratioNumerator:
Unallocated retained earnings 82,361,383 82,361,383 82,361,383 82,361,383 Paid-in capital 10,238,891 10,238,891 10,238,891 10,238,891 Common Cooperative Equities: Statutory minimum purchased borrower stock 4,287,028 4,287,028 4,287,028 4,287,028 Other required member purchased stock held <5 years Other required member purchased stock held > 5 years but < 7 years Other required member purchased stock held >7 years Allocated equities: Allocated equities held <5 years Allocated equities held >5 years but < 7 years Allocated equities held >7 44,903,524 44,903,524 44,903,524 44,903,524 Nonqualified allocated equities not subject to retirement 17,403,404 17,403,404 17,403,404 17,403,404 Non-cumulative perpetual preferred stock - - - Other preferred stock subject to certain limitations - - Subordinated debt subject to certain limitationAllowance for loan losses and reserve for credit losses subject to certain limitations 1,070,799
Regulatory Adjustments and Deductions:Amount of allocated investments in other System institutions (17,142,040) (17,142,040) (17,142,040) (17,142,040) Other regulatory required deductions - - - -
142,052,190 142,052,190 143,122,989 142,052,190 Denominator:
Risk-adjusted assets excluding allowance 1,010,037,061 1,010,037,061 1,010,037,061 1,010,037,061 Regulatory Adjustments and Deductions:
Regulatory deductions included in total capital (17,142,040) (17,142,040) (17,142,040) (17,142,040) Allowance for loan losses (1,027,319)
992,895,021 992,895,021 992,895,021 991,867,702
21
The association's accumulated other comprehensive income (loss) relates entirely to its nonpension other postretirement benefits. Amortization of prior service (credits) cost and of actuarial (gain) loss are reflected in “Salaries and employee benefits” in the Consolidated Statement of Comprehensive Income. The following table summarizes the changes in accumulated other comprehensive income (loss) for the three months ended June 30:
NOTE 5 — INCOME TAXES: Southern AgCredit, ACA conducts its business activities through two wholly-owned subsidiaries. Long-term mortgage lending activities are conducted through a wholly-owned FLCA subsidiary which is exempt from federal and state income tax. Short- and intermediate-term lending activities are conducted through a wholly-owned PCA subsidiary. The PCA subsidiary and the ACA holding company are subject to income tax. Southern AgCredit, ACA operates as a cooperative that qualifies for tax treatment under Subchapter T of the Internal Revenue Code. Accordingly, under specified conditions, Southern AgCredit, ACA can exclude from taxable income amounts distributed as qualified patronage dividends in the form of cash, stock or allocated retained earnings. Provisions for income taxes are made only on those taxable earnings that will not be distributed as qualified patronage dividends. Deferred taxes are recorded at the tax effect of all temporary differences based on the assumption that such temporary differences are retained by the institution and will therefore impact future tax payments. A valuation allowance is provided against deferred tax assets to the extent that it is more likely than not (more than 50 percent probability), based on management’s estimate, that they will not be realized. For the three months ended June 30, 2018 and 2017, the net accrued tax liability/benefit was $0.
Tier 1 UREE(dollars in thousands) leverage ratio leverage ratioNumerator:
Unallocated retained earnings 82,361,383 82,361,383 Paid-in capital 10,238,891 10,238,891 Common Cooperative Equities: Statutory minimum purchased borrower stock 4,287,028 - Other required member purchased stock held <5 years Other required member purchased stock held > 5 years but < 7 years Other required member purchased stock held >7 years Allocated equities:
Allocated equities held <5 yearsAllocated equities held >5 years but < 7 years
Allocated equities held >7 44,903,524 - Nonqualified allocated equities not subject to retirement 17,403,404 17,403,404 Non-cumulative perpetual preferred stock - Other preferred stock subject to certain limitationsSubordinated debt subject to certain limitationAllowance for loan losses and reserve for credit losses subject to certain limitations
Regulatory Adjustments and Deductions:Amount of allocated investments in other System institutions (17,142,040) (2,148,365) Other regulatory required deductions - -
142,052,190 107,855,313 Denominator:
Total Assets 1,070,330,546 1,070,330,546 Regulatory Adjustments and Deductions:
Regulatory deductions included in tier 1 capital (19,084,907) (19,084,907) 1,051,245,639 1,051,245,639
2018 2017
Accumulated other comprehensive income (loss) at January 1 (548,446)$ (140,142)$ Amortization of prior service (credit) costs included in salaries and employee benefits (7,566) (22,728) Other comprehensive income (loss), net of tax (7,566) (22,728) Accumulated other comprehensive income at June 30 (556,012)$ (162,870)$

22
NOTE 6 — FAIR VALUE MEASUREMENTS: FASB guidance defines fair value as the exchange price that would be received for an asset or paid to transfer a liability in the principal or most advantageous market for the asset or liability. See Note 14 to the 2017 Annual Report to Stockholders for a more complete description. Assets and liabilities measured at fair value on a recurring basis are summarized below:
*Accounting guidance requires that the fair value measurement for investments be broken out by the different types of investments held. Assets and liabilities measured at fair value on a nonrecurring basis for each of the fair value hierarchy values are summarized below:
*Represents the fair value of certain loans that were evaluated for impairment under authoritative guidance “Accounting by Creditors for Impairment of a Loan.” The fair value was based upon the underlying collateral since these were collateral-dependent loans for which real estate is the collateral. Sensitivity to Changes in Significant Unobservable Inputs For recurring fair value measurements categorized within Level 3 of the fair value hierarchy, the significant unobservable inputs used in the fair value measurement of the mortgage-backed securities are prepayment rates, probability of default and loss severity in the event of default. Significant increases (decreases) in any of those inputs in isolation would result in a significantly lower (higher) fair value measurement. Generally, a change in the assumption used for the probability of default is accompanied by a directionally similar change in the assumption used for the loss severity and a directionally opposite change in the assumption used for prepayment rates. Quoted market prices are generally not available for the instruments presented below. Accordingly, fair values are based on internal models that consider judgments regarding anticipated cash flows, future expected loss experience, current economic conditions, risk characteristics of various financial instruments and other factors. These estimates involve uncertainties and matters of judgment, and therefore cannot be determined with precision. Changes in assumptions could significantly affect the estimates. With regard to nonrecurring measurements for impaired loans and other property owned, it is not practicable to provide specific information on inputs, as each collateral property is unique. System institutions utilize appraisals to value these loans and other property owned and take into account unobservable inputs, such as income and expense, comparable sales, replacement cost and comparability adjustments.
June 30, 2018 Total Fair Level 1 Level 2 Level 3 Value
Assets held in nonqualified benefit trusts $ 238,926 $ - $ - $ 238,926
December 31, 2017 Total Fair Level 1 Level 2 Level 3 Value
Assets held in nonqualified benefit trusts $ 239,159 $ - $ - $ 239,159
Fair Value Measurement Using
Fair Value Measurement Using
June 30, 2018 Total Fair Total Gains Level 1 Level 2 Level 3 Value (Losses)
Assets:Loans* $ - $ - $ 87,713 $ 87,713 $ - Other property owned - - 5,597,118 5,597,118 -
December 31, 2017 Total Fair Total Gains Level 1 Level 2 Level 3 Value (Losses)
Assets:Loans* $ - $ - $ 91,682 $ 91,682 $ - Other property owned - - 5,597,118 5,597,118 -
Fair Value Measurement Using
Fair Value Measurement Using

23
Information About Other Financial Instrument Fair Value Measurements
Valuation Techniques Valuation Techniques As more fully discussed in Note 2 to the 2017 Annual Report to Stockholders, authoritative guidance establishes a fair value hierarchy, which requires an entity to maximize the use of observable inputs and minimize the use of unobservable inputs when measuring fair value. The following represent a brief summary of the valuation techniques used for the association’s assets and liabilities. For a more complete description, see Notes to the 2017 Annual Report to Stockholders. Investment Securities Where quoted prices are available in an active market, available-for-sale securities are classified as Level 1. If quoted prices are not available in an active market, the fair value of securities is estimated using quoted prices for similar securities received from pricing services, pricing models that utilize observable inputs or discounted cash flows. Generally, these securities are classified as Level 2. This would include U.S. Treasury, U.S. agency and certain mortgage-backed securities. Where there is limited activity or less transparency around inputs to the valuation, the securities are classified as Level 3. Securities classified within Level 3 include asset-backed securities and certain mortgage-backed securities, including private label-FHA/VA securities and those issued by Farmer Mac. Assets Held in Nonqualified Benefits Trusts Assets held in trust funds related to deferred compensation and supplemental retirement plans are classified within Level 1. The trust funds include investments that are actively traded and have quoted net asset values that are observable in the marketplace. Standby Letters of Credit The fair value of letters of credit approximate the fees currently charged for similar agreements or the estimated cost to terminate or otherwise settle similar obligations. Loans Evaluated for Impairment For certain loans evaluated for impairment under FASB impairment guidance, the fair value is based upon the underlying real estate collateral since the loans were collateral-dependent. The fair value measurement process uses independent appraisals and other market-based information, but in many cases it also requires significant input based on management’s knowledge of and judgment about current market conditions, specific issues relating to the collateral and other matters. As a result, a majority of these loans have fair value measurements that fall within Level 3 of the fair value hierarchy. When the value of the real estate, less estimated costs to sell, is less than the principal balance of the loan, a specific reserve is established. The fair value of these loans would fall under Level 2 of the hierarchy if the process uses independent appraisals and other market-based information.

24
Other Property Owned Other property owned is generally classified as Level 3 of the fair value hierarchy. The process for measuring the fair value of the other property owned involves the use of independent appraisals and other market-based information. Costs to sell represent transaction costs and are not included as a component of the asset’s fair value. As a result, these fair value measurements fall within Level 3 of the hierarchy. Cash For cash, the carrying amount is a reasonable estimate of fair value. Loans Fair value is estimated by discounting the expected future cash flows using the associations’ current interest rates at which similar loans would be made to borrowers with similar credit risk. The discount rates are based on the associations’ current loan origination rates as well as management’s estimates of credit risk. Management has no basis to determine whether the fair values presented would be indicative of the value negotiated in an actual sale and could be less. For purposes of estimating fair value of accruing loans, the loan portfolio is segregated into pools of loans with homogeneous characteristics. Expected future cash flows, primarily based on contractual terms, and interest rates reflecting appropriate credit risk are separately determined for each individual pool. The fair value of loans in nonaccrual status that are current as to principal and interest is estimated as described above, with appropriately higher interest rates which reflect the uncertainty of continued cash flows. For collateral-dependent impaired loans, it is assumed that collection will result only from the disposition of the underlying collateral. Commitments to Extend Credit The fair value of commitments is estimated using the fees currently charged for similar agreements, taking into account the remaining terms of the agreements and the creditworthiness of the counterparties. For fixed-rate loan commitments, estimated fair value also considers the difference between current levels of interest rates and the committed rates. NOTE 7 — EMPLOYEE BENEFIT PLANS: The following table summarizes the components of net periodic benefit costs of nonpension other postretirement employee benefits for the three months ended June 30:
The association’s liability for the unfunded accumulated obligation for these benefits at June 30, 2018, was $3,833,512 and is included in “Other Liabilities” in the balance sheet. The components of net periodic benefit cost other than the service cost component are included in the line item "other components of net periodic postretirement benefit cost" in the income statement. The structure of the district’s defined benefit pension plan is characterized as multiemployer since the assets, liabilities and cost of the plan are not segregated or separately accounted for by participating employers (bank and associations). The association recognizes its amortized annual contributions to the plan as an expense. The association previously disclosed in its financial statements for the year ended December 31, 2017, that it expected to contribute $59,060 to the district’s defined benefit pension plan in 2017. As of June 30, 2018, $29,530 of contributions have been made. The association presently anticipates contributing an additional $29,530 to fund the defined benefit pension plan in 2017 for a total of $59,060.
2018 2017Service cost 21,340$ 16,984$ Interest cost 74,850 93,720 Amortization of prior service (credits) costs (7,566) (22,730) Net periodic benefit cost 88,624$ 87,974$
Other Benefits

25
NOTE 8 — COMMITMENTS AND CONTINGENT LIABILITIES: The association is involved in various legal proceedings in the normal course of business. In the opinion of legal counsel and management, there are no legal proceedings at this time that are likely to materially affect the association. The association may participate in financial instruments with off-balance-sheet risk to satisfy the financing needs of its borrowers in the form of commitments to extend credit and commercial letters of credit. These financial instruments involve, to varying degrees, elements of credit risk in excess of the amount recognized in the financial statements. Commitments to extend credit are agreements to lend to a borrower as long as there is not a violation of any condition established in the contract. Commercial letters of credit are agreements to pay a beneficiary under conditions specified in the letter of credit. Commitments and letters of credit generally have fixed expiration dates or other termination clauses and may require payment of a fee. At June 30, 2018, $59,603,514 of commitments and $344,750 of commercial letters of credit were outstanding. Since many of these commitments are expected to expire without being drawn upon, the total commitments do not necessarily represent future cash requirements. However, these credit-related financial instruments have off-balance-sheet credit risk because their amounts are not reflected on the balance sheet until funded or drawn upon. The credit risk associated with issuing commitments and letters of credit is substantially the same as that involved in extending loans to borrowers, and management applies the same credit policies to these commitments. Upon fully funding a commitment, the credit risk amounts are equal to the contract amounts, assuming that borrowers fail completely to meet their obligations and the collateral or other security is of no value. The amount of collateral obtained, if deemed necessary upon extension of credit, is based on management’s credit evaluation of the borrower. NOTE 9 — SUBSEQUENT EVENTS: The association has evaluated subsequent events through August 9, 2018, which is the date the financial statements were issued. There are no other significant events requiring disclosure as of August 9, 2018.