stoichiometric modeling ofcarbon diagenesis within a coral
TRANSCRIPT

Geochimica et Cosmochimica Acta Vol. 54. pp. 2439-2449Copyright © 1990 Pergamon Press pic. Printed in U.S.A.
0016-7037/90/$3.00 + .00
Stoichiometric modeling of carbon diagenesis within a coral reef framework
GORDON W. TRIBBLE,I.2·· FRANCIS J. SANSONE, 1.3 and STEPHEN V. SMITH 1.2
I Department of Oceanography, University of Hawaii at Manoa, Honolulu, HI 96822, USA2Hawaii Institute of Marine Biology, University of Hawaii at Manoa, Honolulu, HI 96822, USA3Hawaii Institute of Geophysics, University of Hawaii at Manoa, Honolulu, Hawaii 96822, USA
(Received !!"ebruary 13, 1990; accepted in revised/arm June 22, 1990)
Abstract-Water sampled from the interior framework of Checker Reef, Oahu, Hawaii, indicates thatthe aerobic and anaerobic oxidation of organic matter dominates diagenesis within the reef framework.Reef interstitial water chemistry shows clear deviations from surface seawater: oxygen is depleted whiledissolved inorganic carbon, H +, inorganic nutrients, sulfide, and methane concentrations are elevated.Dissolved calcium is also elevated in most interstitial waters, indicating net dissolution of calcium carbonates. A mass-balance model used to determine the extent to which major biogeochemical reactionsoccur reveals that sulfate reduction is the predominant anaerobic process.
2HCOJ' + HS- + H+ (3)
methanogenesis: 2CHzO -+ COz + CH4 (4)
sulfate reduction: 2CHzO + S04'z -+
carbonate precipitation / dissolution:
CaC03 + COz + HzO ...... 2HCOJ' + Ca+z (5)
( I )
where CHzO represents organic material. These equationsand their thermodynamic significance have been discussedin detail by many workers (e.g., BERNER et aI., 1970; THORSTENSON and MACKENZIE, 1974; FROELICH et aI., 1979;MACKENZIE et aI., 1981; J0RGENSEN, 1983; REEBURGH,1983 ).
Coral reefs are distinct from more commonly studied marine sedimentary environments because the permeable natureof the framework results in a hydrologically conductive environment. Previous hydrological investigations of DaviesReef (Australia, Great Barrier Reef) have suggested that advective flow of water vertically through the reef frameworkdominates exchange processes between interstitial and overlying water, and that diffusive exchange is relatively minor(BUDDEMEIER and OBERDORFER, 1983, 1986; OBERDORFERand BUDDEMEIER, 1985, 1986). Advective flow and verticalmixing were also thought to be responsible for exchange atthe Orpheus Island reef flat (Australia, Great Barrier Reef;PARNELL, 1986). Similarly, vertical mixing driven by highfrequency gravity waves was found to dominate hydrologicexchange between the upper framework of a St. Croix reef(Tague Bay, US Virgin Islands) and surface seawater (ROBERTS et aI., 1988). Preliminary and ongoing hydrological in-
denitrification: 5CH20 + 4NOJ'
+ 4H+ -+ 5C02 + 2Nz + 7HzO (2)
oxic respiration: CH20 + O2 -+ CO2 + HzO
1981; LORD and CHURCH, 1983; MARTENS and KLUMP,1984 ).
The reactions we consider to be of potential significancewithin the carbonate framework of the reef are
* Present address: US Geological Survey, Water Resources Division, 677 Ala Moana Boulevard, Suite 415, Honolulu, HI 96813,USA. .
INTRODUCfION
ALTHOUGH CONSIDERABLE attention has been given to diagenesis in ancient reefs, little work has been done on diage-
. netic reactions within modern coral reef frameworks. Microbial activity within coral reef carbonate surface and internalsediments has been recognized as the cause of low interstitialwater O2 levels (DISALVO, 1971; SOROKIN, 1973; ZANKL andMULTER, 1977), high nutrient concentrations (ANDREWSand MOLLER, 1983; RISK and MOLLER, 1983; ENTCH et aI.,1983; PIGOTT and LAND, 1986; SARAZIN et aI., 1988), andanaerobic metabolism end products (SKYRING, 1985; SARAZIN et aI., 1988). Both aerobic and anaerobic metabolismwere responsible for chemical deviations of Davies Reef interstitial framework waters from overlying seawater (BUDDEMEIER and OBERDORFER, 1983, 1986; OBERDORFER andBUDDEMEIER, 1986; SANSONE, 1985). Chemical changes inthe reef interstitial water (RIW) of Checker Reef, a moderncarbonate patch reef in Kaneohe Bay, Hawaii, appear to bedominated by aerobic and anaerobic metabolic processes(SANSONE et aI., 1988a,b; TRIBBLE et aI., 1988; TRIBBLE,1990). The purpose of this paper is to present a stoichiometricanalysis of water from within the framework of Checker Reef.
Mass balance calculations and stoichiometric considerations have been profitably used in the study of marine sedimentary systems to determine and constrain reaction pathways (see reviews by J0RGENSEN, 1983 and REEBURGH,1983). Resolution of the predominant diagenetic reactionshas been complicated by several factors: obtaining a sufficientvolume of uncontaminated interstitial water for analysis, theneed to consider diffusive fluxes between the sediment andoverlying water, seasonal variations, and the complicatingroles of bioturbation and burrow irrigation. These obstaclesand problems have generally been dealt with through the useof sophisticated analytical techniques and the developmentof models which consider diffusional exchange, biological activity, and sedimentation rates (e.g., BERNER et aI., 1970;BERNER, 1977, 1980; ALLER, 1980; SANSONE and MARTENS,
2439

2440 G. W. Tribble, F. J. Sansone, and S. V. Smith
METHODS
vestigations indicate that Checker Reef is also hydrologicallydominated by advective flow, and mixing between surfacewater and the upper meter of the framework occurs over afew days (TRIBBLE et aI., 1988). We consider the advectivenature of water movement through the reef framework to bea major simplifying factor in the understanding of internalreef diagenesis because the dominance of advective flow reduces diffusive exchange between surface and interstitial waterto a much slower process of secondary importance (BuDDEMEIER and OBERDORFER, 1988). We recognize that whilediffusion may play an important role in controlling microzonation within the intersticies of the reef framework andmay potentially affect the chemistry of framework waters,diffusion appears to playa minor role in driving exchangebetween the framework and surface water (BUDDEMEIER andOBERDORFER, 1988).
Checker Reef is a patch reef in Kaneohe Bay. Oahu. Hawaii (Fig.I). This reef, measuring roughly 750 by 350 m, is located leewardof a pass in the barrier reef fronting the bay and is exposed to smallwaves and wind chop. The reef rises steeply from a carbonate andterrigenous lagoon floor 15 m deep. Despite its proximity to the highisland of Oahu, this reef appears to be unaffected bv either freshgroundwater or input of terrigenous sediment. The t~p of the reefshoals at low tide. Coral cover is high (>30%) on the upper slopeand edge of the reef; the top is covered with algae, sand, and semiconsolidated rubble (MORRISSEY, 1985 ).In comparison with manyreefs, Checker Reef is poorly lithified and located in a relatively lowenergy environment. Structural features in Kaneohe Bay, includingChecker Reef, are thought to rest on an antecedent limestone platformresulting from an earlier phase of reefdevelopment (HOLLETT, 1977).
We sampled interstitial waters from the framework of CheckerReef by manually driving custom fabricated well points into the topof the reef framework. Internal plumbing within the well points allowed collection of reef interstitial water (RIW) from I, 2, or 4 mdepths within the reef (see SANSONE et aI., 1988a, for details). Overall,a transect consisting of six wells with a total of nine sampling portswas established from the windward to the leeward margins of thereef (Fig. I). For comparison with RIW, surface seawater (SSW)was sampled from near the middle and off the windward and leewardmargins of the reef.
CONCEPTUAL APPROACH
Water was collected using a battery-powered peristaltic pump whichwas connected to the sampling ports on the wells. Approximately1.5 I of RIW were withdrawn per sample; assuming a porosity of50%, the withdrawn water would be contained within a sphere havinga radius of 9 cm. Flow rates in excess of 700 ml/min were readilyobtained, although most samples were collected at a rate of approximately 500 ml/min. To avoid sampling water residing within thewell, the first 200 ml of water was discarded. The opportunity tocollect anoxic interstitial water directly without excessive samplehandling was a major advantage over conventional methods, in whichpore water extraction by squeezing or centrifugation may permit atmospheric contamination. Additionally, the large volumes obtainedallowed for greater analytical precision as we were able to rinse sampling gear and overflow collection bottles thoroughly to minimizeatmospheric contamination. The high sample volumes also eliminatedthe need to dilute samples for analysis or to use small volumes; thelarge volumes also permitted replicate analyses.
Temperature (±0.2°C) and pH (±0.01) were measured directlyin the field on an aliquot of the collected water; the pH electrodewas standardized against NBS buffers and held in a TRIS-seawatersubstandard until employed (SMITH et aI., 1981 ). Samples for methane (±I%), sulfide (±IO I'M), and oxygen (±5 I'M) were collectedby overflowing water directly into precombusted glass sample bottles.Methane was preserved with HgCh and analyzed by gas chromatography within a week according to the methods of BROOKS et al.( 1981 ). Sulfide was fixed with zinc acetate following oxygen removalaccording to the Winkler method (INGVORSEN and J0RGENSEN,1979). Both oxygen and sulfide were typically determined the sameday as collection; all measurements were made within a day of collection. Samples were filtered (Gelman GF/ F) for determination oftitration alkalinity (±0.005 meq/l, EDMOND, 1970), dissolved Ca(±0.02 mM, KREMLlNG, 1983), and nutrients (see SMITH et aI.,1981). Alkalinity was typically determined later on the day of collection, and Ca was usually determined the following day. Nutrientswere frozen until analysis, usually within a week. Dissolved organicC (DOC) was determined by persu1fate oxidation according to themethods of SMITH et al. (1987). Dissolved organic N (DON) and P(DOP) were measured by inorganic methods following UV oxidation(WALSH, 1989). Salinity was measured (±0.003%.) using an AGEMinisal 2100 induction salinometer. Sulfate was measured gravimetrically following precipitation as BaS04 (KREMLlNG, 1983).
Dissolved inorganic C (DIC) was calculated from pH and carbonatealkalinity after subtracting the contributions of borate sulfide ammonia, phosphate, hydrogen, and hydroxyl and silicat; ions to'titration alkalinity (TA) according to the methods of DICKSON (1981).Apparent dissociation constants for carbonic acid (MEHRBACH etaI., 1973), boric acid (LYMAN, 1975), hydrogen sulfide (GOLDHABERand KAPLAN, 1975), ammonia (JOHANSSON and WEDBORG, 1980),phosphoric acid (DICKSON and RILEY, 1979), and silicic acid(DYRSSEN, 1975) were used to calculate the distribution of ionicspecies. The quantity of each of these ionic species was determinedfrom equilibrium calculations using the total constituent concentration, the apparent dissociation constant of the species in question,and the measurement of sample pH. Total borate was assumed tobe conservative with respect to salinity. Evaluation of the analyticaluncertainty associated with the measurements used to calculate DICindicated a precision of ±0.02 mM.
To check the accuracy of the calculated DIC values, 73 subsamplesofsurface and framework water were filtered into precombusted glassbottles for analysis by gas chromatography (WEISS and CRAIG, 1973).The measured DIC content of these bottles was compared with DICvalues calculated using the post-filtration pH values and measuredconstituent concentrations, as described above. The relationship between measured and calculated DIC was DICcALc = 1.008 DICMEAs+ 0.04 (r2 = 0.933), suggesting that the calculated DIC values areaccurate to ± 1%.
o 100mL.........J
N
1
FIG. I. Location l?f Checker Reef, Kaneohe Bay, Oahu, Hawaii.Well point stations are identified by letters A-E. "Fore" and "Back"are surface seawater stations.
Our objective was to use relevant chemical variables inorder to determine the overall extent and relative importanceof the reactions represented by Eqns. ( 1-5). Such a determination of net reaction extent yields an integrated perspec-
..__ ._--- .-----

Diagenesis in a coral reef framework, Oahu, Hawaii 2441
tive of system-wide biogeochemical performance. We arguethat such a perspective is the proper scale at which to considerreactions of consequence to an entire system.
A mass-balance analysis was used to partition the relativecontribution ofEqns. (1-5) for each sample. For this chemicalpartitioning model, all quantities were normalized to a salinityof 35. To start, the difference between average SSW Ca concentration and RIW Ca concentration was used to calculatethe change in DIC owing to net calcium carbonate precipitation/dissolution (Eqn. 5). Next, the difference betweenSSW and RIW Oz concentration was used to determine theextent of oxic respiration in that sample (Eqn. I). Similarly,differences in nitrate + nitrite and methane concentrationsbetween SSW and RIW were used to calculate the extent ofdenitrification (Eqn. 2) and methanogenesis (Eqn. 4), respectively. The oxidation and subsequent denitrification ofammonia released during organic decomposition cannot bedetermined by this model, but the amount was probably smallbecause of the very low Oz concentrations in RIW. Finally,the difference between the observed increase in DIC and thatcalculated from the contributions of the processes above wasattributed to sulfate reduction. The measured sulfide valueswere not used as a measure of sulfate reduction because ofthe likely loss of sulfide into mineral phases. The precisionof this model equals the sum of the uncertainty of each ofthe components (C, Ca, Oz, CH4 , and N03 + NOz ); this isabout 50 J.tM.
A similar stoichiometric model was used by EMERSON etal. ( 1982) to evaluate changes in deep ocean sediment pore
waters. A major difference in this study is the use of measuredchanges in Ca concentration to evaluate the extent of carbonate mineral reactions (Eqn. 5) and their effect upon DICand TA.
It is recognized that the use of key chemical variables asindicators ofsystem-level processes is limited to the resolutionof the net effects of such processes and does not determinethe full extent to which a reaction has proceeded if an opposing process is also occurring. For example, methane produced by microbial activity under reducing conditions maybe subsequently consumed by Oz-consuming chemolithotrophs. Similarly, the combination of anaerobic sulfate reduction and subsequent aerobic sulfide oxidation will havea net chemical signal similar to oxic respiration. Dissolvedsulfide can also combine with metals, notably Fe, to formsolid-phase precipitates.
RESULTS
Repeated sampling has revealed a consistent pattern in thechemistry ofRIW. Table I shows the results of repeated sampling of each of the seven wells and surface water; resultsfrom a single sampling day are shown in Fig. 2. A morecomplete data set is reported by SANSONE et al. (1988b, 1990).
Salinity variations in SSW and RIW are within 10% of35%0 and appear to result from a combination of freshwaterrunoff, evaporation, and mixing. The average salinity of thedeepest well (D4) is essentially the same as the average salinity
Table 1. Summary of parameters of ssW' and RIY' in Checker Reef wells from June 29. 1986 toFeb. 2, 1988. n - number of determinations; TEMP - temperature in °C; SAL - salinity; TA,DIC, and Ca in mM; CH4 in run; TA in meq/l; all other quantities (except pH) in IJoM.
SA.~PLE TEMP SAL pH 0, H,S CH. TA DIC PO. NO,+N03 NH. S1 Ca
SSII Ave 26.1 34.712 8.180 230 <5 12 2.234 1. 938 0.09 0.28 0.54 5.86 10.33n-22 MAX 30.4 35.071 8.270 308 <5 89 2.296 1.992 0.17 2.32 1. 87 11.66 10.49
MIN 22.3 33.994 8.085 187 <5 0 2.181 1. 829 0.03 0.03 0.12 2.34 10.11
A1 Ave 25.8 34.533 7.738 20 6 61 2.255 2.155 1. 26 0.13 8.61 29.22 10.29n-10 MAX 29.2 35.006 7.775 43 13 236 2.360 2.270 1.43 0.29 15.84 33.36 10.46
MIN 22.7 32.884 7.677 8 3 24 2.200 2.099 0.87 0.06 5.15 25.91 9.86
B1 Ave 26.0 34.617 7.699 22 35 155 2.381 2.287 1. 36 0.13 12.26 24.11 10.33n-15 MAX 28.4 35.207 7.744 112 82 320 2.585 2.447 1. 59 0.27 29.06 29.21 10.45
MIN 22.7 32.934 7.630 <5 14 5 2.280 2.191 0.84 0.05 5.94 16.47 9.92
C1 Ave 25.5 34.577 7.644 9 49 195 2.441 2.334 1. 75 0.19 18.27 32.07 10.35n-10 MAX 27.9 35.022 7.682 28 70 279 2.551 2.448 2.40 0.61 24.93 45.48 10.52
MIN 22.6 32.899 7.601 <5 19 114 2.349 2.253 1.46 0.08 9.90 26.17 9.94
C2 Ave 25.5 34.602 7.706 15 28 185 2.375 2.266 1. 27 0.09 13.62 21. 53 10.32n-10 MAX 27.7 35.001 7.746 48 62 308 2.497 2.372 1. 65 0.19 24.36 32.60 10.43
MIN 23.5 32.841 7.655 <5 6 113 2.301 2.214 1.1Z 0.03 8.26 18.75 9.94
D1 Ave 26.3 34.634 7.565 4 211 441 2.931 2.702 2.66 0.06 41.71 63.83 10.38n-15 MAX 28.1 35.034 7.677 24 376 761 3.475 3.136 2.91 0.19 58.80 78.94 10.50
MIN 23.4 32.615 7.469 <5 61 116 2.327 2.217 2.06 0.00 16.97 45.17 9.86
D2 Ave 26.1 34.821 7.507 <5 337 587 3.339 3.024 2.64 0.07 62.43 96.83 10.47n-15 MAX 27.8 35.032 7.550 <5 484 838 3.627 3.287 3.12 0.30 76.29 107.23 10.52
MIN 23.4 34.436 7.460 <5 163 94 3.089 2.674 2.20 0.00 48.30 78.33 10.37
D4 Ave 25.8 34.730 7.564 1 139 250 2.643 2.480 1. 98 0.10 66.08 83.38 10.26n-7 MAX 26.4 34.734 7.604 4 194 283 2.876 2.785 2.24 0.12 71.76 87.63 10.47
MIN 25.6 34.723 7.423 <5 97 229 2.450 2.236 1. 88 0.08 62.15 79.65 10.19
E1 Ave 25. Z 34.537 7.742 16 13 111 Z.361 2.25Z 1. 22 0.09 24.29 35.61 10.26n-7 MAX 27.4 34.899 7.847 27 25 165 2.454 2.362 1.40 0.20 37.67 52.01 10.36
MIN 23.3 33.386 7.688 8 3 60 2.286 2.191 1.05 0.06 11. 20 27.94 9.92
E2 Ave 25.6 34.597 7.728 23 12 90 2.318 2.214 1. 25 0.20 19.01 34.36 10.27n-7 MAX 28.0 34.974 7.787 50 30 146 2.385 2.287 1. 37 0.43 34.57 42.13 10.35
MIN 23.5 33.684 7.671 6 4 49 2.256 2.147 1. 08 0.03 6.41 26.99 10.02

2442 G. W. Tribble, F. J. Sansone, and S. V. Smith
250 400
200 OXYGEN (UM)SULFIDE (uM)
300
150200
100
50100
0 0BK E2 El 040201 C2 Cl Bl Al FR BK E2 El 04 02 01 C2 Cl Bl Al FR
8.2 800
8.0 pH600
7.8 400
7.6 200
7.4 0BK E2 El 0402 01 C2 Cl Bl Al FR BK E2 El 040201 C2 Cl Bl Al FR
10.6
3.4 ALKALINITY (meq/I) 10.53.1
10.42.8
2.5 10.3
2.2 10.2BK E2 El 040201 C2 Cl Bl Al FR BK E2 El 0402 01 C2 Cl Bl Al FR
3.0 80
PHOSPHATE (uM) 60 AMMONIA (um)2.0
40
1.020
0.0 0BK E2 El 040201 C2 Cl Bl Al FR BK E2 El 040201 C2 Cl Bl Al FR
FIG. 2. Overview of Checker Reef RIW and overlying seawater concentrations measured on Aug. 26, 1987 (see Fig.I for station locations). FR = forereef surface seawater. BK = backreef surface seawater. A, B, C, D, and E are wellpoint stations; samples are from 1,2, or 4 m depths, as indicated by the numeric suffixes.
of SSW adjacent to the reef (34.73 vs. 34.71%0), indicatingthat fresh groundwater intrusion directly into the reefframework is either absent or trivial.
Oxygen levels in the reef are low (mean = 14 /-LM) in contrast with SSW (240 /-LM) and are often undetectable at thecentral reef wells (D I, D2, and D4). Sulfide and methaneshow an opposite pattern, with values lowest in SSW andhighest in the reef center. Specifically, average sulfide valuesranged from undetectable levels in SSW to 337 /-LM in wellD2. Average methane concentrations rose from 12 nM inSSW to 587 nM in well D2.
The pH of RIW is clearly depressed relative to the SSWnorm of 8.2. The lowest pH values are noted in wells D I,D2, and D4, where values of 7.5 are common. The otherwells have pH values of7.6-7.7. TA and DlC levels in RIWare distinctly elevated over SSW. The largest offset from SSWis found in well D2: average values of TA and DlC are 3.3mM and 3.0 mM, respectively.
The inorganic dissolved nutrients phosphate, ammonia,and silica also follow this pattern of increase from the reefmargins towards the center. Nitrate + nitrite concentrationsshow an opposite pattern, with depressed concentrationswithin the reef and 'especially low or undetectable levels in
wells Dl and D2. Dissolved organic C, N, and P concentrations in RIW are not significantly different from SSW(Table 2).
RIW sulfate concentrations (not shown) are within 2% ofSSW. This is not surprising as the measured sulfide valuesare usually < I% of the total seawater sulfate pool.
Dissolved Ca showed subtle excursions from SSW. Whennormalized to a salinity of 35%0, most wells tend to show anon-conservative input of Ca; this is particularly true for well
TABLE 2. Organic nutrient concentrations (in I'M) inreef surfece water (5511) and interstitial water (RIll).STD. DEV. and N refer to the standard deviation andnumber of samples I respectively.
CONCENTRATION (I'M)
CARBON NITROGEN PHOSPHORUS
SSII: AVERAGE 48.54 7.58 0.30STD. DEV. 4.46 1. 56 0.02N 3 7 7
RIll: AVERAGE 44.43 9.29 0.24STD. DEV. 5.31 2.89 0.09N 11 24 24

Diagenesis in a coral reef framework, Oahu, Hawaii 2443
D2. However, several of the wells (E I, E2, and D4) show aclear non-conservative loss of dissolved Ca.
DISCUSSION
Spatial Patterns in RIW Chemistry
Spatial and temporal variation in the chemistry of RIWare discussed in detail by SANSONE et al. (1988b, 1990).Briefly, spatial variation appears to result from the aerobicand anaerobic oxidation of organic material within the reefframework. The products of respiration increase from themargins of the reef toward the center. Differences betweensamples taken from I and 2 m depths tend to be smallerthan the differences between wells at different sites across thereef.
It is possible that this horizontal gradient reflects the buildup of diagenetic products as water moves towards the centerof the reef (SANSONE et aI., 1988b, 1990). However, hydrologic considerations suggest that exchange between SSW andRIW in the upper meter of the framework occurs primarilythrough vertical mixing, and there is no significant differencein exchange rates between any of the I m wells (TRIBBLE etaI., 1988). Consequently, horizontal differences in RIWchemistry may also be obtained from differing sizes or deliveryrates of material to the labile C pool.
The co-occurrence of oxygen, sulfide, and methane in thesame well samples shows that bulk RIW is not at thermo-
dynamic equilibrium. The observed changes in each one ofthese RIW constituents is consistent with the microbial oxidative processes of oxic respiration, sulfate reduction, andmethanogenesis, respectively. However, even the low levelsof O2 detected in many of the wells are incompatible withthe presence of both sulfide and ammonia, which we wouldexpect to be oxidized by chemolithotrophs (THAUER et aI.,1977), and the occurrence of methanogenesis, which requiresextremely reducing conditions to proceed (RUDD and TAYLOR, 1980). It appears that the water we sampled is probablya mixture of waters that have undergone differing degrees oforganic diagenesis. The very heterogeneous internal physicalstructure of reefs (e.g., GINSBURG and SCHROEDER, 1973)probably favors development of a variety of microzones inwhich diagenetic reactions can proceed at differing rates andto differing degrees. Waters from different microzones combine through physical mixing and/or diffusion to form thebulk pore waters examined in this study. Evidence for theimportance of microzone processes is given by SANSONE etal. (1988b).
Stoichiometric Relationships
Stoichiometric considerations can be used to determinethe net reactions that may be predominant in RIW. In Fig.3a total DlC is plotted against TA. RIW falls along a line (r 2
= 0.99) which is distinctly offset from SSW. This offset,equivalent to an increase in DIC of about 0.22 mM with no
TA (meq/I)
400 B 101010 4 4
300 4 4
200 ~4J!6&t
100 '10 ~AA01.8 2.2 2.6 3.0 3.4
DIC (mM)
SULFIDE (uM)
5oo,.....-----r----...,
3.42.6 3.0DIC (mM)
2.2
AJIll"I.."
..r~
2.5 /
2.1 :Jf1I1.8
2.9
3.3
3.7
METHANE (nM)
1000,.....--------.....,
CALCIUM (mM)
10.7-r-----------,
3.43.02.62.2
10.6D
~1t4t~4@ ©
10.5 DEll A .... 44
ij A10.4 © A
~
10.3$ /4'
1O.2+---.---.----..,.----r---.---.----..,,....--i1.83.43.02.62.2
CBOO
600
400
200
o1.8
DIC(mM) DIC(mM)
FIG. 3. a) Titration alkalinity vs. DIC for SSW and RIW. Slope of the line is 1.21, r 2 = 0.995. b) Total dissolvedsulfide vs. DIC for SSW and RIW. c) Total dissolved methane vs. DIC for SSW and RIW. d) Total dissolved Ca vs.DIC for SSW and RIW. Calcium values normalized to a salinity of 35 ppt. SSW = Square; Wells A, B, C, and E= Circle; Wells Dl and D2 = Triangle; Well D4 = Diamond.

2444 G. W. Tribble, F. J. Sansone, and S. V. Smith
change in TA, is consistent with the observed difference inO2 concentrations between SSW (240 J.LM) and RIW (14J.LM), and indicates aerobic oxidation to near O2 depletion(Eqn. I). The line defined by the DlC and TA data appearsto be a reaction pathway describing the oxidation of organicmaterial within the reef framework. By-products of anaerobicrespiration such as sulfide and methane show an increasewith increasing DlC (Fig. 3b, c), as do inorganic nutrients(see below). Note, however, that the quantities of methanemeasured are several orders of magnitude too low to accountfor the increase in DIC (Eqn. 4); it appears that methanogenesis is a quantitatively insignificant contributor to organicdiagenesis within Checker Reef. Measured sulfide values areabout what would be predicted from the increase in DlC(after subtraction of the aerobically derived DlC from totalexcess DlC) according to the reaction described in Eqn. (3).Dissolved Ca also shows an increase with DlC (Fig. 3d),indicating net dissolution of calcium carbonate (Eqn. 5).
The slope of the DlC-TA line ( 1.21 ) is between that whichwould be expected from sulfate reduction (slope = 1.0, Eqn.3) and calcium carbonate dissolution (slope = 2.0, Eqn. 5).A reaction combining sulfate reduction and carbonate dissolution which has a slope of 1.2 can be written as
4CH20 + 2S0;2 + CaCOJ -. 5HCO)
+ 2HS- + H+ + Ca+2 • (6)
This equation predicts a 4: I ratio between C release fromsulfate reduction and C release from the dissolution of calcium carbonate.
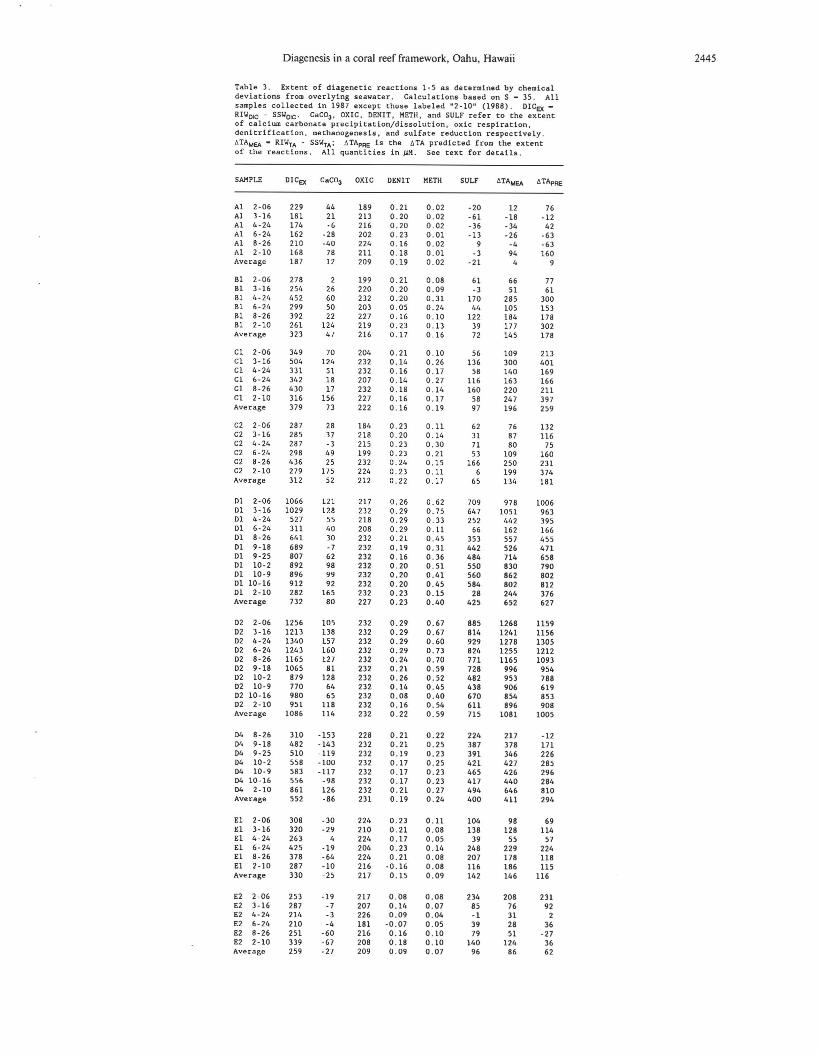
Chemical Partitioning Model
To investigate the reaction stoichiometry further, thechemical partitioning model described earlier was used topartition chemical differences between average SSW and eachRIW sample into Eqns. ( 1-5). The results of this are givenin Table 3; all quantities refer to J.LM C, with a positive numberreflecting a release of C into the RIW sample. The validityof this model can be checked by summing the changes inalkalinity resulting from the processes considered plus themeasured input of ammonia and comparing this calculatedchange in TA to the change measured in the sample. Theuse of TA as a check is sensitive to model discrepancies aseach of the major reactions has a different effect on TAperunit of DIe. For example, the TA:DIC ratio is 2:1 for calciumcarbonate precipitation / dissolution (Eqn. 5), I: I for sulfatereduction (Eqn. 4), and 0: I for oxic respiration (Eqn. I).
Figure 4 shows the relationship between measured changesin TA and those calculated from the model using pure calciteor aragonite as the reactive mineral phase. The empiricalrelationship (in units ofJ.Leq/ I) between the calculated changein TA (~TAcALC> and that measured (~TAMEAs) is
~TAcALc = 0.96 ~TAMEi\s - 6.0
(r2 =0.95;n=64), (7)
where a slope of 1.00 would indicate perfect agreement between the calculated and measured alkalinity values. Theintercept of6 J.Leq/1 is well within the analytical uncertaintyof the data. By using aragonite or pure calcite as the reactive
phase, it appears that 96% of the observed changes in TA canbe accounted for by simple partitioning of Eqns. ( 1-5). Theagreement between the predicted and measured changes inTA indicates that the model is quite satisfactory.
Figure 5 shows the average extent of Eqns. ( 1-4) for eachof the wells. Note that oxic respiration and sulfate reductionpredominate over nitrate reduction and methanogenesis byseveral orders of magnitude. The nearly equivalent extent ofaerobic respiration in all wells suggests that this process occursearly and relatively rapidly as oxygenated SSW enters thereef framework. Sulfate reduction then dominates as the primary pathway for organic oxidation. The negative sulfatereduction values for well A I may reflect a modest amount(22 J.Lmol/l) of sulfide oxidation at this site, although thisvalue does not exceed the analytical uncertainty of the model.
A comparison of predicted vs. measured sulfide values indicates that 91 % (r2 == 0.75) of the predicted sulfide is founddissolved in the interstitial waters; the "missing" 9% presumably has been precipitated as iron sulfides. Pyrite framboidshave been observed in association with dissolution cavitiesinside buried coral rubble (SANSONE et aI., 1988b). Dissolvedmetal concentrations were not measured in this study, so thepotential effects of metal reduction cannot be evaluated.However, the ability of the partitioning model to account for>90% of the sulfide suggests that substantial quantities ofreduced Fe are not present and metal reduction plays a second-order role in determining the chemistry of RIW.
Although most wells show evidence for net dissolution ofcarbonates, wells EI, E2, and D4 show consistent evidencefor net carbonate precipitation (Table 3). In general, framework waters are close to saturation with respect to aragonite(TRIBBLE, 1990). For the wells as a whole, there is no correlation (r2 == 0.11 ) between Ca release (Eqn. 5) and organicrespiration (taken as the sum of Eqns. 1-4). Although themodel does not appear to confirm the 4: I ratio between sulfatereduction and calcium carbonate dissolution predicted fromsimple stoichiometric considerations (Eqn. 6), inspection ofthe data indicates that the predicted 4: I stoichiometry is followed in wells D1 and D2 (Fig. 6). It may be the kineticfactors or analytical imprecision that prevents this relationshipfrom being more clearly expressed at the other well sites.
Nutrient Concentrations
Dissolved organic C, N, and P concentrations in RIW arenot significantly different from surface water concentrations(Table 2). In contrast, nitrate + nitrite levels show a depletionin the well waters, especially in those which have undergonethe highest degree oforganic oxidation (Fig. 7). This depletionis interpreted to be a result of denitrification owing to theanoxic nature of the interstitial waters. The other dissolvedinorganic nutrients (ammonia, phosphate, silicate) are elevated over SSW and show an increase in concentration withincreasing DIe. This is particularly apparent when the changein nutrient concentration is plotted (Fig. 8) against the increase in DlC owing to respiration (the sum of Eqns. 1-4).The slope of the regression line for each plot can be used todetermine an organic CN ratio of 12.4: I (r 2 == 0.76), aCP ratio of 460: I (r2 == 0.71 ), and a CSi ratio of 10.1: I (r 2
=0.83).
Diagenesis in a coral reef framework, Oahu, Hawaii 2445
Table 3. Extent of diagenetic reactions 1-5 as determined by chemicaldeviations from overlying seawater. Calculations based on S - 35. Allsamples collected in 1987 except those labeled "2-10" (1988). OICEl( -RIII01C - SSII01C ' CaeOa, OXIC, OENIT. HITH, and SULF refer to the extentof calcium carbonate precipitation/dissolution, oxic respiration,denitrification, methanogenesis, and sulfate reduction respectively.6TAMEA - RIIITA - SSIITA ; 6 TApRE is the IlTA predicted from the extentof the rese tlans. All quantities in JlH. See text for details.
SAMPLE OICEl( CaeOa OXIC OENIT METH SULF 6TAMEA HApRE
Al 2-06 229 44 189 0.21 0.02 -20 12 76Al 3-16 181 21 213 0.20 0.02 -61 -18 -12Al 4-24 174 -6 216 0.20 0.02 -36 -34 42Al 6-24 162 -28 202 0.23 0.01 -13 -26 -63Al 8-26 210 -40 224 0.16 0.02 9 -4 -63Al 2-10 168 78 211 0.18 0.01 -3 94 160Average 187 12 209 0.19 0.02 -21 4 9
BI 2-06 278 2 199 0.21 0.08 61 66 77Bl 3-16 254 26 220 0.20 0.09 -3 51 61BI 4-24 452 60 232 0.20 0.31 170 285 300Bl 6-24 299 50 203 0.05 0.24 44 105 153BI 8-26 392 22 227 0.16 0.10 122 184 178BI 2-10 261 124 219 0.23 0.13 39 177 302Average 323 47 216 0.17 0.16 72 145 178
el 2-06 349 70 204 0.21 0.10 56 109 213el 3-16 504 124 232 0.14 0.26 136 300 401el 4-24 331 51 232 0.16 0.17 58 140 169el 6-24 342 18 207 0.14 0.27 116 163 166CI 8-26 430 17 232 0.18 0.14 160 220 211Cl 2-10 316 156 227 0.16 0.17 58 247 397Average 379 73 222 0.16 0.19 97 196 259
e2 2-06 287 28 184 0.23 0.11 62 76 132e2 3-16 285 37 218 0.20 0.14 31 87 116C2 4-24 287 -3 215 0.23 0.30 71 80 75C2 6-24 298 49 199 0.23 0.21 53 109 160C2 8-26 436 25 232 0.24 0.15 166 250 231e2 2-10 279 175 224 0.23 0.11 6 199 374Average 312 52 212 0.22 0.17 65 134 181
01 2-06 1066 121 217 0.26 0.62 709 978 100601 3-16 1029 128 232 0.29 0.75 647 1051 96301 4-24 527 55 218 0.29 0.33 252 442 39501 6-24 311 40 208 0.29 0.11 66 162 16601 8-26 641 30 232 0.21 0.45 353 557 455DI 9-18 689 -7 232 0.19 0.31 442 526 47101 9-25 807 62 232 0.16 0.36 484 714 65801 10-2 892 98 232 0.20 0.51 550 830 790DI 10-9 896 99 232 0.20 0.41 560 862 80201 10-16 912 92 232 0.20 0.45 584 802 81201 2-10 282 165 232 0.23 0.15 28 244 376Average 732 80 227 0.23 0.40 425 652 627
D2 2-06 1256 105 232 0.29 0.67 885 1268 1159D2 3-16 1213 138 232 0.29 0.67 814 1241 1156D2 4-24 1340 157 232 0.29 0.60 929 1278 1305D2 6-24 1243 160 232 0.29 0.73 824 1255 1212D2 8-26 1165 127 232 0.24 0.70 771 1165 1093D2 9-18 1065 81 232 0.21 0.59 728 996 954D2 10-2 879 128 232 0.26 0.52 482 953 788D2 10-9 770 64 232 0.14 0.45 438 906 619D2 10-16 980 65 232 0.08 0.40 670 854 853D2 2-10 951 118 232 0.16 0.54 611 896 908Average 1086 114 232 0.22 0.59 715 1081 1005
D4 8-26 310 -153 228 0.21 0_22 224 217 -12D4 9-18 482 -143 232 0_21 0_25 387 378 171D4 9-25 510 -119 232 0.19 0.23 391 346 226D4 10-2 558 -100 232 0.17 0.25 421 427 285D4 10-9 583 -117 232 0.17 0.23 465 426 296D4 10-16 556 -98 232 0.17 0.23 417 440 284D4 2-10 861 126 232 0.21 0.27 494 646 810Average 552 -86 231 0.19 0.24 400 411 294
El 2-06 308 -30 224 0.23 0.11 104 98 69El 3-16 320 -29 210 0.21 0.08 138 128 114El 4-24 263 4 224 0.17 0.05 39 55 57El 6-24 425 -19 204 0.23 0.14 248 229 224El 8-26 378 -64 224 0.21 0.08 207 178 118El 2-10 287 -10 216 -0.16 0.08 116 186 115Average 330 -25 217 0.15 0.09 142 146 116
E2 2-06 253 -19 217 0.08 0.08 234 208 231E2 3-16 287 -7 207 0.14 0.07 85 76 92E2 4- 24 214 -3 226 0.09 0.04 -1 31 2E2 6-24 210 -4 181 -0.07 0.05 39 28 36E2 8-26 251 -60 216 0.16 0.10 79 51 -27E2 2-10 339 -67 208 0.18 0.10 140 124 36Average 259 -27 209 0.09 0.07 96 86 62

2446 G. W. Tribble, F. J. Sansone, and S. V. Smith
CALCULATED ATA(ueq/l) CARBONATE DISSOLUTION (uM)
2OOr----------------.
FIG. 4. Agreement between measured changes in TA relative toSSW and those based on the normative partitioning model (see text).Symbols are the same as in Fig. 3.
MEASURED A TA (ueq/l)
SULFATE REDUCTION (uM)
100
0
-100 ~~~
<> <l>
-200-200 0 200 400 600 800 1000
FIG. 6. Relationship between net calcium carbonate dissolutionand sulfate reduction as determined by the partitioning model (Table3). Symbols are the same as Fig. 3. The solid line shows the 4: I ratiopredicted by stoichiometric analysis (Eq. 6).
1200800400o
400
o
800
1200
RESPIRED DIC (uM)
800'...---------------...,
The C:N and CP ratios are helpful in characterizing theorganic material undergoing oxidation within Checker Reef.The median CN:P ratio for benthic marine plants has been
reported as 550:30:1 (ATKINSON and SMITH, 1983), in contrast with the generally accepted 106: 16: I for planktonic organisms (RICHARDS, 1965). The CN and C:P ratio of theorganic material oxidized within Checker Reef can be partitioned between these two source terms. Using the C:P ratioindicates that 80% of the material is benthic, while the CNratio indicates that 50% is benthic. Because Nand P releasedfrom organic oxidation may be involved in sedimentary reactions and because benthic plant CN:P ratios are quite variable, this calculation is only approximate and serves to indicate that the organic matter undergoing oxidation withinthe reef framework probably comes from both benthic andplanktonic sources.
Mineral binding reactions have been shown to have a strongimpact on sedimentary P concentrations (e.g., PATRICK andKHALID, 1974; KROM and BERNER, 1980; FROELICH, 1988;CARACO et aI., 1989). These have not been evaluated in thisstudy, and it is probable that reactions between reef sedimentsand P released by organic decomposition affect P concentrations in RIW. A plot of total DlC vs. P indicates that as DlCrises above 2.6 mM, the release of P becomes non-conser-
~ L-100
E2 E1 04 02 01 C2 C1 B1 A1
RESPIRED DIC (nM)
800
600
NITRATE + NITRITE (uM)
400.6
II
~ ~ 04 ~ ~ ~ ~ ~ M
WELL
.4
1.8 2.2 2.6 3.0 3.4
FIG. 5. Average extent of organic oxidation pathways (reactions1-4) in each well. Values calculated according to the chemical partitioning model (Table 3).
DIC(mM)
FIG. 7. Total dissolved nitrate plus nitrite vs.'DIC for SSW andRIW. Symbols are the same as in Fig. 3.
•

Diagenesis in a coral reef framework, Oahu, Hawaii 2447
coefficient for such binding is constant over the range of observed NH t concentration. ROSENFELD ( 1979) found thatthe distribution coefficient for exchangeable N in carbonatesediments from Florida Bay was about 0.5. If this number isvalid for Checker Reef, the total N released from organicdiagenesis is about 1.5 times the concentration measured inthe RIW.
The release of dissolved silica suggests that either diatomsor sponge material is a significant contributor to the pool oforganic material undergoing oxidation. Although non-biological silicate mineral reactions (e.g., clay diagenesis) mightcontribute to the release ofSi (SILVERMAN, 1979), the strongcorrelation between respiratory DIC and Si (Fig. 8c) demonstrates that the primary source of the silicate is linked toorganic oxidation.
RESPIRED ole (uM)
FIG. 8. a) Increase in dissolved ammonia vs. DIC increase fromrespiration. b) Increase in dissolved orthophosphate vs. DIC increasefrom respiration. c) Increase in dissolved silicate vs. DIC increasefrom respiration. Symbols are the same as in Fig. 3.
600 900 1200
CONCLUSIONS
The chemistry of the interstitial waters of Checker Reef isstrongly affected by the oxidation of organic material withinthe reef framework. Oxygen is nearly completely consumedin all wells, indicating that oxic respiration occurs relativelyquickly. Although both nitrate reduction and methanogenesiscontribute to anaerobic metabolism, sulfate reduction is thepredominant anaerobic pathway. Calcium concentrationsindicate that net dissolution of carbonate is occurring withinmost of the reef framework. Nutrient ratios suggest that theorganic material undergoing oxidation has both a benthicand planktonic origin.
Acknowledgments-We thank Christine Andrews for cheerful assistance with all phases of this project; we also thank Ted Walsh for thenutrient analysis. The comments of three anonymous reviewers plusreviews by Keith Chave, Yuan-Hui Li, Roland Wol!ast, and particularly Bob Buddemeier were very helpful. This research was supportedby NSF grant OCE86-00803. This is the Hawaii Institute of Geophysics Contribution No. 2316 and Hawaii Institute ofMarine BiologyContribution No. 818.
vative, suggesting that there is a sedimentary sink for P atsites having experienced a relatively high degree of organicoxidation (TRIBBLE, 1990).
The partitioning model indicates that less than 0.3 ~M Nis lost to denitrification, but this value represents only thechange in the size of the nitrate pool in SSW and RIW, anddoes not consider denitrification of oxidized ammonia. Anupper estimate of 8.2 ~M of fixed N lost via denitrificationis established by the negative intercept to the C:N regressionline (Fig. 8a). It appears that sedimentary denitrification isa significant but not a primary sink for fixed N. This is notsurprising. For the fixed N in organic material to contributeto denitrification, the ammonia released during organic oxidation must first be converted to nitrate in the presence ofO2 and reduced to N2 in a suboxic setting.
Fixed N may also be retained in the framework by sedimentary reactions (ROSENFELD, 1979). Given the presentdata base, there is no direct way to evaluate the size of thesedimentary sink for N. However, there is a good linear relationship between NH t and DIC (TRIBBLE, 1990). If sedimentary binding of fixed N is occurring, the distribution
Editorial handling: R. C. Aller
REFERENCES
ALLER R. C. (1980) Quantifying solute distributions in the bioturbated zone of marine sediments by defining an average microenvironment. Geochim. Cosmochim. Acta 44, 1955-1965.
ANDREWS J. C. and MOLLER H. ( 1983) Space-time variability ofnutrients in a lagoonal patch reef. Limnol. Oceanogr. 28, 215227.
ATKINSON M. J. and SMITH S. V. (1983) C:N:P ratios of benthicmarine plants. Limnol. Oceanogr. 28, 568-574.
BERNER R. A. ( 1977) Stoichiometric models for nutrient regenerationin anoxic sediments. Limnol. Oceanogr. 22, 781-786.
BERNER R. A. (1980) Early Diagenesis: A Theoretical Approach.Princeton University Press.
BERNER R. A., SCOlT M. R., and THOMLINSON C. (1970) Carbonatealkalinity in the pore waters of anoxic marine sediments. Limnol.Oceanogr. 15, 544-560.
BROOKS J M., REID D. F., and BERNARD B. B. ( 1981) Methane inthe upper water column of the northwestern Gulf of Mexico. J.Geophys. Res. 86, 11029-11040.
BUDDEMEIER R. W. and OBERDORFER J. A. (1983) Pore water biogeochemistry in a coral reef (abstr.). Eos 64,735.
BUDDEMEIER R. W. and OBERDORFER J. A. (1986) Internal hy-

2448 G. W. Tribble, F. J. Sansone, and S. V. Smith
drology and geochemistry of coral reefs and atoll islands: Key todiagenetic variations. In Reef Diagenesis (eds. J. H. SCHROEDERand B. H. PURSER), pp. 91-111. Springer-Verlag.
BUDDEMEIER R. W. and OBEROORFER J. A. (1988) Hydrogeologyand hydrodynamics of coral reef pore waters. Proc. 6th IntI. CoralReefSymp.. Australia 2, 485-490.
CARACO N. F., COLE J. J., and LIKENS G. E. (1989) Evidence forsulfate-controlled phosphorus release from sediments of aquaticsystems. Nature 341, 316-318.
DICKSON A. G. (1981) An exact definition of total alkalinity and aprocedure lor the estimation ofalkalinity and total inorganic carbonfrom titration data. Deep-Sea Res. 28, 609-623.
DICKSON A. G. and RILEY J. P. ( 1979) The estimation of acid dissociation constants in seawater media from potentiometric titrations with strong base. II. The dissociation of phosphoric acid.Mar. Chem. 7, 101-109.
DISALVO L. H. (1971) Regenerative functions and microbial ecologyof coral reefs. II. Oxygen metabolism in the regenerative system.Canadian J. Microbiol. 17,1091-1100.
DRYSSEN D. ( 1975) Constituent interactions in sea water. Proc. Anal.Div. Chem. Soc. 12, 111-115.
EDMOND J. M. ( 1970) High precision determination of titration alkalinity and total carbon dioxide content of sea water by potentiometric titration. Deep-Sea Res. 17,737-750.
EMERSON S., GRUNDMANIS V., and GRAHAM D. (1982) Carbonatechemistry in marine pore waters: MANOP sites C and S. EarthPlanet. Sci. Lell. 61, 220-232.
ENTSCH B., BOTO K. G., SIM R. G., and WELLINGTON J. T. (1983)Phosphorus and nitrogen in coral reef sediments. Limnol. Oceanogr. 28,465-476.
FROELICH P. N. (1988) Kinetic control of dissolved phosphate innatural rivers and estuaries: A primer on the phosphate buffermechanism. Limnol. Oceanogr. 33, 649-668.
FROELICH P. N., KLINKHAMMER G. P., BENDER M. L., LUEDTKIN. A., HEATH R., CULLIN P., DAUPHIN P., HAMMOND D., HARTMAN B., and MAYNARD V. ( 1979) Early oxidation oforganic matter in pelagic sediments of the eastern equatorial Atlantic: Suboxicdiagenesis. Geochim. Cosmichim. Acta 43, 1075-1090.
GINSBURG R. N. and SCHROEDER J. H. (1973) Growth and submarine fossilization of algal cup reefs, Bermuda. Sedimentology20,575-614.
GOLDHABER M. 8. and KAPLAN I. R. ( 1975) Apparent dissociationconstants of hydrogen sulfide in chloride solutions. Mar. Chem.3,83-104.
GOLDHABER M. 8., ALLER R. c., COCHRAN J. K., ROSENFELDJ. K., MARTENS C. S., and BERNER R. A. (1977) Sulfate reduction,diffusion, and bioturbation in Long Island Sound sediments: Reportof the FOAM group. Amer. 1. Sci. 277, 193-237.
HOLLETT K. J. (1977) Shoaling of Kaneohe Bay, Oahu, Hawaii, inthe period 1927 to 1976, based on bathymetric, sedimentologicaland geophysical studies. MS thesis, University of Hawaii.
INGVORSEN K. and ),0RGENSEN B. B. ( 1979) Combined measurementof oxygen and sulfide in water samples. Limnol. Oceanogr. 24,390-393.
JOHANSSON O. and WEDBORG M. (1980) The ammonia-ammoniumequilibrium in seawater at temperatures between 5 and 25°C. J.Soln. Chem. 9, 37-44.
),0RGENSEN B. B. ( 1983) Processes at the sediment-water interface.In The Major Biogeochemical Cycles and Their Interactions (eds.8. BOLIN and R. B. COOK), Chap. 18, pp. 477-509. J. Wiley &Sons.
KREMLING K. ( 1983) Determination of the major constituents. InMethods of Seawater Analysis (eds. K. GRASSHOFF et al.), pp.247-268. Verlag-Chemie.
KROM M. D. and BERNER R. A. (1980) Adsorbtion of phosphate inanoxic marine sediments. Limnol. Oceanogr. 25,797-806.
LORD C. J. and CHURCH T. M. (1983) The geochemistry of saltmarshes: Sedimentary ion diffusion, sulfate reduction, and pyritization. Geochim. Cosmochim. Acta 47,1381-1391.
LYMAN J. (1975) Buffer mechanisms of seawater. Ph.D. thesis, University of California, Los Angeles.
MACKENZIE F. T., RISVET B. L., THORSTENSON D. c., LERMAN A.,and LEEPER R. H. ( 1981) Reverse weathering and chemical massbalance in a coastal environment. In River Inputs to Ocean Systems(eds. J. M. MARTIN et al.), pp. 152-187. UNEP and UNESCO,Switzerland.
MARTENS C. S. and KLUMP J. V. (1984) Biogeochemical cycling inan organic-rich coastal marine basin 4. An organic carbon budgetfor sediments dominated by sulfate reduction and methanogenesis.Geochim. Cosmochim. Acta 48, 1987-2004.
MEHRBACH c., CULBERSON C. H., HAWLEY J. E., and PYTKOWICZR. M. ( 1973) Measurement of the apparent dissociation constantsof carbonic acid in seawater at atmospheric pressure. Limnol.Oceanogr. 18,897-907.
MORRISSEY J. ( 1985) Carbon flow through fleshy macroalgae oncoral reefs. Ph.D. dissertation, University of Hawaii at Manoa,Honolulu.
OBERDORFER J. A. and BUDDEMEIER R. W. (1985) Coral reef hydrology. Proc. 5th IntI. Coral ReefCong.. Tahiti 3,307-312.
OBEROORFER J. A. and BUDDEMEIER R. W. (1986) Coral reefhydrology: field studies of water movement within a barrier reef.Coral Reefs 5,7-12.
PARNELL K. E. ( 1986) Water movement with a fringing reef flat,Orpheus Island, North Queensland, Australia. Coral Reefs5,1-6.
PATRICK W. H. and KHALID R. A. ( 1974) Phosphate release andsorbtion by soils and sediments: effect of aerobic and anaerobicconditions. Science 186, 53-55.
PIGOTT J. D. and LAND L. S. ( 1986) Interstitial water chemistry ofJamaican reef sediment: sulfate reduction and submarine cementation. Mar. Chem. 19,355-178.
REEBURG W. S. ( 1983) Rates of biogeochemical processes in anoxicsediments. Ann. Rev. Earth Planet. Sci. II, 269-298.
RICHARDS F. A. (1965) Anoxic basins and fjords. In ChemicalOceanography (eds. J. P. RILEY and G. SKIRROW), Vol. I, pp.415-419. Academic Press.
RISK M. J. and MOLLER H. R. (1983) Porewater in coral heads:Evidence for nutrient regeneration. Limnol. Oceanogr. 24, 10041008.
ROBERTS H. H., LuGO A., CARTER B., and SIMMS M. ( 1988) Acrossreef flux and shallow subsurface hydrology in modern coral reefs.Proc. 6/h IntI. Coral ReefSymp., Australia 2, 509-515.
ROSENFELD J. K. ( 1979) Ammonium adsorption in nearshore anoxicsediments. Limnol. Oceanogr. 24, 356-364.
RUDD J. W. and TAYLOR C. D. (1980) Methane cycling in aquaticenvironments. Adv. Aqua/ic Microbiol. 2,77-149.
SANSONE F. J. ( 1985) Methane in the reef-flat porewaters of DaviesReef, Great Barrier Reef (Australia). Proc. 5th IntI. Coral ReefCong.. Tahiti 3, 415-420.
SANSONE F. J. and MARTENS C. S. ( 1981 ) Methane production fromacetate and associated methane fluxes from anoxic coastal sediments. Science 211, 707-709.
SANSONE F. J., ANDREWS C. A., BUDDEMEIER R. W., and TRIBBLEG. W. ( 1988a) Well point sampling ofreef interstitial water. CoralReefs 7, 19-22.
SANSONE F. J., TRIBBLE G. W., BUDDEMEIER R. W., and ANDREWSC. C. ( 1988b) Time and space scales ofanaerobic diagenesis withina coral reef framework. Proc. 6/h IntI. Coral ReefSymp.. Australia3,367-372.
SANSONE F. J., TRIBBLE G. W., and BUDDEMEIER R. W. (1990)Recent diagenetic processes within coral reefs: The case for microbial mediation. Geol. Soc. Amer. Bull. (submitted).
SARAZIN G., CHARPY-RoUBAUD c., and CHARPY L. (1988) Earlydiagenesis of organic matter in the sediments of the central basinof Tikehau Lagoon-Reef (Tuamotu Archipelago-French Polynesia). Proc. 6th IntI. Coral ReefSymp.. Australia 3,373-378.
SILVERMAN M. P. (1979) Biological and organic chemical decomposition of silicates. In Biogeochemical Cycling ofMineral FormingElements (eds. P. A. TRUDINGER and D. J. SWAINE), pp. 445466. Elsevier.
SKYRING G. W. ( 1985) Anaerobic microbial processes in coral reefsediments. Proc. 5th IntI. Coral ReefCongress. Tahiti 3, 421-426.
SMITH S. V., K1MMERER W. J., LAWS E. A., BROCK R. E., and WALSH

Diagenesis in a coral reef framework, Oahu, Hawaii 2449
T. W. (1981) Kaneohe Bay sewage diversion experiment: perspectives on ecosystem responses to nutritional perturbation. Pac.Science 35, 279-395.
SMITH S. V., WIEBE W. J., HOLLIBAUGH J. T., DOLLAR S. J., HAGARS. W., COLE B. E., TRIBBLE G. W., and WHEELER P. A. (1987)Stoichiometry of C, N, P, and Si fluxes in a temperate-climateembayment. J. Mar. Res. 45, 427-460.
SOROKIN Y. 1. ( 1973) Microbiological aspects of the productivity ofcoral reefs. In The Biology and Geology of Coral Reefs (eds.O. A. JONES and R. ENDEAN), Vol. II, pp. 17-43. Academic Press.
THAUER R. K., JUNGER MANN K., and DECKER K. (1977) Energyconservation in chemotrophic anaerobic bacteria. Bact. Rev. 41,100-180.
THORSTENSON D. C. and MACKENZIE F. T. ( 1974) Time variabilityof pore water chemistry in recent carbonate sediments, Devil's
Hole, Harrington Sound, Bermuda. Geochim. Cosmochim. Acta38,1-19.
TRIBBLE G. W. (1990) Early diagenesis in a coral reef framework.Ph.D. dissertation, University of Hawaii.
TRIBBLE G. W., SANSONE F. J., LI Y.-H., SMITH S. V., and BUDDEMEIER R. W. ( 1988). Material fluxes from a reef framework.Proc. 6th IntI. Coral ReefSymp., Australia 2, 577-582.
WALSH T. W. (1989) Total dissolved nitrogen in seawater: A newhigh-temperature combustion method and a comparison withphoto-oxidation. Mar. Chem. 26, 295-311.
WEISS R. F. and CRAIG H. ( 1973) Precise shipboard determinationof dissolved nitrogen, oxygen, argon, and total inorganic carbonby gas chromatography. Deep-Sea Res. 20,291-303.
ZANKL H. and MULTER H. G. (1977)Origin ofsome internal fabricsin Holocene reef rocks, St. Croix, US Virgin Islands. Proc. 3rdInti. Coral ReefSymp., Miami 2, 127-133.