stormwater pollutant removal by two wet ponds in bellevue
TRANSCRIPT

Stormwater Pollutant Removal by Two Wet Ponds in Bellevue, Washington
By Karen J. Comings, Derek B. Booth, ASCE Member,
and Richard R. Horner, ASCE Member1
Abstract
Two wet detention ponds were investigated for their ability to remove pollutants,primarily phosphorus, from stormwater runoff. The two ponds lie within the Phantom Lakewatershed, a sub-basin of the Lake Sammamish watershed in Bellevue, Washington, which isdeveloped as a commercial and residential area with impervious surface area as high as 57%.There are design differences between the two ponds, yet both are comparable to designrecommendations set forth by local agencies. One pond was built for flow attenuation and waterquality treatment; the other serves only to improve water quality. Fifteen storms and twobaseflows were successfully sampled during the Northwest’s wet season from October 1996through March 1997. Pollutant removals varied between a fifth to a half for phosphorus, andgreater than half for total suspended solids and most of the analyzed metals. Removalefficiencies were consistently better in the pond designed primarily for water quality.
Key Words: Phosphorus, Storm Water, Detention Ponds, Water Quality, Urban Runoff, Water Pollution, Best
Management Practices, Treatment, Pollutant Removal
1 Graduate Research Assistant, Research Assistant Professor, Adjunct Research Associate Professor, respectively,Dept. Civil and Environmental Engineering, University of Washington, Box 352700, Seattle, WA 98195-2700

1
Introduction
Detention ponds have been used for decades to mitigate the increase in runoffrates that is a typical consequence of urbanization. They do this by detaining stormwaterrunoff for a period of hours or days, while releasing it slowly to receiving streams andlakes. Although designed primarily for control of water-quantity increases, these pondsare now also being used to reduce non-point pollution (Whipple 1979).
Phosphorus is the pollutant of primary concern to the ecological health of freshwaters in the Pacific Northwest. Phosphorus is an essential nutrient required by allbiological life. In freshwater aquatic environments, phosphorus is frequently limited andtherefore controls the growth of primary organisms such as algae (Cooke et al. 1993).When phosphorus-rich water enters lakes, it can upset this imposed limitation on algalgrowth and cause algae to grow in abundance. Such uncontrolled growth can lead towater quality degradation through eutrophication (Welch 1992), expressed by suchproblems as foul taste and odors, depletion of dissolved oxygen, aesthetic andrecreational impairment, and increased abundance of toxin-producing blue-green algae.
Detention ponds have become one of the more popular means of removing someportion of the phosphorus carried by stormwater prior to final discharge (Lawrence et al.1996). Ponds can reduce pollutants in a variety of ways, depending on the type and formof the pollutant. Solid constituents such as total suspended solids (TSS) and particulate Pare primarily removed by settling, whereas dissolved components can be removed bychemical or biological means. In either case, providing time for the runoff to sitquiescently is key to accomplishing the removal (Horner et al. 1994).
Wet ponds have been shown to be more effective at removing pollutants than dryponds (Field et al. 1993). Dry ponds typically hold water only during storms, so there isonly a short time for pollutant removal. Wet ponds, however, maintain a permanent poolto hold water between storms. This extended residence time provides greater opportunityfor solids to settle and dissolved for components to be acted upon either biologically orchemically.
Studies of phosphorus removal by ponds have reported removal efficiencies thatare highly variable (Kulzer 1989, Ellis and Marsalek 1996) but generally less than 50percent. Total phosphorus removal efficiencies, during individual storms in a detentionpond in Pinellas County, Florida, ranged from 13 to 66 percent with a median value of 40percent (Kantrowitz and Woodham 1995). Another study in Florida reported a pondefficiency for removal of total phosphorus of 21 to 30 percent (Gain 1996). A study oftwo ponds in North Carolina showed average removal efficiencies of 45 and 36 percent(Wu et al. 1996).
The reported removal rates are even more variable for soluble reactivephosphorus than for total phosphorus. One study that compared the removal efficienciesof several dry ponds found a range of soluble reactive phosphorus removal from –12%(i.e., net export) to 26% (Stanley 1996). Dry ponds, however, are not expected to achievethe same degree of treatment as wet ponds because they do not hold and treat waterbetween storms. Another study investigating the performance of an older wet pond foundsoluble reactive phosphorus “removal” efficiencies as low as –50% (Maristany 1993).
There have been relatively few intensive investigations into the water qualityperformance of detention ponds, and among the studies done there is very little

2
consistency of results. Better understanding of how wet detention ponds perform withregard to water quality is essential for improving watershed management practices. Withimproved understanding of pond performance, pond designs can be optimized and the useof sequential best management practices (treatment trains) can be made more efficient.
This study investigated the performance of two ponds, one designed primarily forwater quality treatment and the other designed to provide flow attenuation as well aswater quality improvement. Ponds designed for flow attenuation have a specified volumeof “live storage” space that temporarily holds stormwater releasing it over hours or days.Water quality treatment can be added to such ponds by maintaining a “permanent pool”volume that holds water until another storm refills the pond. Ponds that only providetreatment have a large permanent pool and negligible live storage volume. Runoff thatexceeds the capacity of a pond of this type is bypassed.
Project
This project was instigated in response to concerns about rising phosphorus levelsin Lake Sammamish, Washington State. The Lake Sammamish basin has undergonerapid urbanization since the 1970s, which has increased non-point sources of phosphorussuch as fertilizers, some detergents, animal wastes, soil erosion, and septic tank leachate.A variety of mitigation measures were investigated for use in the basin (King County1998a) including amended sand filtration with underdrains, block alum applications, soilamendments, alum injection in stormwater facilities, wet detention ponds, and temporaryerosion and sediment control.
This study of wet detention ponds included two wet-pond facilities in thePhantom Lake watershed, an area tributary to Lake Sammamish in the southeastern partof the city of Bellevue (Figure 1). The size of the sub-basin served by the ponds isapproximately 40 hectares. The Eastgate Business Park covers more than half of thisland area. The remaining area is a combination of small commercial businesses andresidential areas. Impervious surfaces cover 57 percent of the drainage area.
The first pond in the drainage flow path is “Pond C” (Figure 2). This pond wasdesigned specifically to remove pollutants from stormwater with only limited flowattenuation. Pond C receives runoff from only 5 hectares of the East Gate Business Park.Following treatment by Pond C, discharge is routed via underground pipes to the inlet of“Pond A” (Figure 3), which is designed for both detention and some water-qualityimprovement. In addition to the water from Pond C, Pond A also receives untreatedrunoff directly from the remaining 35 hectares of the sub-basin, which contains bothcommercial and residential areas as well as almost 5 hectares of sparsely vegetatedgrassland. Outflow from Pond A is discharged into Phantom Creek, which flows intoPhantom Lake (approximately 325 hectare drainage basin). Lake Sammamish(approximately 22,700 hectare drainage basin) ultimately receives the water flowing fromPhantom Lake.

3
Figure 1 – Site map showing the southern portion of the Phantom Lake watershed inBellevue, Washington. Elevation of the site is approximately 100 m. Pond C receiveswater from the southernmost five hectares. Pond A receives the outflow from Pond Cplus additional runoff from the remaining thirty-five hectares in the study area.

4
Figure 2 – Pond C is a single-cell water-quality pond designed to treat one-third of theestimated flow volume from a 2-year 24-hour storm.
OUTLETSAMPLING
STATION
OVERFLOW
OIL/WATERSEPARATOR
INLETSAMPLINGSTATION
FLOWPATH
WEIR
TYPICALWATER LEVEL
POND ‘A’WATER QUALITY ANDDETENTION POND
N
0 10 20 meters
Surface Area:PermanentPool Depth:PermanentPool Volume:Live StorageVolume:Watershed Area:
2000 m2
1 m
1000 m3
8000 m3
40 ha

5
Figure 3 – Pond A is a three-cell pond that combines the functions of flow attenuationand water-quality improvement.
OUTLETSAMPLINGSTATION
INLETSAMPLINGSTATION
FLOWPATH
BYPASSNORMALWATERLEVEL
POND ‘C’WATER QUALITY POND
0 10 20 meters
N
Surface Area:PermanentPool Depth:PermanentPool Volume:Live StorageVolume:Watershed Area:
1700 m2
2 m
2200 m3
510 m3
5 ha

6
The two ponds were chosen to make a comparison between the performance of awater quality pond (Pond C) and a combined water quality/flow-attenuation pond (PondA). Pond C was designed under the guidelines set forth by the Washington StateDepartment of Ecology (Washington State Department of Ecology 1992) and in factgreatly exceeds these standards (Table 1). Pond C was constructed with a “horseshoe”shape flow path that minimizes short-circuiting. Pond A is an older pond that wasupgraded, under the guidelines of the King County Surface Water Design Manual (1990),to improve its pollutant-removal performance. It has three cells, but the flow path allowsincoming water to pass straight through the first two cells, suggesting that some short-circuiting may occur. The third cell, however, does force flow to move diagonally acrossit to react the outlet. Additionally, the detention time provided by Pond C is one week,whereas Pond A has a typical detention time of only one day. With more time spent inthe pond, a greater degree of treatment is presumably achieved. This pond will treat avolume of water equal to one-third of a 2-year 24-hour storm. Runoff in excess of thiscapacity bypasses the pond without treatment and is routed directly to Pond A.
Table 1 – Comparison of Ponds A and C to agency design standards. N/A indicates theinformation was not available.
Permanent PoolVolume over Basin
Area
Pond Surface Area Length-to-widthratio
Department ofEcology Standards1992
24 mm N/A 3:1 minimum5:1 preferred
King CountyStandards 1990
10 mm 1% of imperviousarea
3:1 minimum
King CountyStandards 1998
31 mm N/A 3:1 minimum
Pond A Design 2.6 mm 1% of imperviousarea
3:1
Pond C Design 44 mm 5% of imperviousarea
6:1
7
Methods
Sampling Stations
Sample collection for chemical analyses and measurement of flow occurred atfour sampling stations, located at the inlet and outlet of each pond. Equipment washoused above maintenance holes that allowed access to the inlet or outlet pipes of eachpond. At each site, the stormwater samples were drawn by American Sigma brandStreamline model automatic samplers. The samplers were triggered to draw water atintervals specified by the flow measuring equipment. A preset volume of water passingby the station would trigger the pull of a sample. Thus, with greater flow rate moresamples were drawn. Multiple samples were combined in a single carboy, resulting in aflow proportional composite sample.
The specific arrangement of sampling equipment differed somewhat at eachstation. At Pond A, ISCO 4150 velocity-flow meter loggers were used at both the inletand outlet to record flow values at ten-minute increments. Imprecise placement of theflow depth sensor at the outlet of Pond A caused recorded values to be about 15 percentless than the actual flow. At Pond C, the outlet flow was measured through a 60-degreev-notch weir and recorded every fifteen minutes with a Unidata logger. The flow throughthe weir was calculated by using a stage-discharge algorithm for the weir.
Measuring flow at the inlet to Pond C was not as straightforward as at the otherstations, because the inlet pipe to Pond C flows underneath a roadway and enters thepond at a point that is submerged even at low pond water levels. By necessity, thesampling station at the inlet to Pond C was located between the roadway and the pond.Because the inlet pipe is submerged at this point, flow measurements could not be easilymeasured at this station. Instead, water volumes for this station were determined by massbalance using precipitation data collected on-site and evaporation data collected at theBoeing facility nearby.
Lack of direct flow data at the Pond C inlet also hindered sample collection. Asat the other stations, the stormwater sampler needed to be triggered externally to obtainflow-weighted proportional samples. For this station, a flow meter could not be used todetermine when to draw the samples and instead the on-site rain gauge was used.Because the lag time (Dunne and Leopold 1978) for this catchment is only about onehour and the high impervious surface area ensures that most precipitation becomesrunoff, rainfall was judged to be a reasonable surrogate for flow to collect proportionalsamples at this station.
Storm Parameters
The Pacific Northwest has a characteristic pattern of winter rainfall. Generally,storms in this region are low in intensity and storm durations can vary widely. A seriesof storms commonly moves in one after another, resulting in many hours or days oflight rain with few breaks between storms. This pattern makes identifying and samplingindividual “events” difficult.
Before stormwater samples can be collected, a definition of a “storm event” mustbe established. For this project, CH2M Hill (1993) specified a commonly applied criteria
8
for a “storm event” as having a minimum rainfall of 0.1 inches over a six-hour period.This is about one tenth of the 2-year 6-hour event and represents the lower limit ofrainfall that would produce enough runoff for sampling. Each storm was to be precededby at least 48 hours of dry conditions. For the practical application to the storms of thePacific Northwest, these criteria were considered as general guidelines for determiningqualifying storms. Most but not all of the sampled storms conform exactly to theseguidelines, especially in the case of antecedent dry period.
Sampling Procedures
Throughout the course of a single event, the concentrations of pollutants in theflow changes. Typically, concentrations are highest at the beginning of the hydrographduring the period of “first flush” (Horner et al. 1994). The first flush represents the initialperiod of a storm when runoff begins, and is generally presumed to carry the majority ofsubstances from the landscape. Because the stormwater concentrations change over time,samples are best collected throughout the storm and combined together as a singlecomposite sample. Additionally, as a storm progresses, the flow of water passing by thesampling site rises and falls. To ensure that the composite sample represents anaveraging by water volume, it is incrementally augmented by the passage of watervolume rather than time. The resulting single concentration obtained from this compositesampling of the storm is called the “event mean concentration” (EMC).
During the 1996-97 rainy season, weather forecasts were regularly monitored foradvancing storms. Once an incoming storm was identified that was likely to meet thequalifications of a “storm event,” the samplers were set to begin sampling. Samplinggenerally began within a few hours prior to the beginning of rainfall to ensure that thefirst flush of runoff was captured during sampling. Before twenty-four hours had elapsedthe samples were retrieved for analysis, even if rain was still falling. This twenty-fourhour limitation was set to minimize the time between sample collection and analysis ofsoluble reactive phosphorus and biologically available phosphorus. The risk thisintroduced of not sampling the later part of a storm was acceptable because it farexceeded the 12-hour minimum found by the City of Bellevue (1995) to guaranteerepresentative estimation of EMCs.
At the conclusion of each event, four field measurements were taken withportable instruments: pH, temperature, dissolved oxygen, and conductivity. Temperatureand dissolved oxygen were measured with a YSI model 58 dissolved oxygen meter, pHwas measured with a Beckman model φ11 pH meter, and conductivity was measuredusing a Hanna model HI9033 conductivity probe. These four parameters were measureddirectly from the water in carboys just prior to leaving the site as a check on fieldconditions. The carboys were then delivered to the King County EnvironmentalLaboratory, a state certified lab, for chemical analysis.
Events Sampled
Storm samples were collected over a period of six months from October 1996through March 1997. These six months typically represent 71% of the annual rainfall forthe Bellevue area (Table 2) based on data from the Bellevue Service Center (F. Romano,

9
Table 2 – Average monthly rainfall data recorded by the Bellevue Service Center (1981 –1996), representing mean monthly precipitation for the Bellevue area.
Month Precipitation mm (in.)January 103 (4.1)February 80 (3.2)March 71 (2.8)April 70 (2.8)May 47 (1.9)June 35 (1.4)July 25 (1.0)
August 21 (0.8)September 39 (1.5)
October 80 (3.2)November 135 (5.3)December 119 (4.7)
Total 825 (32.7)
Table 3 – Summary of sampled events. N/A means not applicable. Under “samplestaken” ‘X’ indicates that a sample was collected, ‘B’ indicated samples that wereanalyzed for biologically available phosphorus, ‘R’ indicates field replicates, and ‘*’indicated samples that were not collected due to equipment failure.
Storm Characteristics Samples TakenDate Prior Dry Precipitation Duration Intensity A in A out C in C out
(hours) mm (in.) (hours) (mm/hour)10/4/96 > 4 days 21.1 (0.83) 11 1.92 * * X X10/12/96 > 7 days 14.2 (0.56) 17 0.84 B B * X10/17/96 68 19.6 (0.77) 14 1.40 B B B B10/21/06 80 17.0 (0.67) 21 0.81 X X X X10/28/96 81 28.7 (1.13) 15 1.91 X X B B11/3/96 136 5.6 (0.22) 5 1.12 X X X X12/4/96 43 20.1 (0.79) 9 2.23 XR * * X12/19/96 > 7 days 7.4 (0.29) 19 0.39 X * X X1/2/97 4 49.3 (1.94) 34 1.45 X X X X
1/10/97 147 Baseflow N/A N/A X X X X1/17/97 > 7 days 32.0 (1.26) 25 1.28 XR X XR X1/28/97 > 7 days 10.4 (0.41) 6 1.74 B BR B B1/30/97 44 14.2 (0.56) 11 1.29 B B B B2/12/97 > 7 days 10.7 (0.42) 10 1.07 X XR X X3/1/97 > 7 days 28.4 (1.12) 24 1.18 X X X X3/6/97 39 8.1 (0.32) 16 0.51 B B B B4/7/97 76 Baseflow N/A N/A X X X X
Data points collected per station: 14 12 13 15

10
1997, written communication). Although the winter during which this study wasconducted was exceptionally wet (Water Year 1997 precipitation was 1964 mm vs.average annual precipitation of 840 mm), the events that were sampled (Table 3)characterize the broad range of storm events typical of western Washington and generallyfulfilled the project criteria for storm events (CH2M Hill 1993). Precipitation ofcollected storms ranged from 5.6 to 49.3 millimeters (0.22 to 1.94 inches), with averageintensities ranging from 0.38 to 2.24 millimeters per hour (0.015 to 0.088 inches perhour). All but four of the sampled storms followed a dry period of at least 48 hours;someantecedent dry periods extended for more than one week. In addition to sampling storms,two baseflow conditions were sampled following at least three days without rainfall.
Of particular note is the large storm that was sampled on January 2, 1997. Thisevent was in the midst of a sequence of snow and heavy rainfall that produced overflowconditions in both ponds. Although not a discrete “storm event,” this sample evaluatedthe water quality during very high runoff conditions and thus was a particularly valuabledata point.
Laboratory Analysis
Following collection, the King County Environmental Laboratory in Seattleanalyzed the composite samples. The methods used by the laboratory originated fromStandard Methods (APHA 1995) and have been adopted by the King CountyEnvironmental Laboratory. Total suspended solids were determined gravimetrically bymeasuring the dry weight of a filtered sample. Total phosphorus was determinedcolorimetrically following digestion with persulfate. Soluble reactive phosphorus wasalso determined colorimetrically following filtration of the sample. Biologicallyavailable phosphorus was determined in a two-part process. After filtering a knownquantity of sample, the filtrate was analyzed for soluble reactive phosphorous. Thematerial left on the filter was then extracted by being soaked overnight in a dilute sodiumhydroxide/sodium chloride solution. The extract was then neutralized, filtered, andanalyzed for soluble reactive phosphorus. Biologically available phosphorus is the sumof these two phosphorus analyses. Finally, metals were analyzed by inductively coupledplasma mass spectrometry following U.S. EPA (1990) method 200.8.
Data Analysis
The Modified Direct Average Method was used to calculate loading over thesampling period. This method calculates an average value of all the measured EMCscollected during the study, which is then multiplied by the total flow volume measuredduring the study to determine the loading for that period (Bellevue 1995). A loadingcalculation that utilizes averages was chosen because the goal of this study was todetermine how the ponds perform in any given year and not the winter of 1997 alone.Water volume at the inlet of Pond A was used to calculate loading for both the inlet andoutlet of this pond because of a 15% shortfall in the measured flow volume at the outlet.

11
This substitution was based on the assumption of negligible losses from evaporation andinfiltration, and negligible gain from direct rainfall onto the pond.
Knowing the statistical distribution of a data set is necessary so that theappropriate statistical tests can be applied. Previous work with nationwide data hasdemonstrated the prevalence of the log-normal distribution in urban runoff water qualityparameters (Driscoll 1986a). A study that was conducted in the same local area as thisstudy also found that the concentrations of stormwater constituents in this region have alog-normal distribution (Bellevue 1995). A more recent study found that manystormwater constituent concentrations have a log-normal distribution upon entering apond, but change at the pond outlet to a normal distribution (Van Buren et al. 1997).
Although the number of samples in this study was small, a modest effort wasmade to test the anticipated distribution. Probability data were plotted as both arithmeticand log-transformed concentrations for all data. An example of these plots is provided inFigure 4. Plotting positions were determined by the following formula (Cunnane 1978):
F = (i – 0.4) / (n + 0.2)
where: F = plotting positioni = rank of the ith smallest valuen = sample size
By inspection, the log-transformed data plotted closer to a straight line more consistentlythan the untransformed concentrations. The standard assumption of log-normality wastherefore made for the data in this study.
Figure 4 – Probability Plot for Total Phosphorus data taken at Pond A Inlet. οο –untransformed data, n – natural log transformed data.

12
Using the transformed data, the mean of the EMCs (Marsalek 1990) wasdetermined by the following formula:
Cmean = exp(µ + s2/2)
where: exp signifies exponentiation on the base of natural logarithms, e;µ = Mean of natural logarithms of EMCs;s2 = Variance of natural logarithms of EMCs.
This mean was then multiplied by the total flow volume over the period of study to obtainthe loading for that period. Annual loading was determined by dividing the loading thatoccurred during the study by 0.71, which is the fraction of mean annual rainfall thattypically falls within the period sampled (Table 1).
The efficiency of each pond was determined by dividing the amount of eachconstituent that was removed by the pond by the loading that entered the pond:
percent efficiency = (inlet load - outlet load)/inlet load.
Results
Both ponds showed some removal of all measured pollutants. Removal rangedfrom almost none to three-quarters of the measured components, with Pond C (thedesigned water-quality pond) consistently out-performing Pond A. Plots of the pollutantloads that passed through the inlet and outlet of each pond are shown in figures 5 and 6,illustrating the mass removed and the percent efficiency for each constituent. Of the fourconventional constituents measured, total suspended solids (TSS) exhibited the greatestremoval efficiencies for both ponds. Removal of total phosphorus (TP) and biologicallyavailable phosphorus (BAP) was about half the reduction of TSS in Pond C and aboutone-third in Pond A. The greatest proportional difference between the two ponds wasseen in soluble reactive phosphorus (SRP) with 62 percent reduction for Pond C, adramatically greater reduction than the 3 percent seen in Pond A.
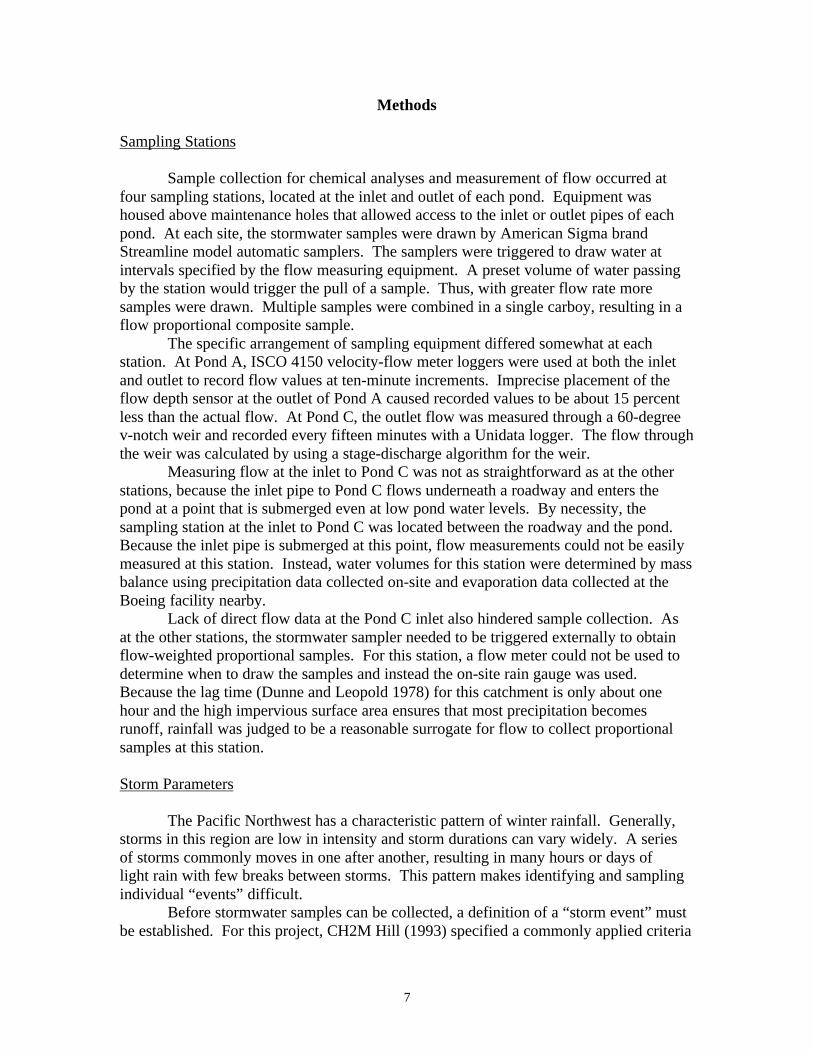
Removal efficiencies for metals were generally around half or greater (Figure 6),although differences between the two ponds were not nearly as pronounced as for TSSand phosphorus. Copper and lead had very similar removal efficiencies for the twoponds. Pond A showed better results for cadmium, and Pond C for zinc.
Annual loading at each site for both the nutrient and metal constituents studied issummarized in Table 4. Pond C removed more pollutants per hectare than Pond A for allmeasured constituents even though Pond A, which serves a larger watershed, removedmore overall mass of pollutants than Pond C.
The calculated means from the set of EMCs (Table 5) are typical of valuesreported for the Phantom Lake watershed (KCM 1993). Concentrations of suspendedsolids were higher at the inlet of Pond A than at Pond C. Phosphorus and metalsconcentrations are typical of stormwater in this region (Chandler 1995). Variability ofthe data at the inlet of each pond is notably greater than at the outlet for mostconstituents.

13
Figure 5 – Removal of conventional constituents by Ponds A and C during the period ofstudy. Error bars indicate 95% confidence.
Total Suspended Solids
0
1000
2000
3000
4000
5000
81% RemovalPond C
61% RemovalPond A
Mas
s (O
ct. 1
996
- M
ar. 1
997,
kg
)in
out
Total Phosphorus
02468
10121416182022
46% RemovalPond C
19% RemovalPond A
Mas
s (O
ct. 1
996
- M
ar. 1
997,
kg
)
in
out
Soluble Phosphorus
0.0
0.5
1.0
1.5
2.0
2.5
3.0
3.5
4.0
62% RemovalPond C
3% RemovalPond A
Mas
s (O
ct. 1
996
- M
ar. 1
997,
kg
)
in
out
Bioavailable Phosphorus
0.0
0.5
1.0
1.5
2.0
2.5
3.0
3.5
4.0
4.5
5.0
54% RemovalPond C
19% RemovalPond A
Mas
s (O
ct. 1
996
- M
ar. 1
997,
kg
)in
out
14
Figure 6 – Removal of metals by Ponds A and C during the period of study. Error barsindicate 95% confidence.
Copper
0.00.10.20.30.40.50.60.70.80.91.0
47% RemovalPond C
37% RemovalPond A
Mas
s (O
ct. 1
996
- M
ar. 1
997,
kg
)
in
out
Lead
0.00.20.40.60.81.01.21.41.61.82.0
76% RemovalPond C
73% RemovalPond A
Mas
s (O
ct. 1
996
- M
ar. 1
997,
kg
)
in
out
Zinc
0
2
4
6
8
10
12
72% RemovalPond C
45% RemovalPond A
Mas
s (O
ct. 1
996
- M
ar. 1
997,
kg
)
in
out
Cadmium
0.00
0.01
0.02
0.03
0.04
0.05
0.06
0.07
52% RemovalPond C
68% RemovalPond A
Mas
s (O
ct. 1
996
- M
ar. 1
997,
kg
)
in
out

15
Table 4 – Calculated annual loading at each of the four stations in kg and the yieldremoved by each pond in kg/ha.
C inlet(kg)
C outlet(kg)
kg removed/ha
A inlet(kg)
A outlet(kg)
kg removed/ha
TSS 1100 200 180 6000 2300 92.5TP 6.0 3.2 0.56 25 20 0.13SRP 1.8 0.67 0.23 3.9 3.8 0.0025BAP 2.2 1.0 0.24 6.0 4.9 0.028Cadmium 0.017 0.008 0.0018 0.082 0.027 0.0014Copper 0.24 0.13 0.022 1.0 0.63 0.009Lead 0.15 0.04 0.022 1.24 0.33 0.023Zinc 5.6 1.6 0.80 14 7.7 0.16
Table 5 – Mean values of event mean concentrations from sampled storms in mg/l.Below each mean value are the upper and lower 95% confidence boundaries (inparenthesis) and the coefficient of variation for each data set.
C inlet C outlet A inlet A outletTSS Mean
95% CICV
16.2(12.4, 21.3)
87%
2.9(2.7, 3.2)
41%
22.8(18.8, 27.8)
86%
8.9(6.6, 12.0)
64%
TP Mean95% CI
CV
0.087(0.079, 0.097)
59%
0.045(0.044, 0.047)
24%
0.095(0.080, 0.114)
86%
0.077(0.070, 0.083)
47%SRP Mean
95% CICV
0.026(0.017, 0.038)
119%
0.010(0.008, 0.011)
52%
0.015(0.011, 0.020)
78%
0.014(0.010, 0.021)
98%BAP Mean
95% CICV
0.033(0.027, 0.039)
50%
0.014(0.013, 0.015)
32%
0.023(0.021, 0.026)
34%
0.019(0.018, 0.019)
19%
Cd Mean95% CI
CV
0.00025(0.00022, 0.00029)
36%
0.00012(0.00011, 0.00012)
39%
0.00031(0.00029, 0.00034)
34%
0.00010(0.00010, 0.00010)
0%
Cu Mean95% CI
CV
0.0035(0.0033, 0.0038)
41%
0.0018(0.0018,0.0018)
17%
0.0039(0.0034, 0.0044)
67%
0.0024(0.0020, 0.0030)
30%
Pb Mean95% CI
CV
0.0022(0.0019, 0.0025)
60%
0.0005(0.0004, 0.0007)
122%
0.0047(0.0021, 0.0108)
188%
0.0013(0.0011, 0.0015)
42%
Zn Mean95% CI
CV
0.083(0.074, 0.093)
45%
0.022(0.021, 0.024)
58%
0.054(0.050, 0.059)
57%
0.03(0.027, 0.033)
33%

16
The measurements recorded by the field instruments were consistent withexpected values. The pH fluctuates between 6.0 and 8.0 as is typical of stormwatersamples. Temperature rises and falls with the changing seasons and was warmest (13.4o
C) at the beginning of the study in the fall. The lowest temperature of 3.5o C wasrecorded following a January storm. Dissolved oxygen was consistently close tosaturation values. This is not surprising, as the samples sat in carboys for hours in thefield before being measured, while composite sampling was ongoing. Thus, thecollection of dissolved oxygen measurements, while specified by the sampling protocol(CH2M Hill 1995), was meaningless in the context of this study. Finally, nearly allconductivity ranged from 17.6 to 438 µS/cm, with the exception of two measurementstaken from baseflow samples, which were 743 and 1173 µS/cm.
Discussion
Both of the ponds reduced the pollutant loading from the watershed. Pond Aremoved a greater amount of solid mass than Pond C by virtue of an eight-fold greaterdrainage area, although Pond C is more efficient. Pond C’s higher efficiency wasanticipated because it was designed specifically for the purpose of water-qualityimprovement. Pond A, although also designed to improve water quality, carries theadditional burden of flow attenuation.
The mechanism in wet ponds for removing suspended solids from stormwater issimply gravitational settling (Whipple and Hunter 1981). Based on the data from thisstudy, the detention times in both ponds are long enough to allow for well over half thesuspended solids to settle out. Because Pond A receives significantly more runoff thanPond C, it removed more than four times as much sediment (2600 kilograms ofsuspended solids compared to 600 kilograms in the same six-month period).
Despite this performance for TSS, the removal efficiencies for total phosphorus inboth ponds fell short of the desired values. In order to protect lakes that are sensitive tophosphorus, King County has adopted a standard of 50 percent reduction in totalphosphorus in stormwater draining from new developments (KCC title 9.04.050.8.b).These standards were developed in a effort to balance protection with “reasonable” and“cost-effective” performance. Yet even the more efficient of the two ponds, Pond C,only approached this standard with 46 percent removal. Pond A fell far short of the 50-percent goal (19 percent efficiency), although it still removed more total phosphorusmass (3.3 kg) than Pond C (2.0 kg). While the 50 percent removal rate has beenestablished by statute, there is little precedent in the published literature; the results ofthis study are consistent with most others studies (Walker 1987, Maristany 1993,Kantrowitz and Woodham 1995, Gain 1996, Stanley 1996, Wu et al. 1996).
The high removal efficiency for soluble reactive phosphorus in Pond C was asurprising result because wet ponds typically perform poorly when removing dissolvedconstituents. The removal of dissolved nutrients is primarily due to two mechanisms:adsorption by soil or sediment at the bottom of the pond and uptake by biologicalorganisms living in the pond (Kulzer 1989). Because the study occurred during fall andwinter months, soluble reactive phosphorus probably was not removed by biological

17
uptake because most organisms are much less active during this time. Thus, measuredremoval rates are more likely attributable to interaction with the pond sediments.
At the time of this study, the condition of the pond sediments in both ponds waslikely to be favorable for the removal of phosphorus. Pond C, a relatively new pond, hadfresh sediment throughout its permanent pool area (1700m2), and Pond A had recentlybeen enlarged thereby exposing new soil primarily in the second cell (900 m2). Cleansediment has a greater capacity to adsorb soluble nutrients than older sediment(Maristany 1993). Pond C had five times more removal per unit area of new sediment(0.5 g/m2) than Pond A (0.1 g/m2) as well as better overall efficiency (62% for Pond Cversus 3% for Pond A) indicating that Pond A performs poorly even under potentiallyfavorable conditions. Deciduous vegetation on the banks and berms of Pond A, whichare absent at Pond C, may be a contributing factor to this pond’s poorer performance.Leaves and twigs dropped by these plants in autumn may cover some percentage of thepond sediment, limiting the soil-water contact in this pond and contributing additionalphosphorus as the material decays that can consume the sediments’ adsorptive capacity.
Removal efficiencies for metals were good in all cases, and all of the metalconcentrations measured at both outlets and inlets were well below the Washington StateWater Quality Standards. The ponds showed less difference between one another in theirremoval capabilities of metals than with the nutrients. This could be due to the tendencyfor some metals to have high initial settling rates (Whipple 1981), reducing the benefit ofPond C’s longer hydraulic residence time relative to Pond A.
Pollutant settling rate plays a major role in the removal efficiency of BMPs suchas wet ponds that rely on gravity as the primary removal mechanism. For suspendedsolids and associated constituents such as metals, large particles settle out quickly butleave behind fine suspended particles that may take weeks to settle out (Whipple 1981).When water is passed from one facility to the next in a treatment train, the upstreamfacilities will likely show higher removal efficiencies because they remove the heavierparticles that settle out rapidly. The downstream facilities would appear to be lessefficient, because they contend with smaller pollutant particles that are harder to remove.Even though Pond A receives effluent from Pond C, the effect of this factor on Pond A’sefficiency is likely to be minimal because Pond A receives over 80 percent of its inflowdirectly from the watershed. Even with lower efficiency, Pond A’s contribution to thequality of runoff from the entire site is substantial due to the relative volume of water ittreats. Figure 7 illustrates this with pie graphs that represent the total loading from thewatershed for each constituent.

18
Figure 7 – Distribution of total loading from the study area during the period October1996 – March 1997. Shaded areas signify the portion of the total loading that wasremoved by each pond. Values are in kg.
Total Suspended Solids Total Phosphorus
Soluble ReactivePhosphorus
Biologically AvailablePhosphorus
1400 2840
640
5.53
1.9512.1
0.50
0.77
2.27
1.35
0.85
2.93
Removed by Pond C
Removed by Pond A
Remaining Load
19
Concentration data from this study suggests that ponds can reduce concentrationvariability. Table 4 shows that coefficients of variation (CV) are reduced between theinlet and outlet of each pond for most constituents suggesting that water quality pondstend to reduce pollutant concentrations toward relatively uniform values. Table 4 furtherindicates that, for the stated range of influent concentrations, there is a 95 percentconfidence that effluent concentrations would be no higher than the given values.Schueler (1996) has suggested that BMPs can only reduce pollutant concentrations tocertain levels or “irreducible minimums”. It is unclear whether the uniform outletconcentrations seen in this study are minimum values or not, yet there does appear to be aconsistently reliable value of predictable outlet concentration that is not dependent on theinlet concentration. This phenomenon was seen most clearly for TSS and other settleablepollutants and may represent the approximate limits of performance for a specific ponddesign. All of the equivalent effluent values, except Cd, were higher for Pond A, thusdemonstrating the inability of a pond designed to a lower standard to reduce dischargepollutants as much.
Because this study occurred only during fall and winter months, the performanceof the ponds during seasons of biological growth is still unknown and could be differentfrom pond performance when photosynthetic organisms are dormant. Previous pondstudies indicate that the presence of aquatic vegetation can improve a pond’s performanceby the uptake of nutrients (Coffman et al. 1993, Kantrowitz and Woodham 1995). Bothponds have aquatic vegetation that grows primarily along their rims. Even so, spring andsummer months in the Pacific Northwest produce relatively little rainfall. Thus, runoff isminimal during these months and baseflow in this watershed actually stops. Because ofthis, impacts from stormwater to aquatic systems in the summer are almost surely lessrelevant than in fall and winter months.
The size of a pond is a major determinant of pond performance. The larger a pondis in relation to the area it drains, the better it performs at removing pollutants (Driscoll1986b). Support for this can be found by looking at percent removal versus the size of apond in relation to its catchment area (Wu 1996). In this study the permanent poolsurface area of Pond A in relation to its basin (1%) is one fifth that of Pond C (5%),which is probably a major contributor to the removal efficiencies being consistentlypoorer than for Pond C.
Detention time is another important factor in pond design. The greater volume ofPond C allows stormwater to remain in the pond up to seven times longer than in Pond A.This provides the settling time needed for solid pollutants to be removed and chemicalinteractions to take place. Short-circuiting, however, can reduce effective detention timeand so the flow path should be carefully considered to fully utilize a pond’s storage spaceand minimize areas of quiescent water. Pond C was designed with a “horseshoe” shapedflow path to minimize short-circuiting, whereas Pond A’s flow path is direct across threerectangular cells. Some improvement could be made to Pond A by shifting the first weirtoward the west side of the pond to direct the flow diagonally across each cell andalternating the flow direction in consecutive cells.

20
Conclusion
The results of this study indicate that wet ponds do provide significantimprovement in the water quality of urban runoff, and they provide guidance for bothappropriate design parameters and the magnitude of pollutant removal that can beanticipated, as well as potential minimum values for effluent concentrations. Of the twoponds evaluated, one considerably out-performed the other in terms of removalefficiencies, demonstrating the importance of variation in pond size, configuration, anddrainage conditions. The more efficient pond (Pond C) has the benefits of extendeddetention time, large volume in relation to its drainage area, and minimal short-circuiting,which greatly contributes to better pollutant removal efficiency. Although, it is notpossible to determine directly from the data which of these factors has the greatestinfluence, our review of pond conditions and previous studies suggests that the pondvolume dedicated to water quality treatment is most critical. However, watershed contextis also important: although Pond A proved to be less efficient, it achieved a greaterreduction in total pollutant loading due to the sheer volume of runoff that passes throughit.
This study supports the value of wet pond detention systems in new developmentsto reduce water quality problems. The results also support the installation of such pondsinto older developments where space allows and watershed conditions require suchprotection. Flow attenuation can be provided as well, albeit at some sacrifice of waterquality performance. Where water quality is the primary need, however, a large-volumepermanent pool design, such as that of Pond C, is preferable.
21
References
Bellevue, City of. (1995). “Characterization and Source Control of Urban StormwaterQuality.” Volume 1 – Technical Report. City of Bellevue Utilities Department.
CH2M Hill. (1993). “Lake Sammamish Phase II Restoration Project: Wet PondMonitoring Project Quality Assurance Plan.” CH2M Hill. Bellevue, WA.
CH2M Hill. (1995). “Phantom Lake Study, Stormwater Detention Analysis for BoeingInformation and Support Services Headquarters Site.” CH2M Hill. Bellevue, WA.
Chandler, R. D. (1995). “Improving Urban Stormwater Runoff Monitoring Practices.”Ph.D., Dissertation, University of Washington, Seattle, WA.
Coffman, L., Green, R., Clar, M., and Bitter, S. (1993). “Development of BioretentionPractices for Stormwater Management.” Water Management in the ‘90s: a time forinnovation: proceedings of the 20th anniversary conference, ASCE, Seattle, WA,126-128.
Cooke, D. G. et al. (1993). Restoration and Management of Lakes and Reservoirs. 2nd
Ed. Lewis Publishers, Boca Raton, Florida.
Cunnane, C. (1978). “Unbiased Plotting Positions – A Review.” Journal of Hydrology,37:205-222.
Driscoll, E. D. (1986a). “Lognormality of Point and Non-point Source PollutantConcentrations.” Urban Runoff Quality – Impact and Quality EnhancementTechnology, B. Urbonas, and L. A. Roesner, ed., ASCE, 438-458.
Driscoll, E. D. (1986b). “Detention and Retention Controls for Urban Runoff.” UrbanRunoff Quality – Impact and Quality Enhancement Technology, B. Urbonas, and L.A. Roesner, ed., ASCE, 381-393.
Dunne, T., and Leopold, L. B. (1978). Water in Environmental Planning. W.H. Freemanand Company, San Francisco.
Ellis, J.B. and Marsalek, J. (1996). “Overview of Urban Drainage: EnvironmentalImpacts and Concerns, Means of Mitigation and Implementation Policies.” Journalof Hydraulic Research, 34:723-731.
Field, R., O’Shea, M. L., Chin, K. K., Ed. (1993). Integrated Stormwater Management.Lewis Publishers, Boca Raton, Florida, 191-205.

22
Gain, S. W. (1996). “The Effects of Flow-Path Modification on Water-QualityConstituent Retention in an Urban Stormwater Detention Pond and Wetland System,Orlando, Florida.” USGS, Water-Resources Investigations Report 95-4297,Tallahassee, Florida.
Horner, R. R., Skupien, J. J., Livingston, E. H., Shaver, H. E. (1994). Fundamentals ofUrban Runoff Management: Technical and Institutional Issues. Terrene Institute,Washington, DC. 296 pp.
Kantrowitz, I. H., and Woodham, W. M. (1995). “Efficiency of a Stormwater-DetentionPond in Reducing Loads of Chemical and Physical Constituents in UrbanStreamflow, Pinellas County, Florida.” USGS, Water-Resources InvestigationsReport 94-4217, Tallahassee, Florida.
KCM, Inc. (1993). “Phantom/Larsen Lake Phase II Restoration Project.” Final Report,vol. 1 – Phantom Lake. KCM inc., Seattle, WA.
King County. (1990). Surface Water Design Manual. Surface Water Division, KingCounty Department of Public Works, WA.
King County. (1998a). “Lake Sammamish Water Quality Management Project, FinalReport.” King County Department of Natural Resources, Seattle, WA.
King County. (1998b). Surface Water Design Manual. King County Department ofNatural Resources, WA.
Kulzer, L. (1989). “Considerations for the Use of Wet Ponds for Water QualityEnhancement.” Office of Water Quality Municipality of Metropolitan Seattle.Seattle, WA.
Lawrence, A.I., Marsalek, J. J., Ellis, B., and Urbonas, B. (1996). “Stormwater detention& BMPs.” Journal of Hydraulic Research, 34:799-813.
Maristany, A. E. (1993). “Long-term performance of wet detention ponds.” WaterManagement in the ‘90s: a time for innovation: proceedings of the 20th anniversaryconference, ASCE, Seattle, WA, 138-141.
Marsalek, J. (1990). “Evaluation of pollutant loads from urban nonpoint sources.” WaterScience and Technology, 22(10/11): 23-30.
Schueler T. R. (1996). “Irreducible Pollutant Concentrations Discharged From UrbanBMPs” Watershed Protection Techniques, 2:369-372.

23
Standard Methods for the Examination of Water and Wastewater. 19th Ed. (1995).Published jointly by American Public Health Association (APHA), American WaterWorks Association (AWWA), Water Environment Federation (WEF), WashingtonD.C.
Stanley, D. W. (1996). “Pollutant removal by a stormwater dry detention pond.” WaterEnvironment Research, 68:1076.
U. S. Environmental Protection Agency (EPA). (1990). “Recommended Protocols forMeasuring Conventional Water Quality Variables and Metals in Fresh Water of thePuget Sound Region.” Prepared by Tetra Tech, Inc., Bellevue, WA for the U.S. EPARegion X Office if Puget Sound, Seattle WA.
Van Buren, W.A., Watt, W.E., and Marsalek, J. (1997). “Application of the Log-Normaland Normal Distributions to Stormwater Quality Parameters.” Water Resources,31:95-104.
Walker, W. W. Jr. (1987). “Phosphorus removal by urban runoff detention basins.” LakeReservoir Management, 3:314-328.
Washington State Department of Ecology (Ecology). (1992). Stormwater ManagementManual for the Puget Sound Basin. Olympia, WA.
Welch, E. B. (1992). Ecological Effects of Wastewater, 2nd Edition. Chapman & Hall,New York, NY.
Whipple, W. Jr. (1979). “Dual-Purpose Detention Basins.” Journal of the WaterResources Planning and Management Division, ASCE, 105:402-423.
Whipple,W. Jr., and Hunter, J. V. (1981). “Settleability of Urban Runoff Pollution.”Journal of the Water Pollution Control Federation, 53:451-464.
Wu, J. S., Holman, R.E., and Dorney, J.R. (1996). “Systematic Evaluation of PollutantRemoval by Urban Wet Detention Ponds.” Journal of Environmental Engineering,122:983-988.